 Yizhi Zhou*
 Yiming Li
- College of Architecture and Urban Planning, Tongji University, Shanghai, China
In the traditional feudalistic society of China, there is a characteristic residential pattern of several core families with common ancestors living together in one house, as far as possible. Hence, the habitation of large families and their social dynamic always have a complex function and hierarchical structure. In this article, we consider a courtyard in South China as an example to enable a discussion of the mathematical relationship among the five basic functional spaces in it. Based on Zipf’s law, we find that the distribution of the five types of spaces, from large to small, can be described by the Pareto distribution with a shape parameter close to −1. Moreover, the Zipf parameters of different houses in the same area conform to the double Pareto distribution. This suggests that the size and shape of a residence also follows well-defined scaling laws. Additionally, it indicates that houses, at least traditional Chinese houses, have strong self-organization and self-similarity. It also shows that the power law of the Pareto distribution is applicable not only to the macro scale of the city but also the micro scale of housing.
Introduction
The complex system of society-economy-culture was regarded as disordered and chaotic in the past. However, from the 20th century, the rules hidden behind human “free will” are gradually being discovered. Among them, Zipf’s law is a good example that is used to explore the laws behind complex systems. It originated from the study of word frequency by linguists (Zipf, 1949) and is widely used in linguistics, geography, economics, information science, and other fields. In the past few decades, in dozens of studies, researchers have found that spatial scale problems in geography can be explained by Zipf’s law (Atkinson and Tate, 2000; Mu, 2013; Kabanov, 2019). Furthermore, the relationship between city size and city ranks also complies with power laws (Krugman, 1996; Batty, 2006; Chen and Zhou, 2008). The city size distribution within an area and at any point in time can be described by the Pareto distribution with a shape parameter equal to −1 (Modica et al., 2017; Jiang and Ren, 2019). Cities are gradually being considered not as disordered systems but as networks that are “emergent, far from equilibrium, requiring enormous energies to maintain themselves, displaying patterns of inequality spawned through agglomeration and intense competition for space, and saturated flow systems that use capacity in what appear to be barely sustainable but paradoxically resilient networks” (Batty, 2008). Simultaneously, physicists also consider all types of “scaling hierarchy” phenomena in nature or human society as research objects, and construct the power-law relationship behind the concept of “scale” (Blank and Solomon, 2000; Chen, 2015) and “social dynamic” (Newman et al., 2005; Castellano et al., 2009) in theory.
We found that the residential space, which is the most important basic element of a city, is also a highly self-organized and self-similar complex system. In terms of the form and constituent elements, a house is much simpler than a city. However, because of this simplicity, houses are presented in various forms, which makes it difficult to define them as orderly and stereotyped. Therefore, we discuss whether Zipf’s law, which is established at the macro and meso scales of human settlements, is also established at the micro level of housing to explore the deep mechanism of the urban system from the level of “basic particles.”
In Jiangnan area (south of the Yangtze River) of China, traditional life is carried out in large families. A large family includes multiple nuclear families with direct blood ties, and relies on egalitarian inheritance to maintain this consanguinity. Therefore, a large courtyard house came into being. This large courtyard house is different from the modern house or traditional courtyard house in North China. Because of living together in one courtyard house, there are hierarchical differences among patriarchs, elders and younger generations. This hierarchy is clear and simple, and it is directly projected onto the living space, which is easy to be observed. Living is not only a cultural behaviour, but also an economic behaviour, particularly for common people (not aristocrats or bureaucrats). The scale of different functional spaces is an economic factor that must be considered when building or purchasing houses. As a result, the size of a residential space should have strong regularity. Several studies have been conducted on the room size of Neolithic, Hellenistic, and Roman sites in the near east. They all imply that there is a special distribution of the size of the rooms on the same house level (Benech, 2010; Brami et al., 2015). In the present study, we find that there is a strong regularity of the scale-rank between each room of the house, and also between different houses, which conforms to the power law. This is of great importance to social research, economic research, and urban research because housing is a measurable man-made entity on which the social, economic, and cultural state of each era in history can be recorded.
Methodologically speaking, we regress the room area sequence of each house and obtain the value of index by fitting the power function curve. And regress the curve index sequence of all houses in a traditional settlement by fitting another power function curve as the second step. Although the house itself is limited by its size, it can hardly arrive to any effective conclusion by a scaling analysis with a few room sizes in one house that do not span multiple order of magnitudes. By the statistics of all the houses in a settlement, it shows the law of scale distribution. It was found that there is a power-law distribution of scale, both between the rooms within a single house and between different houses in a settlement, which suggests an interesting spatial structure and social interaction in class society. And this spatial structure has strong self-organization and self-similarity.
Hierarchy of a traditional Chinese courtyard residential space
A characteristic of traditional Chinese housing (from the 15th to early 20th century) is that the living space consist of dozens of people to live together. Because of the differences in the status of family members and the various needs of rituals and customs formed under Confucianism, this form of house, that is, multiple nuclear families living in the same house simultaneously, makes the hierarchies and functions of the rooms in the house and circulations of the family members different. As a result, a complex spatial system is formed in every house.
In this article, we consider traditional courtyard houses in South China as an example. As the research object, we selected Haimen Town and Jiazhi Town, which are two main historical zones in Jiaojiang District, Taizhou City, on the eastern coast of Zhejiang Province. We measured 110 traditional courtyard houses and 82 traditional houses without courtyards (Figure 1). In addition, we measured another13 traditional courtyard houses with very similar plane and function, which contains 6 cases in rural Taizhou area and 7 cases in Zunyi, Guizhou (also in South China but far away from Zhejiang) as comparative samples.
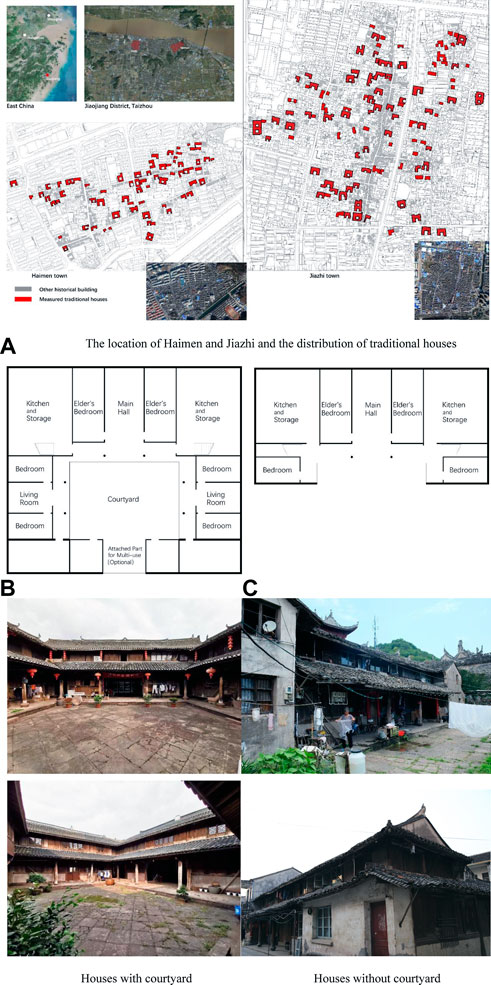
FIGURE 1. Introduction of cases involved in this article. [(A) The site maps are from Urban Planning Bureau of Jiaojiang District (2017). The satellite imageries are from Esri (2021) World Imagery Wayback. https://livingatlas.arcgis.com/wayback/ (Accessed Oct. 1, 2021)]. The location of Haimen and Jiazhi and the distribution of traditional houses. (B) Houses with courtyard (C) Houses without courtyard.
For traditional courtyard houses in this area, the owners are generally powerful local landlords, businesspeople, other property owners, and rich self-employed peasants; that is, the traditional courtyard house is the housing mode of the middle class. Generally, a traditional courtyard house in southern China has buildings to the east, west, and north. (Figure 1B). The main building has three main rooms that face south. The hall at the centre is where all types of rituals are performed. The rooms on both sides are used as the elder’s bedrooms. This type of living space is described as “one bright and two dark” in Chinese, which means the living room is open and bright, and enclosed by two private and dark bedrooms. The two wings, that is, the houses on both sides of the main house, also use the form of “one bright and two dark,” and they are the bedrooms and living rooms of later generations. The house has a strong symmetrical axis. Thus, with the courtyard at the centre of the entire house, there are five functional spaces: the courtyard, hall, elder’s bedrooms, living rooms, and other family members’ bedrooms. Because of their uncertain size, we do not discuss rooms such as the kitchen and storage space in this article. The five types of space have different levels, which are reflected in the number of users; degree of spatial openness, that is, the level of privacy; and the definition of spatial status in traditional customs.
Houses without courtyard and side wings are generally owned by ordinary people, which only have hall, elder’s bedrooms and other bedrooms in one main building (Figure 1C). Because of the inferior quality in material, construction, maintenance, a large number of these houses are easier to be rebuilt into modern houses than courtyard houses.
People in the deprived class cannot afford large houses, and generally build simple shacks in the suburbs or rent in other types of houses. At present, their living space has been completely impossible to verify. Therefore, it is beyond the scope of this article.
However, it should also be noted that there is also a gap between the rich and the poor among different nuclear families in one house, so deprived families will also live in large courtyard houses. Moreover, in the process of inheritance, the social level of residents will also change. As a result, the number of courtyard houses is much higher than that of the affluent population.
If we arrange the five types of space from large to small, that is, the courtyard, main hall (family living room), halls of the two wings (living room for the young generation), elder’s bedrooms and juniors’ bedrooms (Figure 2), we find that the sequence distribution of each room size represents the state of the power function distribution.

FIGURE 2. The ideal layout of traditional courtyard house in South China.
Generally, it is composed of a main house and two wings. Of course, there is also an atypical form of courtyard surrounded by L-shaped houses, which lacking a wing. It can be found that some houses have stairs leading to the second floor, the rooms on the second floor are also mainly storages originally. There are five important living spaces of traditional courtyard house in South China. S1 to S5 are the courtyard, main hall, halls of the two wings, elder’s bedroom and juniors’ bedrooms respectively. It should be emphasized that there is a colonnade surrounding the inner courtyard in traditional Chinese courtyard houses. Because the colonnade space is as public as the hall and living space, unlike the bedroom space with wood floor, the areas of S2 and S3 mentioned later are the sum of the hall and colonnade.
The famous Zipf’s law is related to a power function. Zipf’s law indicates that the product of word frequency and the frequency sequence of human language is a constant. It was gradually described as
where P is some quantity and r is a constant. Later, a two-parameter expression was proposed. An exponential parameter was added to the sequence r, which is Zipf’s value. Urban researchers further discussed the index q. (Chen, 2016) Therefore, we adopt the following two-parameter model of Zipf’s law:
where
To determine the mechanism of the self-organization model that satisfies Zipf’s law, a study was conducted on the relationship between self-organization and the sample space reduction (SSR) process from the perspective of a random walk (Corominas-Murtraa et al., 2015; Corominas-Murtra et al., 2016). The SSR process is used to simulate the probability that different rooms in a house are used in daily life. The more public (with more people and more functions) the room, the more frequently it is used, and the larger the area, the higher the use frequency of the room that it should be. The main feature of the SSR process is that the sample space is reduced step by step in a nested manner. After many iterations, the occupation distribution follows Zipf’s law. The SSR process can be related to random walks on a directed network (Markov chain), as shown Figure 3. We start the process from a start node, from which we can reach any one of N nodes with a probability of 1/N. Regardless of which node we finally arrive at, we can reach a node that is connected to a lower number of nodes continuously until we reach the node that is connected to S1 nodes. Then, we jump to the exit node to end the process. According to a previous study (Brami et al., 2015), the expected distribution follows Zipf’s law exactly.
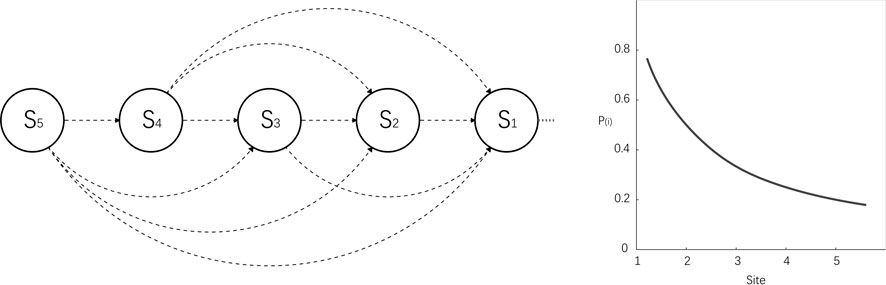
FIGURE 3. The mechanism of SSR process in traditional houses.
In the space of a traditional Chinese courtyard, we can find that the five spaces from S1 to S5 correspond to five types of members: M5 (general family members), M4 (elders), M3 (relatives not living in the house), M2 (guests), and M1 (outsiders). The activities of each type of member in each space are not the same (Table 1); that is, different functions of the rooms make the number of users (sample space) different; hence, the SSR process can be used to simulate the frequency of use in each room over a period of time. For example, M5 needs to use all the space in the house, whereas M2 can only be active in S1 and S2. This indicates the difference between rooms of spatial openness (qualitative) in the traditional residence. By contrast, ideally, activity patterns in traditional courtyard houses can be simulated as the process by which agent M (j) randomly moves from any S(i) to the exit S1. When the agent reaches level S1, the process stops and repeats. The sample space is reduced step by step in a nested manner. After several iterations, the probability of M (j) appearing in S (i) is

TABLE 1. Traditional activities in every node for different members.
Additionally, the occupation properties of every S(i) satisfy
The results are presented in Table 2, which shows that the mechanism of spatial self-organization in traditional Chinese courtyard houses is in accordance with Zipf’s law (Figure 3); that is, the distribution of frequency of use in different rooms satisfies the power-law distribution. As a result, the higher the frequency of use, the larger the size of those rooms. The ideal frequency sequence of rooms in courtyard houses simply satisfies Zipf’s law. We consider that room size is probably determined by the frequency of space use. This can theoretically explain why the room size satisfies Zipf’s law. Therefore, we can propose the hypothesis that the scale of residential houses with different levels of space should conform to the power-law distribution ideally. A similar conclusion can be found in the scale study of the Neolithic residence in Anatolia by Brami. In this case, the area ratio of large rooms with more ritual and public activities to private rooms is 4:1 (Brami et al., 2015).
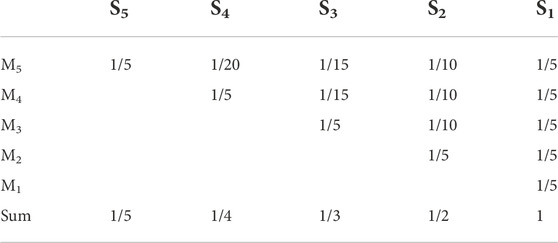
TABLE 2. Occupation properties of every node.
Agent M (j) randomly moves from any S (i) that can appear to exit S1. When it reaches level S1 (the main entrance of the house), the process stops and repeats. The sample space is reduced step by step in a nested manner (left). After several iterations, the occupancy distribution (probability of occurrence at each node) follows Zipf’s Law (right).
Meanwhile, we need to examine whether the power-law distribution is the best model for fitting the room sizes. We selected three types of two-parameter models: the logarithmic function, power function, and exponential function. The fitting shows that the power and exponential functions can both fit the room sizes equally well (Figure 4).
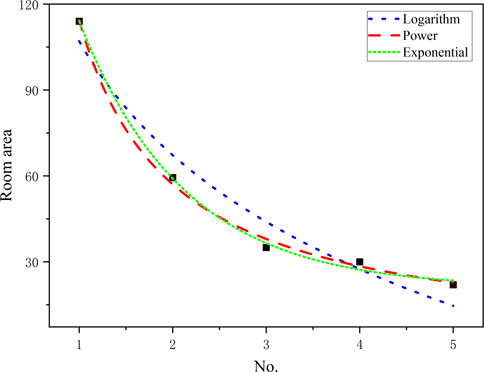
FIGURE 4. Take one case for example to fit three types of two-parameter models: logarithm (
For a detailed analysis of the exponential distribution and power-law distribution, we used 123 cases of traditional courtyard houses to fit the exponential and power-law curves individually. The statistics of both
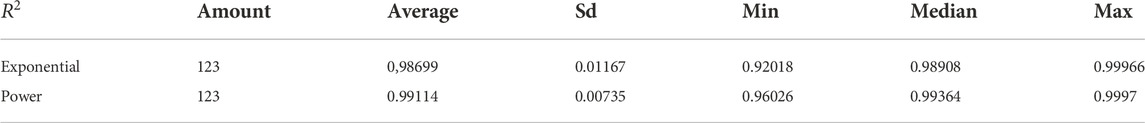
TABLE 3. Error analysis for power and exponential fit of 123 cases.
According to Zipf’s law, we can regress the room area sequence of each house and obtain the value of q by fitting the curve. We fit the power function curve, and the q values obtained are shown in Table 2. We found that q∈ [1,1.4]. This demonstrates that the size of the main rooms in traditional Chinese houses has strong regularity, which is very close to the basic expression 2) of Zipf’s law.
Scale of traditional courtyard houses
After obtaining the q value of each object, we further compared the value differences between different objects. We found that the q value quantifies the hierarchy of rooms in the house. We calculated the q values of 205 cases in South China (Table 4).
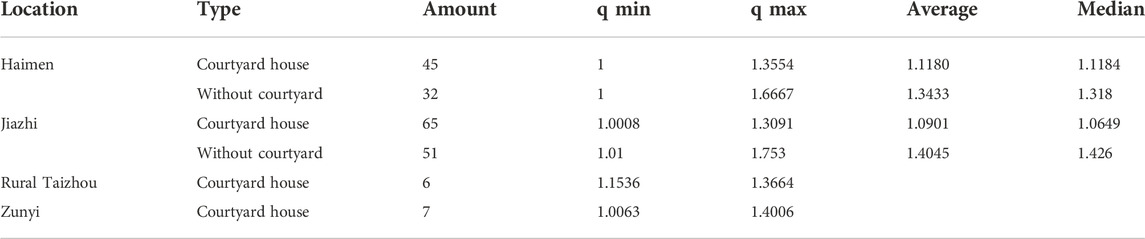
TABLE 4. the q values of 205 cases in South China.
From the previous analysis, when q = 1, the size distribution of different rooms is consistent with the distribution of their functions and using frequency. The premise is that individuals spend an equal amount of time performing various functional activities in their daily lives. As their economic or social status improves, they have to spend more time addressing social affairs. This leads to the increasing demand for larger ritual and public spaces. Thus, the size of the public space increases and the q value fluctuates. From another point of view, when q = 1, the status of each room in the house and the members living in the room are equal, whereas an increase of the q value indicates that the proportion of public space and the householder’s residential space has increased. This shows the inequality between the householder and other members of the family.
Therefore, the q value can be used to measure the hierarchy of residential buildings and settlements. First, in terms of individual houses, the q value should have a relationship with the overall residential area. However, in the current cases in this article, there is less relationship between q and overall residential area (Figure 5). Generally, the larger the land, the greater the wealth of the house owner. Thus, the q value is probably not a direct reflection of the socio-economic status of houses, but a symbol that measures the hierarchy and inequality of the inner space in houses. The blank area in the upper right corner of Figure 5 shows that houses with high q values tend to cover a smaller area, which may indicate that small houses result in increased social inequality.

FIGURE 5. Relationship between q and the size of the courtyard houses.
Comparing the data of Table 4, we found that:
1 The q value is essentially stable in the range [1,1.8] and that of all cases will not be less than 1.
2 The q values of courtyard houses are generally smaller than those of houses without courtyard.
3 The gap between urban and rural areas is not large.
This also implies that the q value is not a direct reflection of economic conditions, but a measure of inequality in the system. The better the economic condition is, the higher the social status is, the house tends to be more inclined to a reasonable and equal space distribution (that is, the q value tends to 1).
Hypothesis of the double Pareto lognormal distribution
In the previous section, we qualitatively discussed the relationship between the q value and residential levels (in various senses). Following scholars’ discussions on the scale-rank of cities (Blank and Solomon, 2000; Corominas-Murtraa et al., 2015; Corominas-Murtra et al., 2016), we found that data from natural cities, such as area and population in a certain region, are all related to the position of cities in the scale sequence. In the study of urban scale, the size of a city can directly reflect the level of urban development because a city can constantly annex the surrounding rural areas to achieve continuous expansion; hence, the distribution of the city size conforms to the power law. However, in some dense metropolitan areas, because of the restriction of neighbouring cities, it is difficult for the urban scale distribution to conform to the power law.
Similarly, it should be meaningful to study the relationship between the scale and arrangement of traditional courtyard houses. However, the scale of residential space is affected by social background and the built environment. Meanwhile, the price of land, materials, and labour fluctuates greatly throughout the ages, which makes it impossible to measure the scale level of the micro scale using area only. Yet, we found that the scales of the functional components of southern Chinese courtyard houses also have a power-law relationship with the level (privacy). Moreover, the changing index parameter q is directly related to hierarchy. Thus, we can use the Zipf index q for statistical analysis to further quantify the rank-scale relationship of houses.
In this article, we focus on two historical areas in Jiaojiang District of Taizhou City: Haimen and Jiazhi. We calculated the data of the residential area size and q value of all existing traditional courtyard houses (110 houses). Considering the distribution of the residential size and Zipf index q separately (Figure 6), we found that the size is close to the normal distribution, whereas the q value is close to the Pareto distribution.
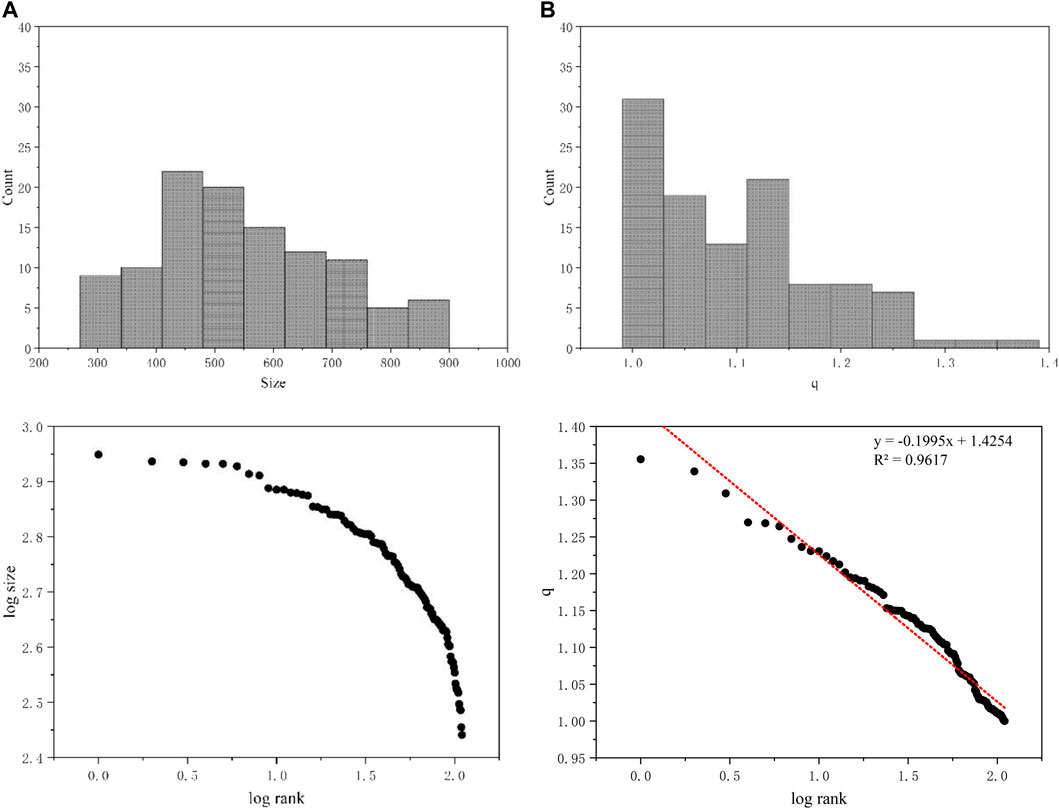
FIGURE 6. Density and rank-scale plot of the size (ground floor area) (A) and q value (B) of 110 courtyard houses in Haimen and Jiazhi.
While adding 82 cases of houses without courtyard (most of them cannot measure their floor area, so only the q value is calculated), we find that the Pareto distribution in the range of q∈[1,1.4]performs better. While the distribution will deviate when q > 1.4, because ordinary houses are not as easy to preserve as courtyard houses (Figure 7).
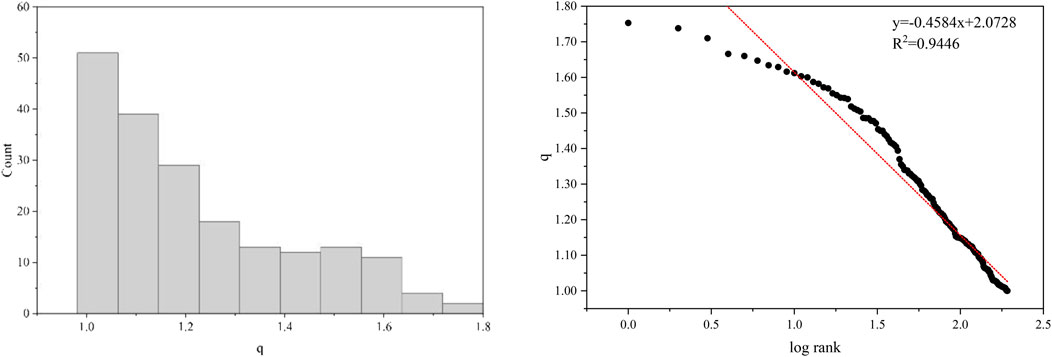
FIGURE 7. q value of all 192 cases of traditional houses in Haimen and Jiazhi.
Further investigation showed that the complementary cumulative distribution function (CCDF) curve of the q value is not strictly a straight line. It has a turning point when q = 1.1. We fit the log-log plots of the CCDF to a lognormal distribution (R2 = 0.933), Pareto distribution (R2 = 0.945), and double Pareto lognormal distribution (R2 = 0.996). Figure 8 shows that the CCDF curve of q value is closest to the double Pareto distribution.
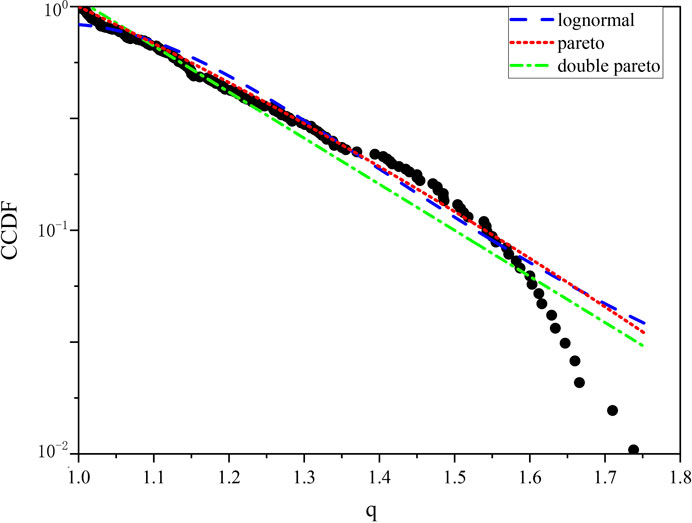
FIGURE 8. In the log-log figure of CCDF and q value, the curve presents Pareto distribution in the tails, and lognormal distribution in the middle.
Housing scale is inevitably related to social and economic problems. It is also related to the population growth model, economic growth, and wealth accumulation model, human interaction activity, and social and cultural traditions. As a result, house scale becomes a highly complex system. In a large number of studies, researchers found that the city size distribution is influenced by many factors. In the United States and Europe, the city size distribution is represented by the Pareto distribution (Jiang and Jia, 2011; Chen, 2016; González-Val, 2020), whereas in India, China, and Japan, the distribution shows a transition from a lognormal distribution in the early periods to Pareto in later periods (Kuninaka and Matsushita, 2008; Luckstead and Devadoss, 2014; Li and Zhang, 2018). In recent years, research has been more in-depth; researchers have discussed the urban size from a mixture of a lognormal distribution and Pareto distribution (Luckstead et al., 2017; Băncescu et al., 2019).
The situation of housing is similar to and more complex than that of cities. The size of a residential area depends on the land transaction. The distribution is closer to the lognormal distribution than other expressions because it is not related to the current land scale. The q value is a standard measure of the hierarchy within houses, in addition to a reflection of polarization. It is close to the power-law distribution. The land size of residential buildings is not likely to change a great deal after the completion of buildings. However, the size of different rooms can be easily changed with the continuous change of buildings by reconstruction. Additionally, the q value also changes. Therefore, the actual situation is likely to be that the initial state of a random variable with a lognormal distribution will expands into the double Pareto lognormal distribution after the continuous development of inequality.
Additionally, the distribution relationship between the q value and the sequence of q is also a self-organized critical model (critical phenomena and related concepts of self-organized criticality), either because we adjust the system to a special critical point in its parameter space or because the system automatically drives itself to this point through a certain dynamic process. Divergence causes the system to have no appropriate scale factor to set the size of a measurement. As Newman stated, the quantity must follow the power law (Newman, 2005). Meanwhile, the above-mentioned SSR process can explain the mechanism behind the phenomenon of self-organization in courtyard houses. In the study of residential scale, the allocation of the room area is the ideal state of economic rationality when q = 1. Various socio-economic-cultural factors produce hierarchy differences and aggravate inequality. Thus, the q value increases.
Significance of the Pareto distribution in traditional residential space
First, in terms of the room area distribution, the traditional courtyard houses in South China presents a strong feature of self-organization, that is, its spatial scale and sequence show a power-law relationship. Additionally, the approach used to reduce the different function spaces step by step makes the traditional living space completely consistent with the SSR process. This makes the occupation properties follow Zipf’s law exactly. This order is consistent with the openness of room functions, which may be related to the activity density of people. This indicates that the residential space is not arbitrarily shaped by people’s free will, but is strongly controlled by economic, functional, or other factors. Although we cannot discuss these control parameters further in this article.
Second, the q value of different houses can be regarded as an important scale. This is directly reflected in the area of residential buildings in the same land use area (the larger the q value, the smaller the actual building area, and the lower the investment). Simultaneously, the q value can also indicate that the scale difference between public spaces (courtyards and halls) is small but the difference between private spaces (bedrooms) is large Hence, the q value can meet the requirements of the sociality of public space (the size of courtyards and halls are similar) and the economy of the living space (the size of bedrooms is quite different). The distribution of q value well proves the self-organization of residential space, which is a novel research result.
Third, there is also a quantitative relationship between the q value and the sequence of q values among different houses. The linear relationship between the q value as an index and the natural logarithm of the q value sequence shows that the scale and scale sequence among different houses also conform to the power-law distribution, more precisely, conform to the double Pareto lognormal distribution. However, we note that to obtain a more accurate quantitative analysis, we require more data of houses located in different settlements. However, it is sufficient to find that there is strong self-similarity between different houses, and this distribution relationship can be regarded as a typical self-organized critical model.
Finally, the traditional house in South China represents a life with large families living together which means people of different status produce hierarchy in commensurable size of living space. Through the scaling of traditional living space by the q value, we can indirectly measure the hierarchical relationship of the family and even the whole society, and evaluate the social inequality.
Limitations:First, the limited sample size and area of the study call for more field mapping and investigation, which will be the focus of continued research in the coming years. Secondly, the response of traditional space to future design of housing needs to be further discussed, and the impact of this spatial hierarchy on modern design is limited, and whether it will be valuable at present needs further research. Finally, although there are abundant spatial scale differences in courtyard housing, functional fitting with small number of points and not spanning multiple order of magnitudes are still insufficient. It may be necessary to collect a couple of orders of magnitudes of spanning in the data include the size of open spaces in the settlement.
Conclusion
Based on the quantitative analysis of the spatial scale of each residential function in traditional courtyard houses in South China, we can draw the following conclusions: we verified the results of quantitative analysis with the existing conclusions of cultural research, which demonstrates that the size of the traditional courtyard houses is closely related to its function and openness. Residential space meets its social-economic-cultural needs through self-similarity and self-organization.
The distribution of the spatial scale in traditional courtyard houses in South China accords with Zipf’s law. The Zipf’s value is approximately 1. Additionally, the larger the value, the more serious the inequality within the house. Meanwhile, the double Pareto lognormal relationship exists among the Zipf index. This shows that the scale level between buildings also satisfies Zipf’s law.
To summarize, both the internal spatial organization and scale sequence between separate units in traditional courtyard houses of South China satisfy the long tail distribution rule of Zipf’s law. This shows that these traditional buildings have self-organization and self-similarity. Additionally, it also indicates that the power law of the long tail distribution is applicable not only to the macro scale of the city, but also the micro scale of housing.
And we believe that the direct impact on the scale is the use of space. More use means higher openness and leads to larger size. Although there is no such spatial hierarchy in modern housing, diversity of public space in modern cities may also show the same scaling law. If so, we can evaluate the social inequality or the degree of economic and social development through the measurement and statistics of public spaces.
Data availability statement
The raw data supporting the conclusion of this article will be made available by the authors, without undue reservation.
Author contributions
YZ: conceptualization, investigation, analysis of data, methodology, writing YL: acquisition of data, mapping, validation.
Funding
This research is supported by the National Natural ScienceFoundation of China (grant number 51738008, 51708413).
Acknowledgments
We thank the government of Jiaojiang District, Taizhou City, Zhejiang Province for their help and support for building surveying and mapping. We thank Liwen Bianji (Edanz) (www.liwenbianji.cn/), for editing the English text of a draft of this manuscript.
Conflict of interest
The authors declare that the research was conducted in the absence of any commercial or financial relationships that could be construed as a potential conflict of interest.
Publisher’s note
All claims expressed in this article are solely those of the authors and do not necessarily represent those of their affiliated organizations, or those of the publisher, the editors and the reviewers. Any product that may be evaluated in this article, or claim that may be made by its manufacturer, is not guaranteed or endorsed by the publisher.
References
Atkinson, P. M., and Tate, N. J. (2000). Spatial scale problems and geostatistical solutions: A review. Prof. Geogr. 52 (4), 607–623. doi:10.1111/0033-0124.00250
Băncescu, Irina, Chivu, Luminiţa, Preda, V., Puente-Ajovín, Miguel, and Ramos, A. (2019). Comparisons of log-normal mixture and pareto tails, gb2 or log-normal body of Romania's all cities size distribution. Phys. A Stat. Mech. Its Appl.
Batty, M. (2008). The size, scale, and shape of cities. Science 319, 769–771. doi:10.1126/science.1151419
Benech, C. (2010). New approach to the study of city planning and domestic dwellings in the ancient Near East. Archaeol. Prospect. 14 (2), 87–103. doi:10.1002/arp.306
Blank, A., and Solomon, S. (2000). Power laws in cities population, financial markets and internet sites (scaling in systems with a variable number of components). Phys. A Stat. Mech. its Appl. 287, 279–288. doi:10.1016/s0378-4371(00)00464-7
Brami, M. N., Horejs, B., and Ostmann, F. (2015). Stara zagora Upscaling+ the neolithic house. Trends in house size and function in Anatolia and the southern balkans. Prehistoric houses in the balkans: Profane and sacred contexts. (sixth to fifth millennium BC).
Castellano, C., Fortunato, S., and Loreto, V. (2009). Statistical physics of social dynamics. Rev. Mod. Phys. 81, 591–646. doi:10.1103/revmodphys.81.591
Chen, Y. (2015). Power-law distributions based on exponential distributions: Latent scaling, spurious Zipf’s law, and fractal rabbits. Fractals 23 (2), 1550009. doi:10.1142/s0218348x15500097
Chen, Y. (2016). The evolution of Zipf’s law indicative of city development. Phys. A Stat. Mech. its Appl. 443, 555–567. doi:10.1016/j.physa.2015.09.083
Chen, Y., and Zhou, Y. (2008). Scaling laws and indications of self-organized criticality in urban systems. Chaos, Solit. Fractals 35 (1), 85–98. doi:10.1016/j.chaos.2006.05.018
Corominas-Murtra, B., Hanel, R., and Thurner, S. (2016). Extreme robustness of scaling in sample space reducing processes explains Zipf’s law in diffusion on directed networks. New J. Phys. 18, 093010. doi:10.1088/1367-2630/18/9/093010
Corominas-Murtraa, B., Hanela, R., and Thurnera, S. (2015). Understanding scaling through history-dependent processes with collapsing sample space. Proc. Natl. Acad. Sci. U. S. A. 112 (17), 5348–5353. doi:10.1073/pnas.1420946112
González-Val, Rafael. (2020). The Spanish spatial city size distribution. Environ. Plan. B Urban Anal. City Sci. 48, 1609–1631. doi:10.1177/2399808320941860
Jiang, B., and Jia, T. (2011). Zipf’s law for all the natural cities in the United States: A geospatial perspective. Int. J. Geogr. Inf. Sci. 25 (8), 1269–1281. doi:10.1080/13658816.2010.510801
Jiang, B., and Ren, Z. (2019). Geographic space as a living structure for predicting human activities using big data. Int. J. Geogr. Inf. Sci. 33 (4), 764–779. doi:10.1080/13658816.2018.1427754
Kabanov, V. N. (2019). Territorial planning and Zipf’s law. Econ. Soc. Changes Facts, Trends, Forecast 12 (2), 103–114.
Krugman, P. (1996). Confronting the mystery of urban hierarchy. J. Jpn. Int. Econ. 10, 399–418. doi:10.1006/jjie.1996.0023
Kuninaka, H., and Matsushita, M. (2008). Why does zipf's law break down in rank-size distribution of cities? J. Phys. Soc. Jpn. 77 (11), 114801–1–114801–6. doi:10.1143/jpsj.77.114801
Li, W., and Zhang, Y. (2018). Triangle law or power law? City size distribution in sub-national levelled administrative areas in China. IRSPSD. Int. 6 (3), 203–215. doi:10.14246/irspsda.6.3_203
Luckstead, J., Devadoss, S., and Danforth, D. (2017). The size distributions of all Indian cities. Phys. A Stat. Mech. its Appl. 474, 237–249. doi:10.1016/j.physa.2017.01.065
Luckstead, J., and Devadoss, S. (2014). A comparison of city size distributions for China and India from 1950 to 2010. Econ. Lett. 124 (2), 290–295. doi:10.1016/j.econlet.2014.06.002
Modica, M., Reggiani, A., and Nijkamp, P. (2017). Methodological advances in gibrat’s and Zipf’s laws: A comparative empirical study on the evolution of urban systems. Socioecon. Environ. Policies Eval. Regional Sci. 24, 37–59.
Mu, L. (2013). From zipf's law to hypsometry: Seeking the ‘signature’ of elevation distribution. Int. J. Geogr. Inf. Sci. 27 (7), 1312–1328. doi:10.1080/13658816.2012.721887
Newman, M., Barabasi, A. L., and Watts, D. J. (2005). The structure and dynamics of networks. Princeton, NJ: Princeton Univ. Press.
Newman, M. E. J. (2005). Power laws, Pareto distributions and Zipf’s law. Contemp. Phys. 46 (5), 323–351. doi:10.1080/00107510500052444
Keywords: urban morphology, zipf’s law, pareto distribution, scaling of living space, self-organization
Citation: Zhou Y and Li Y (2022) Scaling the living space: Zipf’s law for traditional courtyard houses in South China. Front. Built Environ. 8:901776. doi: 10.3389/fbuil.2022.901776
Received: 22 March 2022; Accepted: 23 November 2022;
Published: 05 December 2022.
Edited by:
Stephen Law, University College London, United KingdomReviewed by:
Shenjun Yao, East China Normal University, ChinaMahua Mukherjee, Indian Institute of Technology Roorkee, India
Copyright © 2022 Zhou and Li. This is an open-access article distributed under the terms of the Creative Commons Attribution License (CC BY). The use, distribution or reproduction in other forums is permitted, provided the original author(s) and the copyright owner(s) are credited and that the original publication in this journal is cited, in accordance with accepted academic practice. No use, distribution or reproduction is permitted which does not comply with these terms.
*Correspondence: Yizhi Zhou, emhvdXlpemhpaGlzdG9yeUBob3RtYWlsLmNvbSYjeDAyMDBhOw==