 Silvia Meschini1*
 Laura Pellegrini1
 Mirko Locatelli1
 Daniele Accardo2
 Lavinia Chiara Tagliabue3
 Giuseppe Martino Di Giuda2
 Marco Avena4
- 1Department of Architecture, Built Environment and Construction Engineering, Politecnico di Milano, Milan, Italy
- 2Department of Management, University of Turin, Turin, Italy
- 3Department of Computer Science, University of Turin, Turin, Italy
- 4Department of Architecture and Design, Politecnico di Torino, Torino, Italy
The integrated use of building information modeling (BIM) and geographic information system (GIS) is promising for the development of asset management systems (AMSs) for operation and maintenance (O&M) in smart university campuses. The combination of BIM-GIS with cognitive digital twins (CDTs) can further facilitate the management of complex systems such as university building stock. CDTs enable buildings to behave as autonomous entities, dynamically reacting to environmental changes. Timely decisions based on the actual conditions of buildings and surroundings can be provided, both in emergency scenarios or when optimized and adaptive performances are required. The research aims to develop a BIM-GIS-based AMS for improving user experience and enabling the optimal use of resources in the O&M phase of an Italian university. Campuses are complex assets, mainly diffused with buildings spread across the territory, managed with still document-based and fragmented databases handled by several subjects. This results in incomplete and asymmetrical information, often leading to ineffective and untimely decisions. The paper presents a methodology for the development of a BIM-GIS web-based platform (i.e., AMS-app) providing the real-time visualization of the asset in an interactive 3D map connected to analytical dashboards for management support. Two buildings of the University of Turin are adopted as demonstrators, illustrating the development of an easily accessible, centralized database by integrating spatial and functional data, useful also to develop future CDTs. As a first attempt to show the AMS app potential, crowd simulations have been conducted to understand the buildings’ actual level of safety in case of fire emergency and demonstrate how CDTs could improve it. The identification of data needed, also gathered through the future implementation of suitable sensors and Internet of Things networks, is the core issue together with the definition of effective asset visualization and monitoring methods. Future developments will explore the integration of artificial intelligence and immersive technologies to enable space use optimization and real-time wayfinding during evacuation, exploiting digital tools to alert and drive users or authorities for safety improvement. The ability to easily optimize the paths with respect to the actual occupancy and conditions of both the asset and surroundings will be enabled.
1 Introduction
Recently, several universities borrowed the smart city concept at the campus scale in the aim of defining innovative digital AMS to provide more satisfactory user experience, in addition to an optimal and more resilient use of resources during the low digitalized and investigated O&M phase (Lu Q. et al., 2020; Moretti et al., 2021; Ward et al., 2021; Qiuchen Lu et al., 2019).
Indeed, BIM-GIS integration (i.e., GeoBIM) is promising for the development of smart campuses and digital twins (Zaballos et al., 2020) aimed at simulating building behavior in the actual conditions of both the surrounding and interior environment, providing prompt decisions through contextualized data. The GeoBIM approach provides several advantages particularly when applied together with Internet of Things (IoT) networks and artificial intelligence (AI) systems with the aim of developing cognitive digital twins (CDTs), that is, buildings with cognitive functions able to autonomously and dynamically react to environmental changes. The dynamic, resilient, and heterogeneous nature of CDTs could be the solution for the management of complex and variable systems, such as large and diffused university assets, scattered on the territory. CDTs can be developed starting from DT and then providing them with cognitive functions using AI systems (Yitmen et al., 2021). Nevertheless, this is possible only if a centralized, accessible, scalable, and well-structured database is available (Villegas-Ch et al., 2019; Deng et al., 2021). Thus, data structuring through a holistic information management (IM) approach is key and represents the focus of the first phase of the present research.
The research tackles the development of an AMS app, based on BIM–GIS integration, for the O&M phase of the University of Turin (i.e., UniTO), chosen as a pilot case. Its vast building stock is scattered through the territory of Turin and its surroundings, representing one of the largest, diffused Italian campuses with a huge catchment area. Nonetheless, its management system is still fragmented and poorly digitalized, entailing a strong information asymmetry among stakeholders which prevents the exact awareness of its consistency and use. In the last academic year, despite the pandemic in progress, 80,856 students enrolled at UniTO, with a growing rate of around 4% in the last 5 years. Also considering teaching, administrative, and technical staff, it represents the management of a small town with a high level of complexity. It was estimated that the yearly management expense would amount to 40 million euros; thus, even a little improvement can provide significant savings.
In particular, the research has two main purposes. The short-term goal is to provide administrators with awareness about the actual UniTO asset consistency and distribution through a digital AMS providing both spatial and functional attributes with the aim of optimizing space occupancy and resources use. The long-term goal concerns the development of a smart campus through interconnected CDTs aimed at several purposes (i.e., management of energy, facility, mobility, and emergency) and providing promptly reacting buildings, autonomously optimizing their behavior based on both historical, real-time, external, and internal contextualized data (Desogus et al., 2017; Yitmen et al., 2021). The first objective is provided through the development of an AMS app, enabling the visualization of the UniTO asset through an interactive 3D map based on BIM-GIS integration. The paper illustrates in-depth how the AMS app gathers all the data currently separately handled by several directorates using a centralized and flexible database, in order to enable holistic asset management. Concerning the second objective, such a database is suitable to develop future consistent CDTs aimed at managing both ordinary and emergency scenarios. Among the latter, fire emergencies are the most probable in university campuses and are still less investigated with respect to facility or energy management (i.e., ordinary scenarios) (Chagnon-Lessard et al., 2021). The main features of a CDT are summarized, exploring how it could provide dynamic and active support during building evacuations in fire emergencies. With this aim, a crowd simulation methodology is developed and exploited to check the current building fire risk level, in addition to identifying required data, which should be found in the centralized database, also collected in real-time by means of IoT systems, which will be implemented in the future.
Furthermore, two demonstrators with different levels of complexity were chosen among the UniTO building stock. The former, due to its modest size and simple geometry, was identified as the most suitable to implement and test the methodology developed to integrate buildings in the AMS app and was then replicated for the whole asset. The latter was identified as a complex building suitable to reiterate and tune the methodology, in addition to showing one of the AMS app and centralized database’s possible applications through the implementation of crowd simulation in case of fire emergency, based on actual space occupancy and conditions.
2 Literature review
The literature review was conducted on previous and current approaches related to the main topics tackled, that is, BIM-GIS integration, smart campuses, and asset management (AM) with a focus on the O&M phase, CDT development, and crowd simulation.
2.1 BIM-GIS integration
BIM was developed with the main aim of managing the whole building lifecycle through parametric models fed with relevant information (Eastman et al., 2011), promoting collaboration and information sharing among stakeholders and boosting productivity in the construction industry (Bryde, 2013). On the other hand, GIS emerged as a tool for acquiring, storing, retrieving, transforming, analyzing, and reproducing spatial data at the territory scale (Burrough, 1986). This system enables spatial analyses through tailor-made parameters with spatial and non-spatial attributes, providing large amounts of data stored in a relational database (Liu et al., 2017).
Recently, due to the growing need of resilient smart cities, BIM and GIS integration (i.e., GeoBIM) has become a key research topic, able to support and enhance data integration, urban management, and strategic decision-making (Yamamura et al., 2017), providing many advantages and useful applications (Shkundalov and Vilutienė, 2021). Nevertheless, BIM and GIS are not fully interoperable domains: they both exploit information models but in different ways and at different levels of detail (Noardo et al., 2020a). This contemporarily represents the main difference and the strength of such an integration, as BIM facilitates information management (IM) at the “micro-level,” providing a deep description of single buildings and components, and GIS enables to extend this feature at the “macro-level,” with information about the district and building surroundings (Wang et al., 2019). Therefore, the great power of GeoBIM consists in enabling digital AM from the micro-scale of the single asset component to the territorial macro-scale. However, the different levels of detail and information provide intrinsic incompatibilities which struggle with BIM-GIS integration, including users, spatial sizes, coordinate systems, standardized degrees of detail, geometric and semantic representation, granularity levels, information storage, and access methods. Many investigations focused on the BIM-GIS interoperability issue with promising findings (Zhu and Wu, 2021). According to Noardo et al. (2020), the most important challenges are as following:
• Data harmonization and consistency: All items and data must fit together and have a specified feature class (e.g., georeferencing, accuracy, geometric and semantic representation, and quantity of detail);
• Interoperability: Metadata must be structured, clear, and thorough to correctly use them in multiple pieces of software. Open standards such as Industry Foundation Classes (IFC) for BIM and CityGML for GIS (Laakso and Kiviniemi, 2012) would promote interoperability and unchangeability among disparate dataset processes that convert a dataset into a uniform format. IFC and CityGML are the two most used open standards;
• Common guidelines: Guidelines shared among stakeholders to adopt GeoBIM models rather than BIM and GIS independently, with reduced losses during information exchanges.
Furthermore, Ma and Ren (2017) identified three suitable domains to apply GeoBIM: planning and design (P&D), O&M, and the demolition phase. Floros and Ellul (2021) highlighted how BIM-GIS integration simplifies IM throughout the whole lifecycle and improves decision-making in the pre-construction phase. Other studies highlighted that the activities which benefit most from BIM-GIS integration during the O&M phase are AM and crowd simulation with a focus on risks, energy, security, heritage, and facility management (Ma and Ren, 2017; Song et al., 2017; Garramone et al., 2020; Heaton and Parlikad, 2020; Fan et al., 2021; Shkundalov and Vilutienė, 2021). Teo and Cho (2016) provided an excellent example of BIM-GIS integration for crowd simulation in order to support indoor and outdoor combined emergency plannings, and they connected BIM indoor paths with GIS outdoor paths. Despite the achievable advantages and the need of “location and spatial links” (Date, 2009), Moretti et al. (2021) highlighted how GeoBIM was rarely investigated in the AM field also due to the high amount of heterogeneous data needed, with different levels of granularity, which poses a challenge to both their collection and storage. They provided an interesting methodology for condition assessment in a GeoBIM model development, demonstrating good results in data collection, visualization, and analysis, enhancing AM decision-making processes, and highlighting the key challenge of technological complexity to develop an AMS through BIM-GIS integration. Finally, during the demolition phase, GeoBIM could enhance material disposal management, reducing both environmental impact and expenses. Furthermore, transportation networks and material information from BIM models might be easily integrated into GIS systems for waste management (Al-saggaf and Jrade, 2015), with resources optimization and cost savings.
Several studies addressed the data exchange issue between the two systems, identifying three possible paths to convert data and integrate them in a GeoBIM environment: from BIM and GIS to a third system, from BIM to GIS, and from GIS to BIM (Ma and Ren, 2017). Among them, the BIM to GIS path is considered the optimal one (Ma and Ren, 2017), consisting in extracting data from BIM and importing them into GIS. Similarly, numerous studies agreed that ESRI ArcGIS Pro® paired with Autodesk Revit® represents the best and most common authoring solution to achieve BIM-GIS interoperability (Ma and Ren, 2017), providing a useful data management and visualization platform. Finally, Zhu and Wu (2021) highlighted that BIM-GIS integration is usually closely related to other topics such as smart cities and DT development together with IoT and AI (Lee and Lee, 2021). It states that BIM-GIS integration “is thought to be the backbone of digital twins.” Impressions confirmed by other studies (Lu Q et al., 2020; Moretti et al., 2021) stressed how the growing demand of DTs can provide further improvements to the BIM-GIS integration with other technologies, allowing to understand how all these technologies exploited together can significantly contribute to the development of smart cities and smart campuses.
2.2 Smart campus and asset management
The wide diffusion of digital technologies and IoT networks in the construction industry is enabling the smart building concept to finally come true and consequently that of the smart city (Deng et al., 2021; Shahat et al., 2021; White et al., 2021). It is easier to achieve through BIM-GIS integration and the recent DT advent (Deng et al., 2021), promising to provide consistent cognitive buildings, autonomously reacting to environmental changes toward more resilient, proactive, and sustainable environments.
Recently, several universities borrowed the smart city concept at the campus scale, particularly to improve the still less investigated O&M phase and provide more satisfactory user experience and optimal resources use (De Angelis et al., 2015; Villegas-Ch et al., 2019; Lu Q et al., 2020; Ward et al., 2021). Indeed, university assets could represent a “little city in the city” with both a variety of users (e.g., students, professors, researchers, external people, facility managers, and administrative staff) and services (e.g., lecturers, courses, and seminars) (Abdullah et al., 2019), leading a highly dynamic and variable environment, which represents a complex system to manage (Naticchia et al., 2019). The presence of several heterogeneous users with different aims and schedules provides a high level of unpredictability both in standard scenarios and even more in emergency ones, when panic stresses user behavior (Naticchia et al., 2019). Date (2009) defines AM as the systematic process of maintaining, upgrading, and operating physical assets. University AM is often organized on fragmented and hardly accessible databases, still document-based, resulting in incomplete and asymmetrical information leading to ineffective decisions and use of resources, especially during the O&M phase. Lu Q et al. (2020) explain that this phase covers over 50 years and is complex to manage due to the need for integrated, comprehensive data exchanged by multiple stakeholders. Seghezzi et al. (2021) state that this phase proved to be the most expensive of the whole asset life cycle. Thus, efficient space management according to occupancy flows, considering users’ behavior in addition to the needs for supplies and services have strong impacts on building usability, causing resource waste and an increase in management, operational, and maintenance costs if inadequately managed (Bosch et al., 2014; Lindkvist, 2015; Nical and Wodynski, 2016). Hence, a dynamic and intelligent AMS based on the principles of IM can support decision-making processes and provide a more comfortable environment along with reduced costs (Qiuchen Lu et al., 2019; Lytras and Visvizi, 2021; Moretti et al., 2021; Seghezzi et al., 2021). Nonetheless, the O&M phase still lacks a holistic system to manage information spread in several databases (Qiuchen Lu et al., 2019; Moretti et al., 2021), particularly relevant in smart campuses.
Despite many studies tackled smart campus development with interesting results (Chagnon-Lessard et al., 2021), there is still not a unique definition; however, Dong et al. (2020) identified six main features, that is, context-aware, data-driven, forecasting, immersive, collaborative, and ubiquitous. Thus, data and their contextualization have a key role, providing more valuable information (National Infrastructure Commission, 2017, Qiuchen Lu et al., 2019) and more aware decision-making processes. These are critical features also for the development of valuable DTs for universities AM (Qiuchen Lu et al., 2019). Therefore, a switch from fragmented document-based approaches to digital collaborative ones is needed with great benefits from both BIM adoption and digitalization (Date, 2009; Roberts et al., 2018; Love and Matthews, 2019; Moretti et al., 2020). An optimal IM strategy is still a relevant challenge to enable the transition toward full digital AM, in particular, information protocols to ensure the availability of accurate information at the right time, to the proper subject, in the required format (Chen et al., 2015). Barrett and Finch (2013) also argue that a holistic view is needed to consider heterogeneous but interlinked factors, which influence several ordinary AM activities (e.g., maintenance, cleaning, occupancy monitoring, and space optimization) in addition to the best value and the best possible environment for users and owners. Leveraging a smart campus through user-friendly, data-driven, and analytical digital tools was demonstrated to enable an actual holistic IM approach, useful to optimize information flow among the several stakeholders involved throughout such a complex asset lifecycle. In particular, BIM-GIS and DT integration promise to provide huge benefits in decision-making processes during the still less investigated O&M phase (Lu Q et al., 2020; Moretti et al., 2021).
It is remarkable that most cases developed so far, both at international and national level, adopted a “micro to macro” approach, that is, starting from the BIM model of a single building exploited as a case study and only later georeferencing it through BIM-GIS integration, extending the procedure to the whole asset (Wang et al., 2019; Heaton and Parlikad, 2020). This works for minor-sized assets, while a similar approach for large and diffused ones would require years of development, preventing enhancement possibilities to reduce the environmental footprint and promoting higher resilience and sustainability. Just few examples, such as Pagliaro et al. (2016) and Moretti et al. (2021) adopted a “macro to micro” approach, preferable when a quick overview of the asset and its distribution can be gained, in order to check the overall consistency of the needed interventions and optimization options. Indeed, it is worthy to note that there is not a unique and correct method, rather the approach depends on the purpose. When an analysis of the consistency and distribution of the whole asset is urgently needed to provide a strategic management tool, the “macro to micro” approach should be preferred (Wang et al., 2019).
2.3 Cognitive digital twins and emergency management
Despite there being no unique common definition of DT in the construction industry, it can be described as a digital replica of a built asset throughout its lifecycle, composed by the three key features cited by their first formalizer (Grieves and Vickers, 2017), that is, the real part, the digital part, and the information link between them (Boje et al., 2020; Jiang et al., 2021; Opoku et al., 2021; Pan and Zhang, 2021). DTs are a consolidated technology in several engineering fields such as manufacturing and aerospace (Liu et al., 2017; Boje et al., 2020; Jones et al., 2020), and now, they represent a disruptive solution to overcome existing gaps in managing complex systems as those concerning the building lifecycle (Corneli et al., 2021). The recent growing interest in DTs is particularly due to the constant increase of data to be managed due to both the growing complexity of construction projects (Afsari et al., 2017) and to the wide integration of IoT and AI technologies (Batty, 2018; Kirchhof et al., 2020; Yitmen et al., 2021). Now, DTs can provide buildings dynamic and timely reaction to environmental changes, especially when applied in GeoBIM systems, unlocking the way toward smart cities and smart campuses (Afsari et al., 2017; Austin et al., 2020; Zaballos et al., 2020; White et al., 2021; Zhu and Wu, 2021). They represent the solution to fill the gap toward a lifecycle management perspective and actually provide the long-mentioned cognitive functions to buildings, enabling the development of CDTs (Escherich, 2016; Du et al., 2020; Lu J et al., 2020; Stojanović, 2020; Yitmen et al., 2021).
CDT first appeared in the industry field and its first formal and comprehensive definition was provided by Fariz and Saračević (2017). Yitmen et al. (2021) highlight that the main difference with the DT is that it gets data from physical entities applying them to the virtual model, while CDT gets the same data and compares them with virtual models including expert knowledge. The core cognitive capability is provided by IoT systems and machine learning (ML) analysis, ensuring optimization through decision-making processes based on DTs (Lu J et al., 2020). There are few examples of CDT development so far. Al Faruque et al. (2021) identified six key features: perception, attention, memory, reasoning, problem-solving, and learning. Yitmen et al. (2021) developed a framework for consistent CDTs for building lifecycle management (BLM), arguing that various pipelines of ML and analytical tools are needed at various lifecycle stages and individuated “cognition” as a set of reasoning, learning, and planning activities enabling to solve unforeseen problems preventively when they occur. With the aim of developing CDTs, it is feasible to start from DT development; then providing them with cognitive functions through AI systems (Yitmen et al., 2021); and exploiting structured, heterogeneous, always accessible, and centralized databases (Deng et al., 2021). Hence, exploiting IoT, ML, and AI technologies, a CDT provides buildings that are able to autonomously adapt and optimize their performances considering both internal and external environmental variables. As stated before, BIM, GIS, and DTs are considered enablers of the smart city concept, and Lu Q et al. (2020) and Moretti et al. (2021) illustrate how BIM-GIS integration is promising for future CDT development. GIS not only provides the key feature of data contextualization, it also enables data integration and DT interconnection with a consequent added value (Bolton et al., 2018; Centre for Digital Built Britain, 2022). CDTs are able to provide a broader decision-making context in economic, environmental, and social perspectives, enabling the visualization of currently unknown and dynamic contextualized information, useful for decentralized management based on a “single source of truth” (SSOT) (Pang and Szafron, 2014; Bolton et al., 2018). It is challenging to provide such an interconnection, but it could be key to managing the O&M phase of large, diffused, and heterogeneous campuses with multiple activities and users also interacting with the urban context in high dynamic and changeable scenarios. As Naticchia et al. (2019) state, users can be described as a significant causality source due to their extreme unpredictability, especially in variable and complex systems with crowded spaces, requiring quick and prompt reactions to unpredictable changes, with the aim of automatize the responses (e.g., fire emergency, pandemic scenarios, floods, and earthquakes). One of the most interesting applications unlocked by DTs consists in the ability to manage emergencies, which means complex scenarios due to their rapid evolution and variability (Naticchia et al., 2019; Selamat et al., 2020; Fan et al., 2021). Particularly, in smart cities and smart campuses, where the presence of a large number of users carrying out various activities requires crowd management, DTs can enhance quick decision-making and crowd coordination through active wayfinding or alerting systems. White et al. (2021) provide a great example of flood and crowd simulation in a DT smart city, while Fan et al. (2021) show how data integration and visualization enhance spatiotemporal information exchange among relief actors, and AI enables real-time data gathering and analysis in emergency scenarios (Zohdi, 2020; Zhao et al., 2021).
2.4 Crowd simulation
A crowd can be defined as a collection of individuals present in a common environment while usually sharing common goals with complex behavior influenced by several exogenous and endogenous variables (Selamat et al., 2020). Generally, crowds do not pose any serious issues; nevertheless, injury and fatalities have sometimes been caused by inadequate escape routes and poor crowd management (Fruin, 1993). Selamat et al. (2020) identify crowd behaviors and space design as the two major causes of crowd disasters or accidents during emergencies. Among crowd behavior, panic is identified as a major reason for life loss in crowded environments (Liu and Lo, 2011). Mutual ignorance among the different segments or groups composing a crowd is one of the crowd phenomena, in panic circumstances, which contributes to and triggers accidents (Johnson, 1987). “Front-to-back-to-front” dynamic in evacuation movement, occurring during evacuations from buildings, was demonstrated to cause injuries and accidents (Johnson et al., 1994; Santos and Aguirre, 2004). Moreover, considering the egress time from a facility, Løvås (1998) demonstrated that evacuation time is affected by three major impact factors.
• Occupants delayed initial response: In case of fire, the delay is mainly caused by the reduced visibility due to thick smoke, which also influences escape route selection (Proulx, 1997).
• Non-optimal selection of escape routes; People typically exit by walking the same way used to enter into the building, rather than following planned escape routes (Shell and Matarić, 2005; Naticchia et al., 2019).
• Congestions along the escape routes, caused by different factors and phenomena such as design shortcomings and self-reinforcing herding effects.
The so-called herding behavior drives people acting as a group, putting aside their capacity of choice and to act as individuals (Saloma and Perez, 2007); it affects the vital choice of the exit during an emergency evacuation (Almeida et al., 2013; Lovreglio et al., 2014a). Herding behavior can heavily impact exit choice, driving people toward a congested route rather than a clear exit, which ensures a safer and faster evacuation, only because perceived as a common choice (Pan, 2006; Lovreglio et al., 2014b). This in turn can cause even greater congestion and overcrowding, which represents a frequent cause of crowd disasters (Haase et al., 2019).
In the literature, two main traditional approaches can be found aiming at assessing building safety effectiveness, which are evacuation tests (Chu et al., 2014) or compliance with prescriptive fire emergency building codes (Sagun et al., 2008). The former can be impractical, time and cost consuming (Kobes et al., 2010), and dangerous when huge crowds are involved (Selamat et al., 2020). In addition, during evacuation tests, evacuees tend to underestimate its importance, reducing its usefulness and preventing a decision-making process due to panic behavior (Almeida et al., 2013). This is an important issue as the walking decision path in normal conditions is proven to be completely different than that adopted in emergency conditions (Quarantelli, 1957; Shiwakoti et al., 2008). On the other hand, the second approach, compliant with prescriptive-based building codes, does not automatically ensure high levels of safety during emergency evacuation (Yi Rong et al., 2014). Several countries modified their prescriptive-based building codes in favor of a performance-based approach to better evaluate fire safety effectiveness, especially in terms of the evacuation efficiency (Tavares, 2009). In the aim of overcoming the traditional approach limitations, researchers and experts started to develop and test computer-based simulation of evacuation processes to assess building life safety (Kuligowski and Gwynne, 2010). Crowd simulation was demonstrated to be a valuable approach for the evacuation performance-based assessment with respect to existing methodologies to double check safety efficiency in complex buildings (Mirahadi et al., 2019). This approach consists in a computer-based analysis of crowd behavior exploited in the construction industry, mostly to simulate and test what-if scenarios both in standard and emergency situations (Kasereka et al., 2018; Di Giuda et al., 2019) in order to optimize design and safety measure choices (Portillo-Villasana et al., 2017; Liu and Kaneda, 2020). Nowadays, crowd simulation models are used by technicians to optimize building layouts before the construction phase (Pelechano and Malkawi, 2007; Khamis et al., 2014). In fact, crowd modeling and simulation traditionally is applied as 1) a modeling tool to simulate crowd and pedestrian dynamic, 2) safety risk assessment tool for spaces or buildings also useful to optimize safety management strategies, and 3) a design optimization approach (Zhao et al., 2017; Zhang et al., 2018).
According to the literature, crowd simulations can be divided into three main approaches: macroscopic, mesoscopic, and microscopic (Yang et al., 2020). The macroscopic and mesoscopic models are typically exploited for huge crowds in large infrastructure as computationally efficient models (Biedermann et al., 2016). The microscopic approach typically models the pedestrian behavior with high precision, performing highly detailed simulations (Biedermann et al., 2016), and the microscopic simulation is suitable when the pedestrian flow is close to the full capacity of the buildings and/or in the presence of bottlenecks. Generally, in the case of high-density scenarios (Klügl et al., 2009) or in the case of small and complex geometries, such as office buildings and clubs (Alonso-Marroquín et al., 2014), several microscopic models rely on collision avoidance algorithms and are based on vision-based cognitive models (Ondrej et al., 2010; Hughes et al., 2015; López et al., 2019), providing the agents with the perception of mutual position and movements on the basis of which they act accordingly (Moussaïd et al., 2011). It can be stated that the simulation approach acts only on the building design variable, analyzing and aiming at optimizing it, rather than actively intervening in crowd behavior. This represents one of the two major causes of crowd accidents during emergency situations, along with the building design variables (Selamat et al., 2020).
Basically, there are two approaches to control and guide crowds during emergency evacuations, which are as follows:
• Traditional evacuation strategies: Occupants rely on visual signs, markers, and plans, which determine whether people can safely leave a building (Bahamid et al., 2020) and correct position and visibility according to the emergency plan adopted (Cabinet Office, 2009). Consequently, fire escape routes are frequently marked with visual signs, despite their relatively rapid deterioration in effectiveness with smoke accumulation on the higher part of emergency corridors (Rea et al., 1985; Shell and Matarić, 2005; Ibrahim et al., 2016), and it was demonstrated that people fail to notice and follow them when panicked (Bahamid et al., 2020). Shell and Matarić (2005) demonstrated that even a small number of beacons can help overcome this gap, reducing the expected egress time. Directional audio-based systems are even more effective in the case of multi-floor and complex buildings. Placing beacons near stairwells, emitting an ascending tone alerting evacuees to ascend the stairs or a descending tone alerting to descend the stairs, could also improve the escape time in multi-story buildings (Withington, 2001).
• Intelligent and robot-assisted evacuation strategies were recently implemented to overcome the typical evacuation criticalities, proved to ensure a quicker and safer evacuation, and efficiently guide to the shortest and safer exit route. In addition, they detect and dynamically act according to the environment changes in real-time by considering density, pedestrian flow, and location of the hazard (Tang et al., 2016). Research studies about this field can be divided into three main categories according to the purpose and function of the proposed systems (Bahamid et al., 2020): 1) evacuation guidance systems (Wada and Takahashi, 2013; Ikeda and Inoue, 2016; Zhou et al., 2019), 2) search and rescue systems (Ruangpayoongsak et al., 2005; Murphy et al., 2008; Annuar et al., 2016; Enshasy et al., 2019), and 3) regulation and management of the people flow during evacuation (Boukas et al., 2015; Jiang et al., 2016; Shan et al., 2018; Wan et al., 2020).
As previously stated, CDTs improve quick decision-making and coordination in emergency scenarios, enabling crowd management and enhanced evacuation strategies through active wayfinding or advanced alerting systems (Zohdi, 2020; Fan et al., 2021; White et al., 2021; Zhao et al., 2021). Crowd simulation data can inform CDTs to better manage complex systems as crowds in emergency situations within smart campuses or cities, by optimizing dangerous phenomenon communication and preventing the mutual ignorance among different segments or groups of users. Moreover, they can significantly impact the evacuation time, especially together with VR/AR (i.e., virtual reality and augmented reality) systems and occupancy sensors (Zhu and Li, 2021). They can provide users with emergency alerts, preventing occupants’ delayed initial response and active wayfinding through the safest escape way (Naticchia et al., 2019). CDTs can also prevent congestions along escape routes and fill one of the biggest gaps in crowd simulation: the real-time or simultaneous crowd management acting on users’ behavior, rather than building design, through a dynamic and proactive reaction which prevents front-to-back-to-front and herd behaviors (Johnson et al., 1994; Santos and Aguirre, 2004). Furthermore, CDTs integrated with BIM-GIS platforms inform responders and relief actors with useful, reliable, and prompt information about accident localization, optimizing intervention time through informed and contextualized data (Hashem et al., 2016; Ismagilova et al., 2019; Fan et al., 2021).
3 Methodology
The methodological path defined for the wide research project also concerning the development of future CDTs for the O&M phase of large, diffused campuses, such as the UniTO’s one, is shown in Figure 1 and presented in two parts.
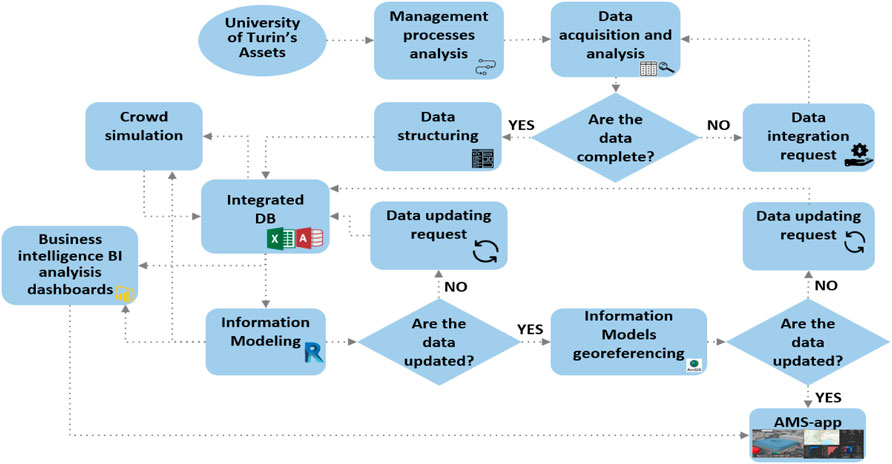
FIGURE 1. Research project methodological path.
The first part, Section 3.1, focuses on the method used to develop the AMS app, which represents the first step of the whole research project. It is illustrated how it involved the definition of a centralized and scalable database and the georeferencing of the whole university building stock through BIM-GIS integration in a web-based 3D interactive map. A description of each step implemented is provided:
• Data acquisition and analysis of building stock and management processes;
• Data structuring to develop the integrated database;
• BIM-based information modeling;
• Information models georeferenced through the BIM-GIS web-based platform;
• Business intelligence (BI) to develop interactive analytics dashboards.
The second part, Section 3.2, describes the methodology developed to exploit the significant potentials of the AMS app and the centralized database in one of its multiple possible applications. It illustrates the methodology used for crowd simulation applied on the second demonstrator and replicable for the whole UniTO asset in order to map current fire risk, also identifying needed data for future fire emergency CDTs. This part ends with a description of data integrated in the centralized database useful for crowd simulation, fire risk mapping, and the development of fire emergency dashboards using the previously illustrated approach based on BI tools.
3.1 AMS app development
3.1.1 Data acquisition and analysis of building stock and management processes
The methodological path (Figure 1) started with the analysis of the UniTO asset and its management system to identify needed data already available from the involved directorates and understand how they were managed and shared, in addition to unveiling missing data and collecting them in an SSOT.
At first, the UniTO’s communication channels, such as the freely accessible website section with core activities and staff official documentation (i.e., “transparent administration section”), were investigated to identify the already available data, the administrations involved in the AM, and the existing databases and platforms. Table 1 (existent databases or platforms, related data, and involved directorates) shows the results of this preliminary analysis. A web platform, namely, Opensipi, was identified, aimed at managing both spatial and functional building attributes (e.g., dimensions, occupancy, and mechanical assets) handled by the “information systems and e-learning portal directorate” and the “Building, Logistics, and Sustainability Directorate.” Furthermore, an external database, namely, Cineca, was identified as the management platform for student data (i.e., course catalog, enrollment data, and exams).
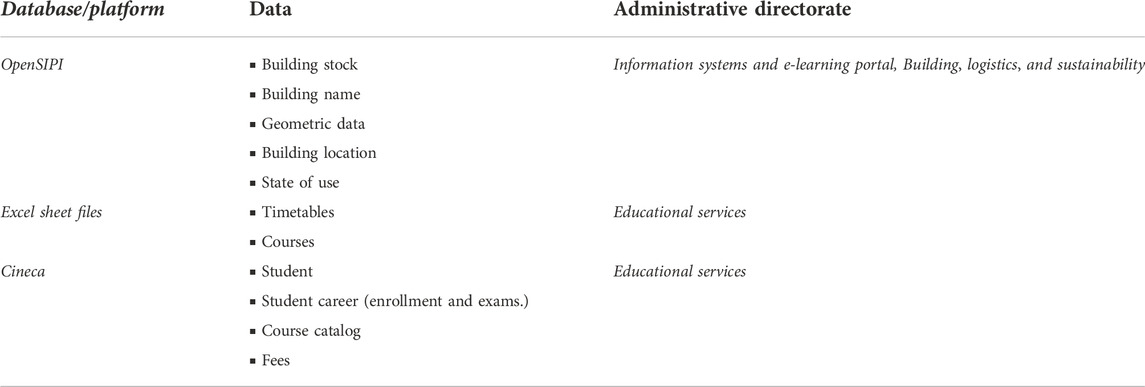
TABLE 1. Existent databases or platforms, related data, and involved directorates.
In-depth analysis of existing databases pointed out that Opensipi aimed to provide a space and an AM tool to explore and visualize the whole university building stock with its spatial attributes using Google Maps©, in addition to interactive digital plans with further information about single spaces (Table 2, spatial attributes available from the Opensipi platform). Opensipi floor plan drawings in a pdf format were useful to obtain geometric data when official CAD drawings were not available. Nonetheless, functional attributes useful during the O&M phase (e.g., occupancy, timetables, furniture, mechanical systems, and evacuation data and times) were totally missing, and the platform was not continuously updated, so data did not match with the actual space conditions. Thus, additional documentation was required for the “Building, Logistics, and Sustainability Directorate” in order to gather updated data and plans, also identifying ongoing renovations projects, information previously known only by the involved staff.
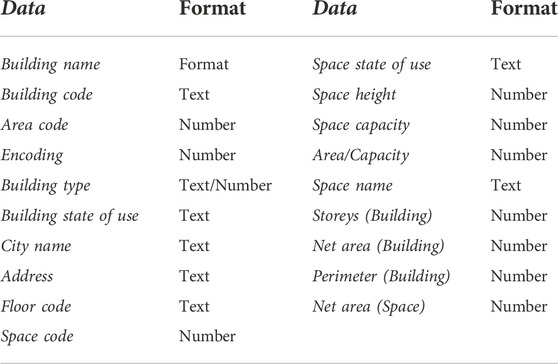
TABLE 2. Spatial attributes available from the Opensipi platform.
It was also found that Cineca provided the “Educational Services Directorate” with two tools whose functionalities are detailed in Table 3 (functionalities provided by Cineca tools): 1) Esse3, for students’ academic career management and 2) University Planner to automatically generate timetables based on courses and spaces availability but without any optimization for space occupancy. Interviews with the involved administrative and management directorate staff highlighted that Cineca data were not directly queryable but just accessible through dedicated interfaces. Customized queries must be forwarded to Cineca, leading to inefficient management since required information had to be demanded on purpose with long processing and waiting times.
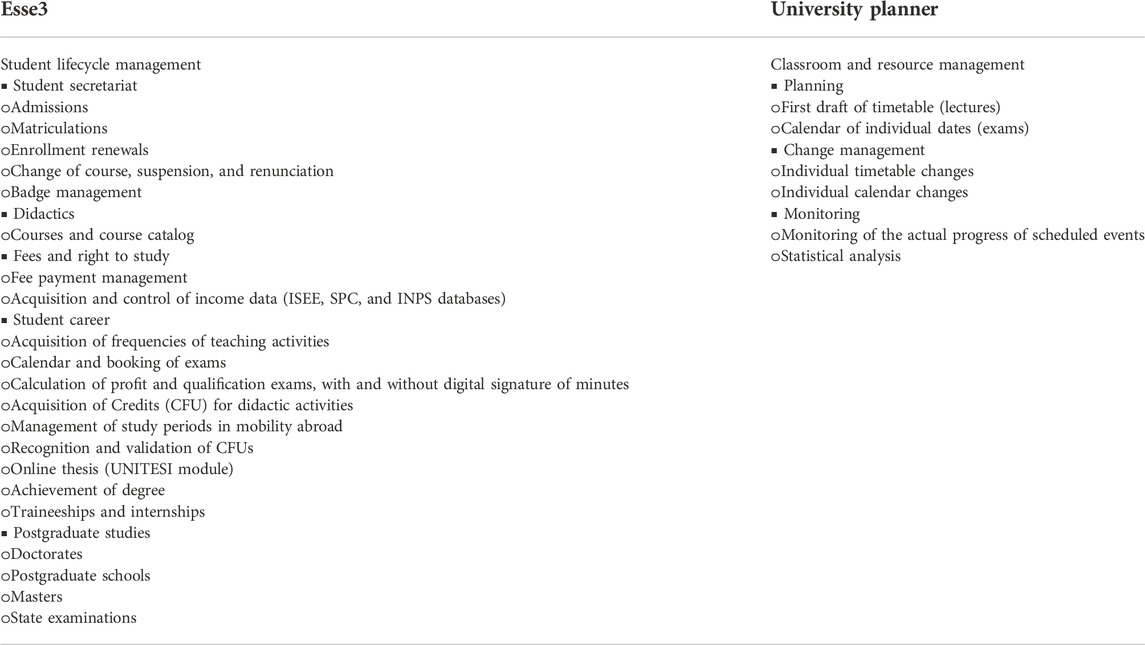
TABLE 3. Functionalities provided by Cineca tools.
Further analysis, conducted in collaboration with the “Educational Services Directorate,” highlighted that heterogeneous and customized Excel sheet files were used to collect data on academic activities, complicating information accessibility and preventing a coordinated asset management activity.
3.1.2 Data structuring to develop the integrated database
A fundamental step (Figure 1) concerned the definition of useful data for the UniTO AMS app. It was crucial to define a centralized database structured to gather needed data from several existing sources, ensuring data interconnection and integration in a single database, available and accessible by each stakeholder. The centralized database was developed starting from the existing data sources with the main aim to ensure needed flexibility and adaptability useful for further evolution throughout the university asset lifecycle, such as in the case of CDT development for the O&M phase. Table 4 (collected data sources and formats) shows collected data, related formats, and sources. The most suitable way to store them in a flexible and accessible way was identified in relational databases (RDBs), that is, the most secure and consolidated system to provide data structured with a precise hierarchy (Atzeni and De Antonellis, 1993). RDBs enable different types of relationships between data.
• one-to-one: A record in a table is associated with one and only one record in another table;
• one-to-many: A record in a table may be associated with one or more records in another table;
• many-to-many: Several records in one table are associated with several records in another table.
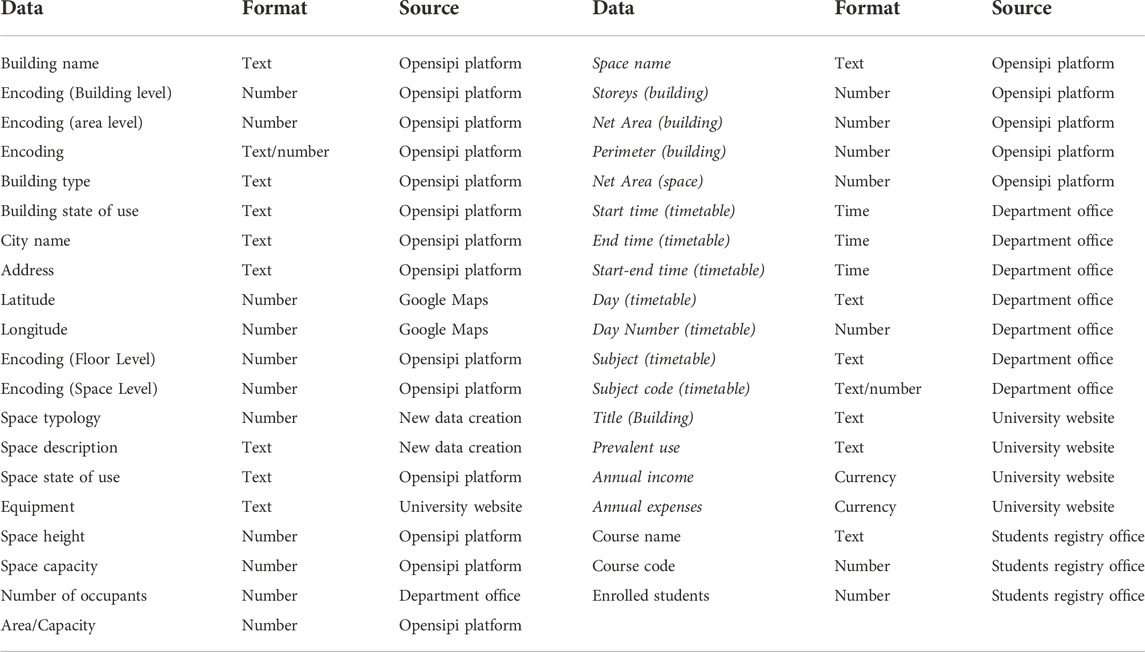
TABLE 4. Collected data sources and formats.
Thus, customized queries can be used with the aim of filtering and aggregating data according to the intended purpose.
Currently, a significant amount of data are managed by Microsoft Excel®, and Microsoft Access® was used to develop the centralized relational database. In this way, a high level of interoperability is guaranteed together with the lowest level of data loss, also during the development of analytical dashboards by Microsoft Power BI®, as better illustrated in the following paragraphs.
The database structure (Figure 2) branches into 10 tables fed with the collected data. This organization is based on forecast data needed in future O&M activities and DT development, individuating how different information should be linked at different detail levels. The most suitable type of starting data were identified in the spatial data (“building stock” table in Figure 2) as they are needed in most AM activities and should not significantly change over time. Thus, the database structure was developed starting from the central table “building stock,” and then, on one side, it branches in data about “floors” and single “spaces” (i.e., “space typology legend,” “timetables,” and “staff”). On the other side, data about “titles” related to the real property, “rental incomes,” “rental expenses,” and “degree programmes” were branched out. It was key to define a tailor-made encoding system, to uniquely identify building spaces and link data across the database, overcoming current difficulties due to duplicated codes, which prevent the correct space identification and sometimes lead to multiple assignments. With the aim of facilitating a smooth transition from a management system to another, the encoding system was arranged, starting from the one used in the Opensipi platform, as follows:
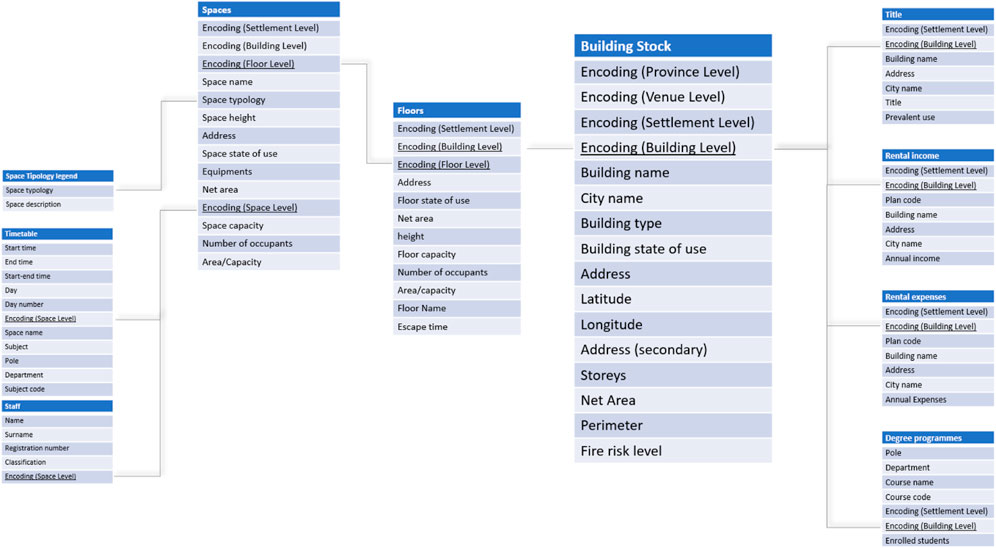
FIGURE 2. Database structure.
PR1_0002_0003_A4_P005_00006
1: Province, 2: venue, 3: settlement, 4: building, 5: floor, and 6: space.
It is made up of a two-letter code corresponding to the province (e.g., TO as the Italian abbreviation of Turin), two numerical codes of three spaces indicating the venue and the settlement, a letter corresponding to the building, the letter P followed by the floor number, and, finally, the space code number.
The future development of CDTs was also considered, and the data structure can be expanded with additional branches whenever new information needs to be added; in addition, the customized coding scheme enables queries to identify the required information at different scales.
3.1.3 BIM-based information modeling
The fourth phase of the methodology path toward the AMS app (Figure 1) concerned the BIM model’s development and enrichment with both spatial and functional semantic data collected in the centralized database.
As better illustrated in Section 4, the University of Turin is one of the largest Italian universities. Thus, it was neither feasible nor useful to provide detailed BIM models of the whole building stock at once; rather, a gradual approach was implemented. All the buildings that compose the diffused campus were modeled as masses and georeferenced using the AMS app. Two of them were selected as demonstrators of the AMS potential and implemented as actual BIM models with detailed information up to the room level.
The technical drawings (plans, elevations, and sections) provided by the “Building, Logistics, and Sustainability Directorate” were integrated with some missing information identified through on-site inspections. It was crucial to model the buildings through masses, floors, and rooms in order to obtain an adequate level of information to represent the whole diffused UniTO asset, without overburdening the AMS app with an excessive amount of data. Another objective was to guarantee the digitalization and geo-referencing of the entire building stock, in order to display synthetic information suitable for ordinary management activities (e.g., rental costs, housing title, and number of classrooms and seats) by interacting with the app. In the future, when differences arise while using the AMS app for facility management and CDT development aimed at real-time management of space and occupancy, reduction of energy consumption, comfort management, and so on, more detailed BIM models can be implemented and enriched with additional data. Autodesk Revit® has been used mainly due to three factors: 1) the possibility to represent only the main volumes of the university building stock such as masses, floors, and rooms, which can be further detailed in the future; 2) the Dynamo for Revit® plugin, useful to automate both modeling and parameter assignment processes; 3) a good level of interoperability between Revit and Esri’s ArcGIS Pro, to import BIM files (e.g., .rvt and .ifc format) directly into the GIS environment, minimizing information loss (Song et al., 2017). At the moment, the .rvt format was used to import BIM models, but one of the future aims of the research is to switch to the open format.
Then, the single categories of elements created (masses, plants, and environments) were assigned to the related spatial and functional data previously acquired and archived in the centralized digital database, using visual programming language (VPL) (The Dynamo Primer, 2021). In particular, the advanced visual programming software Dynamo for Revit® was used to integrate the semantic data shown in Table 5 (centralized database information layer with related spatial and functional attributes) within the parametric models of the UniTO asset. Dynamo is an open-source Revit interface between its API and VPL (The Dynamo Primer, 2021) with elements, which can be linked to the aim of defining relationships and action sequences useful to set up tailored algorithms according to highly customized requirements. These spatial and functional data were structured individually within the database and then linked to the information models. Figure 3 shows the steps implemented within dynamo to import alphanumeric databases and their assignment to three categories of parametric elements (e.g., masses, floors, and rooms). Customized nodes enabled data extrapolation from spreadsheets and new shared parameter development in the .txt format, assigned to each BIM model.
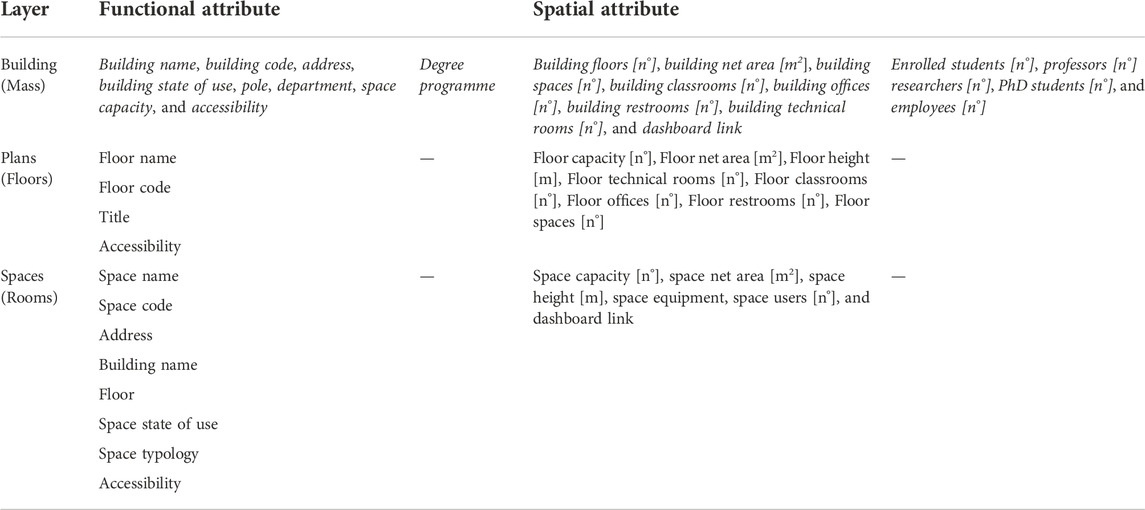
TABLE 5. Centralized database information layer with related spatial and functional attributes.
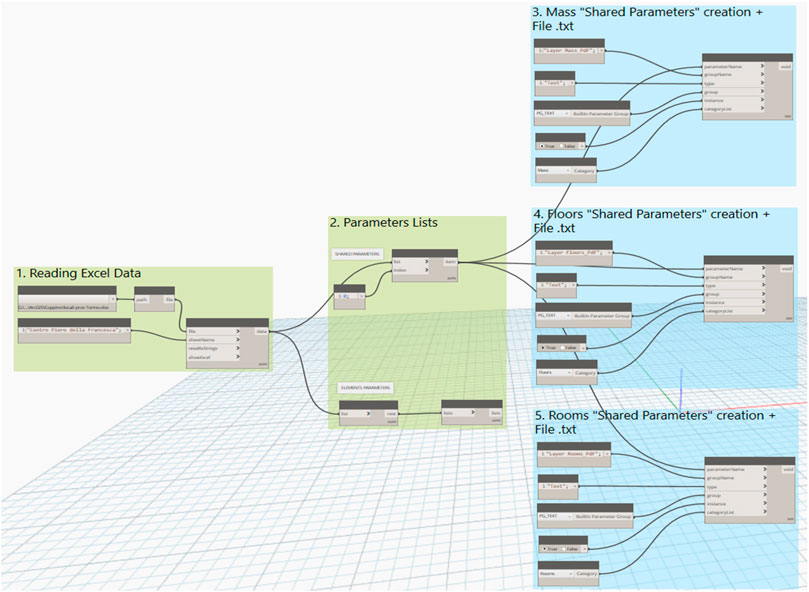
FIGURE 3. Dynamo workflow to import alphanumerical databases to parametric model elements.
3.1.4 Information model georeferencing through the BIM-GIS web-based platform
The fifth step of the methodology path (Figure 1) concerned the actual implementation of the information models into the web-based BIM-GIS platform, providing the real-time visualization of the UniTO assets and its attributes in an interactive 3D digital environment (i.e., AMS app). Such a GeoBIM system enabled information models, spatial, and functional data connection at once.
It was crucial to test BIM-GIS interoperability, achieved through the “BIM to GIS” approach together with ESRI ArcGIS Pro® and Autodesk Revit ®, currently representing the most suitable approach, as stated in the literature review. This choice is also due to the fact that the University of Turin already uses ArcGIS Pro for geotechnical research and holds a campus license.
A key step concerned the BIM models checking in the GIS environment, to demonstrate the correct importation of information linked to them, in addition to their accessibility and usability. A tailored workflow was developed to check geographical coordinates and attributes. Once the model was imported into the GIS environment (i.e., ArcGIS Pro), vertices (X, Y, and Z) geometrical coordinates were extrapolated through the specific tool “Feature Vertices to Points.” Then, a vertex with known coordinates was identified and used to check its geographical coordinates and correct georeferencing in space.
Figure 4 shows the BIM-GIS integration workflow used to model and then georeference the whole UniTO asset, finally providing the AMS app. The BIM models of the whole asset were imported in the GIS platform as georeferenced building masses, with geometric and semantic attributes (corresponding to “building layer” in Table 5), while the BIM models of the two demonstrators were fully imported with geometric and semantic information detailed from the floors up to the spaces (“floor layer” and “space layer” in Table 5).
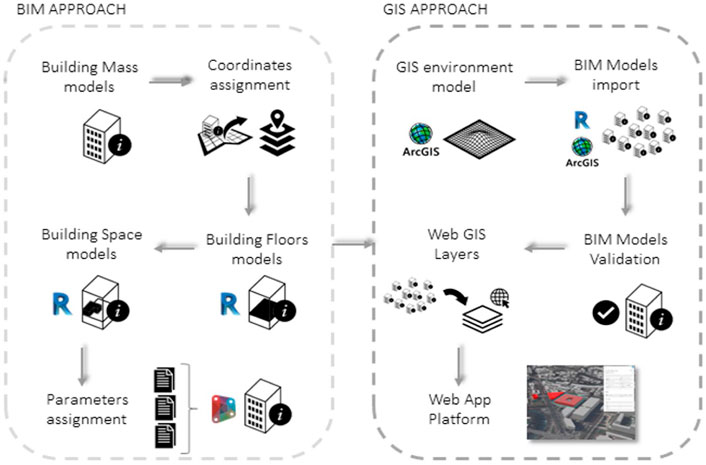
FIGURE 4. BIM-GIS integration workflow to develop the AMS app.
Once all the buildings were imported in the GIS platform, the interactive map was generated through the web environment. The ArcGIS Scene Viewer application was used to import the building models as layers were configured to allow specific queries, and then tailored slides were created to facilitate user navigation throughout the whole asset. A QR code was assigned to each of them and placed both at the entrance and in strategic points of each building, enabling quick asset and data visualization through digital devices.
3.1.5 Business intelligence to develop interactive analytics dashboards
A further step of the methodology (Figure 1) concerned the development of valuable tools to support strategic decisions. BI technology was investigated as it enables both the analysis of large amounts of data and interactive dashboard development aimed at facilitating information visualization and understanding, and this is key for future building management via CDTs.
The analysis conducted in the first step of the research revealed that Microsoft Excel® and Office® suite were the main software used by the directorates. Thus, Microsoft Power BI® was selected to achieve the best interoperability through already existing tools and a plugin, which enables ArcGIS map visualization, ensuring interoperability with the ESRI® suite. Furthermore, power BI is internationally recognized as one of the most suitable software to handle large amounts of data (Shaulska et al., 2021) and in addition, allows to work on datasets without changes to the source dataset, preventing original data loss. Data at different levels of detail have been analyzed to develop several dashboards and obtain information visualization at different scales, ranging from the macro level of the single building or groups of buildings to the room micro level, as shown in Section 5.
Three main types of dashboards were developed so far:
• Overall dashboards about the whole UniTO asset with related analytical and interactive components;
• Single building dashboards were designed to visualize the single educational center or department, its spaces, and attributes, filtered from the whole asset visualization;
• Fire emergency dashboards help visualize crowd simulation and fire emergency information and can be updated in real-time by the future CDTs.
3.2 Crowd simulation methodology
The methodology and the steps outlined so far involved the integration of information models in the AMS app with related spatial and functional attributes. A further step concerned the development of crowd simulations in case of fire (crowd simulation in Figure 1), exploiting data stored in the central database and conducted according to the methodology described in the following paragraph.
The methodology presented here aims at visualizing user reaction and movements in an emergency scenario, to verify the crowding levels in all spaces and escape routes, in addition to measuring escape time and comparing it with a reference one. This allows investigating possible dangerous circumstances with high-density moving crowds at critical points of a building, such as fire exits and stairs. In addition, the methodology enables to evaluate emergency evacuations and crowding during hazardous events, which impede the use of one or more escape routes at a selected building floor.
In the first step, the maximum crowding level is identified by previous studies, and the maximum density of moving crowds over which high risk situations can arise is equal to five people per square meter (Still, 2011; Still et al., 2020). On the other hand, the reference escape time (TR) is defined through the analysis of national prescriptive regulations, considered as the maximum time for the effectiveness of the safety measures required. It allows investigating the actual safety of the building floors with high-risk levels of moving crowds detected, by comparing the measured escape time with the reference one from prescriptive regulations.
A microscopic approach was adopted (Klügl et al., 2009) and applied to the analysis of the so-called casual crowd (Berlonghi, 1995). Among the four influencing crowd simulations identified in the literature review, space layout and human behavior can be identified. Space layout can be considered in the model by including the whole building or just a selected portion relevant for the analysis. In the latter case, it should include all spaces and user flows gathering in the same safe place and using the same escape routes and stairs, ensuring simulation reliability. In addition, limitations on space access or escape route for predefined user groups are considered in the model setting. The agents representing the users are controlled by an AI system, enabling them to choose the best escape route, according to the least effort principle and crowd behaviors, as described in Section 2.4. In particular, the model relies on a collision avoidance algorithm based on vision-based cognitive models (Ondrej et al., 2010; Hughes et al., 2015; López et al., 2019), providing the agents with the ability to perceive mutual position and movements, acting accordingly (Moussaïd et al., 2011). Consequently, user speed, field of view (FoV) angle, avoidance range, and avoidance preference direction are defined. In addition, agents are modeled considering the maximum building, building section, or occupancy capacity, in order to simulate the worst possible evacuation scenario. Additional scenarios are simulated and tested by introducing a hazardous event that prevents the use of one or more escape routes on a selected building level, enabling agents to use only free escape routes during the simulation. The proposed crowd simulations aim to assess space distribution, and escape routes’ and exits’ efficacy and safety.
The third methodology step performs crowd simulation scenarios. The first scenario considers the whole building or the section analyzed as in the selected demonstrator. The agents are triggered to leave their personal spaces and evacuate the building using all the possible escape routes and exits. Then, other scenarios are performed, introducing a hazardous event in one or more escape routes, preventing agents from using them during the evacuation.
Then, the fourth step involves the density map analysis resulting from performing crowd simulation. It is the maximum density of moving crowds reached during the whole simulation in each point of the building. It is particularly important to verify density values at critical points (i.e., fire exits, stairs access, and corridors), where different user flow intersections can provide overcrowding and accidents, as stated in the literature review. In addition, scenario simulations enable the identification of the building floors with high risk levels of moving crowds, that is, density values greater than five people per square meter (i.e., 5 p/sqm) in non-safe areas, selected to be analyzed in the fifth step. Non-safe areas are spaces and corridors, while safe areas are the protected and external stairs and the safe places identified by fire emergency plans.
In the fifth step, the building floors which showed high-risk levels of moving crowds are further analyzed, and for each selected floor, the escape time is measured (T1, T2, … , Tn). This time starts when the first agent of the floor is triggered to leave the building and continues until the last agent has reached the safe place or the floor exit, which leads directly to the protected or external stairs. The measured escape time is then compared with the reference one. If Tn < TR, the escape time is comparable or inferior to the one defined by prescriptive regulations, safety measures are defined based on it, and the check is satisfied. Otherwise, if Tn > TR, the check is not satisfied, and the actual building layout, escape routes, exits, and other safety measures are not sufficient to ensure user safety during an emergency.
The outlined methodology for crowd simulation in fire emergencies enabled the database integration with data concerning the escape times and the level of fire risk of the single building. Furthermore, it provided information useful to develop tailored dashboards to visualize fire safety analysis of each floor, as illustrated in Section 5.
4 Demonstrators
In this section, the pilot case and the first two selected demonstrators are described, illustrating their main characteristics and peculiarities that influenced their choice.
4.1 A big, distributed campus
The large and complex UniTO asset represents a widespread campus characterized by a large catchment area in continuous growth, with a complicated management and usability at both the single building and urban scale. Despite the pandemic, in the last academic year, enrollments increased by 3,300 students with a positive trend through the previous 5 years. The building stock is mostly concentrated in the metropolitan area of Turin and Grugliasco, with few detached hubs. It counts 112 buildings for an amount of almost 629,000 net square meters, mixed in the building era, style, and destination, ranging from historical buildings, theaters, museums, hospitals, and more recent buildings, providing a huge heterogeneity, which further complicates its management. Indeed, some uses are inadequate with respect to the available spaces due to the architectural and huge renovation expenses required to adapt them both to functional and sustainable needs. Furthermore, they host various activities usually mixed with others open to the public such as exhibitions, seminars, and cinema and also include teaching, administrative, and technical staff; basically, it represents the management of a small town with a high level of complexity. Although it is the third largest Italian university with a huge catchment area, its current AMS is fragmented and poorly digitized, entailing a strong information asymmetry among stakeholders, which prevents the exact awareness of its consistency and use. Consequently, administrators urgently need the prompt perception of the UniTO asset consistency and distribution over the territory, in addition to a management system strongly connected with the urban space rather than disjointed.
The illustrated management complexity explains the need for dynamic and proactive systems for the UniTO O&M phase. CDTs enable real-time and quick decisions to resolve or prevent deviations from expected behaviors, both in ordinary scenarios and in emergency ones, improving campus resilience, safety, and sustainability. In emergencies, it is particularly needed to promptly provide users and administrators with contextualized and reliable information, enabling aware and effective decisions. Proactivity and a quick response are crucial in such high-stress situations with the presence of panicked crowds difficult to manage. This is especially the case in large, diffused campuses, where multiple buildings scattered throughout the territory need to be managed and monitored. It becomes fundamental to provide them with IoT networks and AI systems, providing proactive and cognitive features useful to autonomously react to stressful situations or deviations, based on the surrounding conditions.
4.1.1 Demonstrator one: Piero della Francesca
The building located in the northwest of Turin, which hosts the computer science department (CSD), namely, “Piero della Francesca,” was selected as the first demonstrator. The University of Turin purchased a portion of a multifunctional center (i.e., 2,850 sqm out of 170,000 sqm) that houses various offices and commercial enterprises (Figure 5) in order to host CDS educational, administrative, and research activities. Even though it is small in terms of area, it experienced the largest rate of increase in the university population in the last 5 years (i.e., 50 %), with a steady demand for new spaces.

FIGURE 5. First demonstrator, Piero della Francesca.
Specifically, the university holds spaces on the ground, first, and third floors of the building. The ground floor is mostly used for educational purposes, while the first and third floors are used for research and administrative purposes. The 12 classrooms on the bottom floor can accommodate up to 1,318 students, while the 93 offices on the first and third floors can hold 153 occupants. This demonstrator was identified as suitable to test the methodology provided to develop the AMS app, further tuned with the application on the second demonstrator. Indeed, its small dimension and the presence of a single department enabled it to easily define required data and test the platform’s functionalities.
4.1.2 Demonstrator two: Palazzo Nuovo
The second demonstrator was chosen due to architectural and management complexity worsened by the strong crowding, which makes it a significant case study to refine the proposed methodology. This complex building was identified as suitable for the application of the defined crowd simulation methodology to unveil useful fire-emergency data to be added in the database and visualized using the AMS app. In addition, crowd simulations enabled to check the current level of fire risk and demonstrate the usefulness of a “fire emergency CDT” aimed at optimizing user evacuation through an active wayfinding system together with alerts for occupants, responders, and relief actors.
The building, namely, Palazzo Nuovo, houses the school of humanities with five departments, 33 degree courses, and about 965 study courses. It amounted to a total of 22,641 students in the last academic year, accounting for 27.7% of the total university population showing a positive enrollment trend in the last 4 years, with a growing rate of 14.8%. The structure is made up of seven floors above ground and three basement floors, in addition to three large classrooms separate from the main body (Figure 6). It can accommodate up to 3,975 students in the classrooms and 1,000 in the study rooms, for a total of 5,006 seats also considering the spaces assigned for degree events; furthermore, it has external places in other buildings for a total amount of 7,475 places available. This highlights that both current places are not sufficient to cover Palazzo Nuovo demand and its management complexity, which also made it a suitable case study for crowd simulation in fire emergency scenarios.
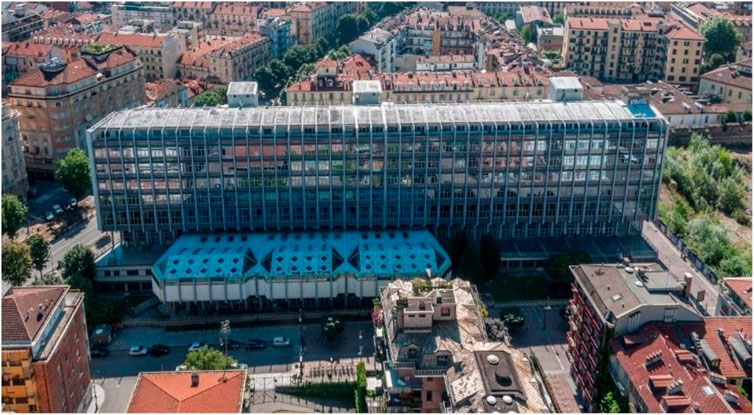
FIGURE 6. Second demonstrator, Palazzo Nuovo.
Palazzo Nuovo is one of the first steel constructions built in Turin, and it has undergone extensive renovations in recent years to minimize asbestos-related concerns. Space and fire safety upgrades followed the remediation work, and the fifth and sixth floors are still under development. Specifically, all of the staircases and escape routes were isolated in accordance with national standards, leading to a safe place according to the requested escape time.
5 Results and discussion
This section provides the first results of the project through the application of the defined methodology on the two demonstrators, illustrating their implementation through the BIM-GIS platform. Then, the fire emergency crowd simulations carried out on the most complex and significant demonstrator are reported.
5.1 Integrated database and AMS app
The pilot use case identified in the vast and complex UniTO asset was entirely modeled with low detail and georeferenced using the AMS app, accessible both by asset managers and users (Figure 7) through digital devices and QR codes placed in strategic points of the buildings. Although the datasets are still incomplete compared to all possible future AMS app uses (facility and maintenance, emergency management, crowd simulation, occupancy management, etc.), most of spatial and functional attributes are already displayable, providing a valuable tool to support strategic decisions through BI technology. As previously illustrated, the AMS app can be navigated and filtered at different information levels to visualize only the needed information, contextualized, and with a high level of consistency.
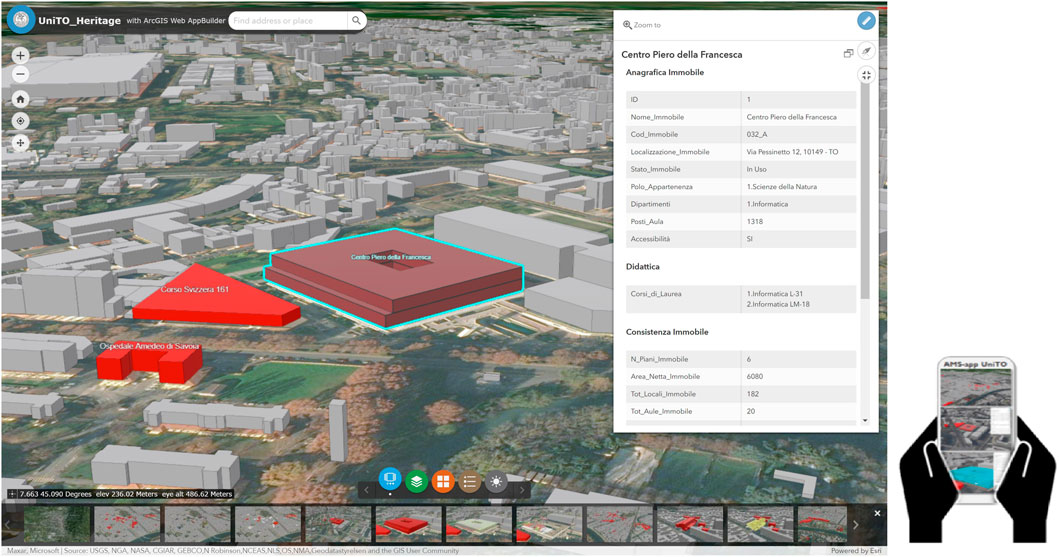
FIGURE 7. AMS app with example of building query.
The replicable methodology illustrated in Section 3.1 was tested on the first demonstrator and fine tuned in the second one. The initial “data acquisition and analysis of building stock and management processes” confirmed the lack of a holistic view throughout the several managed data, worsened by customized and individual interfaces and management systems, often still document-based, by independent and geographically distant administrators. Thus, the large amount of data needed to manage such a complex and diffused asset were neither easily accessible nor fully shared among the administrators. This is mainly due to the lack of interconnection between existing platforms managed by different directorates, which led to highly fragmented and not fully digitized databases, struggling for the complete data collection for the optimal AM. Furthermore, the lack of IM guidelines prevented the correct data collection and their interconnection, preventing the gathering of useful and contextualized information for effective decisions with consequences on both management costs and efficiency.
Thus, a centralized, integrated, and flexible database was provided through RDBs aiming at defining an SSOT with a defined but adaptable hierarchy throughout the asset lifecycle. The future development of CDTs was considered, aiming to be an easily accessible, updatable, queryable, and expandable data structure so that all the useful management information, also from on-field sensors, could be included. The data structure can be expanded with additional branches whenever new information needs to be added, and the customized coding scheme enables queries to identify the needed information at different levels of detail. Furthermore, future developments will concern the implementation of ML to automate database feeding, providing more accurate information and avoiding possible errors.
5.2 Analytics dashboards
As illustrated in Section 3.1, data were analyzed using Microsoft Power BI® and its ArcGIS plugin through the centralized database. This results in several interactive and analytic dashboards enabling the visualization of synthetic information useful to support strategic decisions through the O&M phase.
Currently, the dashboards provide the visualization of static data from the integrated database, with some interactive elements enabling to filter or aggregate them and see defined key performance indicator (KPI) variations. In the future, they will be linked to CDTs to display real-time, dynamic data gathered from on-site IoT networks (e.g., occupancy, internal temperature, and energy consumption) and processed by AI systems aimed at optimizing space and resource use, in addition to building performances.
At first, an overall dashboard concerning the whole UniTO asset was developed (Figure 8), displaying the following analytical elements which can be filtered for each single building:
- an interactive map with localization,
- number of buildings,
- building name,
- building title,
- prevalent use,
- rental income,
- rental expenses, and
- bar graph with annual rental income and expenses.
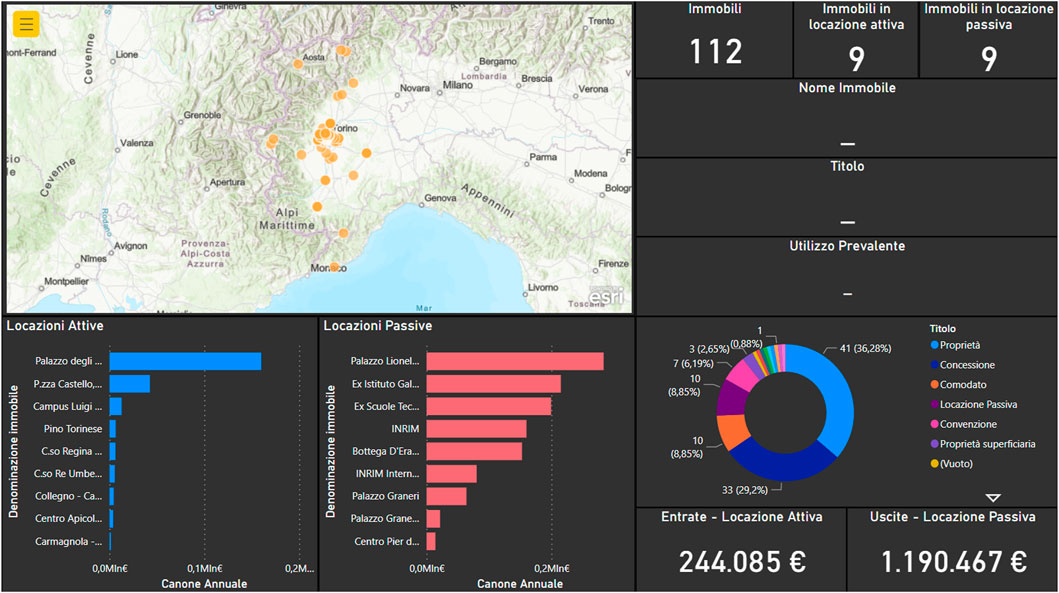
FIGURE 8. Overall analytic dashboard of UniTO asset distribution and destinations, with related expenses.
This dashboard is very useful for administrators to gain an immediate perception of building location and housing titles, rent expenses, and incoming for the properties given in use. It enables quick financial evaluations and identification of optimization possibilities, prevented by the fragmented and document-based management so far.
A second overall dashboard enables to visualize asset information filtered by educational poles or departments, providing the immediate identification of departments or courses hosted in a certain building, in addition to the distance between buildings or spaces such as laboratories or university residences (Figure 9). This information, crossed with that related to classroom occupancy and timetables, enables to check the optimal allocation of courses, building use, and users’ mobility across the campus and the city, providing a more sustainable and resilient use of resources particularly if analyzed using an AI system which avoids human inaccuracy and considers multiple variables and data sources at once in real-time.
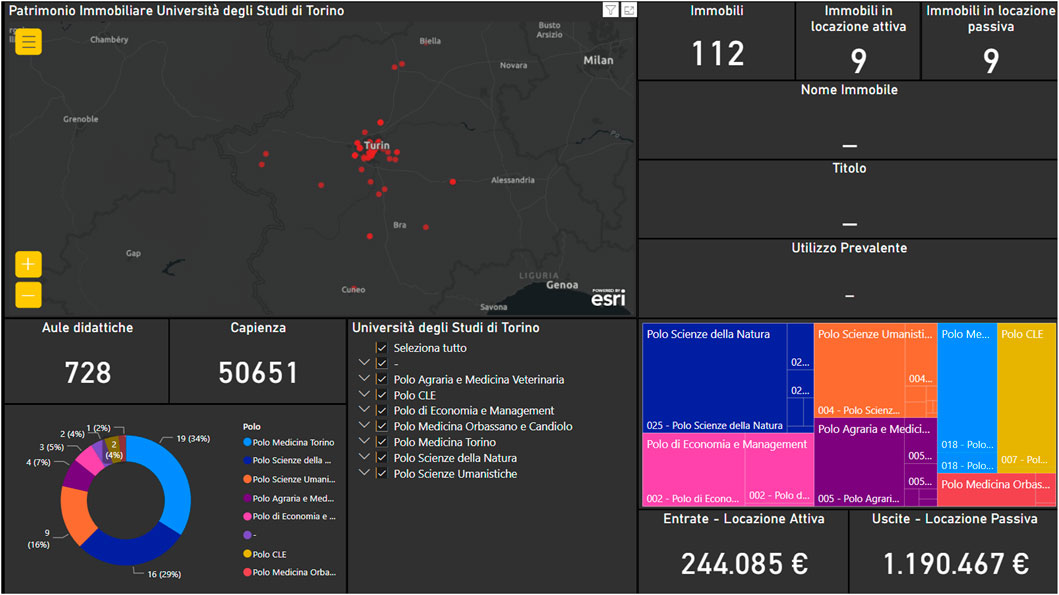
FIGURE 9. Overall analytic dashboard of UniTO asset with information filtered by the educational pole.
Then, other dashboards were developed to analyze the first demonstrator level of occupancy and space exploitation (Figure 10) at each floor and then replicated for the second demonstrator (Figure 11) with following data for each room that can be filtered based on hosted courses or academic year.
- interactive map of the floor,
- room name,
- net surface area,
- capacity,
- equipment,
- available and occupied hours for each academic semester,
- target indicators (percentage of use), and
- teaching hours for each semester.
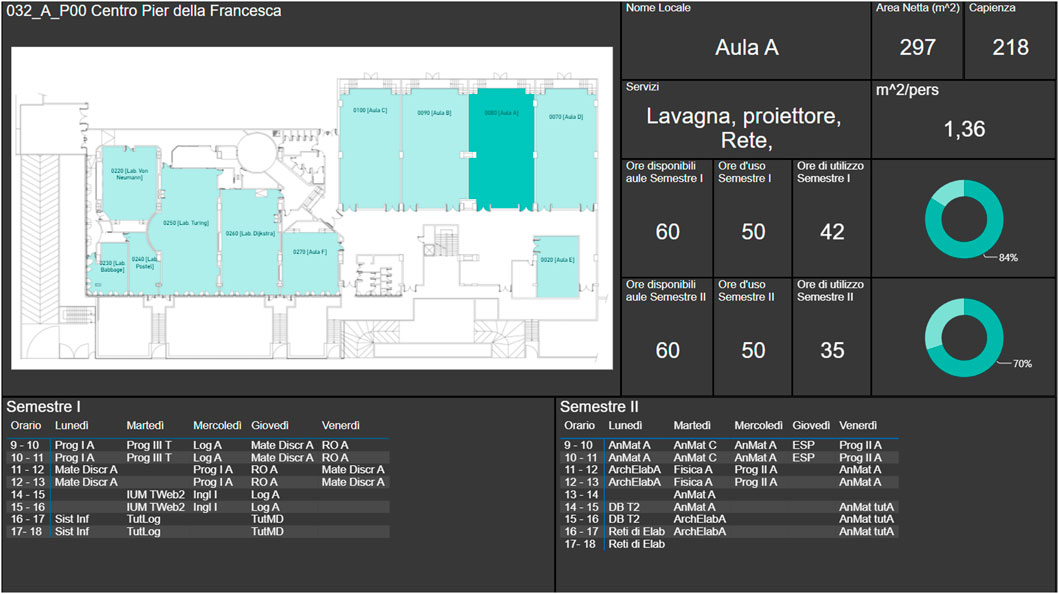
FIGURE 10. Example of space analysis dashboard for Piero della Francesca with hosted courses information.
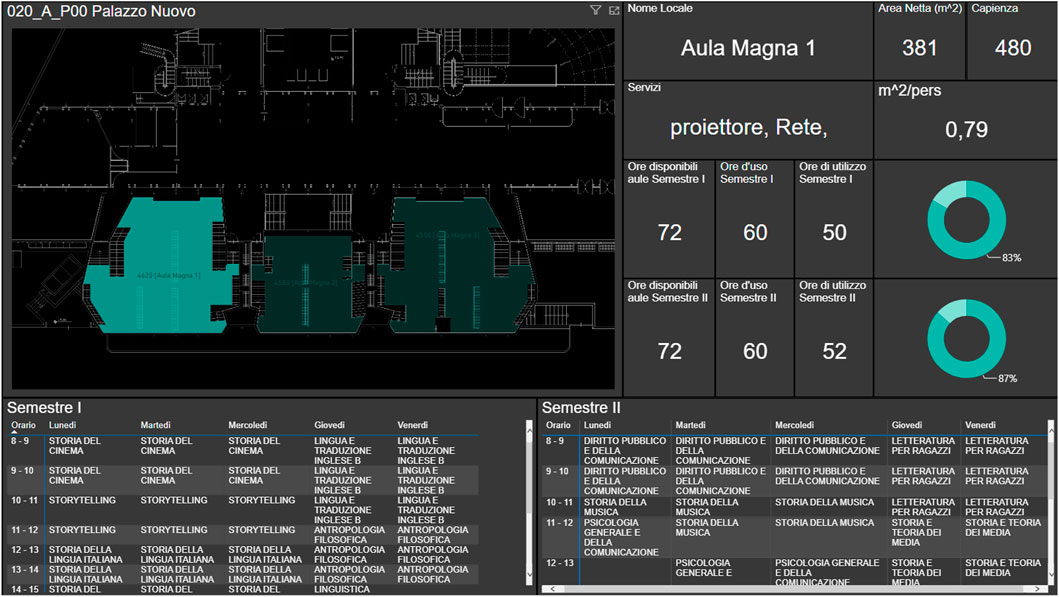
FIGURE 11. Example of space analysis dashboard for Palazzo Nuovo with hosted courses information.
In the case of a floor dedicated to teaching activities, the following information can be found and filtered:
- room name,
- net surface area,
- assigned staff,
- staff (without permanent contract),
- classification,
- tree diagram (classification filter), and
- ring diagram (classification [%]).
In conclusion, data previously fragmented or inaccessible, which prevented the exact awareness of space use and availability, are now integrated and visualized through dashboards also with information required for occupancy optimization. The analyses conducted so far highlighted some optimizing margins as currently some classrooms result underexploited, while others over-exploited with consequent users discomfort and expenses for renting additional spaces. Some crowded courses are assigned to inadequate spaces, leading students to sit in common spaces such as bleachers or the corridors between the desks. This is unacceptable for safety concerns as well; in fact, the already complex scenario derived from the crowd simulations conducted so far could be further compromised. Furthermore, by visualizing which spaces were partially used during the year, it will be possible to reduce rental expenses, raising awareness about the use of the classrooms and management costs (e.g., cleaning, maintenance, heating, and air conditioning) can be optimized. Now, the Educational Services Directorate and other administrations can easily view and consult such information for an optimal allocation of study courses based on the actual space availability.
As a first attempt to show the AMS app and centralized database application potential, crowd simulations have been conducted on Palazzo Nuovo to investigate the actual level of safety in case of fire emergency. The methodology defined in Section 3.2 was used to simulate different evacuation scenarios compliant with fire and safety prescriptive standards in order to identify limitations of a traditional approach and explore possible improvements through dynamic simulations and CDTs during evacuations.
First and foremost, national fire regulations were analyzed to define the reference escape time for each floor, TR. Italian Ministerial Decree 10/03/1998 provides regulatory prescriptions and limitations relevant both for new buildings and existing ones and identifies three possible buildings fire risk level: low, medium, or high. Palazzo Nuovo represents a university facility hosting more than 1,000 occupants, so its fire risk level is high (Italian Government, 1998). According to the regulation, TR can be individuated as the maximum escape time from each single floor, which enables the users to reach the nearest fire exit, leading either to external stairs or fire protected stairs. For the high fire-risk level, the simulation TR is equal to 1 min for escape routes between 15 and 30 m long (Italian Government, 1998). According to the literature review, the maximum moving crowds density considered is equal to 5 p/sqm.
Then, the crowd simulation model was defined including the six floors above the ground, with 1,765 users in full capacity using the same stairs, escape routes, and exits to reach the only two safe places at the ground floor. Specifically, the six stairs represent the escape routes for all the six levels and are placed two by two in the center and on the two opposite sides of the building (Figure 12). The basement floors are excluded as its occupants can use dedicated escape routes and exits, causing less worrying crowd phenomena. Similarly, the ground floor is excluded as most of the spaces’ exits lead directly to safe places. Accordingly, the simulation model involved the following elements:
• The six floors above the ground and their spaces;
• The ground floor with two safe places;
• The expected maximum occupants’ number in each space from fire emergency plans, their walking speed, field of view (FoV) angle, avoidance range, and avoidance preference. User speed is defined as a triangular distribution function of three speed values: high value of 1.75 m/s, medium value of 1.35 m/s, and low value of 0.8 m/s (Tack et al., 2006; Bohannon and Williams Andrews, 2011). The field of view angle and avoidance range were set equal to 75° and 10 m, considering the default settings of the simulation software, and the avoidance preference was set on right;
• The six staircases represent the escape routes (i.e., three protected and three external).
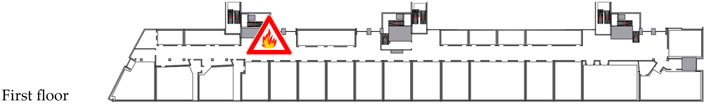
FIGURE 12. First floor plan with location of the hazardous event for the second scenario simulation.
The third step tackled the performance of the crowd simulations in two evacuation scenarios. The first one performed in the entire building section, the second one with a hypothesized hazardous event on the first floor, hosting the greatest number of users. The hazardous event is hypothesized in the area located in front of the two staircases on the left, preventing access to the two stairs for the users of the first floor (Figure 12).
The fourth step involved the density map analysis, at each floor of the building, during the simulation for the two crowd scenarios (Figures 13 and 14). Levels of density above five p/sqm are considered dangerous when detected in non-safe areas, that is, areas different from safe places and protected or external stairs. Considering the first scenario (Figure 13), only the first floor shows high risk levels of moving crowds and becoming considerably more crowded in relation to other floors.
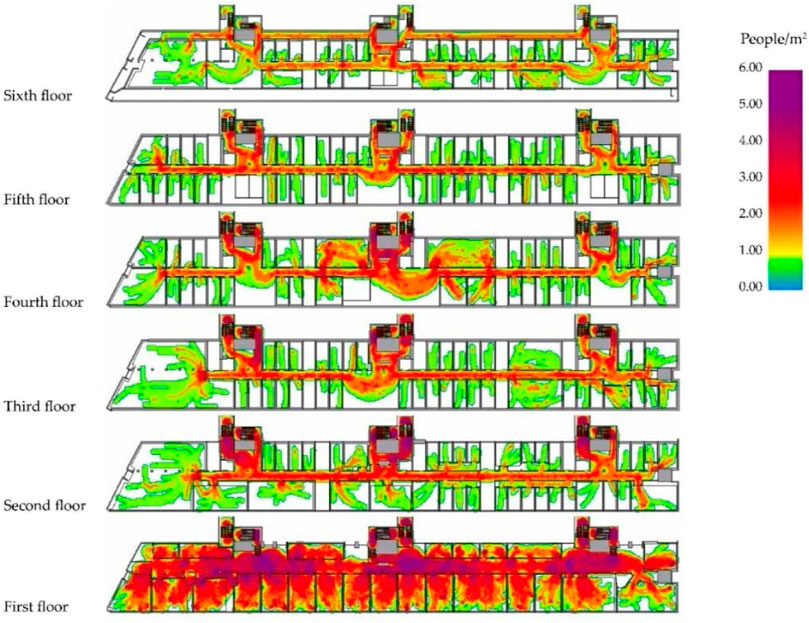
FIGURE 13. Density maps of crowd simulation of the first scenario.
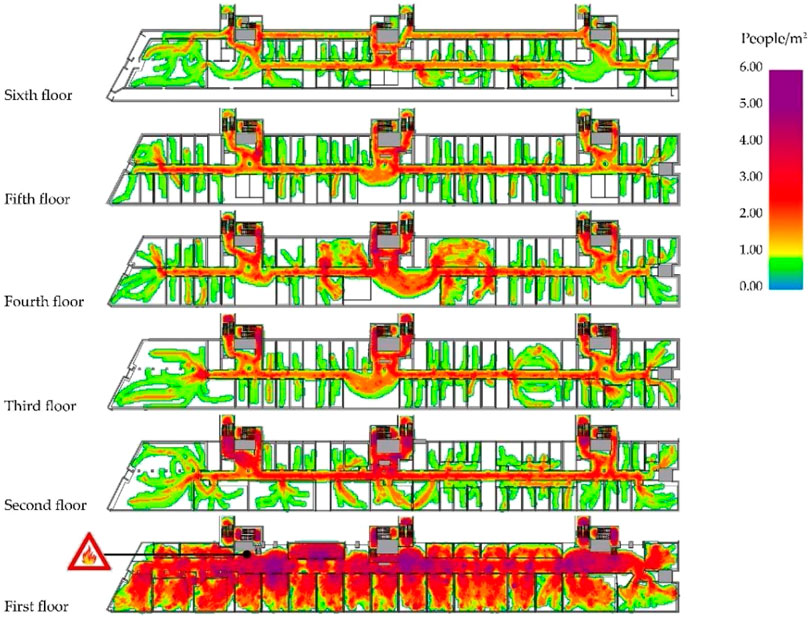
FIGURE 14. Density maps of crowd simulation of the second scenario.
The same results are seen in the second scenario (Figure 14). When comparing the first-floor density maps in the first and second scenario, in the latter, non-safe place area with density values over five p/sqm is 14.23% greater than in the former.
In the final step, each floor with detected density values over five p/sqm of the two scenarios has been analyzed. A value of Tn is defined for each floor as the time at which the first agent of the floor is triggered by the emergency alarm, ending when the last agent of the floor reaches the fire exit, which leads to a safe place or to the protected or external stairs. Each Tn for the two scenarios is then compared to the previously defined TR, equal to 1 min. The escape time of the first floor, in the first scenario, T1, and in the second scenario, T2, respectively is:
T1 = 12 min 52 s > TR (1 min); 12.86 time greater than TR
T2 = 15 min 48 s > TR (1 min); 15.80 times greater than TR
Comparing these, it shows T2>T1; in particular, T2 is 22.79% greater than T1.
These results highlighted the limits of using only prescriptive regulations to ensure building fire safety. Even though the maximum length of the escape routes defined according to regulations (i.e., between 15 and 30 m with high fire-risk level, corresponding to a TR of 1 min) should guarantee the correct evacuation at all the building levels to all users, the dynamic simulation highlighted criticalities due to user flows, resulting in overcrowding and an escape time far superior to prescribed values. In both scenarios, it exceeds the reference escape time, TR, provided by prescriptive regulations, while in the second one, it highlights the strong negative impact that a hazardous event can have, both on the evacuation and on the occurrence of dangerous phenomena.
Once the crowd simulations were completed, the set of significant data, which should be found in the database (e.g., TR, Tn, density values, walking speed, FoV angle, avoidance range, expected occupants, and avoidance preference), was identified. It will be fundamental both for future dynamic simulations aimed at defining the “fire emergency CDT” and to map the current asset fire-risk level through the AMS app. Furthermore, the actual occupation was individuated as the first, key data to be detected and provided in real-time through IoT networks. The current data set is clearly incomplete, so in the future, it should be enriched. For instance, it will be necessary to simulate and enter all the possible crowd evacuation routes at each floor. So, an ML algorithm could analyze and optimize them as simulations progress, and the CDTs could learn how to better behave; they should also be loaded into a VR system to implement active wayfinding.
A new type of dashboard was developed and integrated for fire safety analysis of each floor (Figure 15) and shows:
- the floor plan with occupancy levels,
- the floor plan with crowd simulation,
- the level of fire risk with respect to the regulations, and
- the maximum escape time and the effective one deriving from the simulation.
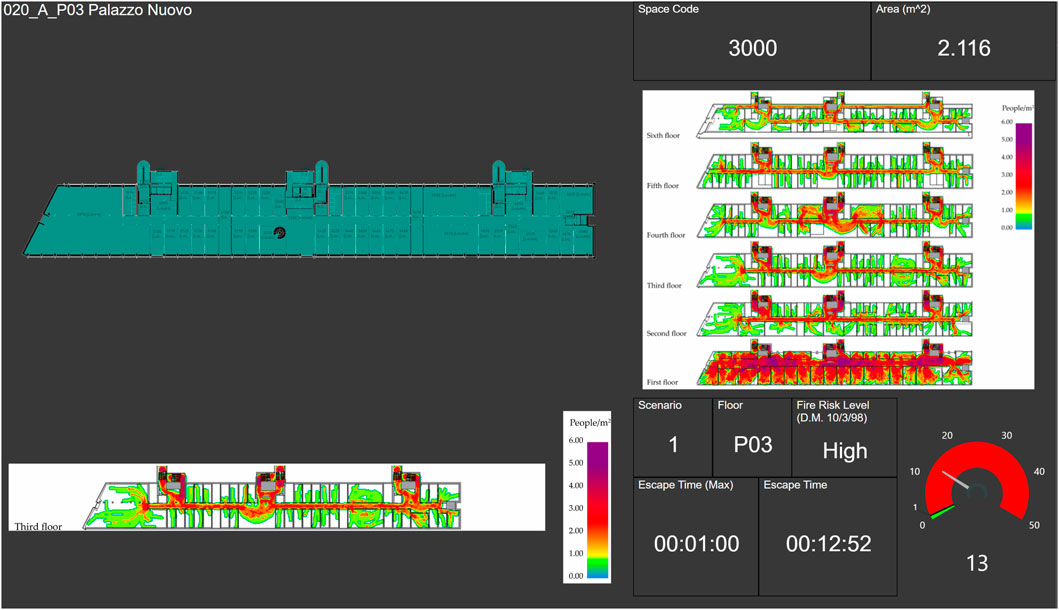
FIGURE 15. Example of space analysis dashboard for Palazzo Nuovo with hosted courses information.
6 Conclusion and further development
The paper tackled the development of BIM-GIS-based AMS for improving user experiences and the optimal use of resources in the O&M phase of the large and diffused UniTO asset.
The first short-term objective concerning the development of a replicable methodology, aimed at defining an AMS app based on a centralized and flexible database, was presented. The developed methodology was tested and tuned through two demonstrators with diverse levels of complexity. It was shown that the AMS app enables the visualization of the whole university building stock with its attributes and analytics dashboards using a 3D interactive map. Now, the AMS is limited to authoring formats, but in the future, open standards could be exploited to ensure greater BIM-GIS interoperability and flexibility. In addition, a deep analysis is needed to understand how automated data flow and analysis could be implemented exploiting ML.
Furthermore, the first steps toward the second long-term research objective are presented. It concerns the future development of CDTs aimed at several purposes, in order to define UniTO smart campus. This will enable real-time and quick decisions to resolve or prevent deviations from expected behaviors, both in ordinary scenarios and in fire emergency ones, improving campus resilience, safety, and sustainability. With this aim, a crowd simulation methodology is also provided. It was tested through the most complex demonstrator, highlighting limitations posed by current prescriptive regulations, in addition to checking the current fire-risk level and suitable evacuation time as a benchmark to evaluate possible future improvements. Required data which should be available from the centralized database and should also be provided through the implementation of IoT networks were individuated.
Future development concerns the fire-risk assessment of the whole UniTO asset through the reiteration of the developed crowd simulation methodology, providing a “fire risk map” using the AMS app. Administrators could obtain a quick overview of the asset fire-risk level, highlighting interventions needed and enabling to allocate space uses also depending on the safety level and the distance from rescuers. Additionally, it will be investigated how to implement AI and AR/VR systems to enable the cognitive features required by CDTs, enabling them to promptly react and adapt their behavior to environmental changes and to learn simulation by simulation, improving their performances. Furthermore, active wayfinding during fire scenarios could be provided, driving user evacuation through lighting signals and audio-based systems according to actual occupancy and real-time data from IoT networks. Users can be guided in real-time through the safest and shortest evacuation routes, using paths loaded in the AMS app and visualization systems, which enable active wayfinding through digital devices. The rescuers could use the AMS app to be alerted and obtain precise indications to reach the fire outbreak point or life in danger in the shortest possible time and path.
In conclusion, the developed AMS could overcome current fragmented and still document-based management issues, in addition to providing a suitable database to develop consistent CDTs both for ordinary and emergency scenarios in the O&M phase of a diffused campus. It could provide effective decisions and management processes based on complete, contextualized, and real-timed data, stored in a centralized and implementable database. Using synthetic dashboards and through BI tools linked to the AMS app, useful strategic data and graphs could be displayed. These features will enable better management of the university’s financial and spatial resources, with a reduction of waste and cost savings. It should be possible to 1) rationalize space use depending on the actual availability, courses timetables, and occupancy; 2) optimize real estate investments by visualizing over or under exploitation of both buildings and spaces; 3) optimally managing maintenance and cleaning operations concerning the actual space use; and 4) implementing dynamic and active management systems during the O&M phase, in particular during fire emergencies, both for users and rescuers. Challenges will concern IoT and AI implementation and connection to the AMS app, in addition to the development and interconnection of several CDTs, along with overcoming stakeholders’ hesitance to switch to new projects and collaborative approaches.
Data availability statement
The original contributions presented in the study are included in the article/Supplementary Material; further inquiries can be directed to the corresponding author.
Author contributions
SM conceived and coordinated the manuscript writing, wrote most of the sections, and supported the AMS app development. LP and ML contributed to conceive and structure the manuscript, they developed and implemented the crowd simulation methodology, and wrote the related sections. DA contributed to the development of the BIM-GIS AMS app and developed the centralized database and analytical dashboards. He wrote the related sections of the manuscript. LT supported the research project development and reviewed content and structure of the manuscript. GD conceived the research project, coordinated the working group, and revised the final document. MA developed the BIM-GIS AMS app and wrote the related sections.
Acknowledgments
The authors want to thank the University of Turin for the case study and collaboration and the BIM group laboratory from the DABC of Politecnico di Milano.
Conflict of interest
The authors declare that the research was conducted in the absence of any commercial or financial relationships that could be construed as a potential conflict of interest.
Publisher’s note
All claims expressed in this article are solely those of the authors and do not necessarily represent those of their affiliated organizations, or those of the publisher, the editors, and the reviewers. Any product that may be evaluated in this article, or claim that may be made by its manufacturer, is not guaranteed or endorsed by the publisher.
References
Abdullah, A., Thanoon, M., and Alsulami, A. (2019). Toward a smart campus using IoT: Framework for safety and security system on a University campus. Adv. Sci. Technol. Eng. Syst. J. 4 (5), 97–103. doi:10.25046/aj040512
Afsari, K., Eastman, C., and Shelden, D. (2017). Building information modeling data interoperability for cloud-based collaboration: Limitations and opportunities. Int. J. Archit. Comput. 15 (3), 187–202. doi:10.1177/1478077117731174
Al Faruque, M. A., Muthirayan, D., Yu, S. Y., and Khargonekar, P. P. (2021). “Cognitive digital twin for manufacturing systems,” in Proceedings -design, automation and test in europe, DATE (Virtual conference: Institute of Electrical and Electronics Engineers Inc.), 440–445.
Al-saggaf, A., and Jrade, A. (2015). “Benefits of integrating BIM and GIS in construction management and control,” in Proceedings of ICSC’15: The Canadian society for civil engineering 5th international/11th construction specialty conference, 1–10.
Almeida, J. E., Rosseti, R. J. F., and Coelho, A. L. (2013). Crowd simulation modeling applied to emergency and evacuation simulations using multi-agent systems. ArXiv preprint.
Alonso-Marroquín, F., Busch, J., Chiew, C., Lozano, C., and Ramírez-Gómez, Á. (2014). Simulation of counterflow pedestrian dynamics using spheropolygons. Phys. Rev. E 90 (6), 063305–063312. doi:10.1103/physreve.90.063305
Annuar, K. A. M., Zin, M. H. M., Harun, M. H., Halim, M. F. M. A., and Azahar, A. H. (2016). Design and development of search and rescue robot. Int. J. Mech. Mechatronics Eng. 16 (2), 36–41.
Austin, M., Delgoshaei, P., Coelho, M., and Heidarinejad, M. (2020). Architecting smart city digital twins: Combined semantic model and machine learning approach. J. Manage. Eng. 36 (4). doi:10.1061/(asce)me.1943-5479.0000774
Bahamid, A., Ibrahim, A. M., Ibrahim, A., Zahurin, I. Z., and Wahid, A. N. (2020). Intelligent robot-assisted evacuation: A review. J. Phys. Conf. Ser. 1706 (1), 012159. doi:10.1088/1742-6596/1706/1/012159
Batty, M. (2018). Digital twins. Environ. Plan. B Urban Anal. City Sci. 45 (5), 817–820. doi:10.1177/2399808318796416
Berlonghi, A. E. (1995). Understanding and planning for different spectator crowds. Saf. Sci. 18 (4), 239–247. doi:10.1016/0925-7535(94)00033-y
Biedermann, D. H., Torchiani, C., Kielar, P. M., Willems, D., Handel, O., Ruzika, S., et al. (2016). A hybrid and multiscale Approach to model and simulate mobility in the context of public events. Transp. Res. Procedia 19, 350–363. doi:10.1016/j.trpro.2016.12.094
Bohannon, R. W., and Williams Andrews, A. (2011). Normal walking speed: A descriptive meta-analysis. Physiotherapy 97 (3), 182–189. doi:10.1016/j.physio.2010.12.004
Boje, C., Guerriero, A., Kubicki, S., and Rezgui, Y. (2020). Towards a semantic construction digital twin: Directions for future research. Automation Constr. 114, 103179. doi:10.1016/j.autcon.2020.103179
Bolton, A., Butler, L., Dabson, I., Enzer, M., Evans, M., Fenemore, T., et al. (2018). Gemini Principles. Centre for Digital Built Britain. doi:10.17863/CAM.32260
Bosch, A., Volker, L., and Koutamanis, A. (2014). BIM in the operations stage: bottlenecks and implications for owners. Built Environment Project and Asset Management 5 (3), 331–343. doi:10.1108/BEPAM-03-2014-0017
Boukas, E., Kostavelis, I., Gasteratos, A., and Sirakoulis, G. C. (2015). Robot guided crowd evacuation. IEEE Trans. Autom. Sci. Eng. 12 (2), 739–751. doi:10.1109/tase.2014.2323175
Bryde, D., Broquetas, M., and Volm, J. M. (2013). The project benefits of building information modelling (BIM). Int. J. Proj. Manag. 31 (7), 971–980. doi:10.1016/j.ijproman.2012.12.001
Centre for Digital Built Britain (2022). National digital twin programme centre for digital built Britain. Available: https://www.cdbb.cam.ac.uk/what-we-do/national-digital-twin-programme.
Chagnon-Lessard, N., Gosselin, L., Barnabe, S., Bello-Ochende, T., Fendt, S., Goers, S., et al. (2021). Smart campuses: Extensive review of the last decade of research and current challenges. IEEE Access 9, 124200–124234. doi:10.1109/access.2021.3109516
Chen, K., Lu, W., Peng, Y., Rowlinson, S., and Huang, G. Q. (2015). Bridging BIM and building: From a literature review to an integrated conceptual framework. Int. J. Proj. Manag. 33 (6), 1405–1416. doi:10.1016/j.ijproman.2015.03.006
Chu, M. L., Parigi, P., Latombe, J. C., and Law, K. H. (2014). Simulating effects of signage, groups, and crowds on emergent evacuation patterns. AI Soc. 30 (4), 493–507. doi:10.1007/s00146-014-0557-4
Corneli, A., Naticchia, B., Carbonari, A., and Vaccarini, M. (2021). “A framework for development and integration of digital twins in construction,” in Ecppm 2021 – eWork and eBusiness in architecture, engineering and construction, 291–298.
Date, P. (2009). Integrating BIM and GIS for large-scale facilities asset management : A critical review.
De Angelis, E., Ciribini, A. L. C., Tagliabue, L. C., and Paneroni, M. (2015). The brescia smart campus demonstrator. Renovation toward a zero energy classroom building. Procedia Eng. 118, 735–743.
Deng, T., Zhang, K., Shen, Z. J., and Max), (2021). A systematic review of a digital twin city: A new pattern of urban governance toward smart cities. J. Manag. Sci. Eng. 6 (2), 125–134. doi:10.1016/j.jmse.2021.03.003
Desogus, G., Quaquero, E., Sanna, A., Gatto, G., Tagliabue, L. C., Rinaldi, S., et al. (2017). “Preliminary performance monitoring plan for energy retrofit: A cognitive building: The ‘mandolesi pavillon’ at the university of cagliari,” in 2017 AEIT international annual conference: Infrastructures for energy and ICT: Opportunities for fostering innovation (Cagliari: AEIT), 1–6. (Accessed September 2017).
Di Giuda, G. M., Grecchi, M., Villa, V., Locatelli, M., and Pellegrini, L. (2019). Engineering and management of information modeling requirements. TEMA 5 (2), 137–146.
Dong, Z. Y., Zhang, Y., Yip, C., Swift, S., and Beswick, K. (2020). Smart campus: Definition, framework, technologies, and services. IET Smart Cities 2 (1), 43–54. doi:10.1049/iet-smc.2019.0072
Du, J., Ph, D., Asce, Aff M., Zhu, Q., Shi, Y., Wang, Q., et al. (2020). [Remain true to our original aspiration and strive for excellence]. Proof Concept 36 (2), 1–2. doi:10.3760/cma.j.issn.0578-1310.2020.01.001
Eastman, C. M., Eastman, C., Teicholz, P., Sacks, R., and Liston, K. (2011). BIM handbook: A guide to building information modeling for owners, managers, designers, engineers and contractors. John Wiley and Sons. Hoboken, New Jersey: Managers. Hoepli.
Enshasy, H., Al-saleh, M., and Bu-shalf, A. (2019). A comprehensive design of unmanned ground search and rescue robot. J. Inf. Comput. Sci. 14 (1), 52–80.
Fan, C., Zhang, C., Yahja, A., and Mostafavi, A. (2021). Disaster city digital twin: A vision for integrating artificial and human intelligence for disaster management. Int. J. Inf. Manag. 56, 102049. doi:10.1016/j.ijinfomgt.2019.102049
Fariz, and Saračević (2017). Slideshare: Cognitive digital twin by fariz Saračević. [Online] Available: https://de.slideshare.net/BosniaAgile/cognitive-digital-twin-by-fariz-saraevi.
Floros, G. S., and Ellul, C. (2021). “LOSS of INFORMATION during design & construction for highways asset management: A GeoBIM perspective,” in ISPRS annals of the photogrammetry, remote sensing and spatial information sciences (Copernicus GmbH, 83–90.
Fruin, J. J. (1993). “The causes and prevention of crowd disasters,” in First international conference on engineering for crowd safety (London, England: Elsevier Science Publishers B.B.), 1–10.
Garramone, M., Moretti, N., Scaioni, M., Ellul, C., Re Cecconi, F., and Dejaco, M. C. (2020). “BIM and GIS integration for infrastructure asset management: A bibliometric analysis,” in ISPRS annals of the photogrammetry, remote sensing and spatial information sciences, 77–84. VI-4/W1-2020(4/W1).
Grieves, M. W., and Vickers, J. (2017). “Digital twin: Mitigating unpredictable, undesirable emergent behavior in complex systems,” in Transdisciplinary perspectives on complex systems: New findings and approaches, 85–113.
Haase, K., Kasper, M., Koch, M., and Müller, S. (2019). A pilgrim scheduling approach to increase safety during the Hajj. Operations Res. 67 (2), 376–406. doi:10.1287/opre.2018.1798
Hashem, I. A. T., Chang, V., Anuar, N. B., Adewole, K., Yaqoob, I., Gani, A., et al. (2016). The role of big data in smart city. Int. J. Inf. Manage. 36 (5), 748–758. doi:10.1016/j.ijinfomgt.2016.05.002
Heaton, J., and Parlikad, A. K. (2020). Asset information model to support the adoption of a digital twin: West cambridge case study. IFAC-PapersOnLine 53 (3), 366–371. doi:10.1016/j.ifacol.2020.11.059
Hughes, R., Ondřej, J., and Dingliana, J. (2015). “Davis: Density-adaptive synthetic-vision based steering for virtual crowds,” in Proceedings of the 8th ACM SIGGRAPH conference on motion in games (aris France: MIG), 79–84. (Accessed November 16-18, 2015).
Ibrahim, A. M., Venkat, I., Subramanian, K. G., Khader, A. T., and De Wilde, P. (2016). Intelligent evacuation management systems: A review. ACM Trans. Intell. Syst. Technol. 7 (3), 361–427. doi:10.1145/2842630
Ijaz, K., Sohail, S., and Hashish, S. (2015). “A survey of latest approaches for crowd simulation and modeling using hybrid techniques,” in 17th UKSIM-AMSS international conference on modelling and simulation, 111–116.
Ikeda, Y., and Inoue, M. (2016). “An evacuation route planning for safety route guidance system after natural disaster using multi-objective genetic algorithm,” in Procedia computer science, 1323–1331.
Ismagilova, E., Hughes, L., Dwivedi, Y. K., and Raman, K. R. (2019). Smart cities: Advances in research—an information systems perspective. Int. J. Inf. Manag. 47, 88–100. doi:10.1016/j.ijinfomgt.2019.01.004
Italian Government (1998). Testo coordinato del DM 10 marzo 1998 Criteri generali di sicurezza antincendio e per la gestione dell’emergenza nei luoghi di lavoro. Italy.
Jiang, C., Ni, Z., Guo, Y., and He, H. (2016). “Robot-assisted pedestrian regulation in an exit corridor,” in IEEE international conference on intelligent robots and systems (Daejeon, Korea: IEEE), 815–822.
Jiang, F., Ma, L., Broyd, T., and Chen, K. (2021). Digital twin and its implementations in the civil engineering sector. Automation Constr. 130, 103838. doi:10.1016/j.autcon.2021.103838
Johnson, N. R., Feinberg, W. E., and Johnson, D. M. (1994). “Microstructure and panic: The impact of social bonds on individual action in collective flight from the Beverly Hills Supper Club Fire,” in Disasters, collective behaviour and social organization. Editors R. R. Dynes, and K. J. Tierney (Newark: University of Delaware Press), 168–189.
Johnson, N. R. (1987). Panic at the who concert stampede: An empirical assessment. Soc. Probl. 34 (4), 362–373. doi:10.1525/sp.1987.34.4.03a00040
Jones, D., Snider, C., Nassehi, A., Yon, J., and Hicks, B. (2020). Characterising the digital twin: A systematic literature review. CIRP J. Manuf. Sci. Technol. 29, 36–52. doi:10.1016/j.cirpj.2020.02.002
Kasereka, S., Kasoro, N., Kyamakya, K., Doungmo Goufo, E. F., Chokki, A. P., and Yengo, M. V. (2018). “Agent-Based Modelling and Simulation for evacuation of people from a building in case of fire,” in 9th international conference on ambient systems, networks and technologies, 10–17.
Khamis, N., Selamat, H., and Yusof, R. (2014). Simulation of agent movement with a path finding feature based on modification of physical force approach. Appl. Comput. Sci., 38–43.
Kirchhof, J. C., Michael, J., Rumpe, B., Varga, S., and Wortmann, A. (2020). “Model-driven digital twin construction: Synthesizing the integration of cyber-physical systems with their information systems,” in Proceedings - 23rd ACM/IEEE international conference on model driven engineering languages and systems (Canada: MODELS), 90–101. (Accessed October 16-23, 2020).
Klügl, F., Klubertanz, G., and Rindsfüser, G. (2009). “Agent-based pedestrian simulation of train evacuation integrating environmental data,” in KI 2009: Advances in artificial intelligence. Editors B. Mertsching, M. Hund, and Z. Aziz (Berlin, Heidelberg: Springer Berlin Heidelberg), 631–638.
Kobes, M., Helsloot, I., de Vries, B., and Post, J. G. (2010). Building safety and human behaviour in fire: A literature review. Fire Saf. J. 45 (1), 1–11. doi:10.1016/j.firesaf.2009.08.005
Kuligowski, E. D., and Gwynne, S. M. V. (2010). The need for behavioral theory in evacuation modeling. Pedestr. Evacuation Dyn. 2008, 721–732.
Laakso, M., and Kiviniemi, A. (2012). The IFC standard-A review of history, development, and standardization requirements management interface to building product models view project BIM and knowledge based risk management system view project. Article in Electronic Journal of Information Technology in Construction.
Lee, D., and Lee, S. (2021). Digital twin for supply chain coordination in modular construction. Appl. Sci. (Basel). 11 (13), 5909. doi:10.3390/app11135909
Lindkvist, C. (2015). Contextualizing learning approaches which shape BIM for maintenance. Built Environment Project and Asset Management 5 (3), 318–330. doi:10.1108/BEPAM-03-2014-0018
Liu, M., and Lo, S. M. (2011). The quantitative investigation on people’s pre-evacuation behavior under fire. Automation Constr. 20 (5), 620–628. doi:10.1016/j.autcon.2010.12.004
Liu, X., Wang, X., Wright, G., Cheng, J. C. P., Li, X., and Liu, R. (2017). A state-of-the-art review on the integration of building information modeling (BIM) and geographic information system (GIS). ISPRS Int. J. Geoinf. 6, 53. doi:10.3390/ijgi6020053
Liu, Y., and Kaneda, T. (2020). Using Agent-based Simulation for Safety: Fact-finding about a crowd accident to improve public space design. Collect. Dyn. 5, A88. doi:10.17815/cd.2020.88
López, A., Chaumette, F., Marchand, E., and Pettré, J. (2019). Character navigation in dynamic environments based on optical flow. Comput. Graph. Forum 38 (2), 181–192. doi:10.1111/cgf.13629
Løvås, G. G. (1998). Models of wayfinding in emergency evacuations. Eur. J. Operational Res. 105 (3), 371–389. doi:10.1016/s0377-2217(97)00084-2
Love, P. E. D., and Matthews, J. (2019). The ‘how’ of benefits management for digital technology: From engineering to asset management. Automation Constr. 107, 102930. doi:10.1016/j.autcon.2019.102930
Lovreglio, R., Borri, D., Dell’Olio, L., and Ibeas, A. (2014a). A discrete choice model based on random utilities for exit choice in emergency evacuations. Saf. Sci. 62, 418–426. doi:10.1016/j.ssci.2013.10.004
Lovreglio, R., Fonzone, A., Dell’Olio, L., Borri, D., and Ibeas, A. (2014b). “The role of herding behaviour in exit choice during evacuation,” in Procedia - social and behavioral sciences (Elsevier B.V.), 390–399.
Lu, J., Zheng, X., Gharaei, A., Kalaboukas, K., and Kiritsis, D. (2020). Cognitive twins for supporting decision-makings of internet of things systems. Lect. Notes Mech. Eng., 105–115. doi:10.1007/978-3-030-46212-3_7
Lu, Q., Parlikad, A. K., Woodall, P., Don Ranasinghe, G., Xie, X., Liang, Z., et al. (2020). Developing a digital twin at building and city levels: Case study of west cambridge campus. J. Manage. Eng. 36 (3), 05020004. doi:10.1061/(asce)me.1943-5479.0000763
Lytras, M. D., and Visvizi, A. (2021). Information management as a dual-purpose process in the smart city: Collecting, managing and utilizing information. Int. J. Inf. Manag. 56, 102224. doi:10.1016/j.ijinfomgt.2020.102224
Ma, Z., and Ren, Y. (2017). “Integrated application of BIM and GIS: An overview,” in Procedia engineering. No longer published by elsevier, 1072–1079.
Mirahadi, F., McCabe, B., and Shahi, A. (2019). IFC-centric performance-based evaluation of building evacuations using fire dynamics simulation and agent-based modeling. Automation Constr. 101, 1–16. doi:10.1016/j.autcon.2019.01.007
Moretti, N., Ellul, C., Re Cecconi, F., Papapesios, N., and Dejaco, M. C. (2021). GeoBIM for built environment condition assessment supporting asset management decision making. Automation Constr. 130, 103859. doi:10.1016/j.autcon.2021.103859
Moretti, N., Xie, X., Merino, J., Brazauskas, J., and Parlikad, A. K. (2020). An openBIM approach to IoT integration with incomplete as-built data. Appl. Sci. 10, 8287. doi:10.3390/app10228287
Moussaïd, M., Helbing, D., and Theraulaz, G. (2011). How simple rules determine pedestrian behavior and crowd disasters. Proc. Natl. Acad. Sci. U. S. A. 108 (17), 6884–6888. doi:10.1073/pnas.1016507108
Murphy, R. R., Tadokoro, S., Nardi, D., Jacoff, A., Fiorini, P., Choset, H., et al. (2008). “Search and rescue robotics,” in Springer handbook of robotics. Editors B. Siciliano, and O. Khatib (Springer Berlin Heidelberg), 1151–1173.
Naticchia, B., Messi, L., and Carbonari, A. (2019). BIM-Based holonic system for real-time pathfinding in building emergency scenario. Proc. 2019 Eur. Conf. Comput. Constr. 1, 117–124.
National Infrastructure Commission (2017). Data for the public good. National Infrastructure Commission report.
Nical, A. K., and Wodynski, W. (2016). Enhancing facility management through BIM 6D. Procedia Engineering 164, 299–306. doi:10.1016/j.proeng.2016.11.623
Noardo, F., Harrie, L., Arroyo Ohori, K., Biljecki, F., Ellul, C., Krijnen, T., et al. (2020b). Tools for BIM-GIS integration (IFC georeferencing and conversions): Results from the GeoBIM benchmark 2019. ISPRS Int. J. Geoinf. 9 (9), 502. doi:10.3390/ijgi9090502
Noardo, F., Arroyo Ohori, K., Biljecki, F., Ellul, C., Harrie, L., Krijnen, T., et al. (2020a). “The ISPRS-EuroSDR GeoBIM benchmark 2019,” in International archives of the photogrammetry, remote sensing and spatial information sciences - ISPRS archives (International Society for Photogrammetry and Remote Sensing), 227–233. Available at: https://iris.polito.it/handle/11583/2856622?mode=simple
Ondrej, J., Pettré, J., Olivier, A., and Donikian, S. (2010). “A synthetic-vision based steering approach for crowd simulation,” in ACM transactions on graphics, association for computing machinery. SIGGRAPH 2010 Papers.
Opoku, D. G. J., Perera, S., Osei-Kyei, R., and Rashidi, M. (2021). Digital twin application in the construction industry: A literature review. J. Build. Eng. 40, 102726.
Pagliaro, F., Mattoni, B., Gugliermenti, F., Bisegna, F., Azzaro, B., Tomei, F., et al. (2016). “A roadmap toward the development of sapienza smart campus; A roadmap toward the development of sapienza smart campus,” in 2016 IEEE 16th international conference on environment and electrical engineering (EEEIC).
Pan, Y., and Zhang, L. (2021). A BIM-data mining integrated digital twin framework for advanced project management. Automation Constr. 124, 103564. doi:10.1016/j.autcon.2021.103564
Pang, C., and Szafron, D. (2014). “Single source of Truth (SSOT) for service oriented architecture (SOA),” in Lecture notes in computer science (including subseries lecture notes in artificial intelligence and lecture notes in bioinformatics). Berlin, Heidelberg: Springer, 575–589.
Pelechano, N., and Malkawi, A. (2007). “Comparison of crowd simulation for building evacuation and an alternative approach,” in Ibpsa 2007 - international building performance simulation Association2007, 1514–1521.
Portillo-Villasana, G. de J., Huerta-Barrientos, A., and Dillarza Andrade, Y. (2017). Effectiveness of physical barriers installation for prevention of incidents in Mexico city’s subway system. J. Industrial Eng. 2017, 1–8. doi:10.1155/2017/8125430
Proulx, G. (1997). Misconceptions about human behavior in fire emergencies. Canada: Canadian Consulting Engineer, 36–38.
Qiuchen Lu, V., Parlikad, A. K., Woodall, P., Ranasinghe, G. D., and Heaton, J. (2019). Developing a dynamic digital twin at a building level: Using Cambridge campus as case study. In International conference on smart infrastructure and construction 2019 (ICSIC) driving data-informed decision-making, 67–75.
Rea, M. S., Clark, F. R. S., and Ouellette, M. J. (1985). Photometric and psychophysical measurements of exit signs through smoke.
Roberts, C. J., Pärn, E. A., Edwards, D. J., and Aigbavboa, C. (2018). Digitalising asset management: Concomitant benefits and persistent challenges. Int. J. Build. Pathology Adapt. 36 (2), 152–173. doi:10.1108/ijbpa-09-2017-0036
Ruangpayoongsak, N., Roth, H., and Chudoba, J. (2005). “Mobile robots for search and rescue,” in Proceedings of the 2005 IEEE international workshop on safety, security and rescue robotics (Japan: Kobe), 212–217.
Sagun, A., Bouchlaghem, D., and Anumba, C. (2008). “Building design information and requirements for crowd safety during disasters,” in Building resilience achieving effective post-disaster reconstruction i-Rec.
Saloma, C., and Perez, G. J. (2007). “Herding in real escape panic,” in Pedestrian and evacuation dynamics 2005. Editors N. Waldau, P. Gattermann, H. Knoflacher, and M. Schreckenberg (Berlin, Heidelberg: Springer Berlin Heidelberg), 471–479.
Santos, G., and Aguirre, B. E. (2004). “A critical review of emergency evacuation simulation models,” in Building occupant movement during fire emergencies (Gaithersburg, Maryland: National Institute of Standards and Technology), 1–53.
Seghezzi, E., Locatelli, M., Pellegrini, L., Pattini, G., Di Giuda, G. M., Tagliabue, L. C., et al. (2021). Towards an occupancy-oriented digital twin for facility management: Test campaign and sensors assessment.
Selamat, H., Khamis, N., and Ghani, N. M. (2020). Crowd modeling and simulation for safer building design. Int. J. Electr. Comput. Eng. Syst. 11 (2), 77–88. doi:10.32985/ijeces.11.2.3
Shahat, E., Hyun, C. T., and Yeom, C. (2021). City digital twin potentials: A review and research agenda. Sustainability 13 (6), 3386. doi:10.3390/su13063386
Shan, L., Chang, L., Xu, S., Jiang, C., and Guo, Y. (2018). Robot-assisted pedestrian flow control of a controlled pedestrian corridor. Int. J. Adv. Robotic Syst. 15 (6), 172988141881469–11. doi:10.1177/1729881418814694
Shell, D. A., and Matarić, M. J. (2005). Insights toward robot-assisted evacuation. Adv. Robot. 19 (8), 797–818. doi:10.1163/1568553055011483
Shiwakoti, N., Sarvi, M., and Rose, G. (2008). “Modelling pedestrian behaviour under emergency conditions - state-of-the-art and future directions,” in 31st australasian transport research forum (Victoria, Australia: ATRF), 457–473.
Shkundalov, D., and Vilutienė, T. (2021). Bibliometric analysis of building information modeling, geographic information systems and web environment integration. Automation Constr. 128, 103757. doi:10.1016/j.autcon.2021.103757
Song, Y., Wang, X., Tan, Y., Wu, P., Sutrisna, M., Cheng, J. C. P., et al. (2017). Trends and opportunities of BIM-GIS integration in the architecture, engineering and construction industry: A review from a spatio-temporal statistical perspective. ISPRS Int. J. Geoinf. 6, 397. doi:10.3390/ijgi6120397
Still, K. G., Papalexi, M., Fan, Y., and Bamford, D. (2020). Place crowd safety, crowd science? Case studies and application. J. Place Manag. Dev. 13 (4), 385–407. doi:10.1108/jpmd-10-2019-0090
Still, K. G. (2011). Standing crowd density. Available: www.gkstill.com/Support/crowd-density/CrowdDensity-1.html.
Stojanović, L. (2020). Cognitive digital Twins: Challenges and opportunities for semantic technologies (keynote). Heraklion, Greece: Proceedings of the International Workshop in Semantic Digital Twins (SeDiT 2020), 1–2. (Accessed June 3, 2020).
Tack, G., Choi, J., Yi, J.-H., and Kim, C. H. (2006). “Relationship between jerk cost function and energy consumption during walking,” in IFMBE proceedings - world congress on medical physics and biomedical engineering 2006 (Seul, Korea: Coez).
Tang, B., Jiang, C., He, H., and Guo, Y. (2016). Human mobility modeling for robot-assisted evacuation in complex indoor environments. Trans. Human-Machine Syst. 46, 694–707.
Tavares, R. M. (2009). An analysis of the fire safety codes in Brazil: Is the performance-based approach the best practice? Fire Saf. J. 44 (5), 749–755. doi:10.1016/j.firesaf.2009.03.005
Teo, T. A., and Cho, K. H. (2016). BIM-oriented indoor network model for indoor and outdoor combined route planning. Adv. Eng. Inf. 30 (3), 268–282. doi:10.1016/j.aei.2016.04.007
The Dynamo Primer (2021). Primer.dynamobim. Available: https://primer.dynamobim.org/(Accessed on May 31st, 2022).
Villegas-Ch, W., Palacios-Pacheco, X., and Luján-Mora, S. (2019). Application of a smart city model to a traditional university campus with a big data architecture: A sustainable smart campus.
Wada, T., and Takahashi, T. (2013). “Evacuation guidance system using everyday use smartphones,” in Proceedings - 2013 international conference on signal-image technology and internet-based systems (SITIS 2013 IEEE), 860–864.
Wan, Z., Jiang, C., Fahad, M., Ni, Z., Guo, Y., and He, H. (2020). Robot-assisted pedestrian regulation based on deep reinforcement learning. IEEE Trans. Cybern. 50 (4), 1669–1682. doi:10.1109/tcyb.2018.2878977
Wang, H., Pan, Y., and Luo, X. (2019). Integration of BIM and GIS in sustainable built environment: A review and bibliometric analysis. Automation Constr. 103, 41–52.
Ward, Y., Morsy, S., and El-Shazly, A. (2021). “GIS-BIM data integration towards a smart campus,” in In:Design and Construction of Smart Cities (Springer, Cham), 132–139. doi:10.1007/978-3-030-64217-4_16
White, G., Zink, A., Codecá, L., and Clarke, S. (2021). A digital twin smart city for citizen feedback. Cities 110, 103064. doi:10.1016/j.cities.2020.103064
Withington, D. J. (2001). “Life saving applications of directional sound,” in Proceedings of the first international conference on pedestrian and evacuation dynamics. Editors M. Schreckenberg, and S. D. Sharma (Germany: Duisberg), 277–298.
Yamamura, S., Fan, L., and Suzuki, Y. (2017). “Assessment of urban energy performance through integration of BIM and GIS for smart city planning,” in Procedia engineering (Elsevier), 1462–1472.
Yang, S., Li, T., Gong, X., Peng, B., and Hu, J. (2020). A review on crowd simulation and modeling. Grap Mod. Elsevier, 111, 101081. doi:10.1016/j.gmod.2020.101081
Yi Rong, T., Akashah, F., and Mahyuddin, N. (2014). Agent-based fire evacuation model as a tool for fire safety design assessment in Malaysia. Int. J. Prop. Sci. 4 (1), 1–13. doi:10.22452/ijps.vol4no1.4
Yitmen, I., Alizadehsalehi, S., Akıner, I., and Akıner, M. E. (2021). An adapted model of cognitive digital Twins for building lifecycle management. Appl. Sci. 11, 4276, doi:10.3390/app11094276
Zaballos, A., Briones, A., Massa, A., Centelles, P., and Caballero, V. (2020). A smart campus’ digital twin for sustainable comfort monitoring. Stat. 12, 9196, doi:10.3390/su12219196
Zhang, H., Liu, H., Qin, X., and Liu, B. (2018). Modified two-layer social force model for emergency earthquake evacuation. Phys. A Stat. Mech. its Appl. 492, 1107–1119. doi:10.1016/j.physa.2017.11.041
Zhao, Y., Li, M., Lu, X., Tian, L., Yu, Z., Huang, K., et al. (2017). Optimal layout design of obstacles for panic evacuation using differential evolution. Phys. A Stat. Mech. its Appl. 465, 175–194. doi:10.1016/j.physa.2016.08.021
Zhao, Z., Shen, L., Yang, C., Wu, W., Zhang, M., and Huang, G. Q. (2021). IoT and digital twin enabled smart tracking for safety management. Comput. Oper. Res. 128, 105183. doi:10.1016/j.cor.2020.105183
Zhou, M., Dong, H., Ioannou, P. A., Zhao, Y., and Wang, F. Y. (2019). Guided crowd evacuation: Approaches and challenges. IEEE/CAA J. Autom. Sin. 6 (5), 1081–1094. doi:10.1109/jas.2019.1911672
Zhu, J., and Wu, P. (2021). Towards effective BIM/GIS data integration for smart city by integrating computer graphics technique.Remote Sens. 13, 1889, doi:10.3390/rs13101889
Zhu, Y., and Li, N. (2021). Virtual and augmented reality technologies for emergency management in the built environments: A state-of-the-art review. J. Saf. Sci. Resil. 2 (1), 1–10. doi:10.1016/j.jnlssr.2020.11.004
Keywords: BIM, GIS, asset management, operation and maintenance, smart campus, crowd simulation, digital twins, data integration
Citation: Meschini S, Pellegrini L, Locatelli M, Accardo D, Tagliabue LC, Di Giuda GM and Avena M (2022) Toward cognitive digital twins using a BIM-GIS asset management system for a diffused university. Front. Built Environ. 8:959475. doi: 10.3389/fbuil.2022.959475
Received: 01 June 2022; Accepted: 08 November 2022;
Published: 01 December 2022.
Edited by:
Salman Azhar, Auburn University, United StatesReviewed by:
Ebrahim Karan, Sam Houston State University, United StatesZia Din, University of Houston, United States
Muhammad Tariq Shafiq, United Arab Emirates University, United Arab Emirates
Copyright © 2022 Meschini, Pellegrini, Locatelli, Accardo, Tagliabue, Di Giuda and Avena. This is an open-access article distributed under the terms of the Creative Commons Attribution License (CC BY). The use, distribution or reproduction in other forums is permitted, provided the original author(s) and the copyright owner(s) are credited and that the original publication in this journal is cited, in accordance with accepted academic practice. No use, distribution or reproduction is permitted which does not comply with these terms.
*Correspondence: Silvia Meschini, c2lsdmlhLm1lc2NoaW5pQHBvbGltaS5pdA==