Generative design in civil construction: a case study in Brazil
 Luiz Henrique Oscar1
  Eduardo Linhares Qualharini
- 1Programa de Engenharia Urbana, Universidade Federal do Rio de Janeiro, Rio de Janeiro, Brazil
- 2Programa de Engenharia Ambiental, Universidade Federal do Rio de Janeiro, Rio de Janeiro, Brazil
The civil construction industry has a significant role in the socioeconomic development of a country and seeks to understand the emerging technologies of computational resources, such as artificial intelligence, and those that are inserted into the design processes, which influence the construction quality. This work investigates generative design, an approach to projects aided by algorithms. Recent new breakthroughs related to generative design have the potential to drastically change the methods of construction. This article provides a new view of building construction. Thus, through exploratory research based on application examples and a case study, this study presents the innovative aspects of generative design for construction projects.
1 Introduction
Civil construction plays an essential role in socioeconomic development in Brazil and the world, accounting for 13% of the world’s GDP and reaching annual expenditures of over 10 trillion dollars. Generally, buildings are constructed using processes that are difficult to control and have high imprecision, which makes it difficult to maintain construction according to what is planned in the design stages (RIBEIRINHO et al., 2020).
Despite its socio-economic relevance and in addition to the difficulties intrinsic to its nature, the complexity of construction suffers from productivity problems compared to other industries. If this difference were overcome, it would be possible to generate the equivalent of more than 1.6 trillion dollars, without considering the other benefits associated with the industry (MGI, 2017). As for the reasons for this deficiency, it can be highlighted that there has been a low integration of innovations that can transform different stages of production. These innovations have been absorbed by other sectors and increased their productivity. Among these main innovations are the automation and digitization of processes (BALAGUER and ABDERRAHIM, 2008; MGI, 2017; RIBEIRINHO et al., 2020).
In the present digital era, several technologies, mainly associated with information technology (IT), have transformed the production of industries. Although these transformations are still considered to be incipient in construction, recent research indicates that companies in the sector are moving towards breaking the paradigm of low productivity through these digital technologies (KPMG, 2017; CNI, 2018).
Over the past few years, population growth and urbanization have driven new construction. As a result, there was a significant reduction in available natural resources and consequent damage to the environment. Thus, finding solutions that optimize resources and minimize impacts are possible with adequate help from artificial intelligence (ALSAKKA et al., 2022).
Artificial intelligence (AI) is among the innovations set to revolutionize the construction sector. Such an application, which can reach different areas from planning and design to maintenance or demolition, has already reached revenues of over 400 million dollars in 2018 and has increasingly gained space in the market (Blanco et al., 2018; RESEARCH DIVE, 2020). Despite this, studies on AI in civil construction are considered insufficient due to the existence of patents and lack of effective use in the sector (TEIXEIRA; TEIXEIRA and ROCHA, 2020).
Combining emerging innovations, in particular, AI, and design tools leads to an increasingly effective application of computational resources in the generative design process in the Architecture, Engineering, and Construction (AEC) sector. In this way, however, a better understanding of this technology is needed to identify potential applications in construction projects.
The tools for a more productive approach in the construction sector are increasingly accessible through digital technologies (MGI, 2017). According to Microsoft News Center Brazil (2019), this technology is considered one of the main drivers of digital transformation, with great potential for the future of society and business. Microsoft also foresees benefits in the implementation of AI in Brazil: an increase in productivity by up to four times, GDP growth of up to 7.1% per year, generation of 26 million new jobs in the corporate services sector, and a 42% increase in jobs in the construction sector.
In a survey of the global construction market, KPMG International (2017) interviewed leaders of companies in the sector. According to the survey, 55% of respondents believe that the industry is ready to break the low-performance paradigm and 95% think that technologies and innovations will significantly transform their business. Furthermore, 72% of interviewees claimed that the use of data or innovations plays a relevant role in their companies’ strategy or vision, according to Figure 1. Therefore, the introduction of disruptive technologies is among the expectations for the future of construction, to improve its performance and change the situation of low innovation.

FIGURE 1. The opinion of companies about the future of construction.
Among the digital tools that transform industries, AI stands out, simply understood as a technology that uses a processing mechanism that simulates human intelligence. AI approaches are diverse, such as pattern recognition, genetic programming, advanced data analysis, and machine learning. In this way, the real applications are also numerous, such as image and audio recognition, natural language understanding, recommendation systems, and business insights based on massive amounts of data at short speeds.
Projects also influence the conduct of construction, according to Filippi (2015) The most common causes of delays in construction that are associated with the project, by the construction company or contractor, are as follows: insufficient data or poorly researched prepared project; the complexity of the project or its elaboration (or the project was underestimated); delay in the production of projects, due to the inexperience of the design team; errors and discrepancies with inadequate detail in blueprints; and, not using advanced design tools/software. Thus, the use of new tools can reduce the gap for the proper future of new constructions.
In these aspects, environments and programming languages in the last 10 years have been developed to facilitate their use by artists and designers. Thus, a new approach has become increasingly accessible: Algorithm Aided Design (AAD or Design Aided by Algorithms). In this approach, through algorithms (sets of logical rules that solve a problem), it is possible to generate and explore two-dimensional or three-dimensional, static, dynamic, or interactive models, represented through graphical visualization (MINEIRO, MAGALHAES, 2019). It is noteworthy, however, that AAD can still be understood as a subdivision of a broader concept of computer-aided design (CAD), after all, both are computer-aided processes (HUMPPI, O STERLUND, 2016).
While CAD is oriented towards the design of objects, buildings, or other static compositions, AAD introduces the algorithm as a design object for the creation of a process. In this way, there is the possibility of reaching original, unprecedented results that are still consistent with the determined parameters, in addition to admitting variations of these parameters to quickly explore other solutions. (MINEIRO, MAGALHAES, 2019). Therefore, AAD is more suitable for the project conception phases compared to CAD (KRISH, 79 2011).
Among the most common AAD applications are parametric design and generative design. In this joined method, the parameters mediate the design purpose and the system by guiding the options and limits of computational operations, triggering the drawings as outputs of this process (REAS; MCWILLIAMS, 2010 apud MINEIRO, MAGALHA ES, 2019). A simplification of this method is presented in Figure 2, where it is possible to use two parameters whose values are geometric and create another value through a relationship between them (AUTODESK, 2019).
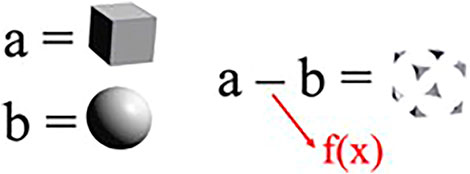
FIGURE 2. Simplification of the parametric design method.
Some AI techniques used in generative systems in AEC include GAs, graph-based machine learning, Boolean subtraction operation, rule-based systems, game-changing strategies, reinforced learning, generative adversarial networking, and multi-agent systems (BUHAMDAN et al., 2021).
Generative design arises from the idea of design inspired by nature and can be summarized as a process of joint creation between man and computer using systems supported by AI and operating similarly to those found in nature, by genetic codes and evolutionary processes. (SUDDO, 1994a; AUTODESK, 2020a).
One way to clarify the difference between the parametric and the generative is that, in the first, the computer has a passive role, completely depending on the designer, while in the second, the computer actively acts as a co-creator in the process (AUTODESK, 2019). The parametric is based on the relationship between geometry and parameters, propagated by algorithms but guided by the user who controls such parameters. The generative, of greater sophistication, allows this development of geometry to be even more guided by algorithms.
According to Humppi and O¨ sterlund (2016), BIM and AAD are approaches that were developed separately, but their features have been combined into new design tools. Thanks to this combination, it has been possible to generate and control object models through scripts (simpler and more direct instructions for executing a computer program) and integrate them into BIM tools. The generated item then becomes a geometry with embedded data, also called an object. In this way, the benefits of AAD and BIM can be applied in the same design and modeling process, as shown in Table 1.
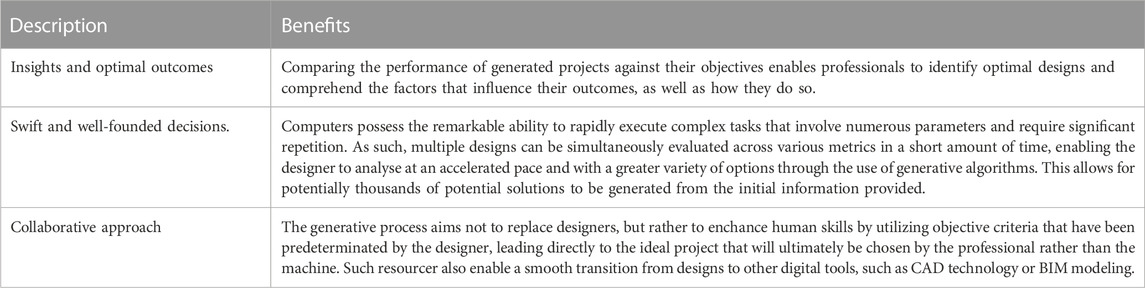
TABLE 1. Benefits of generative design.
2 The generative design
Generative design has different definitions among researchers. Considered one of the pioneers in the area, the Italian architect Celestino Soddu (1994) established that generative art is an idea formed by a genetic code, as in nature, but of an “artificial” character and that a generative process is morphogenetic, that is, it is related to the origin and determination of forms, which intervene in growth (MORFOGEˆ NESE, 2020). This process uses algorithms to produce unique and unrepeatable three-dimensional results as a result of the multiple expression of this generating idea, which, in turn, is identified by the designer as a subjectively viable proposal when it is executed.
In civil construction, the first works in the area of generative design were those of Nigel Cross in 1977. The architect studied the computational production of floor plans and suggested that algorithms could create drawings that would be, in some ways, better than those made by a person. He concluded that this technology should not replace designers, but make design knowledge more accessible, in addition to directing human efforts to situations in which they were indispensable and, thus, reducing costs. Due to advances in technology, it has become possible to apply generative design not only in the sphere of an enterprise but also at the urban planning level (TESTFIT, 2020), as shown in Figure 3.
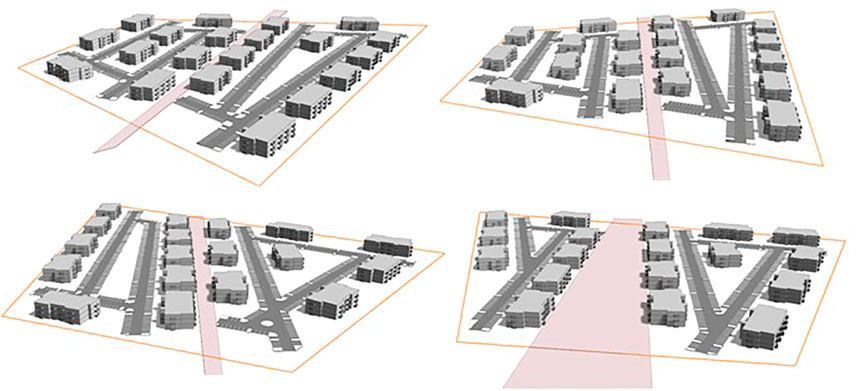
FIGURE 3. Illustration of design alternatives in urban planning made in generative design software (TESTFIT, 2021).
Recent computational and generative design approaches are flexible and quickly generate design options for estimates. This solution can optimize design options by varying input parameters. For example, generative design can be applied to verify design compliance in residential construction (SYDORA e STROULIA, 2020).
With the alignment of demands for sustainable solutions, resource savings and speed of response, several paths have emerged. Building systems have been used for architecture, engineering and urban design (BUHAMDAN et al., 2021). For ecological aspects in architecture, artificial intelligence has contributed to the maximization of natural light (EL SHEIKH e GERBER, 2011) and energy efficiency (ARAGHI e STOUFFS, 2015).
2.1 Properties
The main properties of generative systems, according to McCormack, Dorin, and Innocent (2004), are summarized as self-organization and self-assembly, where the system has the capacity for automatic organization and assembly, in which simple and independent systems, when combined, generate more complex ones, which can also interact with each other or produce elements on a large scale to solve a collective problem.
Self-repair and self-maintenance are characteristics of adapting to changes occurring in the environment to remain in a stable configuration, for a collective of decentralized and self-organized elements (called a swarm system), with a high degree of redundancy, and thus have the capacity to overcome individual or contingent obstacles, which, even if considerable, can be repaired and readjusted to offer conditions for continuity in the “project.”
There is innovation, because, in generative design, the designer does not directly manipulate the produced object, but creates and alters the rules and systems that generate it, adding to the evaluation criteria of that object, thereby controlling the generative behavior.
2.2 Generative design methodology in AEC
Generative design flow is based on 3 stages, i.e., generation, evolution, and evaluation, as indicated below.
The generation of design options is based on algorithms and parameters entered by the designer. At this stage, it is important to specify the restrictions and any other information that influences the elements of the desired result, such as the attributes of size, quantity, geometry, costs, or those related to the inserted environment, in addition to the relationships between them.
Evolution and evaluation is where the system seeks to discover in which direction the drawings should follow or evolve, and adapt. In this way, it is possible to restart the generative design flow if the designer considers it necessary and also learn how the process develops from each iteration and what changes can be made. Thus, according to the proposed methodology, there are four types of design generation studies based on the parameters: randomize, cross-product, optimize, and “like this.” These types of studies are illustrated in Figure 4.
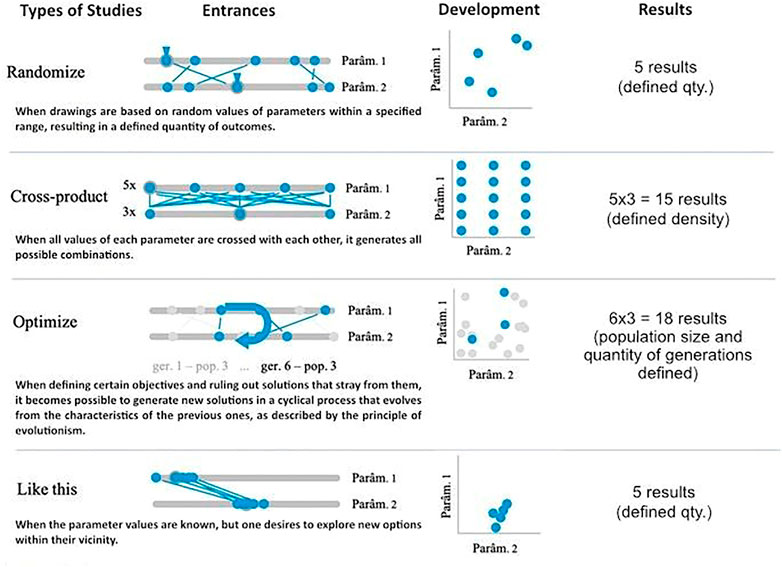
FIGURE 4. Types of generation study (AUTODESK, 2019).
When choosing the type, it is important to consider the number of parameters, the level of certainty of their values or their desired limitation, and also to consider the expected number of results to be analyzed at the end of the study.
Post-flow—After the generative design stage, the selection of the design to be used is carried out, where the designer explores and compares the generated designs, and investigates and supervises the results. By choosing the best option, the user can further integrate it into an existing project or broader design work, or manually refine it.
To conduct an exploration of potential solutions, it is recommended to identify which features are critical, such as three-dimensional visualizations, graphs, or tabulated data. The target public to which the solutions will be presented should also be considered, that is, the characteristics of the customers and other stakeholders who have decision-making power, in addition to balancing the number of solutions in such a way that it is neither insufficient nor in excess, which would make the process tiring.
To detail the methodology, each action carried out in the generative design flow and the post-flow can also be understood in three phases: a) definition: under the responsibility of the designer, this is the stage that the algorithms, in the logic of drawing formation, with rules and restrictions, are imputed; b) execution: this is when the algorithms are executed and can start creating several design alternatives; c) result: finally, the results generated after the execution are obtained and will serve as input for the following stages. The diagram in Figure 6 summarizes the presented methodology, with the steps and the relationships between them.
As an illustrative object, Figure 5 shows a drawing of a window with the integration characteristics for a given need in a model house.
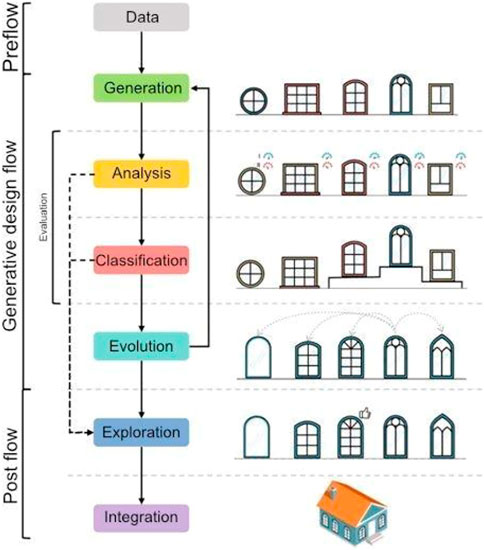
FIGURE 5. Illustration of the methodology with the design of a window (adapted from AUTODESK, 2019).
At the end of this iterative process, the final design is chosen from among the potential solutions, but in situations where the best solution is very predictable, obvious, or indisputable, a generative process becomes unnecessary as its great advantage is analyzing criteria and conflicting elements immersed in a certain level of complexity.
3 Case study
This section presents a hypothetical project as a case study of the use of generative design in civil construction. The case comprises an analysis of the initial design of projects located in the port area of Rio de Janeiro using the TestFit software. After a new search for generative programs aimed at civil construction that are available on the market, the TestFit software, from the company TestFit Inc., was found. The company is headquartered in Texas, United States, and proved to be a good alternative for this use case. The program’s function is to generate the initial design phase and financial viability for single-family or multi-family homes or commercial buildings. It is also possible to analyze designs at an urbanistic level, developing studies of the subdivision of a region.
The TestFit program for generative design is divided into four main panels, as shown in Figure 6. The upper left panel allows one to navigate between different projects created and the general characteristics of each project, such as the zoning conditions (zoning), financial data for creating negotiation alternatives (deals), the constructive characteristics related to the units (units), and the building as a whole (building), among others. For each of these project characteristics, the lower left panel expands and allows the editing of several fields, such as the general typology of the development or more detailed data, such as the height of the floors.

FIGURE 6. TestFit software overview.
As for projects, the program uses construction designs with pre-defined properties, called presets. The use of a preset is mandatory because it is from there that the algorithm seeks to optimize a solution. However, one can edit existing presets and thus create new ones whose properties are what one wants.
In Figure 6, there is a large upper right panel in which all graphic resources are located, such as 3D visualization or 2D plan, in addition to allowing the definition and editing of the boundary lines of the generative areas (sites). Finally, the lower right panel comprises the different generation outputs of the projects, such as the characteristics of the built-up area or the number of units per area for each site (tabulation), and the financial results in general (development). The construction options are generated along with a chart that allows a comparison between them considering main indicators (schemes) and other information.
The generative capacity of the TestFit software stands out among its other advantages, which, despite being based on parametric scripts, dispenses with the explicit development of these scripts due to its graphical interface, streamlining the user’s understanding and learning. The program also makes it possible to manipulate a vast set of construction characteristics, has a fast algorithm for generating solutions, and allows one to view, edit, and compare construction alternatives.
On the other hand, there are some general limitations in the design of this software. Its development is aimed at the Texas real estate market and, therefore, the configurations of pre-existing buildings (presets) are of local constructive typologies. However, it is possible to create new configurations. As for the data, despite the editable input values, the attributes themselves are not, as well as the output indicators that evaluate the solutions.
Another factor that differentiates TestFit from what was observed in this study is that different solutions are not automatically developed and are not evaluated by the criteria of the software itself to create new and improved alternatives based on it without human intervention. In this case, a single optimized solution is generated and the iterative process takes place by direct manual evaluation, based on the outputs, and by changing the manually editable parameters. Therefore, considering the type of generative study, it is close to the so-called “like this” type, in which it is possible to evolve the project by changing the parameters of explicit values.
While learning to use the program, a minimum restriction on the size of the sites (generative zones) was discovered so that the algorithm can optimize an adequate solution for certain types of buildings. This restriction does not have an explicit value because it can vary according to some chosen parameters. However, through some manual tests, it was understood that distances above 60 m allow a solution based on any existing constructive preset.
Once the generative potential of the software was understood, it was possible to define some criteria for choosing a location within the city of Rio de Janeiro, where the study will be carried out. These criteria are as follows: the dimensions need to be large enough so they do not prevent the algorithm from generating solutions based on any preset, i.e., generative zones of dimensions greater than 60 m; there must be known zoning restrictions and, although they condition the solutions to explore the optimization potential of the algorithm, they should not be excessive to strongly limit the generative options.
The defined region that complies with the aforementioned criteria is located in the neighborhood of Santo Cristo, in the port area of Rio de Janeiro. The area corresponds to the entire subsector D2 and is contained in sector D, in the Mixed Use Zone, incentivized macrozone, and Administrative Region I (RIO DE JANEIRO, 2021). Figure 7 shows the area chosen for the project.
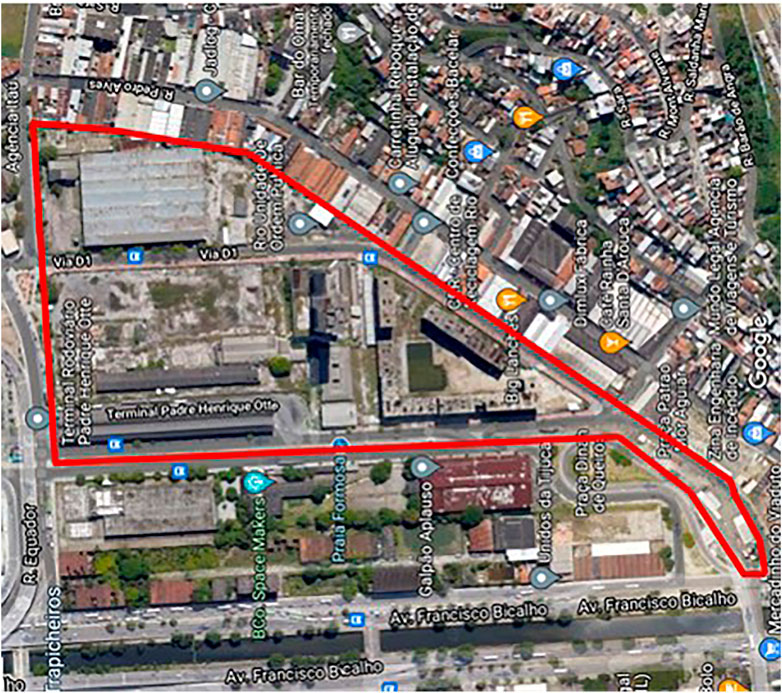
FIGURE 7. The region defined for the generative study (GOOGLE MAPS, 2021).
The site, according to the City Hall, is a Special Area of Urban Interest (AEIU), with various incentives and tax benefits aimed at stimulating the construction of residential properties in the region (RIO DE JANEIRO, 2021). Therefore, this study had the analysis of residential developments as a priority. This subsector has an Approved Allotment Project (PAL), number 48193, (RIO DE JANEIRO, 2021). The subdivision foresees the creation of a street, Via D3 Projetada, in the horizontal direction connecting the streets General Luis Mendes de Morais and Via D1 Projetada, and the definition of private areas for mixed-use, as well as public areas, destined to be new retreats, gardens, and a school. The list of areas and their uses are shown in Table 2.
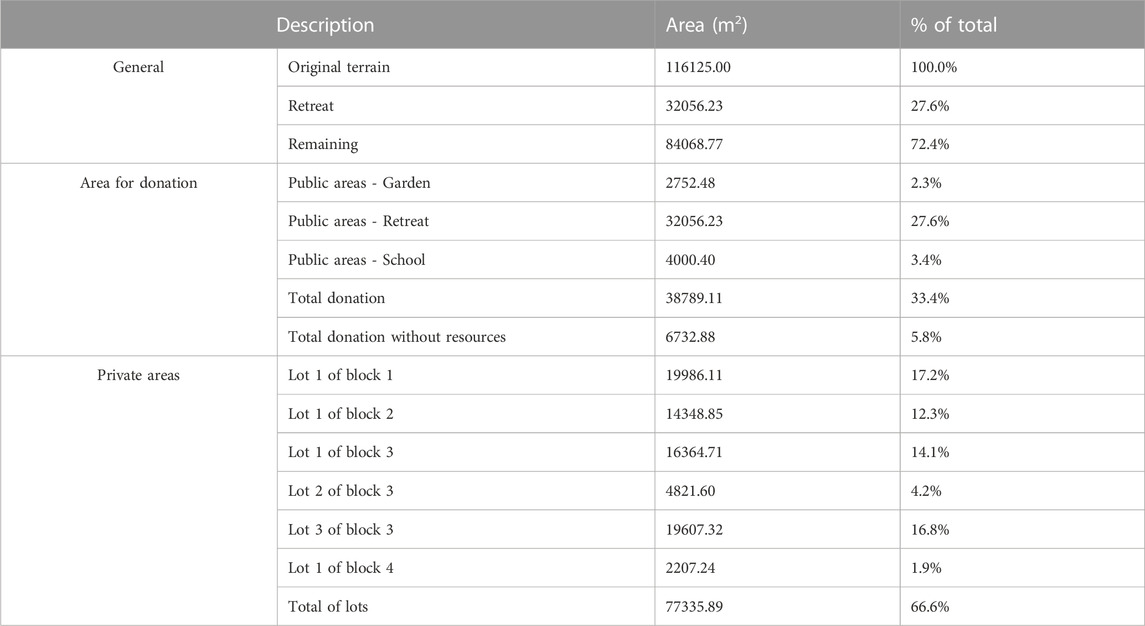
TABLE 2. Table of subsector D2 allotment areas.
According to the table, the areas destined for public use add up to 38,789.11 m2, largely for retreats. As for the private areas, the subdivision resulted in six lots distributed in four blocks, which add up to a total area of 77,335.82 m2. Another aspect of the region is the presence of real estate developments called Rio Wonder Residences, which are three residential buildings, called Praia Formosa, Maua’ and Cais do Valongo, the first of which has already opened and the other two are in the launch phase (Figure 8). The buildings have leisure areas with a swimming pool, games room, and gym. Praia Formosa also has more amenities options, such as co-working spaces, a cinema, a domestic market, and a function hall (CURY CONSTRUTORA, 2021). In addition, the properties are also supported by the financing benefits associated with the federal government’s Casa Verde e Amarela program.
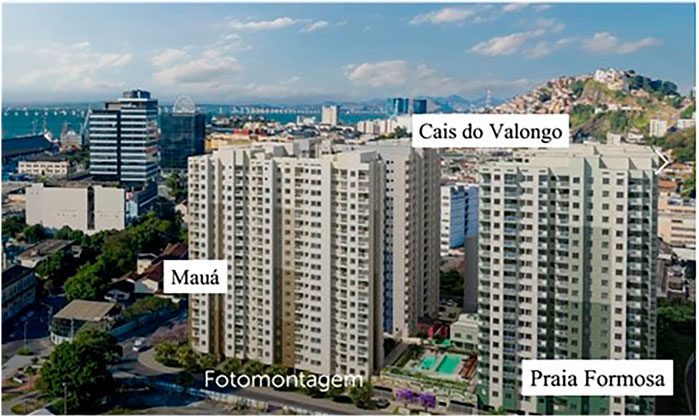
FIGURE 8. Photomontage of Rio Wonder Residences (CURY CONSTRUTORA, 2021).
The apartments range from studios to one and two-bedroom units. The average total area is 35 m2 for studios and one-bedroom apartments and 45 m2 for two-bedroom apartments. As for the distribution of typologies by floor type, the estimate for the three buildings after a floor plan survey was that 75% would be two-bedroom apartments, 15% would be studios, and 10% would be one-bedroom apartments. The averages of areas and proportions of the units will serve as the basis for the initial data to be estimated for the project. When considering the existing development, the areas for public use and the lots that are smaller than 60 m2 were excluded. Therefore, this lot (Figure 9) was chosen for the generative study.
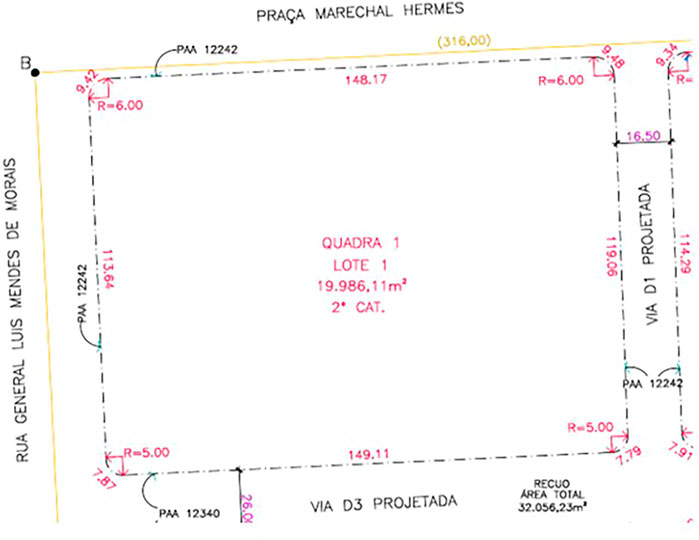
FIGURE 9. Details of lot 1 of block 1 (adapted RIO DE JANEIRO, 2021).
As seen throughout this work, in the pre-flow for a design solution through a generative design approach, it is necessary to understand what the objectives and constraints of the problem are. In the example used in this case study, the restrictions are those related to the physical characteristics of the terrain, i.e., its dimensions, and those related to current legislation. The selected land, with an area of 19,986.11 m2, rectangular in shape and with curved corners with a radius of 5.00 m, is detailed in Figure 9.
To understand the constructive constraints of urban legislation, documents were consulted by accessing the Neighborhood by Neighborhood Legislation of the City of Rio de Janeiro, as shown in Table 3.

TABLE 3. Neighborhood-by-neighborhood legislation of the City Hall of Rio de Janeiro.
It is also worth highlighting some special features found in the aforementioned documents. For residential buildings, it is unnecessary to meet requirements such as the maximum horizontal projection of the building, the number of units per building, and the presence of parking lots. Balconies and horizontal and vertical circulations are not computed in the occupancy rate or the calculation of the Total Buildable Area (ATE). Another exception is the limit of only one parking space per unit if parking is available.
As for the capacity to use the space, an Occupancy Rate (TO) of 50% is applied, and, for buildings far from the boundary, the maximum height of 120 m is allowed for up to 40 floors. In addition, the Land Use Index (IAT) is replaced by the Basic Use Coefficient (CAB), with a value of 1, and the Maximum Use Coefficient (CAM), with a value of 8. In this way, it was possible to define the minimum and maximum buildable areas through equations 1 and 2):
The previously described terrain features and other restrictions associated with zoning urban were compiled and are found in Table 4.
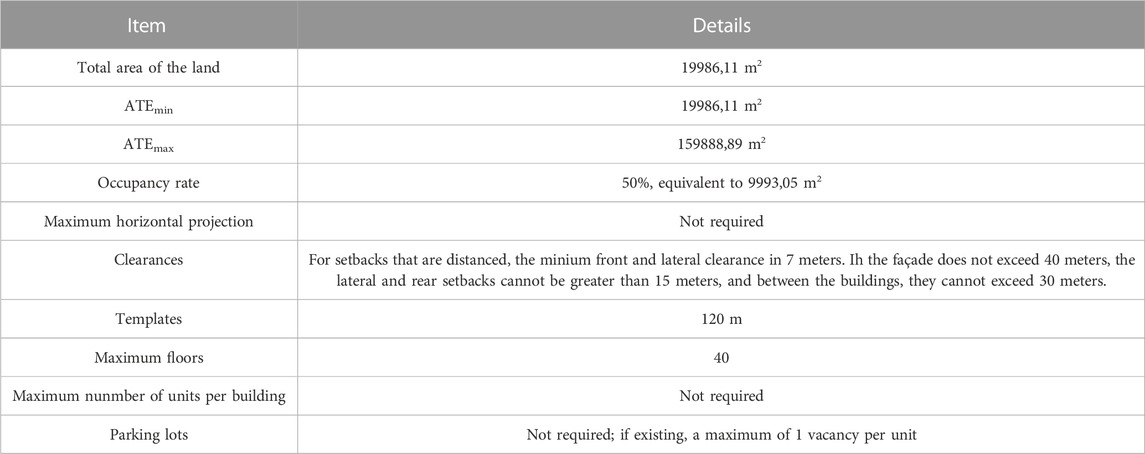
TABLE 4. Constraints associated with the project.
The definition of the objectives to be achieved was influenced by the software generation possibilities. Given that its main advantage is to generate a solution that optimizes the number of units within the spatial limits while meeting certain pre-established parameters, maximizing the use of space using an algorithm will be the main objective. Another advantage is the ability to establish size proportions of the units, that is, to set targets regarding the number of units of each defined typology.
It is also possible to adopt these proportions as a goal, which were based on the Rio Wonder developments in the region.
In financial terms, the software allows one to input values into existing fields to generate reports. These fields and the calculations involved, however, are aimed at the US real estate market and are not editable, which made an efficient conversion to the Brazilian reality difficult. Therefore, financial objectives will not be addressed in this case study.
The three final objectives to be accomplished, therefore, were to maximize the use of available space, maximize the number of housing units, and the generation of units to approximate the following typologies and proportions: 70% two-bedroom apartments of 60 m2; 15% one-bedroom apartments of 50 m2; and 15% 45 m2 studios.
To assess compliance with the objectives and restrictions, a total of nine parameters were established, with the proportion of areas and types of units being more subjective: total built area, the total area of the units, occupation area, the number of units, the average area of the units, the number of parking spaces, feedback, the number of floors, proportions of areas, and typologies of the units. Once the objectives, restrictions, and parameters that will serve as evaluation criteria for the designs were established, it was possible to start the study in the generative design tool.
3.1 Data used in the software
As previously described, to generate a more adequate solution, it is necessary to choose a preset to be adapted. The program provides six categories of presets with three of them aimed at housing: two for low-construction-density projects (low density and garden) and one for high-density projects (high density). The other categories are divided into commercial (core-based) and industrial (industrial) buildings, in addition to one focused on a more generic mass study (mass-based).
In line to maximize the use of space, the use of the high-density category was defined. In this category, the software presents several construction presets, from which “tower” was chosen, which refers to buildings of great height, as a starting point for the generation of a solution. In this option, the first floors are dedicated to parking lots and amenity areas with residential units built above them. Other information that was entered or edited directly in the software was related to zoning, unit characteristics, the building in general, parking, vertical areas, and building amenities areas. These fields and their values are summarized in Table 5.
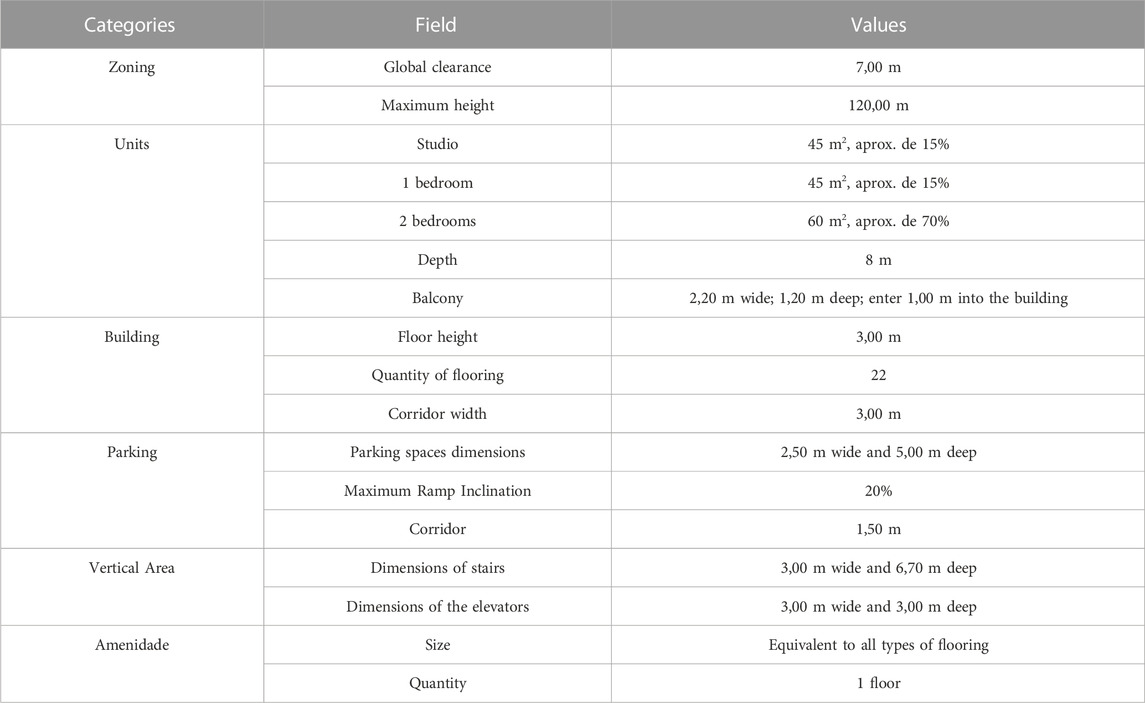
TABLE 5. Data entered into the project in each field and category.
Once these values were defined, it was possible to save a preset with these characteristics for the study. In this way, once the site limits were defined and the preset was selected, the algorithm could proceed to a solution.
3.2 Generative design flow
Previously, an image was created with the boundaries of the land to locate the project to be created. This image was used as the background of the visualization panel so that, based on it, the generative area could be defined, i.e., the worksite. A peculiarity, however, is that the corners of the land are curved and only straight lines can be inserted into the software. Therefore, it was decided to carry out a linear approximation that, considering the overall dimensions and the preliminary nature of the project, would not compromise the study.
Once the lines for the adapted preset are drawn, the software automatically creates an initial solution. Figure 10 presents Solution 01, containing the simplified floor plan and a 3D view of the building. The information generated from Solution 01 is indicated in Table 6.

FIGURE 10. Solution 01, one tower with 840 units.
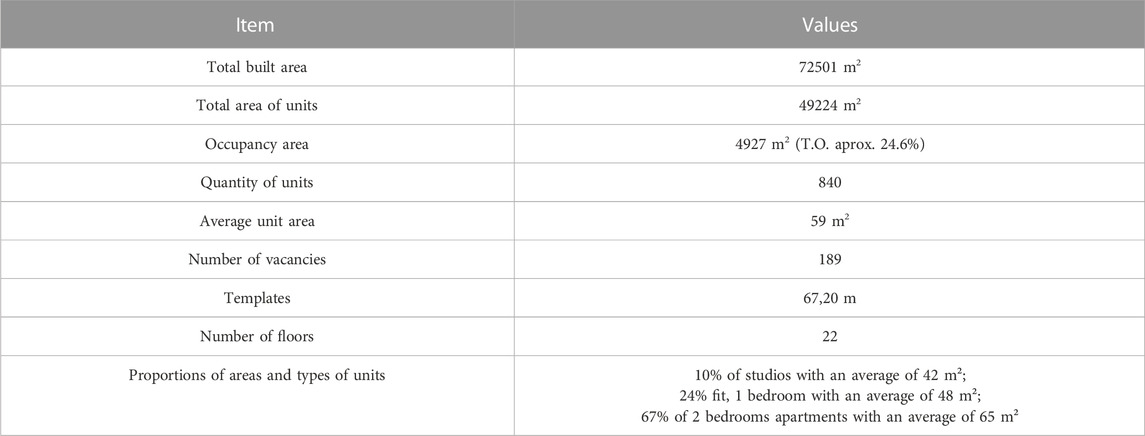
TABLE 6. Parameters and values of Solution 01.
In the figure, the division of colors represents the different types of units, with blue being studios, green being one-bedroom apartments, and yellow being two-bedroom apartments. One can also see, on the first floors, the colors gray and red, which respectively represent the garage and an amenity area as a Common Use Floor (PUC).
In this solution, the algorithm created a tower on the north side of the site, leaving a large area free of construction. In addition, the creation of a “C” format can be seen, which generated units in the corners whose proportions are much larger than desired.
Although all the values followed the criteria described, the total built area, the total area of the units, and the TO could still be increased. Another point of improvement would be the proportion of one-bedroom apartments, which was much higher than the desirable 15%.
For the second iteration of the process, it was decided to create two rectangular towers using two generative areas, one north, and one south. In this way, an attempt was made to increase the occupancy rate and avoid the generation of much larger units resulting from the “C” format of the previous solution. Solution 02, composed of two towers generated under the same criteria, is shown in Figure 11, containing the simplified floor plan of one of the towers, the three-dimensional view of the two, and the same color scheme as the first solution. The information generated from Solution 02 is shown in Table 7. Due to manual editing limitations, the generated parking kept its dimensions beyond the projection of the raised floors.

FIGURE 11. Solution 02, two towers with 1,481 units.
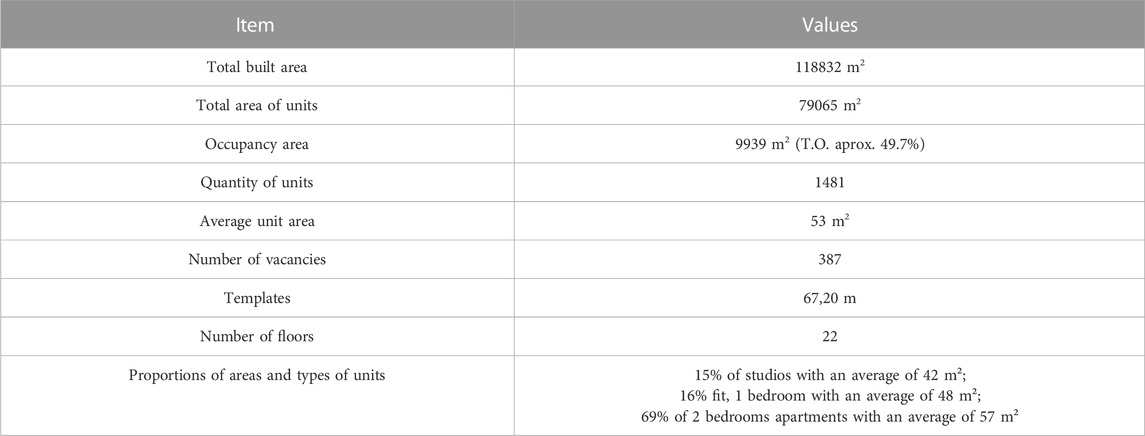
TABLE 7. Parameters and values of Solution 02.
Regarding improvements, one can observe an increase in the number of units and the distribution between typologies was closer to what was desirable when compared to Solution 01. A disadvantage, however, was the OT of the terrain was raised close to the maximum limit of 50% as a consequence of the software limitation by decreasing the parking area and not by increasing profitable areas. To improve the relationship between the occupation area and the total area of the units without having to increase the number of floors, we tried to divide the land into three generative areas to generate three buildings. This new division forced the software to create areas whose dimensions are sufficient, i.e., smaller than 60 m. Therefore, the southern area was divided in half, resulting in two new sites.
Solution 03 was composed of a building to the north and two to the south and is shown in Figure 12 below with a simplified plan of the standard floors of the buildings and a three-dimensional view, both with the color scheme of the previous solutions. As in Solution 02, it was not possible to reduce the garage floor to contain it in the projection of the other floors due to the limitations of manually editing the program.
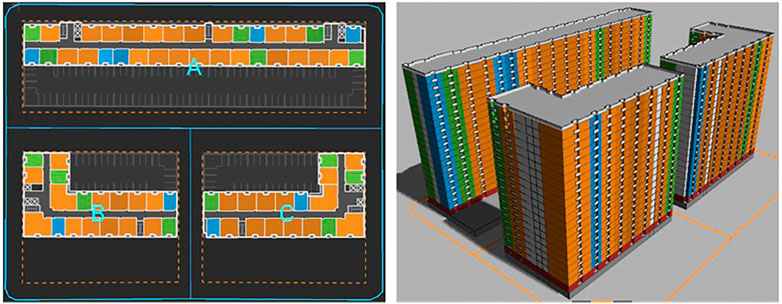
FIGURE 12. Solution 03, three towers with 1,421 units.
As shown in Figure 12, the algorithm generated buildings to the south in an “L” shape, a result similar to that found in the first solution, but with a division into two buildings instead of just one with a “C” shape. In this way, the problem of adjusting the units in the internal and external corners was also found in this solution. The information generated from Solution 03 is shown in Table 8.

TABLE 8. Parameters and values of solution 03.
Although the total area of the units was increased compared to the previous solution, the number of units and their average area decreased. As for the proportion between the types of units, the result was also less satisfactory than Solution 02. Due to the limitations of the generative software and the solutions already obtained, the opportunities for improvement for a new solution were considered low. Therefore, the iterative flow ended with the three alternatives obtained.
3.3 Post-flow
After generating three solutions, it became necessary to compare them to define the best option. As for the constraints imposed on the project, all the solutions were suitable. Thus, as a selection criterion, the nine parameters of the solutions were compared in the solution in Table 9, highlighting the solution whose parameter value was the most adequate for fulfilling the three objectives, which are to maximize space, maximize the number of units, and approximate the area proportions and unit typologies.
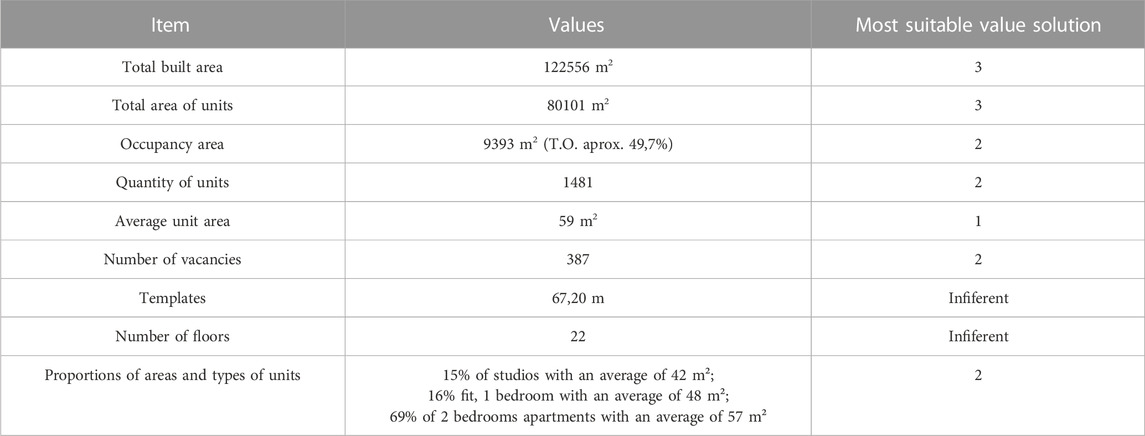
TABLE 9. Comparison between the generated solutions.
Solution 02 obtained better results in terms of occupation area, number of units and vacancies, and proportions of areas and typologies. As for the total areas (built-up and units), despite the fact that Solution 03 had better values, its values do not greatly exceed those of Solution 02. Finally, the highest average of the area of the units found was found in Solution 01 due to the difficulty of the software in adjusting the size of the units allocated in the internal corners and external parts of the building, as well as in Solution 03, whose average area of the units was the second largest.
Therefore, the most suitable solution generated for the goals and design constraints was Solution 02. However, it can still be refined, either manually after exporting to other design software or by seeking to change other parameters, such as the number of floors.
3.4 Results
In this study, it was possible to generate solutions for an initial conception of real estate development by combining the collected data, the desired objectives, and the TestFit software. The algorithm sought to optimize design drawings, once the necessary information was entered, and was faster than if done manually, allowing testing and evaluation with less human effort.
However, the algorithm did not allow for solutions as efficient as those that could be obtained with the freedom of a manual operation. This was due both to the limitations of the software and the difficulty of adapting it to a Brazilian development, given its specifications for the Texas real estate market. Furthermore, it was not possible to generate outputs of financial calculations of the solutions, data that would be of extreme importance for an adequate evaluation of the alternatives.
As for the case study, a study was carried out using the TestFit software, a specific tool for real estate projects. In this study, it was possible to quickly generate optimized solutions for a hypothetical project in a region of the Port of Rio de Janeiro with the data introduced in the program and evaluate them according to defined goals.
4 Final considerations
Generative design can be considered an evolution of CAD and BIM design approaches. This approach has been increasingly accessible in the AEC sector thanks to the ease of implementing programming algorithms and also due to progress in the areas of artificial intelligence and cloud computing.
As presented in this article, its application in construction can achieve faster and more assertive design solutions that consider the project constraints and the objectives of the interested parties. Such application in the design and feasibility phases, understood as the construction stage with a high degree of opportunity for creation and relatively low cost (compared to the other stages), suggests the potential for increasing productivity and design quality, in addition to absorbing the complexities involved in fulfilling the needs and objectives of the constructed object.
Among the potential uses observed in this work, it stands out that the dissemination of this approach, added to 3D printing technologies, can be better used for the building of elements, especially when dealing with large variations and alternatives. In this way, information in future projects may have better inputs for a more adequate generation and closer to real cases.
This work also presents some barriers to be overcome so that this generative technology can be better implemented in construction. The designer must manage, in a way, to understand their work process in detail, objectively defining the project performance criteria that can be analyzed by algorithms and having a certain level of knowledge about programming to automate the process. Another problem is that the task of choosing among many alternatives is not a simple one, reinforcing the need to develop an effective analysis of the performance of the drawings to support decisions.
Data availability statement
The original contributions presented in the study are included in the article/Supplementary Material, further inquiries can be directed to the corresponding author.
Author contributions
EQ, Review. LO, Section 2. PC, Section 1. LC, simulations and results. All authors contributed to the article and approved the submitted version.
Conflict of interest
The authors declare that the research was conducted in the absence of any commercial or financial relationships that could be construed as a potential conflict of interest.
Publisher’s note
All claims expressed in this article are solely those of the authors and do not necessarily represent those of their affiliated organizations, or those of the publisher, the editors and the reviewers. Any product that may be evaluated in this article, or claim that may be made by its manufacturer, is not guaranteed or endorsed by the publisher.
References
Alsakka, F., Haddad, A., Haddad, A., Ezzedine, F., Salami, G., Dabaghi, M., et al. (2022). Design for more economical and environmentally sustainable reinforced concrete structures. Journar Clean. Prod. 387, 135829.
Araghi, S. K., and Stouffs, R. (2015). Exploring cellular automata for high density residential building form generation. Automation Constr. 49, 152–162. doi:10.1016/j.autcon.2014.10.007
Autodesk, (2020). What is generative design? https://www.autodesk.com/solutions/generative-design#:∼:text=Generative%20design%20is%20a%20design,manufacturing%20methods%2C%20and%20cost%20constraints.
Balaguer, C., Abderrahim, M., and Balaguer, C. (2008). Robotics and automation in construction. Norderstedt, Germany: bod--books on demand.
Blanco, J. L., Fuchs, S., Parsons, M., and Ribeirinho, M. J. (2018). Artificial intelligence: Construction technology’s next frontier. Mckinsey and Company, 8.
Buhamdan, S., Alwisy, A., and Bouferguene, A. (2021). Generative systems in the architecture, engineering and construction industry: A systematic review and analysis and construction industry: A systematic review and analysis. Int. J. Archit. Comput. 19 (3), 226–249. doi:10.1177/1478077120934126
CNI - National, (2018). Investments in Industry 4.0. https://static.portaldaindustria.com.br/media/filer_public/d4/c4/d4c48b24-0674-44a5-8799-b0fd5d0f8d11/investimentsinindustry40_2018.pdf.
CURY CONSTRUTORA, (2021). Cury Rio Wonder Residences Cais do Valongo. https://cury.net/imovel/RJ/centro/rio-wonder-residences-caisdo-valongo.
Demystifying, A. U. T. O. D. E. S. K. (2019). Generative design for AEC. Las Vegas, NY, USA: Autodesk University.
El-Sheikh, M., and Gerber, D. (2011). “Building skin intelligence,” in Proceedings of ACADIA (National Park, ME, USA, 170–177.
Filippi, G. A. D. E., and Melhado, S. B. (2015). Um estudo sobre as causas de atrasos de obras de empreendimentos imobiliários na região Metropolitana de São Paulo Metropolitan Region of Sa˜o Paulo. Built Environ. Porto Alegre 15 (3), 161–173. doi:10.1590/s1678-86212015000300033
Harness, C. (2020). Testfit. https://testfit.io/release/testfit-2-19-garden-apartments-and-exclusion-zones/. TestFit 2.19: Garden apartments exclusion zones, Dallas, TX, USA.
Humppi, H., and O Sterlund, T. (2016). “Algorithm-aided BIM,” in 34th eCAAD conference , 601–609. https://parametrichouse.com/algorithmic-aided-bim/.
Kpmg, I. N. T. E. R. N. A. T. I. O. N. A. L. (2017). Global construction survey 2017: Make it or break it.
Krish, S. (2011). A practical generative design method. Computer-Aided Des. 43 (1), 88–100. doi:10.1016/j.cad.2010.09.009
Mccormack, J., Dorin, A., and Innocent, T. (2004). “Anais,” in Futureground - DRS international conference (Melbourne, 17–21.Generative design: A the paradigm for design research
Mgi - Mckinsey Global, I. N. S. T. I. T. U. T. E. (2017). Reinventing construction: A route to higher productivity, 168. Mckinsey Company. Shanghai, China.
Microsoft News Center Brazil, (2019). With Artificial Intelligence, Brazil can quadruple productivity growth and increase GDP by up to 7.1% per year.
Mineiro, E. F., and Magalha, E. S., (2019). Parametric and generative design: Ways to explore complexity. Proj. Manag. Technol. 14 (2), 6–16.
Morphogenesis, (2020). In: DICIO, Dicionário online de Português. Porto: 7Graus, 2020. https://www.dicio.com.br/morfogenese/.
Ribeirinho, M. J. (2020). Mckinsey Company, 84. https://www.mckinsey.com/capabilities/operations/our-insights/the-next-normal-in-construction-how-disruption-is-reshaping-the-worlds-largest-ecosystem.The next normal in construction: How disruption is reshaping the world’s largest ecosystem.
Russel, S., and Norvig, P. (2013). Artificial intelligence: A modern approach. 3. Rio de Janeiro City Hall, Rio de Janeiro: Elsevier.
Soddu, C. (1994). The design of morphogenesis. An experimental research about the logical procedures in design processes. Demetra Mag. 1, 56–64.
Sydora, C., and Stroulia, E., Rule-based compliance checking and generative design for building interiors using BIM. Automation in Construction, Elsevier, 120, 103368. doi:10.1016/j.autcon.2020.103368
Keywords: generative design, construction, artificial intelligence, civil construction, design
Citation: Oscar LH, Cerqueira LC, Cunha PH and Qualharini EL (2023) Generative design in civil construction: a case study in Brazil. Front. Built Environ. 9:1150767. doi: 10.3389/fbuil.2023.1150767
Received: 24 January 2023; Accepted: 24 April 2023;
Published: 05 June 2023.
Edited by:
Ana Catarina Evangelista, Engineering Institute of Technology (EIT), AustraliaReviewed by:
Jianwei Ma, Engineering Institute of Technology, AustraliaDiego A. Vasco, University of Santiago, Chile
Copyright © 2023 Oscar, Cerqueira, Cunha and Qualharini. This is an open-access article distributed under the terms of the Creative Commons Attribution License (CC BY). The use, distribution or reproduction in other forums is permitted, provided the original author(s) and the copyright owner(s) are credited and that the original publication in this journal is cited, in accordance with accepted academic practice. No use, distribution or reproduction is permitted which does not comply with these terms.
*Correspondence: Eduardo Linhares Qualharini, qualharini@poli.ufrj.br