Developing software to assess the seismic risk of natural gas infrastructure: OpenSRA
 Micaela Largent
 Jonathan Bray
 Jennie Watson-Lamprey1
 - 1Slate Geotechnical Consultants, Berkeley, CA, United States
- 2Department of Civil and Environmental Engineering, University of California, Berkeley, Berkeley, CA, United States
As part of a multi-year study, the Pacific Earthquake Engineering Research (PEER) center in conjunction with Lawrence Berkeley National Laboratory (LBNL), the NHERI SimCenter at Berkeley, Slate Geotechnical Consultants (Slate), and several subcontractors, developed an open-source seismic risk analysis (OpenSRA) program that implements the performance-based earthquake engineering (PBEE) risk framework using a user-friendly interface, capable of operating on a desktop computer. This effort is made up of two elements: 1) research of seismic demand and capacity models, laboratory testing, and finite element modeling, and 2) implementing these findings into a backend calculation program with an easy-to-use interface. The NHERI SimCenter, Slate Geotechnical Consultants, and PEER researchers developed an integrative method to create an efficient code with a useful interface. OpenSRA implements and updates current models addressing different forms of seismically induced ground deformation (e.g., fault rupture, liquefaction, and landslide) as well as ground shaking. It quantifies resistance to deformation in buried pipelines, well heads, caprocks, and aboveground components, and then provides a framework for estimating the uncertainty in both the models and parameters. The software allows the end-user to utilize these models according to the resolution of the available data (i.e., state-wide, regional, or site-specific). The interface provides a visualization of the inputs (e.g., ground motion, and liquefaction potential) and outputs (risk of leaks/breaks) overlaid on different maps of California. OpenSRA provides the industry with updated seismic demand and capacity models, an efficient calculation method, and user-friendly software. OpenSRA enables end-users to estimate the risk of seismic damage to their infrastructure. Using risk-informed decisions enables utility owners to proactively and cost-effectively maintain infrastructure.
1 Introduction
The SimCenter, Slate, PEER, LBNL, and other OpenSRA researchers worked together to synthesize the research performed and tocreate an easy-to-use interface to produce an open-source seismic risk assessment tool for natural gas infrastructure that can be used by utility stakeholders (e.g., regulators and utility owners) to better understand state-wide risks, to prioritize mitigation, to plan new gas infrastructure, and to focus post-earthquake repair work.
The probabilistic seismic risk tool developed in this project follows the widely accepted risk methodology of Cornell (1968). Seismic source characterization is used to develop a large number of earthquake scenarios with associated rates of occurrence to represent the seismic hazard. Fault ruptures and the resulting ground shaking are generated for each earthquake scenario to represent the seismic loading, which includes a map of ground motion parameters. This resulting seismic parameter intensity map is overlaid on the infrastructure system, and the seismic loading is related to the capacities of the infrastructure to calculate the seismic performance of the natural gas system for each scenario. By repeating the process for all the scenarios in the suite, OpenSRA can evaluate the seismic risk to the system.
The open-source seismic risk analysis (OpenSRA) software was developed to be applied easily by regulators and utility owners, and to include updated models and methods for the seismic demands and capacities that control the seismic risk for natural gas systems. This was done by including the users (utility owners and operators) from the onset. The project includes several innovative approaches that improve the adopted methodology and distinguish this project’s approach from standard approaches currently used in the natural gas industry. Current risk studies developed by the utilities use risk scoring approaches that are subjective and qualitative. They do not properly incorporate the uncertainties in the seismic demand and in the fragility of the system and its components. Targeted research, including liquefaction, landslide, fault displacement, and fragility development for different components of infrastructure, was conducted in this project to improve the characterization of uncertainty of key inputs to the seismic risk assessment tool. The methodology employed in this project provides quantitative estimates of the probabilistic seismic risk.
This paper summarizes the activities and accomplishments of the OpenSRA project. It provides a high-level description of the project components, framework of the OpenSRA software, and the resulting fragility curves. Three natural gas systems are considered in this study: a) buried pipelines, b) underground storage facilities, and c) aboveground storage and transmission systems. The hazards of surface fault rupture, earthquake ground shaking, liquefaction-induced ground movements, and earthquake-induced landslides are characterized in this study. Three levels of analysis may be performed depending on the quantity and quality of data available and the sophistication of the model that can be used for each data level. Each component of the system has undergone finite element modeling to estimate the response of the component to the ground shaking and ground deformation resulting from each hazard and resulting in the probability of failure. The seismic hazard assessments and the finite element modeling results developed as part of this study are used to develop fragility curves that are implemented into OpenSRA to aid end users in evaluating the seismic performance of their systems as well as prioritizing risk mitigation efforts. To further quantify uncertainties a team explored sensing technologies to aid in monitoring strain or estimating parameters more accurately. Reports for specific research tasks are cited for additional details.
2 OpenSRA
OpenSRA is an open-source seismic risk assessment tool developed in Python to assess the seismic risk of natural gas infrastructure. The software implements research from six task groups to calculate the seismic demand, damage, and risk of failure for natural gas systems. The following sections outline the framework, calculation components, and highlight the new-to-industry calculation methods utilized within OpenSRA.
2.1 Framework
OpenSRA follows the Performance-Based Earthquake Engineering (PBEE) risk methodology developed by PEER (Moehle and Deierlein, 2004) to assess the seismic risk of natural gas infrastructure. The PBEE risk methodology uses a combination of probabilities to calculate the risk of a decision variable (dv) occurring. These calculations can be lengthy as there are multiple probability density functions to calculate and to integrate to develop estimates and their uncertainty. To perform the calculations within OpenSRA in a reasonable timeframe for the user, Polynomial Chaos theory has been implemented. This methodology requires clearly defined means, aleatory variabilities, and epistemic uncertainties for each step of the PBEE risk methodology. For more detailed information regarding OpenSRA and Polynomial Chaos, please refer to Zheng B et al. (2023).
2.2 Efficient evaluation of the PBEE risk framework
The risk framework is simply presented as a triple integral below (Eq. 1) adapted from Moehle and Deierlein (2004).
In the above equation,
The method presented by Lacour and Abrahamson (2021) approximates PDFs and CDFs as linear combinations of a set basis functions (analogous to Taylor expansion of analytical functions), which are then incorporated into the analytical solution mentioned previously. The primary computation required for Polynomial Chaos is the intermediate calculation of the Polynomial Chaos terms, which are functions of the various
2.3 OpenSRA overview
Given the PBEE framework, each of the research tasks has split their approaches to fulfill each of the probabilities. Figures 1–3 show the workflow of OpenSRA and how the PEER risk methodology shown in Eq. 1 is conceptually incorporated into the seismic risk assessment of each of the three infrastructure types: belowground pipelines, wells and caprocks, and aboveground subsystem components. The PEER risk methodology serves as the backbone to the OpenSRA risk assessment workflow. The user defines the infrastructure type that will be analyzed by OpenSRA and inputs their component characteristics. OpenSRA then steps through the PEER risk methodology as shown in the flow charts in these figures to perform the risk assessment.
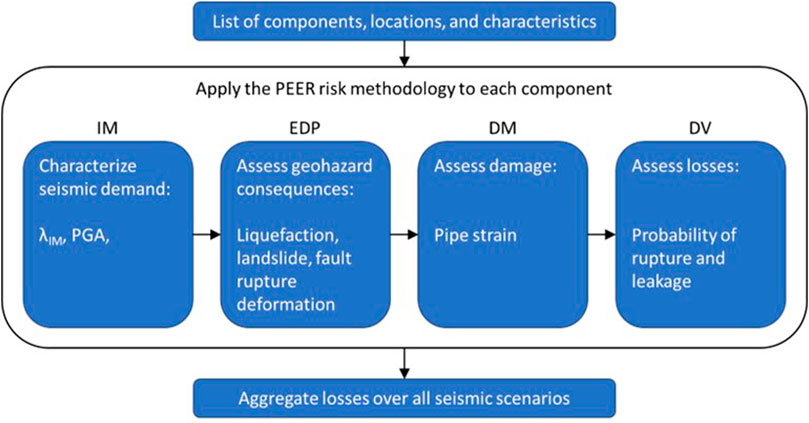
FIGURE 1. PEER risk methodology applied to belowground pipelines (Zheng B et al., 2023).
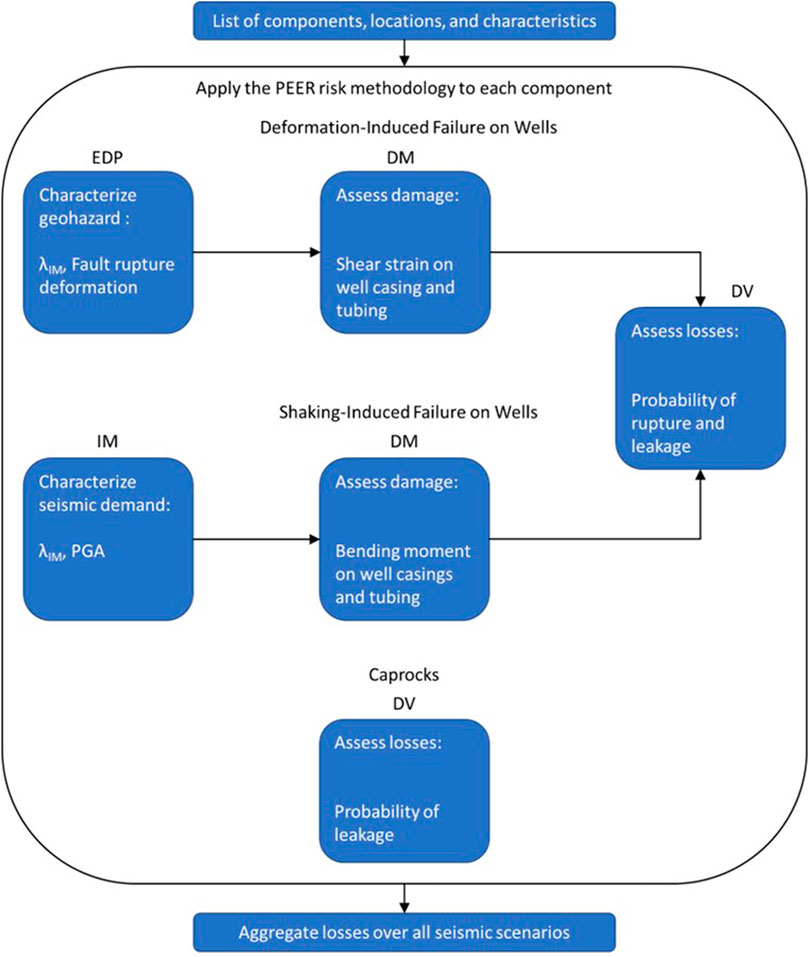
FIGURE 2. PEER risk methodology applied to wells and caprock (Zheng B et al., 2023).
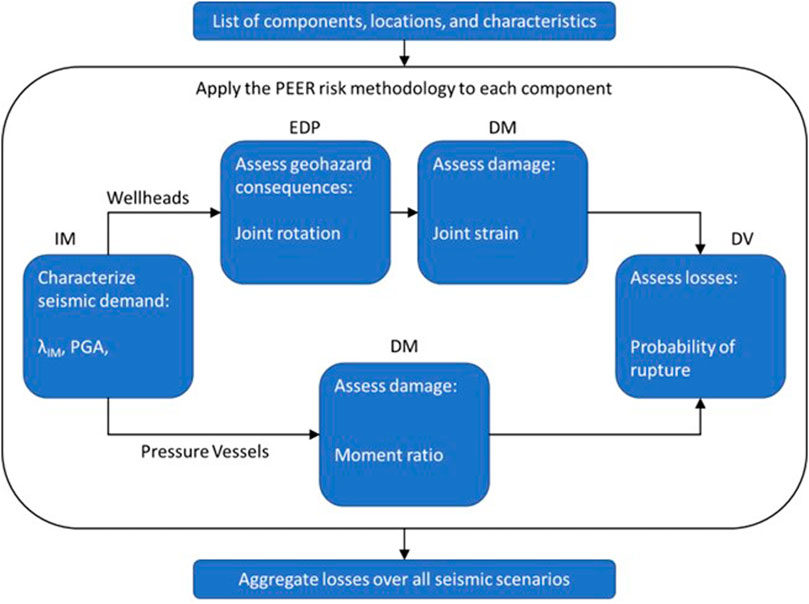
FIGURE 3. PEER risk methodology applied to aboveground components (Zheng B et al., 2023).
As shown in Figure 1 the workflow for belowground pipelines captures the influence of seismic intensity on ground deformation, the influence of ground deformation on pipe strain, and finally the influence of pipe strain on the probability of failure in the form of failure and leakage. The models to relate seismic intensity to ground deformation are based on state-of-the-art models that have been published in literature (Bain et al., 2023a). The models to relate ground deformation to pipe strain and pipe strain to failure are developed as part of the below surface demands and fragility research tasks. These models are described in detail in the following sections.
Figure 2 shows the workflow for wells and caprocks. For this category, the research tasks developed damage models for well casings and tubings that are dependent on fault rupture deformation and ground shaking. These models are considered as two independent modes of failure for wells. For caprocks, results of the numerical study suggest that probability of leakage is not significantly dependent on the tested model parameters, hence its distribution is independent on seismic and geohazard demands, and the overall risk is a constant distribution.
Figure 3 shows the workflow for aboveground subsystem components, specifically failure associated with wellheads and pressure vessels. The aboveground research resulted in models for joint rotations and strains for wellheads and moment ratios for pressure vessels, both of which are dependent on the seismic intensity (i.e., peak ground acceleration). The intensity of the strains and moment ratios are then used to inform the levels of failure associated with wellheads and pressure vessels, respectively.
Figure 4 shows a flow chart of the overall user process for OpenSRA and how the PEER risk framework is wrapped into the user experience. The user starts with entering general information, and selecting if the default values should be used for their analysis. Once these items and more specific information if not using the default values are entered, the user can run the analysis and visualize the results.
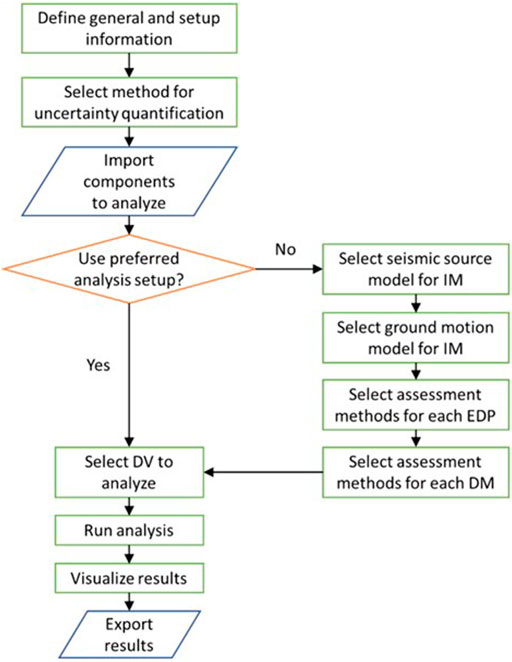
FIGURE 4. OpenSRA user experience flow chart (Zheng B et al., 2023).
2.4 Seismic hazard characterization
The basis of most of the geohazards within OpenSRA is a probabilistic seismic hazard analysis (PSHA). The PSHA combines the UCERF3 seismic source characterization to define the location, size and rate of earthquakes, and four of the ground motion models (GMMs) presented in the Next-Generation Attenuation Relationships for Western US (NGA-West2) Project to define the distribution of ground motion given the earthquakes in the seismic source characterization. This yields a rate of different ground motion levels that can be used as an input for fragility curves, or for other geohazards such as liquefaction and landsliding. The PSHA is performed in a preprocessing step that follows the approach first developed by Cornell (1968) with the inclusion of parameters for randomization and the consideration of epistemic uncertainty.
The UCERF3.1 model used in this study includes 253,394 rupture scenarios across the state of California. These scenarios are not a list of the only earthquakes that can occur in California, but a sample of potential earthquakes that can be used in summation to calculate mean hazard and risk for many applications. For the OpenSRA application, a smaller number of earthquake scenarios can be used with sufficient accuracy for assessing seismic risk to natural gas infrastructure. A reduced set of 1,194 rupture scenarios was produced for OpenSRA to increase the speed of analyses. Additional information about the reduced list of rupture scenarios can be found in Lacour and Abrahamson (2023).
Deterministic scenarios can also be analyzed using OpenSRA. The user can define fault rupture and earthquake parameters, and OpenSRA will estimate the distribution of ground motion from that earthquake. Estimates of shaking from real earthquakes can also be used as an input by using information from online ShakeMaps (Wald et al., 2005). These deterministic scenarios yield a probability of different ground motion levels that can be used as an input for geohazards such as liquefaction and landslides and for fragility curves.
2.5 OpenSRA validation and use
Four sites were chosen to investigate different geohazards and types of natural gas infrastructure considering the utility owners’ ability to share information with the team. These sites included Balboa Boulevard (several buried pipelines ruptured in the 1994 Northridge earthquake but there was no damage in the 1971 San Fernando earthquake), Cordelia Junction (which has a known landslide, based on confidential information shared by PG&E), McDonald Island (which has complex aboveground infrastructure, based on confidential information shared by PG&E), and Honor Rancho (which is close to many faults and has a large well field and caprock, based on confidential information shared by SoCal Gas). Each research team implemented their seismic demand and fragility models into OpenSRA and then performed analyses using ground motions from past earthquakes or illustrative earthquake fault rupture scenarios to evaluate the program. The results of the OpenSRA analysis were then compared to observed data from past earthquakes or assessed using engineering judgement for illustrative cases without past earthquake performance data. This comparison was done at each of the four sites, and refinements were made until the calculated results compared favorably with the observed or interpreted earthquake performance data. Through this process the use of the models to estimate EDPs and the use of the types of fragility curves (i.e., belowground pipeline, aboveground infrastructure, wells, and caprocks) in OpenSRA were validated. An example of the Balboa Boulevard back-analyses is described further in Section 6.1. More information on the OpenSRA validation efforts can be found in Bain et al. (2023b).
3 Seismic demand research
3.1 Fault displacement hazard
The primary goal of this subtask was to identify models to estimate primary and secondary fault displacement hazard and the location where this fault displacement hazard impacts underground pipelines, wells, and caprocks. Seismic demands are categorized into three levels. These levels correlate to the scale at which the analysis is performed and quantity and quality of the data available. Level 1 is a statewide analysis using data that must be available across the entire state of California, Level 2 is a regional analysis with higher resolution data than at Level 1, and Level 3 is a site-specific analysis with the highest resolution, quantity, and quality and thus the lowest uncertainty. The recommended models, inputs, and outputs are presented in Figure 5.
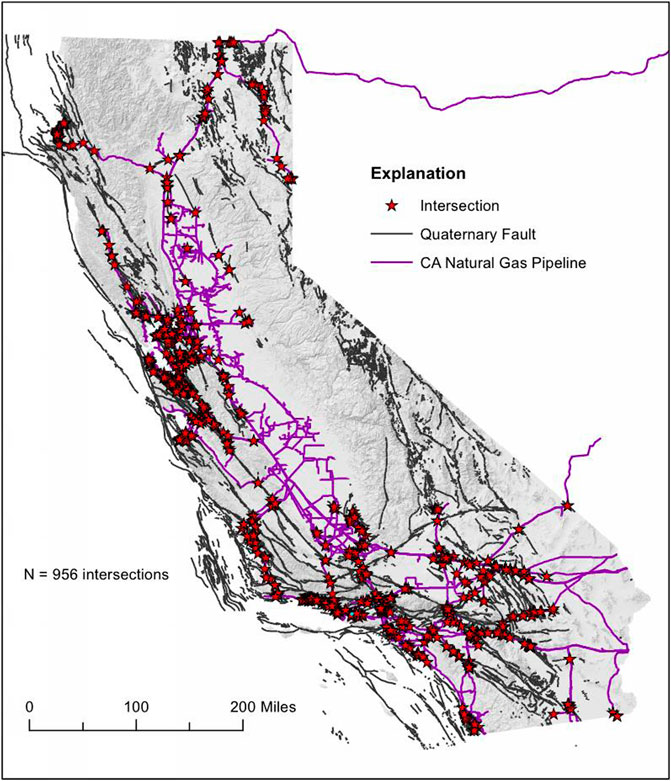
FIGURE 5. Intersections of gas pipelines (in blue) in California with fault traces (in gray) from the U.S. Quaternary fault and fold database (2019 edition). The 956 intersections of these two datasets are indicated by red stars [CEC pipeline database and USGS and CGS (2006) fault source traces].
The fault-pipeline crossing algorithm for Levels 1 and 2 uses the Quaternary Faults and Folds (Q-faults) database (USGS and CGS, 2006) to map fault location while continuing to utilize UCERF3.1 for the rupture geometry (strike, dip, rake) and magnitude. A 100-m buffer around the Q-fault traces defines the fault polygon and the nearest UCERF3 fault defines the rupture attributes. Figure 5 depicts the Q-fault locations along with pipeline crossings (shown with stars). Figure 6 shows both the primary and secondary fault zones developed by Thompson (2021). The pipeline shapefile is divided into straight, 100-m segments to track the specific segments that cross fault zones. These mapped faults along with their calculated displacement vectors (described further in Zheng B et al., 2023) are then utilized in the fragility development of buried pipelines, wells, and caprocks. The models implemented into OpenSRA are summarized in Table 1.
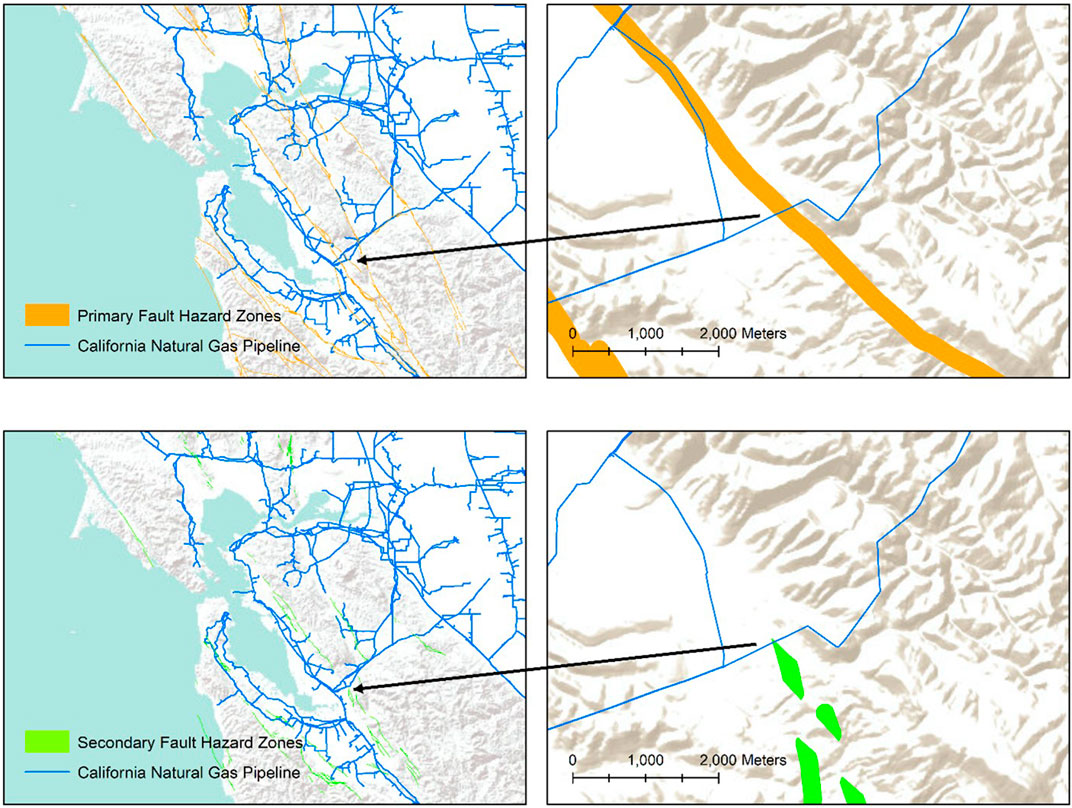
FIGURE 6. Level 2 primary and secondary fault hazard zones and California pipelines in the San Francisco Bay Area Primary (orange) and Secondary (green) fault hazard zones. Right side figures show examples of pipeline-fault zone intersections [CEC pipeline database and Thompson (2021) fault source zones].
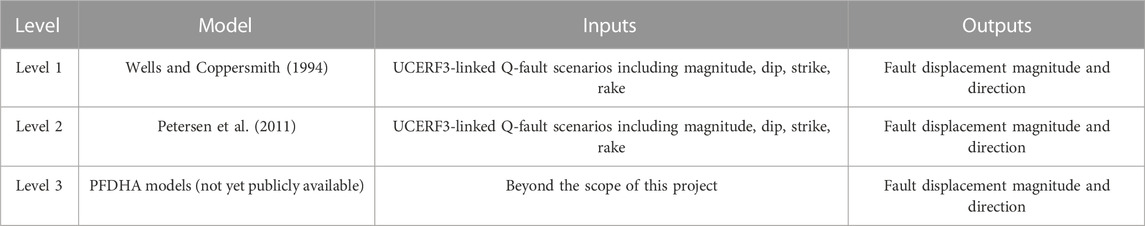
TABLE 1. Fault displacement models implemented into OpenSRA.
3.2 Liquefaction and landslides
This research task group explored key earthquake-induced geohazards such as liquefaction, lateral spreading, and landslides. Similar to the fault displacement hazard, these demands were split into different levels of analysis. Referring to Figure 1, this task group focused on estimating the EDP and DM for buried pipelines. The following sections outline the different EDP’s considered (within this task group). The results of the damage model to estimate strain (DM) will be presented in Section 4.
3.2.1 Liquefaction triggering models and data
The models implemented into OpenSRA to calculate the probability of liquefaction are summarized in Table 2.
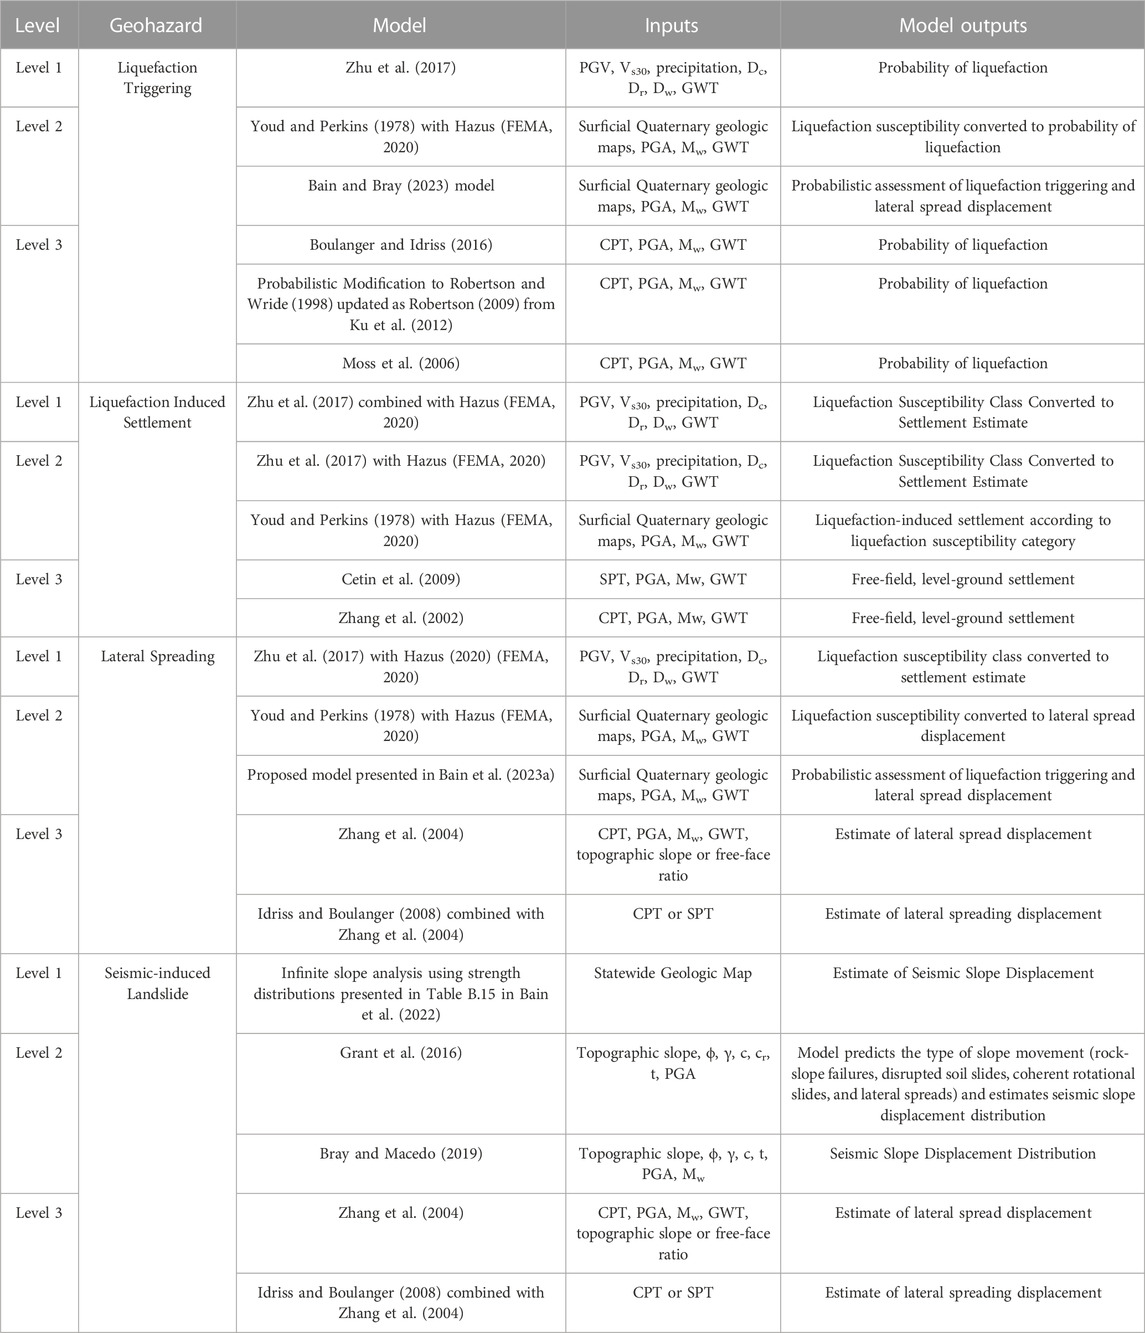
TABLE 2. Models for liquefaction and landslide hazards (Zheng B et al., 2023).
3.2.2 Liquefaction-induced lateral spread displacement and vertical settlement models and data
Table 2 lists the models used for the probability of liquefaction-induced settlement and lateral spreading. Specifically, for lateral spreading an updated Level 2 analysis is proposed to enable the use of enhanced data (when compared to Level 1). This method is briefly outlined below, and more information can be found in Bain and Bray (2023).
At Level 2, the Hazus (FEMA, 2020) methodology can be applied to estimate potential lateral spread displacement and vertical settlement due to liquefaction. However, because enhanced data are available at Level 2 compared to Level 1, research was performed to develop a new enhanced Level 2 procedure for assessing probabilistically lateral spread displacement.
The proposed procedure is based on liquefaction probability curves for surficial geologic units, described in Holzer et al. (2011). This research has modified and expanded the framework of the Holzer et al. (2011) procedure to include assessments for the probability of liquefaction triggering, potential lateral spread displacements, and estimates of their uncertainties. For further information on the development of this procedure please see Bain and Bray (2023).
The Prob (LDI = “0”) and non-zero LN (LDI) data (where LDI is lateral displacement index) are combined using a mixed-random variable model, as illustrated in Figure 7. These models estimate only the distribution of LDI. The estimated LDI distribution is converted to a distribution of lateral spread displacement using topographic correlations of LDI to lateral spread displacement (i.e., Zhang et al., 2004). Although this method has been shown to provide reasonable results in the San Francisco Bay Area and in Christchurch, New Zealand, it requires sufficient CPT data over an area to implement it in OpenSRA. At present this new procedure is only implemented in OpenSRA in the San Francisco Bay area.
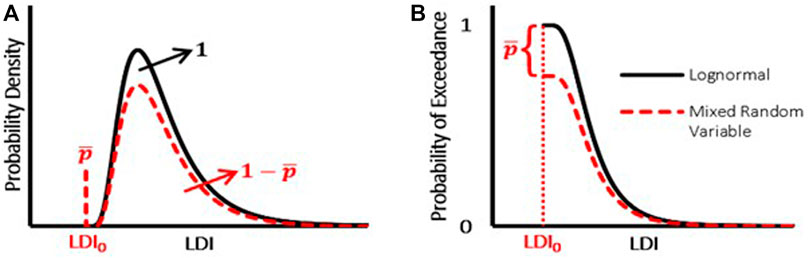
FIGURE 7. Comparison of continuous and mixed random distributions PDF for (A) a mixed and continuous random variable and (B) probability of exceedance for a mixed and continuous random variable (Bain et al., 2023a).
3.2.3 Seismic slope stability and slope displacement models and data
Table 2 lists the seismic-induced landslide models that have been implemented into OpenSRA.
4 Fragility curve development
Each research task was responsible for developing fragility curves for a specific component of natural gas infrastructure. This is represented in the PBEE framework in the “DM” and “DV” probabilities. More information can be found in Watson-Lamprey et al. (2023).
Each research task performed sensitivity studies to find the input parameters that changed the probability of failure the most. They defined the necessary inputs for their model, assigned ranges based on manufacturer guidance or expert opinion (mean and standard deviation), and finally, changed each input individually (within its range) to see which parameters impacted the final answer. The teams developed damage models (i.e., probability of a strain level given an intensity measure) and fragility models (i.e., probability of failure given a strain or deformation) using a variety of laboratory testing and finite element modeling. These fragility curves are implemented into OpenSRA within each component calculation (underground pipelines, wells and caprocks, and aboveground infrastructure).
4.1 Belowground pipelines
Referring to the OpenSRA framework and Figure 1, the previous section outlined the methods to estimate the EDP, and now given that EDP, this section focuses on how to estimate the DM. To do this, a numerical model of the soil-pipeline interaction and pipe response to permanent ground deformation was made using Abaqus Version 6.1. Details of the selected scenarios and numerical modeling techniques (e.g., finite element mesh, beam element type, springs, boundary conditions, integration points) are provided in Hutabarat et al. (2023). The numerical modeling in this study analyzed abrupt (“knife-edge”) ground movements that produce locally higher strain concentrations compared to distributed ground movements, which were not studied.
Figure 8 summarizes the ground deformation modes assessed in the OpenSRA Project. The following deformations were assessed:
• Pipelines that cross landslides or lateral spreads perpendicular or at an oblique angle.
- strike-slip tension (Figure 8A).
- strike-slip compression (Figure 8B).
• Ground settlement can be modeled as vertical normal-slip deformation (Figure 8C).
• Pipelines that cross landslides or lateral spreads parallel to the direction of displacement.
- normal-slip (Figure 8C) at the scarp.
- reverse-slip (Figure 8D) at the toe.
- the fifth case of ground deformation where no bending strains are induced (similar to Figure 8E).
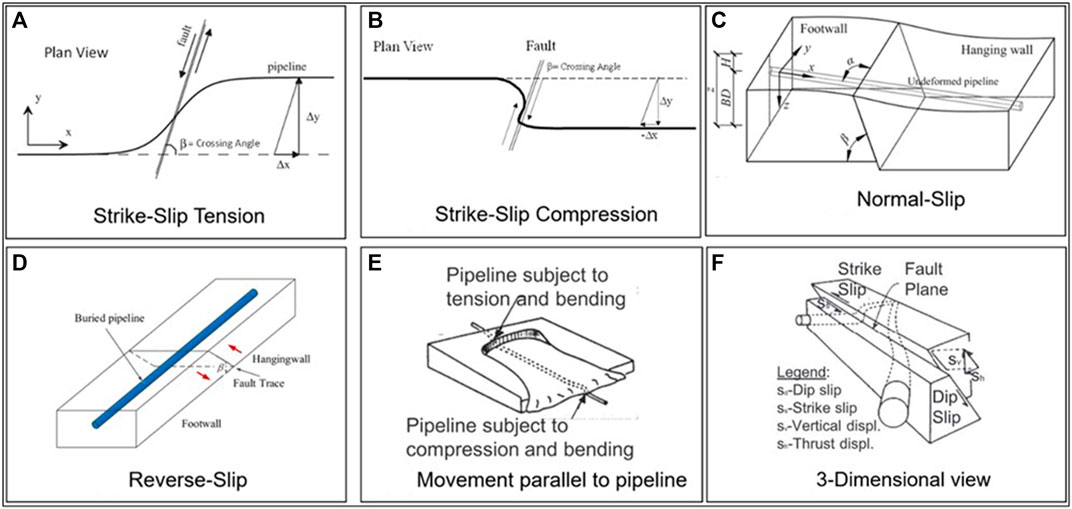
FIGURE 8. Ground deformation modes assessed to derive pipe strain fragility models (Hutabarat et al., 2023). Modes include (A) strike-slip tension, (B) strike-slop compression, (C) normal-slip, (D) reverse-slip, and (E) movement parallel to pipeline. The last diagram shows these deformation modes in 3D (F).
The complete results of the buried natural gas pipeline system modeling, including plots showing longitudinal pipe strain versus permanent ground deformation, are provided in Hutabarat et al. (2023).
Using the parameters found to most affect the results, more than one million numerical simulations of pipelines subjected to permanent ground deformation were performed. The simulation results were used to develop relationships that estimate a distribution of longitudinal pipe strain as a function of the soil-pipeline system parameters. The complete suite of pipe strain estimation models for all cases is provided in Watson-Lamprey et al. (2023).
When OpenSRA performs the analysis (combining the EDPs from the previous section with the fragilities in this section), the program splits the continuous pipeline network into smaller segments (<100 m), which allows the program to discretize failures instead of having them be continuous.
4.2 Wells and caprocks
Figure 2 shows the steps within OpenSRA to calculate the probability of failure in wells and caprocks. The objective of this research task is to calculate the DM by estimating a damage and fragility model for both wells and caprocks. For specific details on the numerical models in this section, see Sasaki et al. (2023), Luu et al. (2023), and Zhang Y et al. (2023).
4.2.1 Fault shear across wells
The objective of this subtask is to assess the range of fault displacements that could result in well failure. To achieve this objective, a FLAC3D numerical model was constructed to simulate the mechanical response of a well during fault displacement. The model comprises both the structural elements of the well and the subsurface formation that surrounds it.
To include the uncertainty in the depth to the top of cement, two cement scenarios were considered for each well mode, cemented and uncemented annuli. In the former case, the gap between the borehole and casing was filled with cement, whereas in the latter case, the gap was left unfilled. Finally, the well shearing process was simulated by modeling reverse fault displacement. The outcome of the finite element modelling and sensitivity study was then used to estimate the fragility of wells due to fault shear.
4.2.2 Dynamic seismic analysis of well integrity
This subtask aims to estimate the maximum bending moment a casing system can sustain when subject to earthquake-induced shaking. A site-response analysis was performed using SHAKE91 to compute ground motions at 2 m depth intervals. Dynamic well simulations were performed utilizing an open-source finite-element library OpenSeesPy v3.3 (McKenna, 2011; Zhu et al., 2018). Maximum bending moment was used to describe the capacity of a casing system to withstand lateral loading. The results from the OpenSees model were used in a sensitivity study to develop both damage and fragility models.
4.2.3 Caprock integrity
In a seismic event, faults that cross a caprock could cause increased permeability if activated. This zone connects the reservoir with the formations above, creating a leakage pathway for gas to migrate upward. If the storage reservoir is also over pressured, reservoir fluid will have a driving force to migrate upwards, leading to gas loss or other environmental impacts. This subtask first established a relationship between shear displacement and fault transmissivity; then developed a numerical model to calculate damage rates resulting from changes in fault transmissivity; assessed the depth of and pressure in a gas storage reservoir susceptible to leakage; and finally performed a suite of simulations that capture uncertainties to calculate the overall fragility of caprocks.
The TOUGH (Transport of Unsaturated Groundwater and Heat) program was used with iTOUGH2 (inverse TOUGH2). Most of the underground natural gas reservoirs in California are operated far below the hydrostatic pressure (Zhang Y et al., 2023). Even when caprock integrity is compromised due to an earthquake, gas may not leak out due to the lack of a driving force. The Kirby Hills Domengine storage facility was found to be an exception. The parameters from this storage facility were adapted in the numerical model and four scenarios for this model are considered to drive the fragility curve:
• Both the reservoir and the formation above the caprock have open boundaries.
• Both the reservoir and the formation above the caprock have closed boundaries.
• The reservoir has open boundaries and the formation above the caprock has closed boundaries.
• The reservoir has closed boundaries and the formation above the caprock has open boundaries.
The model output is the cumulative gas leakage over time. The fragility model is described later.
4.3 Aboveground infrastructure
This subtask focused on developing fragility curves for different components of aboveground infrastructure (see Figure 3). Because aboveground infrastructure is used to broadly describe many components of a natural gas storage facility, this task is split into five outcomes:
• Outcome #1: Experimental Data on Critical Components
• Outcome #2: Experimental Data Relative to Subsystems
• Outcome #3: Calibrated Nonlinear Steel Properties
• Outcome #4: Seismic Analysis of Nonlinear Subsystems
• Outcome #5: Fragility Development (described further in Watson-Lamprey et al., 2023)
4.3.1 Outcome #1: experimental data on critical components
Table 3 presents the test matrix for the component tests performed at the UCSD Powell laboratories. Because these components behave differently depending on the direction of loading, select components were tested in the in-plane and out-of-plane direction.
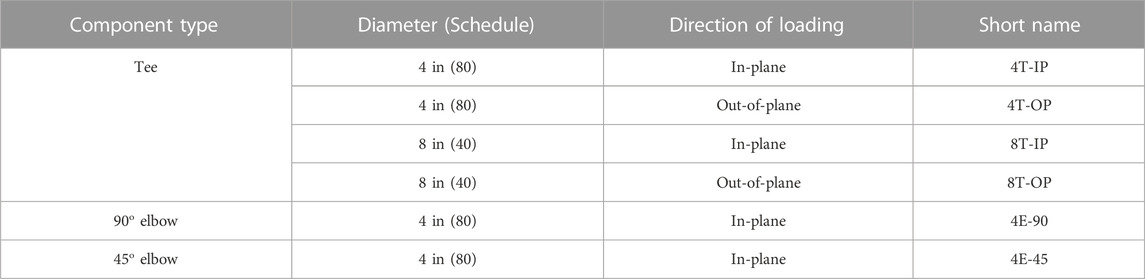
TABLE 3. Test matrix of component specimens.
Pre-test simulations for each specimen were performed using Abaqus to support the development of the load protocol and instrumentation plans. For specifics on material type, model development, and individual test set up, see Pantoli and Hutchinson, (2023b). The progression of damage was the same for all the specimens except 8T-IP, and included the following limit states:
1. First ovalization. This limit state identifies the moment when a visible deformation of the component could be observed for the first time.
2. First crack. This limit state indicates the appearance of a shallow crack at locations of high strains.
3. Through crack. Sudden loss of internal pressure occurs when the one or more shallow cracks became through cracks. This is considered specimen failure.
Components failing in this way are deemed ductile, since they show warning signs before failure happens. The only specimen that had a brittle failure at a point away from the location of high strains predicted by Abaqus was 8T-IP.
4.3.2 Outcome #2: experimental data relative to subsystems
A dynamic test series was conducted on a generic (full-scale) surface infrastructure subsystem at the Earthquake Engineering Laboratory at UNR using two biaxial shake tables. Figure 9 shows a rendering of the subsystem tested at UNR while Figure 10 shows a photograph of this subsystem and its relevant components.
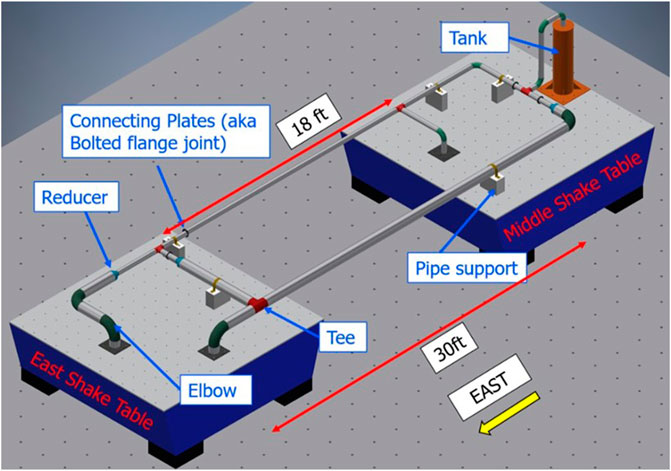
FIGURE 9. Rendering of the subsystem experiment (Elfass et al., 2023).
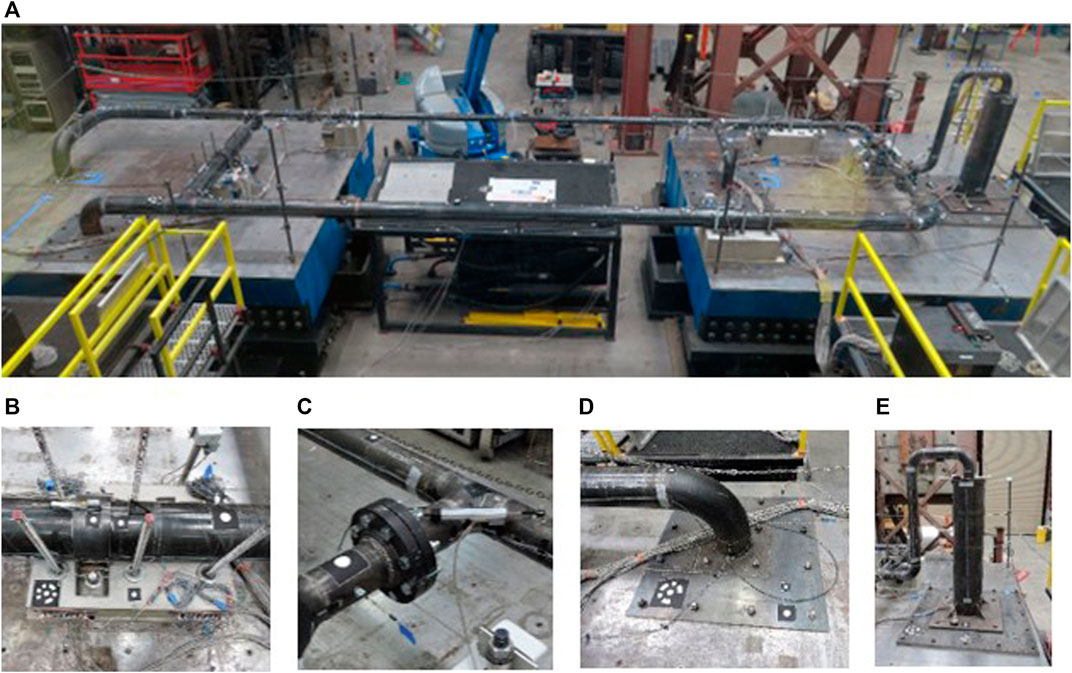
FIGURE 10. Photograph of the subsystem tested at UNR: (A) Assembled subsystem on the UNR shake tables, (B) Pipe support, (C) Connecting plates, (D) Elbow, (E) Vertical tank (Elfass et al., 2023).
A nonlinear numerical model was developed before the test to gain insights on the expected behavior of the subsystem. Information on the validation of this model can be found in Elfass et al. (2023). The model indicated no damage should occur if the subsystem was subjected to uniform earthquake accelerations; however, significant deformation and yielding could occur if the subsystem was subjected to large relative displacement. Thus, the subsystem was subjected to three types of motions: broad-band white noise, synchronous motions, and asynchronous (time shifted) motions. Information on the test setup, instrumentation, and loading protocol are provided by Elfass et al. (2023).
Through these laboratory tests it was found that only large relative deformations caused any yielding or failure. It was also noted that the subsystem did not experience any leaks or loss of pressure. At large rotations, damage was observed to the concrete pedestal at one pipe support.
4.3.3 Outcome #3: calibrated nonlinear steel properties
Creating a robust and reliable nonlinear material model for steel is required for the reasonable estimation of the response of a steel component subjected to the large cyclic deformations that can be caused by earthquakes. To support this need, the aforementioned component experimental data were utilized iteratively to calibrate the nonlinear material properties for the steel used for tees and elbows in the finite element models. The optimal values of the cyclic hardening parameters were obtained by minimizing the error between the experimental results from component tests and the corresponding Abaqus numerical predictions for all specimens tested. Further information about the validation process can be found in Pantoli and Hutchinson, (2023a).
4.3.4 Outcome #4: seismic analysis of nonlinear subsystems
As part of this research task the team developed a procedure for the seismic analysis of nonlinear natural gas subsystems using OpenSees which can be used to generate fragility curves for OpenSRA. In this procedure, the nonlinearities and failure points of the subsystem are concentrated at the location of critical components, while the remainder of the model subsystem remains linear. The subsystems explored are the wellhead tree-pipeline (WTP) subsystem where buried pipelines come to the surface and end in a wellhead, that then distributes the gas aboveground, and vertical pressure vessels (VPV). The geometry of these subsystems is based on photographic evidence found on public resources, design calculations, manufacturer catalogues of valves and other components, site visits to a gas storage facility, and personal communication with experts at utility companies.
4.3.4.1 WTP subsystem
Wellheads are a common aboveground infrastructure at gas storage facilities. Further information regarding wellhead trees and their geometry in California and Validation of the OpenSees model can be found in Pantoli and Hutchinson, (2023a). The procedure used to calibrate the parameters of this model in OpenSees involved the following:
• A numerical model of the critical components and sections of straight pipes created in Abaqus. This model uses the calibrated material properties obtained in outcome #3 and the field boundary conditions.
• An OpenSees model of the same geometry and boundary conditions is created.
• The two models are subjected to the same displacement-controlled cyclic analysis with a load protocol.
• The forces necessary to obtain this displacement in the Abaqus and OpenSees are compared.
This same procedure can be used to extend the results to a wider range of component types/details and loading conditions. As an additional step in validation, impact tests were performed at a natural gas storage field in California.
4.3.4.2 VPV subsystem
The vertical pressure vessels observed at gas storage facilities comprise a tall cylindrical vessel with hemispherical or elliptical heads supported by a skirt. The optimal EDP for these analyses is the ratio between the moment demand at the base imposed by an earthquake and the moment capacity at which a limit state is achieved.
4.3.4.2.1 Validation of the VPV subsystem
For the validation of this subsystem, a sample VPV geometry was selected based on representative information of a pressure vessel provided by a gas company in California. This sample VPV was modeled using Abaqus and complimentary but simplified linear version utilizing 1D finite elements within OpenSees. These results show that:
• The movement of the pressure vessel itself is not affected by the movement of the pipes.
• The inlet pipe connected to the bottom of the pressure vessels has minimal movement in these lower frequency modes.
• The simplified OpenSees model can capture the behavior of this subsystem predicted by the more refined Abaqus model.
4.4 Synthesis of component fragilities into a system performance model
4.4.1 Buried pipelines
The results of buried pipeline fragility development show the suggested lognormal CDFs for the tensile strain damage state fragility functions assuming a constant aleatory variability, σ = 0.30, for both leakage and rupture, which was estimated using expert opinion (Abrahamson, 2022). The 10th and 90th percentiles are presented for the fragility functions assuming constant epistemic uncertainty, σepi = 0.20, a common assumption for structural systems. σ represents the aleatory variability in the fragility models due to inherent randomness in the loading conditions (e.g., eccentricities in the pipe alignment, nonuniform backfill soil conditions) and pipe properties (e.g., post-yield stress-strain behavior, weld quality, corrosion). Similarly, for compressive rupture and leakage the 10th and 90th percentiles are presented for the fragility functions assuming a constant epistemic uncertainty of σepi = 0.25. The data used to derive the fragility function were from controlled laboratory testing to account for greater uncertainty associated with field conditions, the aleatory variability,
Pipelines can often sustain more axial strain after the initiation of buckling or pipe wall wrinkling before pipe wall tearing or rupturing occurs. The probability of compressive rupture (due to buckling or pipe wall wrinkling) fragility function accounts for this additional capacity by shifting the 50% probability of exceedance values in the original fragility function up to the 20% probability of exceedance level in the final function. Additional details of the pipeline fragility models are provided in Bain et al. (2023a).
4.4.2 Wells and caprocks
The probability of ground shaking induced failure and fault shear induced failure is included in Watson-Lamprey et al. (2023) for casing, production casing, surface casing, well tubings, and caprocks. The median failure mechanism (slip or plastic moment) at which 50% probability of failure occurs is compiled and estimated by the wells and caprocks task group.
4.4.2.1 Aboveground systems
The models for failure of aboveground components are dependent on ground shaking. As seismic hazards are distributed over an area, all aboveground components that are within 200 km of each fault trace are evaluated for ground shaking induced failure.
4.4.2.2 Well tree
Methodologies for the probability of failure for well trees fall into six cases, these cases are further split up based on direction of ground motion. In total there are 22 unique models that need to be computed to the distribution of joint rotation over the six subsystem-component combination. Each of the rotation models are then propagated into models for longitudinal strain, and subsequently the probability of failure given longitudinal strain. Once the probability of failure for a specific subsystem-component combination, direction of shaking, joint location, and orientation is determined, then the distributions of probability of failure for all variations within each subsystem-component are averaged to obtain the overall average distribution for probability of failure.
4.4.2.3 Pressure vessels
For the pressure vessels, the critical component considered was the base of the pressure vessel. Two types of base connections were considered. The first represents the configuration of older pressure vessels, in which the base anchors are embedded in a concrete footing and thus designed as a fully fixed connection. In this case, no elongation of the anchor will occur, and minimal base rotation is anticipated, consequently the base of these pressure vessels is considered fixed. This case is labeled as “no stretch length.” The second configuration is typical of newer pressure vessels. In this case, the anchors have a designed free stretch length of at least eight times the diameter of the anchor. This allows the base to rotate; hence a nonlinear spring is incorporated in the model at the base of the vessel.
5 Sensing technologies
A comprehensive review of sensing technologies was undertaken to identify the technologies that can inform the risk models at the input, intermediate, and final output stages. The sensing technologies introduced in Wang et al. (2023) were selected depending on OpenSRA parameters, which include geologic information and characteristics of the natural gas infrastructure. Wang et al. (2023) provides comparison tables for each sensing technology and further information on how each can be used on specific components of the natural gas infrastructure system. The selected sensing technologies can be categorized into four main categories:
1. Remote sensing technologies
2. Continuous monitoring technologies
3. Inspection technologies
4. Leakage detection technologies
5.1 Remote sensing technologies
Ground deformation is an important input in OpenSRA regardless of the level of analysis. Remote sensing technologies have been used widely to detect and monitor objects (including ground deformation).
5.1.1 Continuous monitoring technologies
Continuous monitoring technologies are deployed on site and operate on stand-alone power and cellular communication. The selected continuous monitoring technologies include distributed fiber optic sensors (DFOS) and wireless sensor network (WSN). Figure 11 specifically outline uses of WSN and more information regarding DFOS and the tests done within this project can be found in Wang et al. (2023).
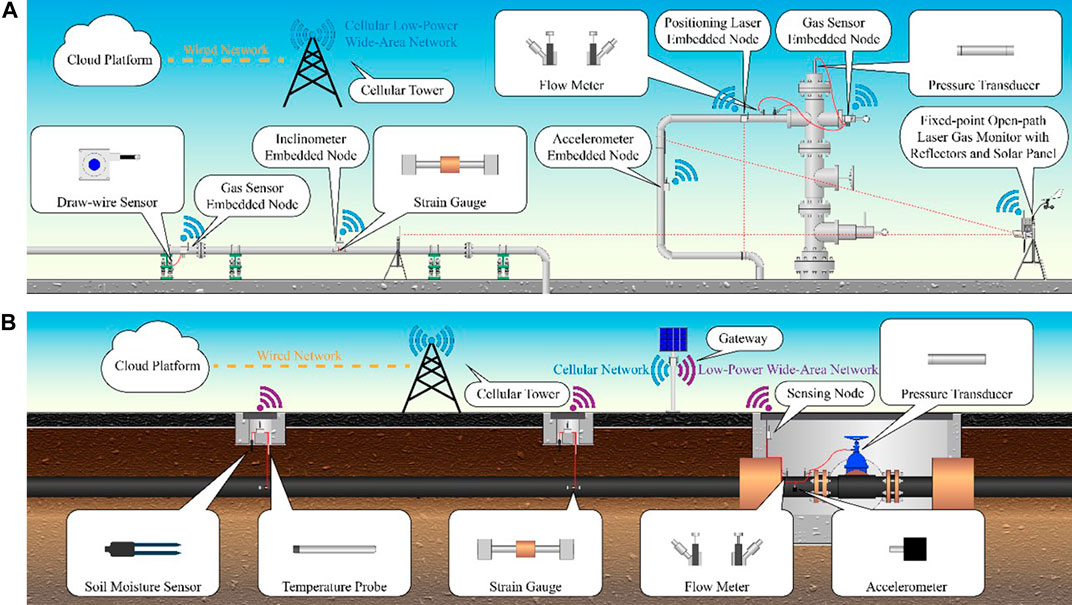
FIGURE 11. WSN Instrumentations: (A) Aboveground (B) underground gas pipeline monitoring (Wang et al. (2023).
5.1.2 In-line inspection technologies
Inspection technologies to identify pipeline characteristics from inside the pipe were explored. These characteristics can be used as a reference for inputs and to verify the intermediate and final outputs of OpenSRA. This project focused on the In-line Inspection (ILI) techniques which can be done at the same time as the periodically pigging progress.
5.1.3 Leakage detection technologies
Gas and flow sensing technologies help characterize leakage events and provide information on the amount of the leakage. This helps utility owners focus mitigation efforts after a seismic event occurs. This project introduces different types of gas and flow sensors, including their mechanisms, abilities, limitations, and comparisons as a reference for helping users to select the sensors that suit their applications best.
5.1.4 OpenSRA informing technologies guidance
Measurement data (as seen in the laboratory testing in previous sections) aids in the industry’s understanding of how a system reacts in a seismic event. Leveraging this measured data will continue the progress made in this project to update current risk models. Implementing sensing technologies now will aid the industry in decision-making and risk mitigation in the future. Further information can be found in Wang et al. (2023) regarding how different sensing technologies can better the analyses on specific natural gas infrastructure.
6 OpenSRA graphical user interface
The final component of the OpenSRA tool is the graphical user interface (GUI). It implements the backend calculations in a way that can be easily visualized by users. The SimCenter (working with Slate) created a user-friendly interface that was intuitive for users and displayed results in a straightforward manner. The GUI is split into tabs to walk the user through the inputs and outputs provided in the program.
Figure 12 shows an example of the GUI, specifically highlighting the “Visualization” tab and the mapping component of the program. The GUI utilizes QGIS to visualize the results on different base maps. The user can easily import CSV data and shapefiles to visualize their specific infrastructure. The program also depicts UCERF3 fault traces and imported ShakeMaps. Figure 12 shows the publicly available transmission pipeline network in the Bay Area, with the 2014 South Napa ShakeMap. This “Visualization” tab allows the user to select specific infrastructure to see the results in tabular form (shown on the right of Figure 13).
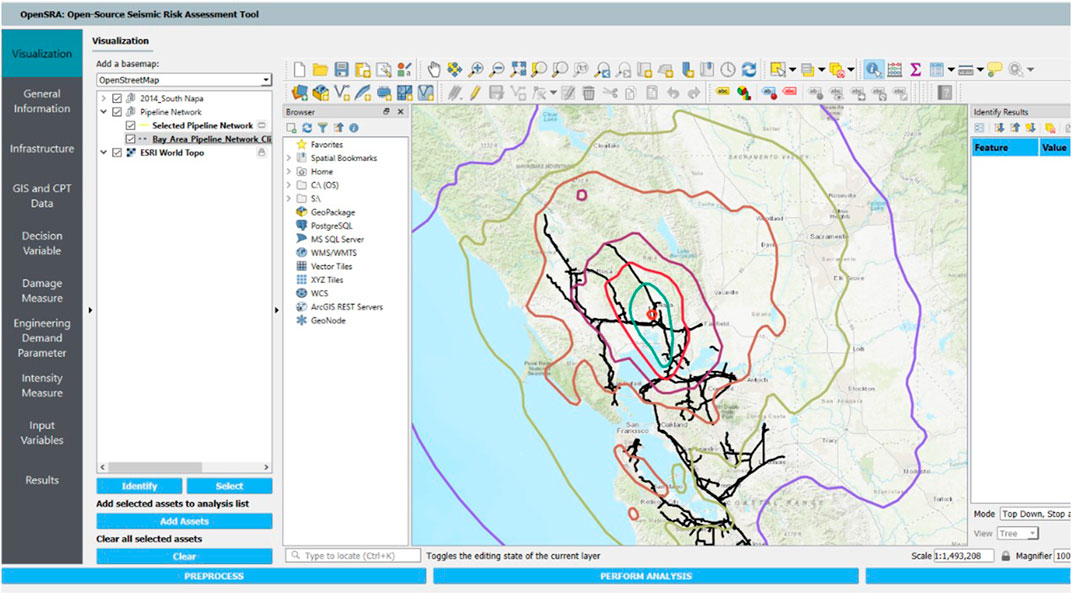
FIGURE 12. Screenshot of OpenSRA graphical user interface.
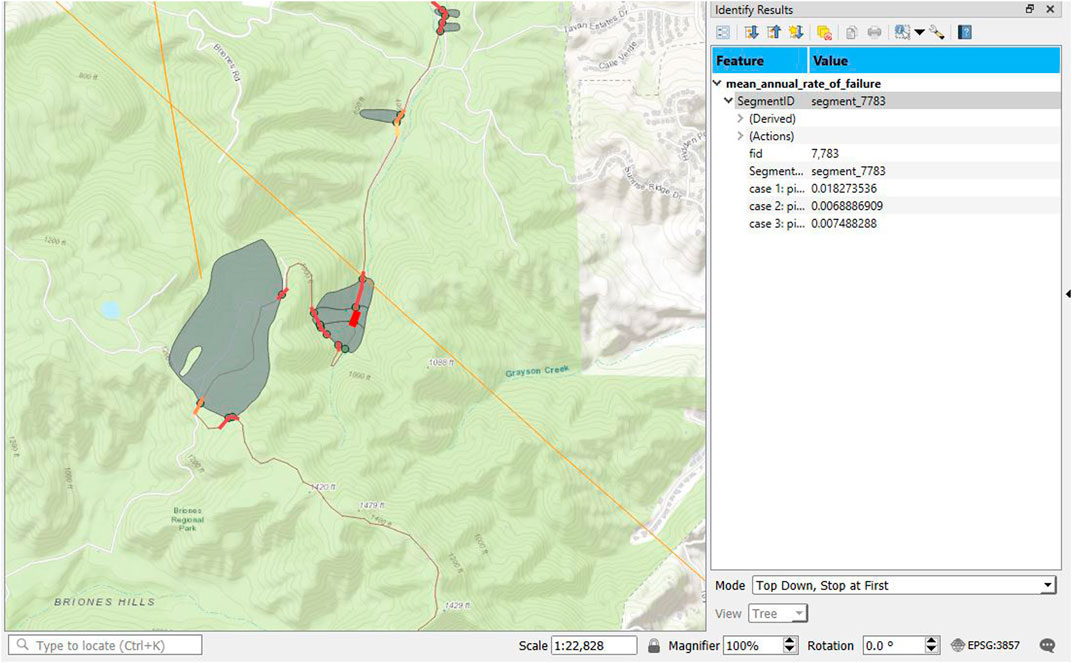
FIGURE 13. Example of the OpenSRA visualization tab with tabulated results.
The remaining tabs are shown on the left of Figure 12 and are the components of the GUI where the user can input their analysis information. OpenSRA is a desktop application, which enables utility owners and operators to utilize their proprietary infrastructure while maintaining confidentiality. The “Infrastructure” tab is the main input tab, this is where the user can not only import their infrastructure and any site-specific information such as shear wave velocities, or other soil properties. The information can be imported as a CSV file or as a GIS file. Each type of infrastructure has a slightly different layout. Each component is defined as a latitude and longitude coordinate, along with characteristics of the component. An example of this is shown in Figure 14. The user selects which type of infrastructure they would like to input (pipeline, aboveground, or wells and caprocks); this then tailors the remaining tabs to the selected type.
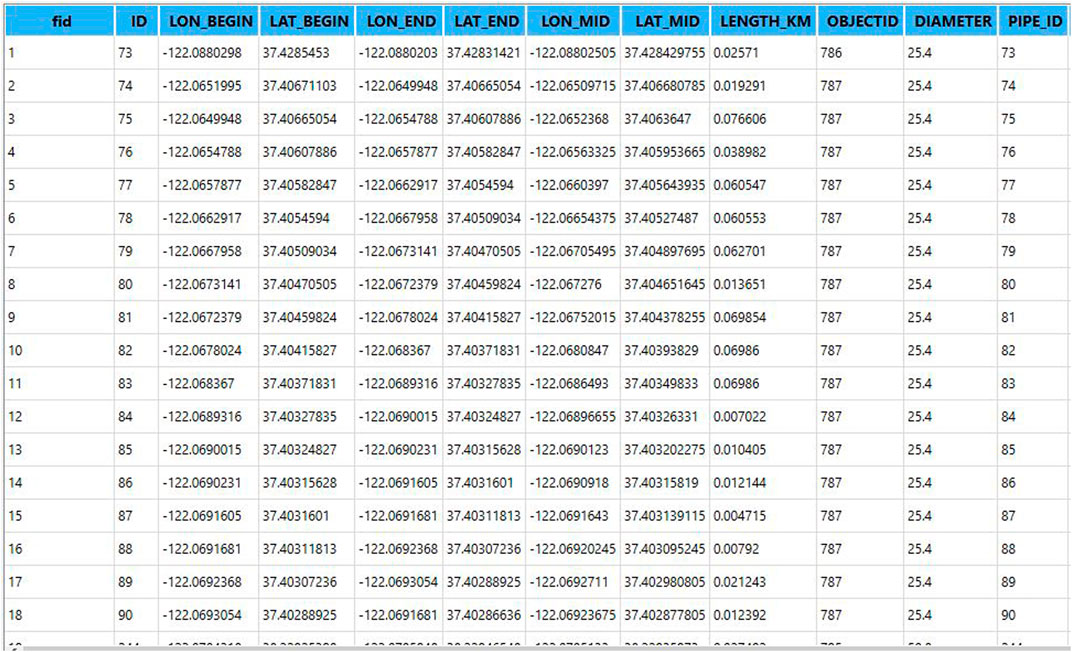
FIGURE 14. Example of the input infrastructure table.
The next few tabs specifically follow the PBEE framework (in reverse order). Each tab gives options for the different available models. These tabs integrate the targeted research on seismic demand and capacity of natural gas infrastructure into the GUI. The “Decision Variable,” “Damage Measure,” “Engineering Demand Parameter” all present the models outlined in Sections 3 and 4 depending on the piece of infrastructure selected under “Infrastructure.” These sections fuse the backend calculations from the research tasks and the work performed by the SimCenter. Each research task worked with the OpenSRA development team to ensure that their models were implemented and shown correctly in the user interface. This ensures the inputs needed were displayed appropriately and the correct results were calculated. The next step in the PBEE framework and next tab is the “Intensity Measure” tab which allows the user to select the ground motion input. The available options for intensity measures are: UCERF3 combined with NGAWest2, ShakeMaps, and a User Defined Rupture. The “Input Value” tab is an additional input section that changes based on the models chosen in the “Engineering Demand Parameter,” “Damage Measure,” and “Decision Variable” tabs. This tab enables the user to assign distributions to parameters and select columns in the “Infrastructure” tab if site-specific data was imported. The final step in the GUI is exporting the data. Currently, the software automatically exports the data to excel files to a user-specified location.
Overall, the user interface utilizes tools previously developed by SimCenter, ArcGIS, and the research performed under this project to create a user-friendly experience. The interface intuitively steps through the PBEE framework and allows the user to specify inputs throughout the process. Once the analysis is run, the program visually displays the results and exports them for easy post-processing. The creation of OpenSRA advances the use of seismic risk in the natural gas industry. It also allows for future development in seismic risk analyses for other industries.
6.1 OpenSRA example
OpenSRA has over 30 pre-loaded examples that highlight the different capabilities of the program. The following section walks through a belowground pipeline analysis at Balboa Blvd. (one of the validation exercises from Section 2.5) using Cone Penetration Test (CPT) data and Level 3 EDP analysis methods. This example uses a ShakeMap to assess the potential of lateral spreading at Balboa Blvd. and any subsequent failures. The example imports all the necessary information to perform the analysis. First, the program imports pipeline data (e.g., latitude and longitude, pipe diameter and thickness) using a GIS shapefile into the Infrastructure tab. It then selects Level 3 analysis methods for Decision Variable, Damage Measure, and Engineering Demand Parameter tabs. In the Intensity Measure tab, the example imports the 1994 Northridge ShakeMap (shown in Figure 15).Finally, for the GIS and CPT data, the program imports CPT data to assess the soil properties for use in the probability of lateral spreading analysis (EDP models).
FIGURE 15. Belowground pipeline example using the 1994 Northridge earthquake.
Figure 16 shows the results for probability of pipe compressive rupture from this example. On the southern end of Balboa Blvd., the program estimates between 20% to over 80% probability of failure for four of the five pipelines. The four pipelines where OpenSRA estimates the highest probability of failure were also the pipelines that failed during the 1994 earthquake. These pipelines specifically failed on the southern end of Balboa Blvd. OpenSRA contains similar examples that walk through the other validation sites and exercises used to verify the program (when not protected under a non-disclosure agreement). Further information on these analyses can be found in Bain et al. (2023b).
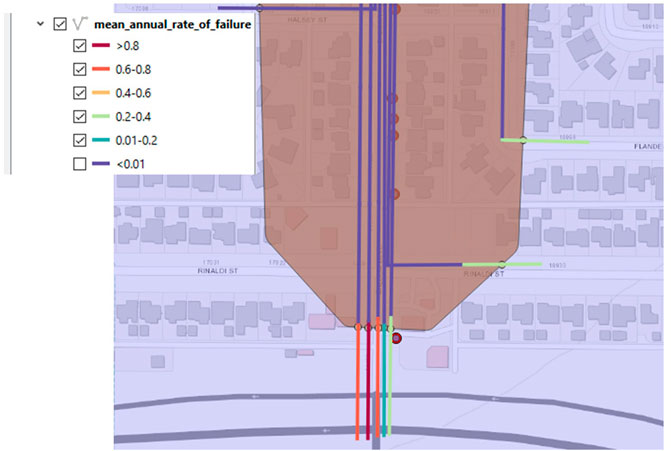
FIGURE 16. Results from Balboa Blvd. belowground pipeline example.
7 Discussion
The OpenSRA software helps utility owners assess their infrastructure before and after earthquakes. It also provides a consistent means for regulators to assess the seismic risk of the natural gas infrastructure in California. The software helps prioritize mitigation efforts of potentially vulnerable systems before an earthquake utilizing ground motion prediction equations and of past earthquakes using ShakeMaps. After a seismic event occurs OpenSRA also allows the end-user to assess potential leaks and breaks in the system to mobilize repair teams quickly. This ability to prioritize mitigation efforts before an earthquake and to prioritize repair efforts after an event allows utility owners to protect their constituents from potentially catastrophic failures. Along with this, these mitigation efforts reduce environmental impacts and allow for efficient planning and construction to occur on new natural gas infrastructure.
Given the limited timeframe of the project and the lack of existing fragility curves currently available, this project focused on common infrastructure. OpenSRA would benefit from additional research to:
1. Integrate directly with the USGS for ShakeMap scenarios.
2. Develop and incorporate additional ground failure hazard demand models.
3. Extend numerical models of soil-pipeline response to capture additional pipe systems and soil conditions for additional loading scenarios such as distributed shear.
4. Develop fragility functions for components not investigated in this research project, such as the performance of pipelines attached to bridges crossing rivers.
5. Additional pipe component and system testing to refine their fragility functions.
6. Allow for more flexibility in input datasets and outputting results.
7. Integrate network/flow analysis into infrastructure types that have upstream/downstream dependencies.
8. Allow for more complex fault rupture scenarios.
9. Integrate other forms of natural hazards.
10. Further develop the backend to improve computational efficiency.
11. Develop cloud-/server-based dissemination of datasets and updates or extend the application to be web-based for broader access.
12. Install sensing technologies in a variety of natural gas infrastructure systems to evaluate their performance over an extended period.
13. Develop methodologies to optimize the updating of models using information from sensors on natural gas infrastructure.
It is the hope of the research team to continue to expand the use of OpenSRA through future research projects.
8 Conclusion
The project developed new seismic risk assessment methods (both demand and fragility functions of components) and implemented these into an open-source seismic risk assessment software called OpenSRA. The project was split into six task groups to assess the seismic demands imposed on natural gas infrastructure and the seismic fragility of individual components. The project teams provided guidance on how to calculate the probability of failure for different components of the natural gas system. This guidance was based on literature reviews, discussions with utility owners, data analysis, laboratory testing, and numerical modeling.
The primary result of this project is the user-friendly open-source seismic risk software for natural gas pipelines and storage facilities called OpenSRA. It is available to the public through the PEER website. The OpenSRA software addresses several of the concerns associated with the ad hoc way current seismic risk assessments of natural gas pipelines and storage facilities are performed. The software is intended to be used on a desktop computer. To reduce calculation time, which was a primary objective of the software development, a novel method called Polynomial Chaos was implemented. This methodology can employ clearly defined means, aleatory variabilities, and epistemic uncertainties for each step of the PBEE risk methodology to deliver results rapidly. The use of Polynomial Chaos over traditional Monte-Carlo sampling reduced computation time by two to three orders of magnitude. The OpenSRA software provides a friendly user interface to help utility owners and regulators to visualize and interpret results to help prioritize mitigation efforts.
The PBEE framework is fully implemented into the OpenSRA software through fragility curves that describe the seismic performance of key natural gas infrastructure components. The developed fragility models incorporate comprehensive inventories of fault and pipeline crossings for California using the Quaternary Faults and Fold database and incorporate geologic, subsurface, and topographic data required in updated earthquake hazard regional scale assessments. The end products given for seismic demands included a fault-pipeline crossing database, methods to estimate primary and secondary fault displacement hazard, and methods to estimate geohazard-induced by seismicity. Along with fault displacement hazard, improved models of earthquake-induced ground failure hazards (i.e., liquefaction-induced lateral spreading and earthquake-induced landslides) were developed to capture these hazards at different levels of regional scale analysis. The uncertainty assigned to the ground failure hazard models at different regional scales is consistent with the information available in California at the state-wide, regional, and site-specific levels.
Fragility curves were developed for buried pipelines, wells and caprocks, and aboveground gas infrastructure. The fragility curves were developed through state-of-the-art numerical modeling efforts based on how system components respond to earthquake hazards coupled with laboratory testing. Experiments of pipe components and aboveground subsystems provided critical insights on their seismic performance. These laboratory tests helped validate the numerical models that were used to estimate the fragility curves for the aboveground systems.
New sensing technologies were identified which can inform the risk models at the input, intermediate, and final output stages. The selected sensing technologies can be categorized into four main categories: 1. Remote sensing technologies, 2. Continuous monitoring technologies, 3. Inspection technologies, and 4. Leakage detection technologies. They were selected depending on the employed OpenSRA parameters, which include available geologic information and characteristics of the natural gas infrastructure.
The OpenSRA open-source seismic risk assessment tool developed through this research effort helps utility owners and operators perform efficient seismic risk assessments of their infrastructure with state-of-the-art models to help prioritize mitigation efforts.
Data availability statement
The raw data supporting the conclusion of this article will be made available by the authors, without undue reservation. Experimental data are being archived in the NSF NHERI DesignSafe Data Depot.
Author contributions
ML pulled together this report, including a large portion of writing and formatting. She helped as the assistant project manager on this project, and had a hand in all components of research and OpenSRA development. JB was the Principal Investigator on this project, which also included overseeing the research of the buried pipeline and geohazard research teams. He also aided in a writing this report and added crucial input. JW-L served as Project Manager for this project and oversaw all of the groups. She either created or helped create all of the damage and fragility models for each research task. She helped in editing and contributing to this paper. NA helped with the backend calculations and integration into OpenSRA. He is one of the main researchers of Polynomial Chaos, OpenSRA is able to run efficiently because of NA. He also largely contributed to the ground motion hazard analysis on this project. All authors contributed to the article and approved the submitted version.
Funding
This research study was funded by the California Energy Commission (CEC), under Contract No. PIR 18-003.
Acknowledgments
The authors want to recognize the CEC and thank the Commission for recognizing how vital this research is to the industry. We would like to thank them for funding this project and giving us the opportunity to refine current practice with more in-depth research. Specifically, we would like to thank Dr. Yahui Yang, the project manager of the CEC, for providing guidance throughout the process of developing the interim reports and final report. JB of University of California, Berkeley is the PI of the project and JW-L of Slate Geotechnical Consultants is the Project Manager. JW-L with ML and Dr. Barry Zheng of Slate Geotechnical Consultants helped us organize our collaborations with the different research teams. These included the fault displacement research task (NA, Dr. Maxime Lacour, and Dr. Steve Thompson), liquefaction and landslide (JB, Chris Bain, Dr. Daniel Hutabarat, Prof. Thomas O’Rourke, and Scott Lindvall), the wells and caprocks team members (Dr. Jonny Rutqvist, Dr. Keurfon Luu, Preston Jordan, Dr. Tsubasa Sasaki, Dr. William Foxall and Dr. Yingqi Zhang), Task D members (Prof. Tara Hutchinson, Prof. David McCallen, Prof. Sherif Elfass, Dr. Elide Pantoli and Dr. Suiwen Wu), and the sensing technologies team members (Dr. Kenichi Soga, Dr. James Wang, Peter Hubbard, and Tiachen Xu). Dr. Stevan Gavrilovic, Dr. Sanjay Govindjee, Dr. Frank McKenna, Dr. Matthew Schoettler of the NHERI SimCenter at UC Berkeley provided software development support. Grace Kang, Dr. Amarnath Kasalanati, and Dr. Arpit Nema of the Pacific Earthquake Engineering Research Center (PEER) provided outreach, administrative, and technical support of the project. Shakhzod Takhirov, Llyr Griffiths, and Matt Cataleta of UC Berkeley’s Civil Engineering laboratories also supported the demonstration testing. Pacific Gas and Electric Company (PG&E) and the East Bay Municipal Utility District donated testing samples. Dr. Sjoerd van Ballegooy and his staff at Tonkin & Taylor, Ltd. of New Zealand shared data and insights on the ground characterization and ground performance data of the Canterbury Earthquake Sequence. Tim McCrink and Dr. Erik Frost from the California Geological Survey provided a database of rock strength test results and insights into regional slope stability and displacement analyses in California. Dr. Christina Argyrou and Dr. Dilan Roberts shared their experience with Abaqus and its models. Prof. Katerina Ziotopoulou and Renmin Pretell of University of California, Davis provided invaluable insights into the soil performance at the Balboa Boulevard demonstration site during the Northridge earthquake. Dr. Craig Davis provided strength test data for the Granada water trunk line at Balboa Boulevard and insights into evaluating uncertainty in pipeline material properties. Amy Frithsen managed the grant and contracts at UC Berkeley. The authors thank the project partners of PG&E and Southern California Gas Company (SoCalGas) for sharing data, insights, and technical advice throughout the project, with particular thanks to Dr. Chris Madugo, Dr. Albert Kottke, Dr. Masoud Poul, Nozar Jahangir, Jeremy Dong, Dr. Masoud Mogtarderi-Zadeh, Jeffrey Bachhuber, and the technical staff at PG&E.
Conflict of interest
Authors ML and JW-L were employed by Slate Geotechnical Consultants.
The remaining authors declare that the research was conducted in the absence of any commercial or financial relationships that could be construed as a potential conflict of interest.
Publisher’s note
All claims expressed in this article are solely those of the authors and do not necessarily represent those of their affiliated organizations, or those of the publisher, the editors and the reviewers. Any product that may be evaluated in this article, or claim that may be made by its manufacturer, is not guaranteed or endorsed by the publisher.
Author disclaimer
The opinions, findings, conclusions, and recommendations expressed in this publication are those of the authors and do not necessarily reflect the view of CEC and its employees, the State of California, the PEER Center, and the Regents of the University of California.
References
Bain, C. A., and Bray, J. D. (2023). Regional scale probabilistic procedure for estimating lateral spread displacements. Soil Dyn. Earthq. Eng. J 171, 107928. doi:10.1016/j.soildyn.2023.107928
Bain, C., Bray, J. D., O’Rourke, T. D., Lindvall, S., and Hutabarat, D. (2023a). OpenSRA ground failure hazard demands (OpenSRA project), PEER report No. 2023/10. Pacific earthquake engineering research center. Berkeley, CA: University of California.
Bain, C., Hutabarat, D., Bray, J. D., Abrahamson, N., O’Rourke, T. D., and Lindvall, S. (2022). Performance-based earthquake engineering assessment tool for natural gas storage and pipeline systems, task B - enhanced liquefaction and ground deformation report. California Energy Commission.
Bain, C., O’Rourke, J., Bray, B., Zheng, D., Hutabarat, S., Lindvall, P., et al. (2023b). “Performance-based earthquake engineering assessment tool for natural gas storage and pipeline systems, validation report. (OpenSRA project),” in PEER report No. 2023/06. Pacific earthquake engineering research center (Berkeley, CA: University of California).
Boulanger, R. W., and Idriss, I. M. (2016). CPT-based liquefaction triggering procedure. J. Geotechnical Geoenvironmental Eng. 142 (2), 04015065. doi:10.1061/(asce)gt.1943-5606.0001388
Bray, J. D., and Macedo, J. (2019). Procedure for estimating shear-induced seismic slope displacement for shallow crustal earthquakes. J. Geotechnical Geoenvironmental Eng. 145 (12), 04019106. doi:10.1061/(asce)gt.1943-5606.0002143
Cetin, K. O., Bilge, H. T., Wu, J., Kammerer, A. M., and Seed, R. B. (2009). Probabilistic model for the assessment of cyclically induced reconsolidation (volumetric) settlements. J. Geotechnical Geoenvironmental Eng. 135 (3), 387–398. doi:10.1061/(asce)1090-0241(2009)135:3(387)
Cornell, C. A. (1968). Engineering seismic risk analysis. Bull. Seismol. Soc. Am. 58, 1583–1606. doi:10.1785/bssa0580051583
Elfass, S., McCallen, D., and Wu, S. (2023). Shake table testing of a representative surface natural gas piping subsystem. (OpenSRA project), PEER report No. 2023/17. Pacific earthquake engineering research center. Berkeley, CA: University of California.
FEMA (2020). Hazus 4.2 SP3 technical manual. Federal Emergency Management Agency. Available at: https://www.fema.gov/sites/default/files/2020-10/fema_hazus_earthquake_technical_manual_4-2.pdf.
Grant, A., Wartman, J., and Abou-Jaoude, G. (2016). Multimodal method for coseismic landslide hazard assessment. Eng. Geol. 212, 146–160. doi:10.1016/j.enggeo.2016.08.005
Holzer, T. L., Noce, T. E., and Bennett, M. J. (2011). Liquefaction probability curves for surficial geologic deposits. Environ. Eng. Geoscience 17 (1), 1–21. doi:10.2113/gseegeosci.17.1.1
Hutabarat, D., O’Rourke, T. D., Bray, J. D., Bain, C., and Lindvall, S. (2023). Fragility development of buried pipelines. (OpenSRA project), PEER report No. 2023/11. Pacific earthquake engineering research center. Berkeley, CA: University of California.
Idriss, I. M., and Sun, J. I. (1993). User’s manual for SHAKE91: A computer program for conducting equivalent linear seismic response analyses of horizontally layered soil deposits. Davis: Center for Geotechnical Modeling, University of California.
Idriss, I. M., and Boulanger, R. W. (2008). Soil liquefaction during earthquakes. Oakland: Earthquake Engineering Research Institute. EERI Publication, Monograph MNO-12.
Itasca Consulting Group (2020). FLAC3D — fast Lagrangian analysis of continua in three-dimensions. Available at: https://www.itascacg.com/software/FLAC3D.
Ku, C. S., Juang, C. H., Chang, C. W., and Ching, J. (2012). Probabilistic version of the robertson and wride method for liquefaction evaluation: Development and application. Can. Geotechnical J. 49 (1), 27–44. doi:10.1139/t11-085
Lacour, M., and Abrahamson, N. (2021). Efficient propagation of epistemic uncertainty for probabilistic seismic hazard analyses (PSHAs) including partial correlation of magnitude–distance scaling. Bull. Seismol. Soc. Am. 111 (6), 3332–3340. doi:10.1785/0120200381
Lacour, M., and Abrahamson, N. (2023). Efficient risk calculation for performance-based earthquake engineering distributed systems. (OpenSRA project), PEER report No. 2023/08. Pacific earthquake engineering research center. Berkeley, CA: University of California.
Luu, K., Jordan, P., Foxall, W., and Rutqvist, J. (2023). “Fragility of wells due to dynamic shaking—the impact of ground motions on the integrity of natural gas storage wells in California. (OpenSRA project),” in PEER report No. 2023/13. Pacific earthquake engineering research center (Berkeley, CA: University of California).
McKenna, F. (2011). OpenSees: A framework for earthquake engineering simulation. Comput. Sci. Eng. 13 (4), 58–66. doi:10.1109/MCSE.2011.66
Moehle, J., and Deierlein, G. G. (2004). “A framework methodology for performance-based earthquake engineering,” in 13th World Conference on Earthquake Engineering Proceedings, Vancouver. WCEE.
Moss, R. E., Seed, R. B., Kayen, R. E., Stewart, J. P., Der Kiureghian, A., and Cetin, K. O. (2006). CPT-based probabilistic and deterministic assessment of in situ seismic soil liquefaction potential. J. Geotechnical Geoenvironmental Eng. 132 (8), 1032–1051. doi:10.1061/(asce)1090-0241(2006)132:8(1032)
Pantoli, E., and Hutchinson, T. C. (2023b). Experimental study on the cyclic behavior of welded steel tee joints and elbows. (OpenSRA project), PEER report No. 2023/16. Pacific earthquake engineering research center. Berkeley, CA: University of California.
Pantoli, E., and Hutchinson, T. C. (2023a). Numerical modeling and seismic fragility curve development: Components and subsystems of the natural gas surface infrastructure. (OpenSRA project), PEER report No. 2023/15. Pacific earthquake engineering research center. Berkeley, CA: University of California.
Petersen, M. D., Dawson, T. E., Chen, R., Cao, T., Wills, C. J., Schwartz, D. P., et al. (2011). Fault displacement hazard for strike-slip faults. Bull. Seismol. Soc. Am. 101, 805–825. doi:10.1785/0120100035
Pruess, K., Oldenburg, C., and Moridis, G. (2011). TOUGH2 user’s guide, version 2. LBNL-43134. CA: Lawrence Berkeley National Laboratory.
Robertson, P. K. (2009). Interpretation of cone penetration tests—A unified approach. Can. geotechnical J. 46 (11), 1337–1355. doi:10.1139/t09-065
Robertson, P. K., and Wride, C. E. (1998). Evaluating cyclic liquefaction potential using the cone penetration test. Can. geotechnical J. 35 (3), 442–459. doi:10.1139/t98-017
Rockpoint Gas Storage (2021). Rockpoint gas storage lodi. Retrieved March 2021, Available at: https://www.rockpointgs.com/Businesses/Lodi.
Sasaki, T., Jordan, P., Foxall, W., and Rutqvist, J. (2023). “Fragility of wells due to fault shearing—the impact of Fault Displacement on the integrity of natural gas storage wells in California. (OpenSRA project),” in PEER report No. 2023/12. Pacific earthquake engineering research center (Berkeley, CA: University of California).
Thompson, S. (2021). Fault Displacement hazard characterization for OpenSRA. California Energy Commission.
USGS and CGS (2006). Quaternary Fault and Fold Database of the United States. Available at: http://earthquake.usgs.gov/hazards/qfaults/ (Accessed March 13, 2019).
Wald, D. J., Worden, B. C., Quitoriano, V., and Pankow, K. L. (2005). ShakeMap manual: Technical manual, user's guide, and software guide. No 12-A1.
Wang, C., Hubbard, P., Xu, T., and Soga, K. (2023). “Sensor and monitoring technologies. (OpenSRA project),” in PEER report No. 2023/09. Pacific earthquake engineering research center (Berkeley, CA: University of California).
Watson-Lamprey, J., Largent, M., and Zheng, B. (2023). “System wide natural gas infrastructure response and fragility models,” in PEER report No. 2023/07. Pacific earthquake engineering research center (Berkeley, CA: University of California).
Wells, D. L., and Coppersmith, K. J. (1994). New empirical relationships among magnitude, rupture length, rupture width, rupture area, and surface displacement. Bull. Seismol. Soc. Am. 84, 974–1002.
Youd, T. L., and Perkins, D. M. (1978). Mapping liquefaction-induced ground failure potential. J. Geotechnical Eng. Div. 104 (4), 433–446. doi:10.1061/ajgeb6.0000612
Zhang, G., Robertson, P. K., and Brachman, R. W. I. (2002). Estimating liquefaction-induced ground settlements from CPT for level ground. Can. Geotechnical J. 39 (5), 1168–1180. doi:10.1139/t02-047
Zhang, Y., Ma, K., Song, S., Elam, M. B., Cook, G. A., and Park, E. A. (2004). Peroxisomal proliferator-activated receptor-γ coactivator-1α (PGC-1α) enhances the thyroid hormone induction of carnitine palmitoyltransferase I (CPT-Iα). J. Biol. Chem. 279 (52), 53963–53971. doi:10.1074/jbc.m406028200
Zhang, Y., Rutqvist, J., Jordan, P., and Foxall, W. (2023). “Fragility of caprocks due to fault shearing – the impact of Fault Displacement on the integrity of natural gas storage caprocks in California. (OpenSRA project),” in PEER report No. 2023/14. Pacific earthquake engineering research center (Berkeley, CA: University of California).
Zheng, B., Largent, M., Clifford, T., and Watson-Lamprey, J. (2023). Development of OpenSRA. (OpenSRA project), PEER report No. 2023/05. Pacific earthquake engineering research center. Berkeley, CA: University of California.
Zhu, J., Baise, L. G., and Thompson, E. M. (2017). An updated geospatial liquefaction model for global application. Bull. Seismol. Soc. Am. 107 (3), 1365–1385. doi:10.1785/0120160198
Keywords: seismic, risk, open-source, fragility, natural gas infrastructure, performance-based
Citation: Largent M, Bray J, Watson-Lamprey J and Abrahamson N (2023) Developing software to assess the seismic risk of natural gas infrastructure: OpenSRA. Front. Built Environ. 9:1176919. doi: 10.3389/fbuil.2023.1176919
Received: 01 March 2023; Accepted: 06 June 2023;
Published: 22 June 2023.
Edited by:
Cheryl Ann Blain, Naval Research Laboratory, United StatesReviewed by:
Iunio Iervolino, University of Naples Federico II, ItalyYiannis Tsompanakis, Technical University of Crete, Greece
Copyright © 2023 Largent, Bray, Watson-Lamprey and Abrahamson. This is an open-access article distributed under the terms of the Creative Commons Attribution License (CC BY). The use, distribution or reproduction in other forums is permitted, provided the original author(s) and the copyright owner(s) are credited and that the original publication in this journal is cited, in accordance with accepted academic practice. No use, distribution or reproduction is permitted which does not comply with these terms.
*Correspondence: Micaela Largent, mlargent@slategeotech.com