Cost-benefit analysis of solar energy integration in buildings: a case study of affordable housing in Brazil
 Roberto Nonato De Arruda1
  Karoline Figueiredo1*
  Diego A. Vasco2
  Assed Haddad1,3
  Mohammad K. Najjar1,3
- 1Programa de Engenharia Ambiental, Universidade Federal do Rio de Janeiro, Rio de Janeiro, Brazil
- 2Departamento de Ingeniería Mecánica, Universidad de Santiago de Chile, Santiago de Chile, Chile
- 3Departamento de Construção Civil, Universidade Federal do Rio de Janeiro, Rio de Janeiro, Brazil
Introduction: The construction sector plays a pivotal role in global natural resource consumption, underscoring the urgency of promoting energy efficiency in buildings. With the escalating demand for renewable energy, solar power has gained significant traction. This study focuses on conducting a comprehensive cost-benefit analysis of solar energy integration in residential buildings.
Methods: The approach involves a novel comparison between photovoltaic panels and Solar Heating Systems (SHS) based on both environmental and financial considerations. To evaluate the practical implications, a case study was undertaken on an affordable housing complex in Brazil. Three distinct models were simulated for analysis: Model 1, featuring a grid-connected photovoltaic project with zero energy balance; Model 2, incorporating a grid-connected photovoltaic project with two solar panels generating 340 W each; and Model 3, integrating an SHS.
Results: The findings reveal the technical and economic feasibility of all proposed models. Model 1 stands out with superior performance in terms of estimated energy generation, energy savings, and annual reduction of CO2 emissions. On the other hand, Model 3 excels in the financial analysis, indicating its viability from a cost perspective.
Discussion: This research contributes to informed decision-making processes regarding the utilization of photovoltaic panels and SHS, thereby fostering energy efficiency and sustainability in buildings. The nuanced comparison of environmental and financial aspects provides valuable insights for stakeholders in the construction and renewable energy sectors. The identified strengths and trade-offs of each model enable a more holistic understanding of the implications of solar energy integration in residential buildings.
1 Introduction
The construction industry worldwide consumes high levels of electrical energy and natural resources (Liu et al., 2023). Buildings, in particular, account for approximately 40% of natural resource consumption, are responsible for nearly 40% of carbon dioxide (CO2) emissions, and generate about 40% of the general waste (Najjar et al., 2019a). The International Energy Outlook (IEO), under its “declared policy scenario (STEPS),” forecasts a global increase of 75% in electricity generation between 2000 and 2040. Furthermore, the International Energy Agency (IEA) anticipates a 12% growth in global energy demand from 2019 to 2030 (International Energy Agency, 2021). The global demand for electrical energy is projected to surge, emphasizing the need for greater energy efficiency in buildings (Najjar, 2019).
The growing emphasis on clean energy, harnessed from renewable sources, is a central focus for professionals working to reduce CO2 emissions and shift away from fossil fuels (Alola and Adebayo, 2023). The renewable energy sector is pivotal in this clean energy transition, offering sustainable alternatives to conventional energy sources (Najjar et al., 2017; Ahmed and Sleem, 2023). With a diverse range of renewable resources such as solar, wind, water, geothermal, bioenergy, and nuclear energy, the sector is poised to contribute significantly to global economic activity through responsible development (Li et al., 2023). The appeal of solar energy, in particular, has surged, driven by its abundance and potential to mitigate environmental degradation and pollution, enhance energy efficiency, and foster new employment opportunities (Zheng and Zeng, 2023).
Modern approaches like solar trees and floating solar power systems have emerged as innovative solutions for implementing solar systems while minimizing land use (Khare et al., 2023). Diversification and versatility have become critical characteristics within the global landscape of solar energy technology. These attributes enable the conversion of solar radiation into various valuable energy forms (Mura et al., 2015a), contributing to the generation of electricity for buildings and the reduction of CO2 emissions (Mura et al., 2015b).
In turn, the construction industry has witnessed a global surge in adopting model-based approaches. This methodology capitalizes on digital models to enhance decision-making processes, creating a virtual environment for assessing and comparing various project designs and ultimately facilitating the selection of the most optimal solutions (Jamil et al., 2023; Neeraj and Tomar, 2023). The use of digital models yields several advantages in this context. Firstly, it empowers evaluators to scrutinize multiple scenarios and configurations without needing physical construction, resulting in substantial reductions in costs and time typically associated with prototyping and testing. Furthermore, it allows researchers to assess how design choices impact energy generation, consumption, and financial viability (Heo et al., 2020; Bertagna et al., 2023).
Model-based approaches often incorporate digital models like Building Information Modeling (BIM) to enable the simulation, visualization, and performance assessment of building components and materials. This becomes especially crucial when dealing with extensive and unstructured data, enhancing the reliability and accuracy of the input data and improving the decision-making process (Sobhkhiz and El-Diraby, 2023). By analyzing digital building models, decision-makers gain valuable insights into the potential outcomes of different project options. Based on this information, it is possible to make informed decisions grounded in both performance and economic feasibility for each alternative (Bjørnskov and Jradi, 2023). Consequently, using digital models in decision-making helps identify more technically and economically viable solutions, optimizing resource allocation and ensuring better project outcomes (Tariq et al., 2022).
In the context of Brazil, there is a pressing need for comprehensive enhancements in the country’s energy matrix. Even though Brazil’s current energy matrix is primarily composed of renewable sources, accounting for 82% of the total (including hydraulics at 64%, wind at 9%, biomass at 8%, and solar energy at 1%), there is a clear imperative to diversify the share of renewables. This diversification should primarily focus on elevating the contributions of solar, wind, and biomass sources, resulting in a more sustainable and ecologically responsible energy system for the nation (EPE, 2020).
Recognizing this need for development, the Brazilian Association of Technical Standards (ABNT) has introduced a range of technical standards addressing energy efficiency and renewable energy systems in construction projects. For instance, the Brazilian norm ABNT NBR 15569 lays out the minimum requirements for the design, installation, operation, and maintenance of solar heating systems in buildings, encompassing criteria for system sizing, component selection, installation methods, and performance testing (ABNT-Associação Brasileira de Normas Técnicas, 2021). Another Brazilian standard, ABNT NBR 15575, is dedicated to evaluating thermal performance criteria for residential buildings, encompassing requirements related to solar water heating systems and other facets of energy efficiency in buildings (ABNT, 2013). Furthermore, ABNT NBR 16690 focuses on the prerequisites for photovoltaic systems connected to the electrical grid. It provides guidelines for system installation, design, operation, and maintenance, addressing electrical safety and grid connection (ABNT-Associação Brasileira de Normas Técnicas, 2019). These standards represent a crucial framework for advancing the adoption of renewable energy technologies in the construction sector within Brazil.
Despite these efforts, there remains ample room for improvement within the Brazilian construction industry. This sector lacks comprehensive discourse on solar energy utilization, both in research and practical implementation. Therefore, it is imperative to consider the sector’s current state and the potential advantages of adopting solar energy systems. One key area that requires further exploration is the practical application of solar energy through actual case studies, with a particular focus on conducting cost-benefit analyses and delineating the decision-making processes related to energy efficiency and sustainability.
To address this gap, the objective of this study is to conduct a rigorous cost-benefit analysis of the utilization of solar energy in buildings to enhance the decision-making processes for construction projects. Particularly, this research centers on a case study of affordable housing in Brazil, providing an invaluable opportunity to assess how model-based approaches can be employed in the context of the nation’s evolving energy matrix. This case study is instrumental in elucidating the multifaceted aspects of solar energy integration, encompassing factors such as implementation costs, payback periods, energy generation, and reductions in CO2 emissions. By focusing on the specifics of the Brazilian construction industry, this study aims to draw insights that resonate with the global transition toward cleaner and more sustainable energy solutions.
This paper is organized as follows: Section 2 provides the background of the study, offering essential contextual information. Section 3 describes the materials and methods used in this research, outlining the approach and techniques employed. Section 4 presents the case study, focusing on affordable housing in Brazil as an illustrative example. Section 5 showcases the main results obtained from the study and provides a comprehensive analysis and discussion of these findings. Finally, Section 6 presents the study’s conclusion, summarizing the key findings, discussing their implications, and offering insights into potential future research directions.
2 Background
Optimizing renewable energy systems, such as solar photovoltaic and solar heating systems, is a critical endeavor that demands careful planning and analysis to enhance performance (Buonomano et al., 2018). Computational resources emerge as valuable assets in this pursuit, facilitating swift simulation, modeling, dimensioning, and design (Overland, 2019). Notably, conventional solar collectors can substantially improve overall performance and cost-effectiveness through a targeted approach involving angular adjustments (Baccoli et al., 2018), ultimately decreasing capital expenditure and energy payback periods (Baccoli et al., 2021). The application of solar energy in construction projects occurs in passive or active forms, aligning with climate classifications, the specific demands of the built environment, and building energy needs encompassing heating, cooling, and electricity (Hojjatian et al., 2021).
Recent advances in enhancing energy efficiency within building design have led to the adoption of artificial intelligence (AI) methods, revolutionizing energy efficiency and thermal comfort in construction projects (Bosu et al., 2023). These innovative studies encompass a spectrum of applications, including HVAC control methods (Sha et al., 2019), building occupancy detection systems (Sun et al., 2020), prediction of energy use in buildings (Wang and Srinivasan, 2017), and the development of AI techniques for photovoltaic systems, such as intelligent digital maximum power point tracking (Mellit and Kalogirou, 2014). Moreover, optimization strategies for solar energy systems involving net energy metering and enhanced time-of-use methods have been explored within building contexts (Mahmud et al., 2023).
Studies like the one by Wang et al. (2020) have compared China’s passive and active heating systems to optimize the cost and energy consumption in buildings based on the natural ventilation, building orientations, and thermal insulation of construction components. Similarly, Azimi Fereidani et al. (2021) have reviewed the scientific contributions to assess the energy effects of passive and active heating and cooling systems in different climate classifications in the Middle East. Despite a historical lag in adopting clean energy systems and energy-efficient solutions in the region, their work highlights the potential for passive design, efficient air conditioning systems, and renewable energy integration in buildings, even within this context.
In turn, integrating solar energy into building design aligns closely with the principles of Nearly Zero-Energy Buildings (nZEB). To illustrate, a feasibility study explored the application of solar energy in high-rise buildings, aiming to align them with nZEB standards (Shirinbakhsh and Harvey, 2023). Elnagar and Köhler (2020) conducted a comprehensive assessment of passive approaches to curtail energy demand in multifamily nZEBs across diverse European cities. These cities boasted unique climate conditions, including Stuttgart in Germany, Kiruna in Sweden, and Palermo in Italy. Their work underlined the necessity of finding an optimal balance and refining the most promising passive strategies in building design.
Similarly, Abdou et al. (2021) undertook a multi-objective study to optimize passive energy efficiency measures to drive buildings towards nZEB standards in Morocco. Their findings revealed that renewable energy systems have the potential to fulfill up to 45% of building energy demands across all Moroccan climatic classifications. However, the practical challenge of securing sufficient on-site energy generation, especially with photovoltaic and solar thermal collectors, is expected to remain a critical hurdle in many Moroccan cities. This challenge resonates with the observations of Pérez et al. (2022) in their study investigating the application of solar energy systems in Cuba.
Several software programs are available for simulating and optimizing photovoltaic systems, such as PVsol (Valentin Software, 2023), TRNSYS (TRNSYS, 2023), PVSyst (PVSYST, 2023), SOLergo (Canal Solar, 2023), Sunny Design Web (SMA) (SMA, 2023), and HelioScope (HelioScope, 2023). Researchers have used these programs for various purposes, including system design, installation, annual production assessment, exploration of their viability on pitched roofs, and economic feasibility evaluation.
For example, Najjar et al. (2019b) introduced a framework-based experimental design to maximize the energy output of photovoltaic systems. Their work utilized PVsol software to simulate and facilitate the design and installation processes of such systems in buildings. Similarly, Ozcan et al. (2019) employed PVsol and TRNSYS programs to determine the annual production potential of a photovoltaic system. Through their experimental studies, these authors established the effectiveness of the PVSOL program, achieving a remarkable success rate of 94.33%.
Badawy et al. (2022) explored the potential of integrating the photovoltaic system on pitched roofs in Egypt, using PVsol Premium for all roof surfaces to optimize the optimum design. Their primary objective was to assess the significance of both monocrystalline and thin-film technologies in the context of efficient grid-connected photovoltaic systems, particularly in historic buildings. PVsol software was instrumental in their comparative analysis of various PV technologies, annual energy yield, and performance ratios to address their research objectives. Based on the results, the unsuitability of polycrystalline PV array technology was concluded as a sustainable solution for integration into heritage buildings with similar weather conditions. This insight emphasizes the need for more tailored photovoltaic technologies in such specific contexts.
Othman and Hatem (2022) conducted a comparative analysis between PVSyst, PVSol, and SMA. Their evaluation revealed that the annual errors across these programs ranged from −6.99% to +4.65%. Notably, the deviation in the PVSol system varied from −19.02% in December to −1.83% in April, and from +0.09% in August to +8.73% in June. Notably, the total error in estimating the annual yield was −2.09%, which remained within acceptable limits.
In a related study, Cristea et al. (2020) conducted an economic assessment of residential solar photovoltaic systems connected to the grid. They used PVsol Premium 2019 to design and simulate PV system performance in various locations in Romania. The study determined economic viability by considering representative parameters and employing sensitivity analysis with varying energy prices. The authors used metrics such as Net Present Value, Internal Rate of Return, Profitability Index, and Discounted Payback Period to assess the feasibility of their strategies. The study underscored PVsol’s high user-friendliness and adaptability, making it a valuable tool for accurately reflecting results in experimental studies.
3 Materials and methods
In this work, a model-based approach is employed, wherein digital models are utilized to enhance the decision-making process of buildings. These digital models are created and used to simulate and analyze various projects incorporating solar energy. By employing digital models, researchers can simulate the behavior and performance of different project designs, considering factors such as solar energy generation, energy consumption, cost analysis, and other relevant parameters. These models enable a more comprehensive understanding of the technical and economic viability of different project alternatives.
This research encompasses three distinct models, of which two are centered around photovoltaic systems, and one is dedicated to solar heating systems. The objective is to conduct a comprehensive comparative analysis that delves into both environmental and financial aspects. Consequently, the study employs quantitative research techniques, a crucial tool for precisely quantifying various critical parameters. This encompasses assessing potential energy generation, financial costs, returns on investment, and other pertinent factors. Integrating quantitative methods ensures the acquisition of precise measurements and numerical data, thus contributing to a more rigorous and objective evaluation of the project’s feasibility and viability. Ultimately, this empowers the decision-making process, facilitating the selection of technically and economically sound models for effectively utilizing solar energy in buildings.
To validate the proposed methodology, a case study is presented. The chosen subject is Brazilian affordable housing, considering a single house from the Brazilian federal government program called “Minha Casa Minha Vida,” Brazil’s first-ever effort at large-scale public housing. It is worth emphasizing that the materials and techniques utilized in this case study hold applicability to a broad spectrum of construction projects, extending the relevance and practicality of the findings. A visual representation of the research methodology’s flowchart is illustrated in Figure 1.
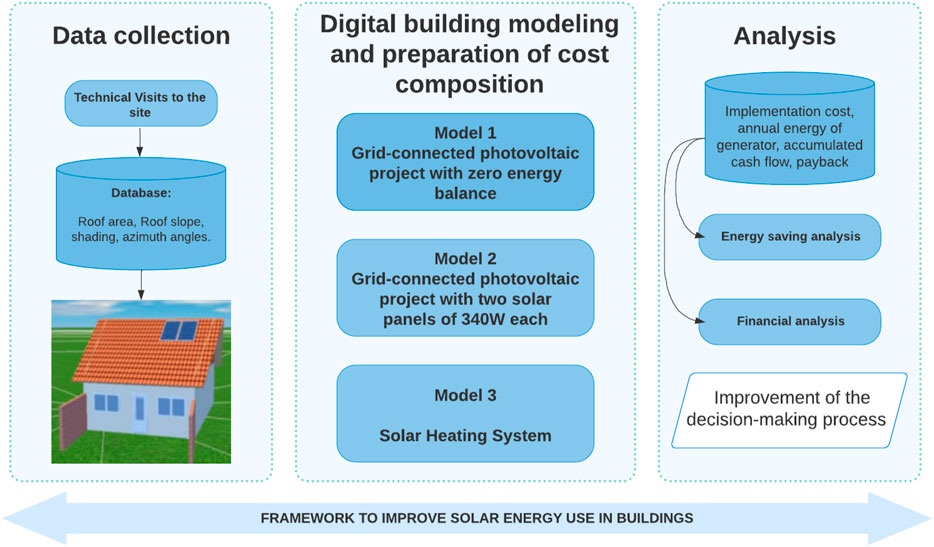
FIGURE 1. Flowchart of the proposed methods.
The first step requires a technical visit where the construction project will be elaborated. This step facilitates collecting the monthly electricity consumption data of the residential units. In addition, such a technical visit helps verify the electrical installation data, defining the roof area where the models can be installed and outlining the shading areas, the azimuthal angles, and the roof’s slope.
The second step necessitates collecting the geographic and climatic data of the location to define the climatic and bioclimatic classifications, the trajectory of solar radiation, and environmental temperature. Using the PVsol software could facilitate this step based on its database and simplify the simulation process of the proposed photovoltaic project presented in Model 1 and Model 2 in Figure 1. This software has a vast database of geographical coordinates, climatic data, solar radiation, ambient temperature, photovoltaic modules, power inverters, consumption tariffs, and injection tariffs (Valentin Software, 2023). However, Model 3 is to be simulated based on the Solar Heating System (SHS). Hence, the mathematical model applied to simulate this model and obtain the results will be carried out according to the Brazilian standard ABNT NBR 15569 (ABNT-Associação Brasileira de Normas Técnicas, 2019).
The next step requires drawing up a cost composition for the implementation of each project based on the local market research and prices, as well as the official government bases. This step could facilitate calculating each proposed model’s CO2 emission reduction. The last step asks to analyze the acquired results: power generation capacity, generated energy used, system implementation cost, payback, financial return over the useful life, and CO2 reduction capacity to achieve the objectives of this work.
3.1 A mathematical model to simulate the SHS
The calculation of SHS is recommended by ABNT NBR 15569 for the dimensioning and simulation of the proposed project as follows:
The first step is to calculate the volume of the hot water consumption according to Eq. 1. This step needs to evaluate the volume that meets the points of use. The values of daily hot water consumption are suggested and can be consulted in the same standard to estimate the flow rate of the parts of SHS, as well as the time and frequency of use.
where:
Vconsumption: the volume of the daily hot water consumed, expressed in liters per day [l/d];
Qfud: the flow rate of use of the device, expressed in liters per minute [l/min];
Taud: the average daily use time of the device, expressed in minutes [min]; frequency of use: total number of appliances used per day.
The next step is to calculate the volume of the storage system, according to Eq. 2. By estimating the storage volume, in addition to the consumption volume, this work considers the consumption, storage, and environmental temperature.
where:
Vstorage: the volume of the SHS storage system, expressed in liters per day [l/d]; Vconsumption: the volume of daily consumption, expressed in liters [l];
Tconsumption: the consumption temperature of use, expressed in degrees Celsius [°C];
Tstorage: the storage temperature of the water, expressed in degrees Celsius [°C];
Tenvironment: the annual environmental temperature of the installation site, expressed in degrees Celsius [°C].
The third step is calculating the useful energy demand according to Eq. 3. Useful energy demand considers water properties, storage volume, and system temperatures. Estimating the useful energy could facilitate calculating the annual energy of the generator by multiplying it by 12 months of the year.
where:
Euseful: the useful energy, expressed in kilowatt-hours per month [kWh/month];
Vstorage: the volume of the SAS storage system, expressed in liters [l];
Ρ: the specific mass of water equal to 1, expressed in kilograms per liter [kg/l];
Cρ: the specific heat of water equal to 4.18, expressed in kilojoules per kilogram degree Celsius [KJ/kg.°C];
Tstorage: the storage temperature of the water, expressed in degrees Celsius [°C];
Tenvironment: the annual average environmental temperature of the installation site, expressed in degrees Celsius [°C].
The next step is to calculate the collecting area, thermal losses of primary and secondary circuits, and the correction factor for the inclination and orientation of the solar collector using Eqs 4, 5, 6, respectively. For the calculation of the collecting area, through Eq. 4, a series of variables are taken into account, such as the average annual Global Irradiance (GI), the energy loss in the system in the primary and secondary circuits, and the average monthly production of specific energy from the solar collector; this energy, in turn, depends on dimensionless coefficients of the solar collector used.
where:
Acollector: the collecting area, expressed in square meters [m2];
Euseful: the useful energy, expressed in kilowatt-hours per month [kWh/month];
Elosses: it is the sum of the thermal losses of the primary and secondary circuits, expressed in kilowatt-hours per month [kWh/month];
CFinstal: the correction factor for collector tilt and orientation;
GI: the value of the average annual global irradiance for the installation site, expressed in kilowatt-hours per square meter day [kWh/m2.day];
AMSE: is the average monthly specific energy output of the solar collector, expressed in kilowatt-hours per month square meter [kWh/(month.m2)].
The value 4.89: expressed in kilowatt-hours per square meter day [kWh/m2.day], which refers to the ABNT NBR 15569 standard value for determining the AMSE of the solar collector.
The sum of the thermal losses of the primary and secondary circuits (Elosses) will be calculated by the sum of the losses of energy presented in Eq. 5.
To calculate the correction factor for the inclination and orientation of the solar Collector, Eq. 6 is used. It considers the recommendations of ABNT NBR 15569, which is keen to optimize the inclination of the solar collector to the installation site relative to the horizontal and guide the adoption of the latitude modulus.
where:
CFinstal: the correction factor for collector tilt and orientation;
β: the inclination of the collector relative to the horizontal plane, expressed in degrees [°];
βopt: the optimum inclination of the collector to the installation site, expressed in degrees [°];
Ƴ: the angle of orientation of solar collectors relative to geographic North, expressed in degrees [°].
4 Case study
For the case study, the Vale da Mata condominium will be evaluated to achieve the objectives of this work. This condominium comprises a total of 215 residential housing units, all of which are endowed with fundamental infrastructure, encompassing an expansive area measuring 9,838.99 square meters. It is situated within the district of the municipality of Duque de Caxias, in the city of Rio de Janeiro, as visually represented in Figure 2. The specifics of this case study hold the potential to provide valuable insights into the subject matter under investigation, further enhancing the overall relevance and applicability of the research findings.
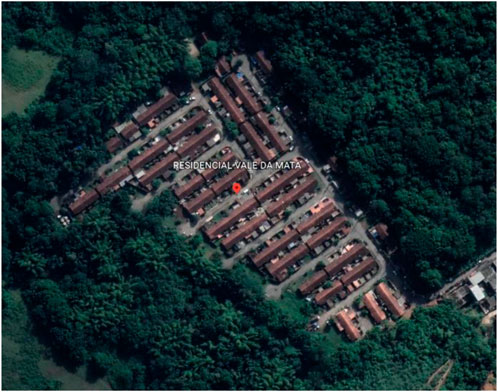
FIGURE 2. Satellite image of the condominium studied.
In line with the neighborhood impact study, it is worth noting that the Vale da Mata condominium was initially equipped with a basic solar water heating system. Given this context, the condominium-type residence serves as an apt model for evaluating feasibility hypotheses. These assessments revolve around incorporating photovoltaic energy and the thermal water heating system. The primary aim is to discern which model offers the most favorable cost-benefit profile, consequently facilitating a comprehensive analysis of their technical, economic, and environmental feasibility. Within this analytical framework, a single housing unit is considered as the functional unit, and the three distinct models are investigated as follows:
• Model 1: This model entails a grid-connected photovoltaic project with a zero energy balance objective. The system’s design is tailored to generate the entirety of the energy consumed by the functional unit.
• Model 2: This model represents a photovoltaic project connected to the grid. It features two solar panels, each rated at 340 watts, and is calibrated with predefined loads amounting to 680 W.
• Model 3: This model is designed with a Solar Heating System (SHS).
The process of conducting calculations and obtaining results for Models 1 and 2 is executed through the utilization of PVsol software. On the other hand, Model 3 is handled differently; it is simulated and evaluated manually without specialized software. Instead, it is prepared in accordance with the parameters outlined in the ABNT—NBR 15569 standard.
Specifically, Model 1 is engineered to fulfill the entirety of the residence’s energy requirements over a year. This approach factors in the fluctuations in solar incidence across different months, ensuring a zero energy balance. In practice, this means that during months with higher energy generation, the surplus energy serves as a credit, compensating for months with reduced solar incidence. This careful consideration of seasonal variations aligns Model 1 with the goal of optimal energy self-sufficiency.
A systematic approach is employed to ensure accurate simulation in PVsol software, encompassing the incorporation of various crucial parameters and project-specific details. During this analysis phase, the system’s units are standardized according to the international system of measures. Following this, project-specific data about the condominium residence in the case study is meticulously integrated.
For a comprehensive understanding of the residence’s energy requirements, data concerning its energy consumption has been gathered from the energy consumption invoices issued by the utility provider. This data collection spans a 12-month period, ranging from November 2020 to October 2021, with measurements expressed in kilowatt-hours (kWh). The cumulative result of this analysis reveals an annual energy consumption requirement of 1588 kWh, underscoring the basis for further calculations and modeling, as depicted in Table 1.
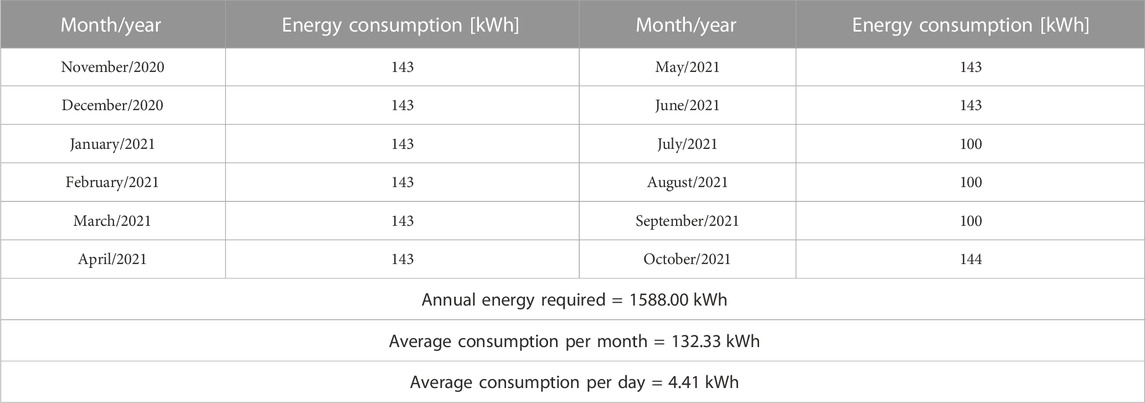
TABLE 1. Energy consumption of a residential unit.
In turn, the PVsol software offers the flexibility of dimensioning the solar energy system in either a 2D or 3D model. Opting for the 3D modeling approach yields more precise and accurate results. In this method, creating a detailed representation of the residence becomes feasible, incorporating specific measurements, including roof slope, type, and total surface area. Furthermore, it enables the consideration of potential peripheral obstructions that might cast shadows, consequently affecting power generation efficiency. The software also permits the definition of the building’s characteristics, encompassing measurements, height of the eaves, number of floors, and various visual elements that, although not directly impacting dimensioning, contribute to a comprehensive representation of the building. This can include features such as windows, doors, and side walls, contributing to the model’s overall accuracy.
4.1 Simulation of Model 1
Model 1 adopts four modules from the manufacturer ZNShine PV-Tech Co., Ltd., each with a rating of 340W, characterized by the specification “ZXP6-72-340.” These modules are positioned vertically, as illustrated in Figure 3. The shading analysis is a crucial consideration; while no shading interference is identified in this scenario, the software is designed to account for any potential shading that could impact the solar panels, calculating the corresponding losses.
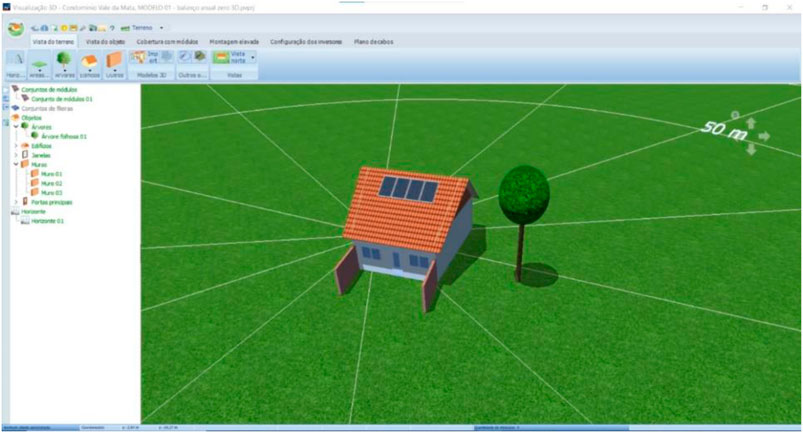
FIGURE 3. 3D modeling of Model 1.
Configuring the inverters is the next step in the process, with an inverter capacity of 1.5 kWh selected from the manufacturer GROWATT for the string consisting of four photovoltaic modules. This particular inverter is designated as “GROWAT New Energy Co., ltd. I Growat-1500-S.” The capacity of 1.5 kWh corresponds to the inverter’s capability to efficiently convert the direct current generated by the photovoltaic modules into alternating current. The inverter’s capacity should align with the combined load of the photovoltaic modules to ensure optimal energy management.
The following step involves configuring the cabling system, a pivotal aspect in ensuring the optimal performance of the solar energy system. PVsol offers a comprehensive electrical diagram where all cable parameters, including lengths, materials, and cross-sectional areas, can be defined. It becomes possible to evaluate the corresponding losses by inputting these cable characteristics. For example, for the alternating current cabling with a length of 9 meters, employing a copper cable with a cross-sectional area of 6 mm2, the calculated loss is 0.33 (or 3.3 W).
Subsequently, the losses in the direct current cabling that connects the photovoltaic modules to the inverter can be determined, similar to the losses incurred in the alternating existing cabling, which transports electrical energy to the consumption points within the residence. Additionally, the software offers the option to consider a total system loss value. The current study adopted a total loss of 1% as the reference point. With these configurations in place, PVsol streamlines the financial analysis of the system, taking into account the project’s expected lifespan of 25 years. This period is significant as it corresponds to the point at which the solar panels gradually decline their energy generation capacity.
The composition of costs for Model 1 needs to do market research to raise the prices of the components. The most significant difficulty is finding the panels and inverters compatible with the program database in the market. This is because there are numerous brands and models of both modules and inverters. Another limitation that has been observed is that the program database does not release launching new models of photovoltaic panels. For better detailing and following the methodology commonly used in the solar energy installation market for budgeting, a budget spreadsheet was created to calculate the value of the system deployment, as presented in the Supplementary Appendix SA.
The financial analysis considers several vital parameters to provide a comprehensive evaluation. Firstly, a value of R$ 9,988.50 was included, based on the budget spreadsheet, to cover operating costs for each year. These costs amount to 1% of the total budget, equivalent to R$ 99.98, intended for the regular cleaning and maintenance of the solar modules. Additionally, to ensure a realistic assessment, the analysis assumes an average inflation rate of 7.17% between January and September 2022. This inflation rate was used to project future costs accurately. The study also considers the energy tariff structure, which follows three pricing tiers. The first tier spans from 0 kWh/month to 50 kWh/month, the second tier extends beyond 50 kWh/month up to 300 kWh/month, and the third tier covers usage exceeding 300 kWh/month. These tariff data are derived from the energy bill, as presented in Table 1.
4.2 Simulation of Model 2
In Model 2, the configuration includes two modules from the manufacturer ZNShine PV-Tech Co., Ltd., each with a capacity of 340 W, and the specification “ZXP6-72-340.” These modules are arranged vertically, as shown in Figure 4. Subsequently, a shading analysis is conducted to optimize panel placement, reducing shading as much as possible while allowing space for a solar water heating system primarily intended for shower usage.
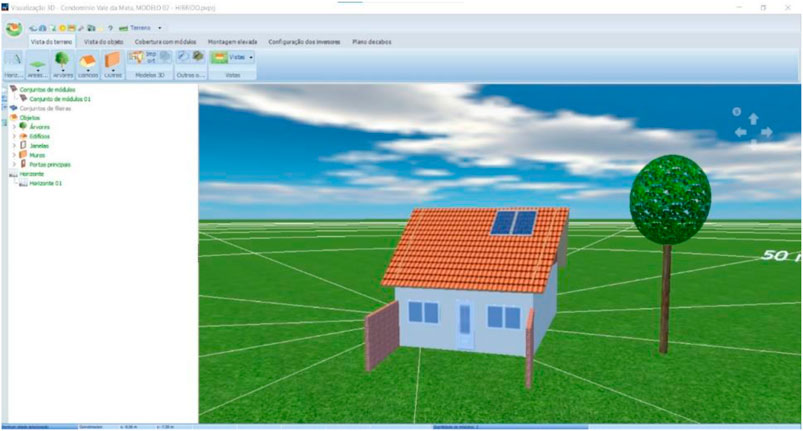
FIGURE 4. 3D modeling of Model 2.
For the inverter configuration in Model 2, which accommodates two photovoltaic modules of 340 W each, a 750 W inverter from the manufacturer GROWATT is chosen, with the specification “GROWAT New Energy Co., Ltd. I Growat-750-S–750 W.” The cabling arrangement mirrors that of Model 1, with a total system loss of 1% due to cabling.
Similar to Model 1, the financial analysis for Model 2 spans a 25-year timeframe, capturing the long-term economic feasibility of the solar energy system. This analysis considers operating costs, inflation rates, and the energy tariff structure to provide a comprehensive financial assessment.
The photovoltaic panels used in Model 2 are identical to those in Model 1, albeit reduced from four panels to two. Interestingly, the inverter used in Model 2 is of lower capacity than in Model 1. Despite its lower capacity, the inverter’s cost increased significantly. For instance, the 1500 W inverter in Model 1 cost R$ 2,040.55, while the 700 W inverter of the same brand used in Model 2 cost R$ 3,599.99, representing a total increase of 76.42%. This notable increase in cost can be attributed to the limited availability of lower-capacity equipment in the local Brazilian market.
A budget spreadsheet was prepared to calculate the total implementation cost for Model 2, as detailed in the Supplementary Appendix SA. This budget considers a total implementation cost of R$ 9,192.65. Additionally, the annual operating costs are estimated at 1%, which amounts to R$ 91.93 for cleaning the modules. Finally, an average inflation rate of 7.17% is assumed between January and September 2022 to account for changes in the cost structure (Instituto Brasileiro de Geografia e Estatística, 2023).
4.3 Simulation of Model 3
For Model 3, the solar heating system for the shower, designed following the ABNT—NBR 15569 parameters, is dimensioned considering a residence accommodating a family of three people, consisting of two adults and one teenager. The system design involves determining the volume of the hot water reservoir and the number of solar collectors (plates) required. The hot water is intended to be stored at 50°C and consumed at 38°C. The annual average ambient temperature is 23.7°C.
The positioning conditions and angles of the solar collectors align with those considered for the calculation of the photovoltaic energy system, encompassing the following parameters: β = 37°; Ƴ = 54°; GI = 1669 kWh/m2/year; AMSE = 81,6 kWh/(month.m2). The optimal inclination of the collector is determined based on the installation site’s latitude module, which, according to the standard, involves adding +10° to the latitude. Therefore, βopt = (−22,56 + 10) ° = 12,56° is the optimal inclination. Considering hot water demand, the system is designed to accommodate a family’s needs with the following parameters:
• Consumption points: 1 shower (with a frequency of one shower per user).
• Average time of use (Taud): 10 min per person.
• The shower has a flow rate (Qfud) of 8 L/min.
• A shower with 5500 W of power is adopted as a reference, with an approximate monthly consumption of 28 kWh per person, taking into account one shower of 10 min per user daily.
Market research for boilers is required to determine the cost composition for Model 3. Model 3 employs a 100-L boiler and two solar collectors with an AMSE yield of 81.30 kWh/(m2xmonth) and an area of 1.41 m2 each, totaling a solar absorption area of 2.82 m2. These components are essential for the solar heating system designed for the shower.
Similarly to how costs were determined for the photovoltaic systems of Models 1 and 2, the costs for Model 3, focusing on the solar heating system, were calculated using a cost composition spreadsheet. This calculation utilized data from governmental price research bases, specifically SINAPI (SINAPI, 2023) and SCO-RIO (Assoaciação das Empresas de Engenharia do Rio de Janeiro, 2023), as presented in the Supplementary Appendix SA. Model 3 has an implementation cost of R$ 6,267.97.
5 Results and discussions
This section is organized into four major sub-sections. The initial three sub-sections offer insights into the outcomes associated with Model 1, Model 2, and Model 3, respectively. The final sub-section is dedicated to a comprehensive discussion of these results.
5.1 Results obtained for Model 1
The evaluated photovoltaic system exhibits a specific annual yield of 1309.57 kWh/year.kWp, as detailed in Table 2. The photovoltaic generator produces 1787 kWh/year, producing a 193 kWh/year surplus. Moreover, the system contributes to a reduction of 837 kg/year in CO2 emissions. Notably, the system performance is recorded at 79.8%. This performance metric is calculated using PVsol software, which assesses the relationship between the actual system performance and the expected performance of the photovoltaic system (Valentin Software, 2023).
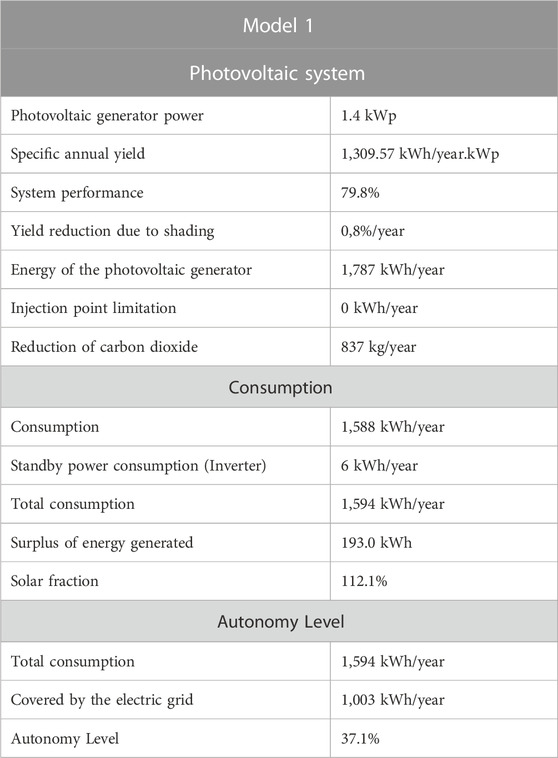
TABLE 2. Estimated energy savings of Model 1.
In the financial analysis of Model 1, as presented in Table 3, the information is categorized into four main themes: system data, economic parameters, overview of payments, and remuneration and savings. Notably, the internal rate of return stands at 4.12%, the cost of energy savings during the first operational year amounts to R$ 512.00, and the accumulated cash flow over 25 years totals R$ 12,899.72. However, the economic parameters indicate that the payback period for Model 1 is approximately 18 years and 6 months (18.5 years).

TABLE 3. Financial analysis of Model 1.
5.2 Results obtained from Model 2
In Model 2, the technical quality of the evaluated photovoltaic system reveals a specific annual yield of 1332.63 kWh/year.kWp, as depicted in Table 4. The system performance achieves 81.6%, and the CO2 emissions reduction amounts to 426 kg/year. Considering an annual energy consumption of 1,588.00 kWh for the single housing unit and a yearly photovoltaic generator output of 906.2 kWh/year, it follows that the energy drawn from the public network will be 681.8 kWh. Furthermore, this project demonstrates that there is no surplus energy generated.
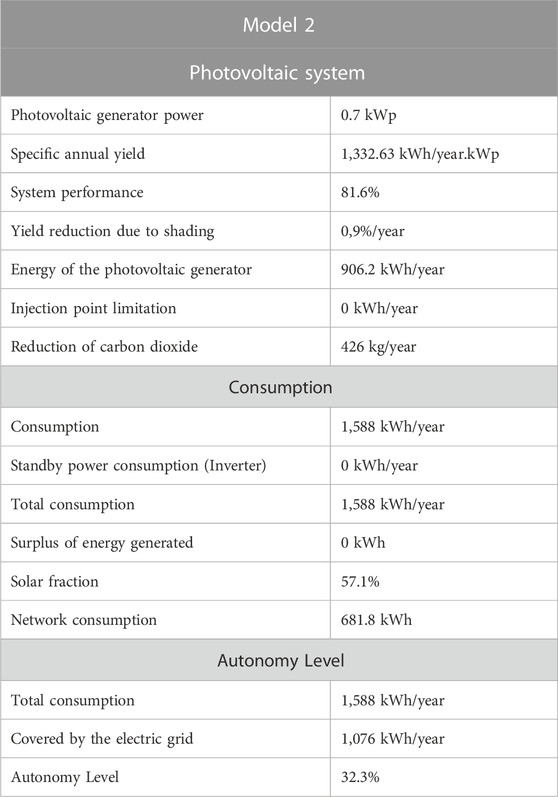
TABLE 4. Estimated energy savings of Model 2.
In the financial analysis of Model 2, as presented in Table 5, it can be noted that the internal rate of return is 8.56%, the cost of energy savings during the first operational year is R$ 372.04, and the accumulated cash flow over 25 years reaches a value of R$ 15,541.18. However, the economic parameters report that the payback of the evaluated system in Model 2 is around 12 years and 11 months (12.92 years).
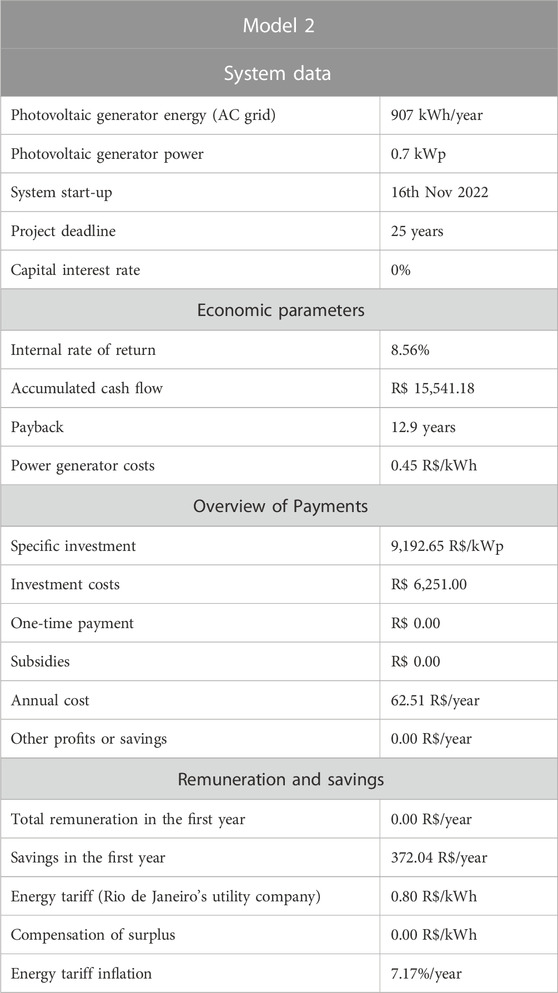
TABLE 5. Financial analysis of Model 2.
5.3 Results obtained from Model 3
Model 3 is designed based on the solar heating system for the shower of the family residence of three persons. Taking into consideration the positioning conditions and angles of the solar collectors for the calculation of the photovoltaic energy system, applying the Equations presented in ABNT NBR 15569 results in total consumption of the bath shower as follows: Vstorage = 130,50 L/day; Euseful = 119,55 kWh/month; Elosses = 17,93 kWh/month; and CFinstal = 1,65; A collector = 2,77 m2.
With an approximate monthly consumption of 28 kWh/person and a frequency of one shower of 10 min per user per day, leading to a monthly consumption of 28 kWh × 3 = 84 kWh, the total monthly consumption is 84 kWh. Considering a CO2 emission factor for electricity generation of 0.09, the reduction of CO2 emissions amounts to 84 kWh x 0.09 = 7.56 kg/month, equivalent to 90.72 kg/year. The energy generation of the SHS model is calculated based on Euseful = 119.55 kWh/month as follows: 119.55 kWh/month × 12 months = 1434.6 kWh/year.
The present model has an implementation cost of R$ 6,267.97. This means that the payback calculation necessitates taking into account an annual energy tariff inflation of 7.17% and using this same inflationary parameter to calculate the cost with the yearly maintenance of the system. Hence, the calculation of the payback of Model 3 is presented in the Supplementary Appendix SB. It can be realized in this Appendix that over the first eleven operational years of the model, there will be a possibility to obtain an income of R$ 220.31. This means the payback period is around 10 years and 11 months (10.92 years), with an accumulated cash flow in 25 years with a value of R$ 19,807.19.
5.4 Comparison of the different models
The results obtained from the three models are to be compared herein based on the following parameters, as presented in Table 6: implementation cost, annual energy of the photovoltaic generator, annual reduction of CO2, accumulated cash flow in the 25 years, and payback.
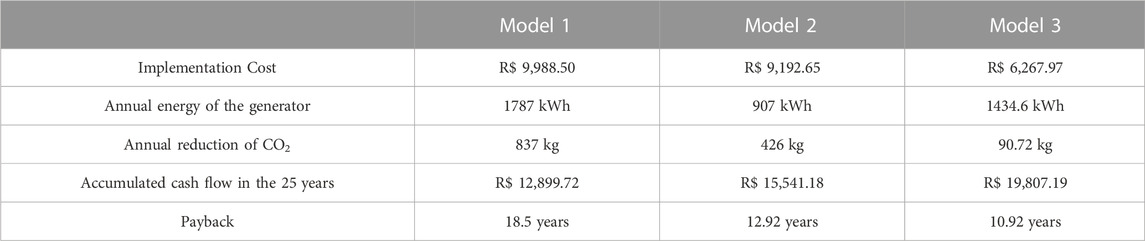
TABLE 6. Results obtained from the three models.
In comparing the three proposed models, it is evident that each model has its unique advantages and trade-offs. Model 1 achieves the highest annual energy production at 1787 kWh/year and boasts the best yearly CO2 reduction at 837 kg. However, it comes with a higher implementation cost of R$ 9,988.50. Model 2 offers a more economical option with an annual energy production of 907 kWh/year and an annual CO2 reduction of 426 kg. Model 3, designed around a solar heating system for the shower, stands out with its relatively lower implementation cost of R$ 6,267.97 while also achieving a good balance of annual energy production at 1434.6 kWh/year and a yearly CO2 reduction of 90.72 kg.
When assessing accumulated cash flow over 25 years and payback period, Model 3 appears as the most favorable, with an accumulated cash flow of R$ 19,807.19 and a payback period of 10.92 years, followed by Model 2 with an accumulated cash flow of R$ 15,541.18 and Model 1 with an accumulated cash flow of R$ 12,899.72 but a more extended payback period of 18.5 years. It is important to note that these results are specific to the case study and may vary based on energy consumption, building capacity, occupancy, installation costs, and the type of solar energy system investment.
The results clearly demonstrate the technical and economic viability of all proposed models. In this context, Model 3, which incorporates the Solar Heating System (SHS), stands out as the most favorable option from a financial perspective. On the other hand, Model 1 excels in terms of energy generation, savings, and annual CO2 reduction. It is important to emphasize that these analyses were conducted within the framework of a low-income residential condominium, aligned with the Brazilian large-scale public housing program. While it is worth noting that solar thermal energy is not currently a part of Brazil’s electric power generation matrix (Giglio et al., 2019), the outcomes of this case study suggest that SHS systems hold promise as a viable solution for low-income households in the country.
At this stage of the analysis, it is crucial to acknowledge that each model featured in the case study has unique limitations and opportunities. Ultimately, the optimal choice should align with the specific needs and available resources of the construction project, as well as its individual objectives. Furthermore, it is worth emphasizing that the results obtained may exhibit variations based on the climatic and geographical conditions of the region where the case study is situated.
In a broader context, the adoption of solar energy within the Brazilian construction industry can potentially be a transformative force in terms of enhancing energy efficiency and sustainability. Through further research and in-depth analysis within this field, it becomes feasible to identify best practices and strategies for fully capitalizing on the advantages of solar energy systems in real-world applications.
6 Conclusion
This work aimed to conduct a comprehensive cost-benefit analysis of solar energy utilization in buildings, focusing on comparing photovoltaic panels and solar heating systems based on environmental and financial aspects. The case study of affordable housing in Brazil provided insights into the limitations and opportunities associated with the implementation costs, payback period, energy generation, and CO2 reduction of these systems.
The simulation of three models, namely, Model 1 with a grid-connected photovoltaic project achieving zero energy balance, Model 2 with a grid-connected photovoltaic project using two solar panels of 340 W each, and Model 3 with a solar heating system, yielded valuable results. Model 1 exhibited the highest energy generation potential, capable of producing up to 1787 kWh/year, while Model 2 and Model 3 generated 907 kWh/year and 1434.6 kWh/year, respectively. In terms of annual CO2 reduction, Model 1 showcased the most significant impact, reducing emissions by 837 kg per year, followed by Model 2 with a decrease of 426 kg annually. Conversely, Model 3 demonstrated a more modest reduction of 90.72 kg of CO2 annually.
When considering the financial analysis, Model 3 stood out with the lowest implementation cost and the most favorable accumulated cash flow. Furthermore, it achieved an optimized payback period of 10.92 years, compared to 18.5 years for Model 1 and 12.92 years for Model 2. Despite these financial advantages, Model 1 showcased the highest estimated energy generation and savings, as well as the most significant annual reduction of CO2.
It is essential to note the limitations of this study. The findings are specific to the social interest residence in Brazil and may not be directly applicable to other regions or building types. Additionally, the analysis focused solely on photovoltaic panels and solar heating systems, excluding other potential renewable energy sources and technologies.
To further advance research in this field, future studies should explore additional case studies to validate and expand upon these findings. Moreover, incorporating a broader range of renewable energy technologies and considering varying geographical locations would provide a more comprehensive understanding of the potential benefits and limitations. Such investigations can contribute to the decision-making process, enabling informed choices regarding implementing photovoltaic panels and solar heating systems to enhance energy efficiency and promote building sustainability.
Data availability statement
The original contributions presented in the study are included in the article/Supplementary Material, further inquiries can be directed to the corresponding author.
Author contributions
RA: Conceptualization, Investigation, Software, Writing–original draft. KF: Data curation, Methodology, Supervision, Validation, Visualization, Writing–review and editing. DV: Data curation, Formal Analysis, Investigation, Supervision, Visualization, Writing–review and editing. AH: Resources, Visualization, Writing–review and editing. MN: Conceptualization, Project administration, Software, Supervision, Validation, Writing–review and editing.
Funding
The author(s) declare financial support was received for the research, authorship, and/or publication of this article. This study was financed in part by the Coordenação de Aperfeiçoamento de Pessoal de Nível Superior—Brasil (CAPES)—Finance Code 001.
Conflict of interest
The authors declare that the research was conducted in the absence of any commercial or financial relationships that could be construed as a potential conflict of interest.
Publisher’s note
All claims expressed in this article are solely those of the authors and do not necessarily represent those of their affiliated organizations, or those of the publisher, the editors and the reviewers. Any product that may be evaluated in this article, or claim that may be made by its manufacturer, is not guaranteed or endorsed by the publisher.
Supplementary material
The Supplementary Material for this article can be found online at: https://www.frontiersin.org/articles/10.3389/fbuil.2023.1255845/full#supplementary-material
References
Abdou, N., el Mghouchi, Y., Hamdaoui, S., el Asri, N., and Mouqallid, M. (2021). Multi-objective optimization of passive energy efficiency measures for net-zero energy building in Morocco. Build. Environ. 204, 108141. doi:10.1016/j.buildenv.2021.108141
Abnt, (2013). Abnt NBR 15575: desempenho de edificações residenciais. Brazil: ABNT-Associação Brasileira de Normas Técnicas.
ABNT-Associação Brasileira de Normas Técnicas (2019). Abnt NBR 16690: instalações elétricas de arranjos fotovoltaicos — requisitos de projeto, 2.
ABNT-Associação Brasileira de Normas Técnicas (2021). Abnt NBR 15569: sistema de aquecimento solar de água em circuito direto — requisitos de projeto e instalação.
Ahmed, W., and Sleem, M. (2023). Short- and long-run determinants of the price behavior of us clean energy stocks: a dynamic ardl simulations approach. SSRN Electron. J. 124, 106771. doi:10.2139/ssrn.4340560
Alola, A. A., and Adebayo, T. S. (2023). Analysing the waste management, industrial and agriculture greenhouse gas emissions of biomass, fossil fuel, and metallic ores utilization in Iceland. Sci. Total Environ. 887, 164115. doi:10.1016/j.scitotenv.2023.164115
Assoaciação das Empresas de Engenharia do Rio de Janeiro (2023). Tabelas SCO-Rio. https://aeerj.org.br/tabelas-sco-rio-de-fevereiro-2022/ (Accessed June 30, 2023).
Azimi Fereidani, N., Rodrigues, E., and Gaspar, A. R. (2021). A review of the energy implications of passive building design and active measures under climate change in the Middle East. J. Clean. Prod. 305, 127152. doi:10.1016/j.jclepro.2021.127152
Baccoli, R., Frattolillo, A., Mastino, C., Curreli, S., and Ghiani, E. (2018). A comprehensive optimization model for flat solar collector coupled with a flat booster bottom reflector based on an exact finite length simulation model. Energy Convers. Manag. 164, 482–507. doi:10.1016/j.enconman.2018.02.091
Baccoli, R., Kumar, A., Frattolillo, A., Mastino, C., Ghiani, E., and Gatto, G. (2021). Enhancing energy production in a PV collector – reflector system supervised by an optimization model: experimental analysis and validation. Energy Convers. Manag. 229, 113774. doi:10.1016/j.enconman.2020.113774
Badawy, N. M., Hosam Salah, E. S., and Waseef, A. A. E. (2022). Relevance of monocrystalline and thin-film technologies in implementing efficient grid-connected photovoltaic systems in historic buildings in Port Fouad city, Egypt. Alexandria Eng. J. 61, 12229–12246. doi:10.1016/j.aej.2022.06.007
Bertagna, F., Piccioni, V., and Acunto, P. D. (2023). Geometry-based graphical methods for solar control in architecture: a digital framework. Front. Archit. Res. 12, 754–774. doi:10.1016/j.foar.2023.02.006
Bjørnskov, J., and Jradi, M. (2023). Energy & Buildings an ontology-based innovative energy modeling framework for scalable and adaptable building digital twins. Energy & Build. 292, 113146. doi:10.1016/j.enbuild.2023.113146
Bosu, I., Mahmoud, H., Ookawara, S., and Hassan, H. (2023). Applied single and hybrid solar energy techniques for building energy consumption and thermal comfort: a comprehensive review. Sol. Energy 259, 188–228. doi:10.1016/j.solener.2023.05.006
Buonomano, A., Calise, F., and Palombo, A. (2018). Solar heating and cooling systems by absorption and adsorption chillers driven by stationary and concentrating photovoltaic/thermal solar collectors: modelling and simulation. Renew. Sustain. Energy Rev. 82, 1874–1908. doi:10.1016/j.rser.2017.10.059
Canal Solar (2023). SOLergo software. Available at: https://canalsolar.com.br/solergo/ (Accessed June 30, 2023).
Cristea, C., Cristea, M., Birou, I., and Tîrnovan, R. A. (2020). Economic assessment of grid-connected residential solar photovoltaic systems introduced under Romania’s new regulation. Renew. Energy 162, 13–29. doi:10.1016/j.renene.2020.07.130
Elnagar, E., and Köhler, B. (2020). Reduction of the energy demand with passive approaches in multifamily nearly zero-energy buildings under different climate conditions. Front. Energy Res. 8, 1–8. doi:10.3389/fenrg.2020.545272
Giglio, T., Santos, V., and Lamberts, R. (2019). Analyzing the impact of small solar water heating systems on peak demand and on emissions in the Brazilian context. Renew. Energy 133, 1404–1413. doi:10.1016/j.renene.2018.08.104
HelioScope (2023). HelioScope. Available at: https://software.com.br/p/helioscope (Accessed July 1, 2023).
Heo, J., Jung, J., Kim, B., and Han, S. U. (2020). Digital elevation model-based convolutional neural network modeling for searching of high solar energy regions. Appl. Energy 262, 114588. doi:10.1016/j.apenergy.2020.114588
Hojjatian, M., Heravi, A., and Poor, J. A. (2021). An overview of the use of solar energy in building construction projects. Creat. City Des. 4, 33–39.
Jamil, I., Lucheng, H., Iqbal, S., Aurangzaib, M., Jamil, R., Kotb, H., et al. (2023). Predictive evaluation of solar energy variables for a large-scale solar power plant based on triple deep learning forecast models. Alexandria Eng. J. 76, 51–73. doi:10.1016/j.aej.2023.06.023
Khare, V., Chaturvedi, P., and Mishra, M. (2023). Solar energy system concept change from trending technology: a comprehensive review. Electron. Energy 4, 100183. doi:10.1016/j.prime.2023.100183
Li, Y., Yan, C., and Ren, X. (2023). Do uncertainties affect clean energy markets? Comparisons from a multi-frequency and multi-quantile framework. Energy Econ. 121, 106679. doi:10.1016/j.eneco.2023.106679
Liu, X., Zhang, J., Qin, B., Wang, H., Zhu, T., and Ye, Q. (2023). Research on the knowledge demands of multiple subjects for energy efficiency improvement in Chinese public buildings. Energy Build. 300, 113611. doi:10.1016/j.enbuild.2023.113611
Mahmud, N. A., Dahlan, N. Y., Adnan, W. N. W. M., Tumian, A., and Onn, M. S. (2023). Optimum energy management strategy with NEM-ETOU for campus buildings installed with solar PV using EPSO. Energy Rep. 9, 54–59. doi:10.1016/j.egyr.2023.09.124
Mellit, A., and Kalogirou, S. A. (2014). MPPT-based artificial intelligence techniques for photovoltaic systems and its implementation into field programmable gate array chips: review of current status and future perspectives. Energy 70, 1–21. doi:10.1016/j.energy.2014.03.102
Mura, P. G., Baccoli, R., Innamorati, R., and Mariotti, S. (2015a). An energy autonomous house equipped with a solar PV hydrogen conversion system. Energy Procedia 78, 1998–2003. doi:10.1016/j.egypro.2015.11.392
Mura, P. G., Baccoli, R., Innamorati, R., and Mariotti, S. (2015b). Solar energy system in a small town constituted of a network of photovoltaic collectors to produce Electricity for homes and hydrogen for transport services of municipality. Energy Procedia 78, 824–829. doi:10.1016/j.egypro.2015.11.002
Najjar, M., Figueiredo, K., Palumbo, M., and Haddad, A. (2017). Integration of BIM and LCA: evaluating the environmental impacts of building materials at an early stage of designing a typical office building. J. Build. Eng. 14, 115–126. doi:10.1016/j.jobe.2017.10.005
Najjar, M. K. (2019). Optimizing the sustainable decision-making process towards improving energy performance over the entire life cycle of buildings. PhD thesis. Rio de Janeiro, Brazil: Universidade Federal do Rio de Janeiro. Available at: https://monografias.poli.ufrj.br/rep-download.php?farquivo=tesepoli10033681.pdf&fcodigo=5148 (Accessed December 11, 2023).
Najjar, M. K., Qualharini, E. L., Hammad, A. W. A., Boer, D., and Haddad, A. (2019b). Framework for a systematic parametric analysis to maximize energy output of PV modules using an experimental design. Sustainability 11, 2992. doi:10.3390/su11102992
Najjar, M. K., Tam, V. W. Y., Di Gregorio, L. T., Evangelista, A. C. J., Hammad, A. W. A., and Haddad, A. (2019a). Integrating parametric analysis with building information modeling to improve energy performance of construction projects. Energies 12, 1515. doi:10.3390/en12081515
Neeraj, P. G., and Tomar, A. (2023). Multi-model approach applied to meteorological data for solar radiation forecasting using data-driven approaches. Optik 286, 170957. doi:10.1016/j.ijleo.2023.170957
Othman, R., and Hatem, T. M. (2022). Assessment of PV technologies outdoor performance and commercial software estimation in hot and dry climates. J. Clean. Prod. 340, 130819. doi:10.1016/j.jclepro.2022.130819
Overland, I. (2019). The geopolitics of renewable energy: debunking four emerging myths. Energy Res. Soc. Sci. 49, 36–40. doi:10.1016/j.erss.2018.10.018
Ozcan, H. G., Gunerhan, H., Yildirim, N., and Hepbasli, A. (2019). A comprehensive evaluation of PV electricity production methods and life cycle energy-cost assessment of a particular system. J. Clean. Prod. 238, 117883. doi:10.1016/j.jclepro.2019.117883
Pérez, G. A. D. la P., Couret, D. G., Algeciras, J. A. R., and Vento, G.D. la P. (2022). Influence of the urban context on solar protection of the vertical envelope and the cooling energy demand of buildings in Cuba. J. Build. Eng. 2, 33–47. doi:10.1016/j.jobe.2023.107224
PVSYST (2023). PVSYST photovoltaic software. Available at: https://www.pvsyst.com/ (Accessed June 28, 2023).
Sha, H., Xu, P., Yang, Z., Chen, Y., and Tang, J. (2019). Overview of computational intelligence for building energy system design. Renew. Sustain. Energy Rev. 108, 76–90. doi:10.1016/j.rser.2019.03.018
Shirinbakhsh, M., and Harvey, L. D. D. (2023). Feasibility of achieving net-zero energy performance in high-rise buildings using solar energy. Netherlands: Elsevier. doi:10.1016/j.enbenv.2023.07.007
SINAPI (2023). Acesso rápido aos principais relatórios e documentos do SINAPI. Available at: https://www.caixa.gov.br/poder-publico/modernizacao-gestao/sinapi/Paginas/default.aspx (Accessed June 30, 2023).
SMA (2023). Sunny design Web. Available at: https://www.sunnydesignweb.com/sdweb/#/ (Accessed July 2, 2023).
Sobhkhiz, S., and El-Diraby, T. (2023). Dynamic integration of unstructured data with BIM using a no-model approach based on machine learning and concept networks. Automation Constr. 150, 104859. doi:10.1016/j.autcon.2023.104859
Sun, K., Zhao, Q., and Zou, J. (2020). A review of building occupancy measurement systems. Energy Build. 216, 109965. doi:10.1016/j.enbuild.2020.109965
Tariq, R., Torres-Aguilar, C. E., Xamán, J., Zavala-Guillén, I., Bassam, A., Ricalde, L. J., et al. (2022). Digital twin models for optimization and global projection of building-integrated solar chimney. Build. Environ. 213, 108807. doi:10.1016/j.buildenv.2022.108807
TRNSYS (2023). Transient system simulation tool. Available at: http://www.trnsys.com/ (Accessed June 30, 2023).
Valentin Software (2023). PVsol Premium. Available at: https://valentin-software.com/produkte/pvsol-premium/ (Accessed October 22, 2023).
Wang, X., Mai, X., Lei, B., Bi, H., Zhao, B., and Mao, G. (2020). Collaborative optimization between passive design measures and active heating systems for building heating in Qinghai-Tibet plateau of China. Renew. Energy 147, 683–694. doi:10.1016/j.renene.2019.09.031
Wang, Z., and Srinivasan, R. S. (2017). A review of artificial intelligence based building energy use prediction: contrasting the capabilities of single and ensemble prediction models. Renew. Sustain. Energy Rev. 75, 796–808. doi:10.1016/j.rser.2016.10.079
Keywords: energy efficiency, renewable energy, cost-benefit analysis, photovoltaic panels, solar heating systems, environmental sustainability
Citation: De Arruda RN, Figueiredo K, Vasco DA, Haddad A and Najjar MK (2023) Cost-benefit analysis of solar energy integration in buildings: a case study of affordable housing in Brazil. Front. Built Environ. 9:1255845. doi: 10.3389/fbuil.2023.1255845
Received: 09 July 2023; Accepted: 21 November 2023;
Published: 20 December 2023.
Edited by:
Hasim Altan, Prince Mohammad Bin Fahd University, Saudi ArabiaCopyright © 2023 De Arruda, Figueiredo, Vasco, Haddad and Najjar. This is an open-access article distributed under the terms of the Creative Commons Attribution License (CC BY). The use, distribution or reproduction in other forums is permitted, provided the original author(s) and the copyright owner(s) are credited and that the original publication in this journal is cited, in accordance with accepted academic practice. No use, distribution or reproduction is permitted which does not comply with these terms.
*Correspondence: Karoline Figueiredo, karolinefigueiredo@poli.ufrj.br