 Babak Salarieh
 Abdullahi M. Salman
- Department of Civil and Environmental Engineering, The University of Alabama in Huntsville, Huntsville, AL, United States
The projected increase in sea surface temperature due to climate change is expected to substantially intensify future hurricanes. Wooden light-frame residential buildings are particularly vulnerable to hurricane damage, and their risk is expected to increase due to heightened exposure and intensifying hurricanes. Therefore, adaptation strategies need to be planned to reduce damage to such buildings while considering the impact of climate change on hurricanes. This study investigates the effectiveness of various climate change adaptation strategies for coastal wood-frame single-story residential buildings and demonstrates how these strategies can be planned. The study considers the four Representative Concentration Pathways (RCPs) proposed by the IPCC to investigate the impact of climate change on wind hazard and losses. Additionally, three locations in the coastal United States of varying sizes, exposure, and hurricane hazard levels are considered: Harris County, Texas; Mobile County, Alabama; and Miami-Dade County, Florida. The results show that the increase in wind speeds and losses will be non-linear with time. All considered adaptation strategies decreased losses, with some able to completely counter the increasing losses even under high emission scenarios. Investigating the effectiveness of adaptive measures can guide stakeholders in allocating funds and efforts for hurricane risk management and enhancing community resilience.
1 Introduction
The population of the coastal communities in the U.S. hit approximately 130 million in 2020, accounting for almost 40% of the total U.S. population. Consequently, there has been a notable surge in the number of residential buildings in these regions. Notably, light-frame wooden structures comprise the majority of residential buildings in the United States (Amini and van de Lindt, 2014; Unnikrishnan and Barbato, 2017; Masoomi et al., 2018). However, this type of construction is vulnerable to intense winds, and damages caused by excessive wind pressure and wind-borne debris represents a significant portion of the losses caused by hurricanes (Abdelhady et al., 2022). Furthermore, the majority of future climate prediction models based on emission scenarios of the Intergovernmental Panel on Climate Change (IPCC) predict significant changes in environmental parameters, such as sea surface temperature, as a result of climate change (Portner et al., 2019). As a result, the intensity of climate-dependent natural hazards, including hurricanes, is expected to substantially increase in the future (Hallegatte, 2007; Knutson et al., 2010; Walsh et al., 2016; Contento et al., 2019). Considering the combined effects of climate change and population growth in coastal regions, damage to buildings—especially light-frame wooden structures—due to hurricane hazards has the potential to increase significantly (Gurley et al., 2005; Pielke et al., 2008; Lee and Ellingwood, 2017; Lin et al., 2019; Snaiki et al., 2020). Hence, understanding the effect of climate change on the lifecycle performance of these structures is of utmost importance and requires further consideration.
The vulnerability of wooden light-frame structures to intense winds has garnered increasing attention over the years. More recently, Abdelhady et al. (2022) presented a probabilistic methodology for fragility analysis of wooden residential buildings subjected to hurricane winds. The available literature predominantly focuses on structural performance, fragility analysis at the component and building level, as well as loss assessment under hurricane wind hazard (Ellingwood et al., 2004; Pinelli et al., 2004; Emanuel et al., 2006; Li and Ellingwood, 2009; Unnikrishnan and Barbato, 2017; Wang and Rosowsky, 2018; Pant and Cha, 2019a; Angeles and Kijewski-Correa, 2022; Klepac et al., 2022; Angeles and Kijewski-Correa, 2023; Kijewski-Correa et al., 2023). While extensive research has been conducted regarding the structural performance of wooden buildings under wind loads, not enough attention has been given to the assessment of the benefits and efficiency of different adaptive measures, considering the anticipated changes in future hazards (e.g., adaptation methods, retrofitting, strengthening, and design improvement and enhancement).
Current performance assessment studies for buildings under the threat of hurricanes assume that wind speeds remain stationary over time and do not consider the potential impact of climate change. For instance, Unnikrishnan and Barbato (2016) presented a performance-based hurricane engineering (PBHE) framework to evaluate the losses due to hurricanes and the benefits of different mitigation measures for a typical residential building, without considering climate change. In another study, Masoomi et al. (2018) investigated different sets of wind performance enhancement methods for specific archetype building types under extreme winds. However, the wind load was assumed to be stationary with time. More recently, Orooji et al. (2022) explored the effectiveness of available wind mitigation strategies for a single-story, wood-frame residential building in the U.S., in terms of payback period (the number of years to recover the investment). The results of the cost-effectiveness of these mitigation measures were performed based on the current ASCE-7 wind speed contours, which assume stationarity wind threat and do not account for any changes in future hazards due to the impact of climate change.
Previous studies on the impact of climate change on future building damage and loss have primarily focused on capturing changes in climate parameters and their relationship with estimated losses (Pita et al., 2012; Liu, 2014; Pant and Cha, 2018; Pei et al., 2018; Wang and Rosowsky, 2018; Pant and Cha, 2019a; Pant and Cha, 2019b). Hence, further attention is required in improving structural performance, quantifying costs, and assessing the benefits of various adaptive measures under a dynamic risk level caused by the impact of climate change. Currently, some studies have investigated the cost-effectiveness of adaptation planning for residential buildings at a regional scale, considering the uncertainties of climate change effects (Bjarnadottir et al., 2011; Li et al., 2012; Bjarnadottir et al., 2014; Stewart and Deng, 2015; Bjarnadottir et al., 2019; Qin and Stewart, 2020; Orcesi et al., 2021). For example, Dong et al. (Dong and Frangopol, 2017) conducted one such study, which explored the performance of different adaptive measures under hurricane threats, assuming a non-stationary wind model to account for climate change. However, the investigated adaptive measures were limited to updating older buildings to newer building types based on the year built (e.g., buildings constructed before 1970 updated to types built between 1986 and 1997 or after 1997). Furthermore, while this study accounted for the changing hazard due to climate change, the hazard is not directly assessed as a function of potential future climatic condition, and the wind hazard intensity changes due to climate change is assumed to be linear. Hence, there is a need for an investigation into the impact of component-level adaptive measures on building performance, based on climatic conditions. By incorporating the effect of climate change on the hurricane hazard in building performance assessment, the non-stationary aspect of the hazard will be considered, which would lead to improved pre-disaster preparedness considering the long-term lifespan of structures while improving resource management and funding allocation. Additionally, it is essential to investigate adaptive measures specific to individual components of a structure, rather than applying a general update to structural performance. Such an approach will provide a more detailed analysis of different building types and insights into the effectiveness of selected adaptive measures under varying levels of future hazards. Conducting an investigation of adaptive measures on a component level will also lead to a better understanding of each measure’s effectiveness and practicality for implementation on a regional scale, offering more flexibility in allocated funds and expected cost. The results from such an approach could provide detailed guidance for decision-makers and stakeholders to improve the understanding of the effectiveness of different adaptation methods and enhance community resilience.
This paper investigates various climate change adaptation measures for residential buildings based on lifecycle loss due to hurricane winds considering the non-stationary aspects of wind hazard due to the impact of climate change. Cost-benefit analysis is used to investigate the effectiveness of different adaptive strategies in Harris County, Texas; Mobile County, Alabama; and Miami-Dade County, Florida, which are expected to experience varying levels of increased hurricane wind hazards in the future. The goal is to assess the structural performance, quantify lifecycle loss, quantify the mitigated loss and adaptation cost, and determine the best strategy sets within specified economic constraints based on cost-effectiveness analysis considering the predicted future changes of the wind hazard. The U.S. Census Bureau estimates that out of total 129 million occupied units in 2021, approximately 82 million housing units are single-family houses (U.S. Census Bureau, 2020). Furthermore, reports have stated that the majority of hurricane damage typically occurs to such units (Bjarnadottir et al., 2011), which makes them one of the most vulnerable types of residential units. Additionally, approximately 50% of the houses across the investigated regions in this study are one-story. Therefore, emphasis is placed on single-family, one-story units with similar properties such as area and property value.
The paper is organized as follows. Section 2 describes the study locations and building types and characteristics. In Section 3, the model used to simulate hurricanes and generate future projections of wind speeds based on projected changes in sea surface temperature is described. Section 4 outlines the loss assessment methodology and presents the projected losses for the study locations. In Section 5, the effectiveness of various adaptation strategies is investigated, and the implementation of the strategies is discussed. Finally, the study’s conclusions are presented in Section 6.
2 Study locations
2.1 Locations description
Three coastal counties in the U.S. have been selected for the study: Harris County, Texas; Mobile County, Alabama; and Miami-Dade County, Florida. These locations exhibit varying levels of hurricane hazard risk, vary in size and population, and are expected to experience diverse changes in hurricane hazards due to climate change, as will be discussed later. Harris County has the lowest hurricane wind hazard among the three locations. For instance, the 50-year mean recurrence interval design wind speed for Harris County is 104 mph, compared to 113 mph and 127 mph in Mobile and Miami-Dade counties, respectfully (ASCE, 2022). However, there are an estimated 533,551 one-story residential buildings in Harris County compared to 73,142 in Mobile and 76,743 in Miami-Dade (FEMA, 2022). Hence, while Harris County has the lowest hurricane wind hazard, it has the highest exposure of buildings, leading to higher potential vulnerability.
2.2 Building types and characteristics
The single-story residential buildings within a region contain a wide array of building types and properties. For simplification, to assess the regional damage and loss caused by hurricanes, buildings with similar properties, construction quality, loss characterization and wind-performance in the study regions are categorized into different “building types” grouped together based on their building feature variations that are outlined in Table 1.
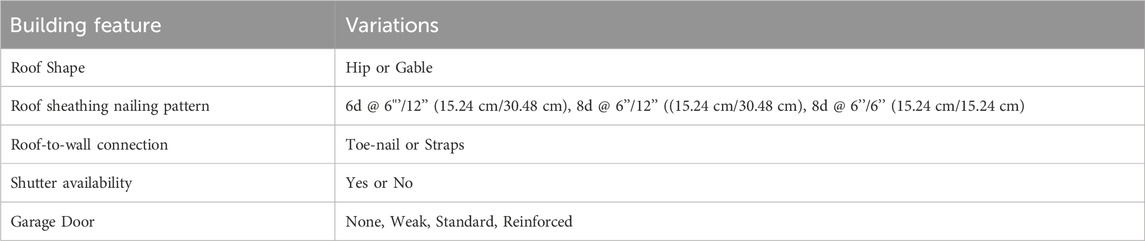
TABLE 1. Building features and variations.
Considering the predominant variations of building features (Table 1) (FEMA, 2012) and wind resistance characteristics among wooden-frame residential buildings, 96 different building types are considered in the studied regions. The buildings in each region are categorized based on each building feature such that they can accurately represent the wind-resistance characteristics of the single-story buildings as a whole in that region. Other characteristics such as plan area and height were assumed to be similar for all the single-story buildings to focus on the building features specifically. For each county, using a Monte-Carlo simulation, a building inventory is generated that represents the current building composition in terms of building feature proportions, number, and location through census tracts—a small, relatively permanent statistical subdivisions of a county, as defined by the Census Bureau—which provides a general location and distance from the shore. These properties are based on the extracted information from HAZUS-MH (Hazus) (FEMA, 2012) for building inventory established from the 2010 census. For example, based on the information available from Hazus (FEMA, 2012), it has been observed that 70% of the wooden-frame residential buildings in Miami-Dade have shutter protection while 30% do not have shutter protection. The buildings are assumed to have a plan area of 1800
Furthermore, it should be noted that the building inventory composition considered for future loss estimation in this study is assumed to be unchanged since the purpose of this study is to compare the current and future implications of climate change on hurricane wind damage as well as investigate the efficiency of different adaptive measures without introducing uncertainties in other parts of the modeling (e.g., building numbers, value, types, vulnerability, fragility, etc.). Recently, Kijewski-Correa et al. (Kijewski-Correa et al., 2023) developed a novel method of generating building inventory in data-rich and data-scarce environments using publicly available data and time-evolving code-based rulesets. The method can overcome some of the shortcomings of the approach adopted in this study to generate building inventory. For example, the time-evolving ruleset approach overcomes the challenge of assuming a stationary or older building inventory and allows for the consideration of changes in building codes over time.
3 Hurricane hazard analysis
3.1 Hurricane simulation model
The first step in assessing the structural performance and regional loss of residential buildings is to quantify the hazard intensity. The structural performance of buildings under wind-related hazards, such as hurricanes, can be expressed as a function of wind speed. Wind speed serves as a necessary input for damage assessment and is dependent on hurricane intensity. To capture the effect of climatic parameters on the intensity of future hurricanes and provide predictions of future wind hazard, the Empirical Track Model (ETM), first proposed by Vickery et al. (Vickery et al., 2000), is employed in this study. This model is widely used in studies concerning the impact of climate change (Powell et al., 2005; Emanuel et al., 2006; Mudd et al., 2014; Pant and Cha, 2019a), and was also used to develop the wind speed maps in ASCE 7-10 & ASCE 7-16 guidelines (ASCE, 2017). Additionally, the model facilitates the direct incorporation of changes in Sea Surface Temperature (SST) as one of the main variables for hurricane intensity, making it an ideal choice for developing climate-dependent hurricanes. As a result, the simulated hurricanes are influenced by the temporal and spatial variations of SST over the Atlantic basin.
Figure 1 shows a flowchart of the simulation model. The number of simulated hurricanes over the North Atlantic Ocean each year is determined by sampling from a negative binomial distribution with a mean value of 11.20 storms/year and a standard deviation of 5.6 storms per year. These values are based on a statistical analysis of historic storm records (HURDAT) from 1944 to 2020 (Vickery et al., 2010; Landsea et al., 2015). For each simulated storm, the genesis point is sampled from recorded hurricanes to provide starting coordinates, date and time, initial heading, and translational speed, accounting for the seasonality of Atlantic hurricanes. Once a genesis point is selected, the storm’s track is updated at specific time intervals (every 6 h) using regression coefficients. These coefficients are determined based on recorded historical hurricane data for each cell on a

FIGURE 1. Flowchart for one storm year simulation [adapted from Salarieh et al. (2023)].
The central pressure of a hurricane on water, which serves as a measure of its intensity, is calculated as a function of SST. Given that hurricane intensity directly depends on climatic parameters such as SST, the hurricane model takes into account the impact of climate change and its effect on SST. For the present climate scenario, recorded monthly average SST values up until the year 2020, on a 1 × 1° grid, were obtained from the Hadley Ice and Sea Surface Temperature (HadISST) database (Rayner et al., 2003) and used in the hurricane model. Meanwhile, projections of future SST on a monthly average basis by the end of the 21st century (2100) were obtained from the Coupled Model Intercomparison Project Phase 5 (CMIP5) on a 1 × 1° resolution grid (Held et al., 2019). These SST projections are extracted from Geophysical Fluid Dynamics Laboratory (GFDL) - Coupled Model (CM3) of the National Oceanic and Atmospheric Administration (NOAA) and cover four emission scenarios in terms of Representative Concentration Pathways (RCP), defined by the IPCC: RCP 2.6, 4.5, 6.0, and 8.5. The IPCC emission scenarios represent four possible total radiative forcing and resulting potential impacts on the climate and environmental parameters such as global and sea surface temperature by the end of the 21st century (IPCC, 2013; Allan et al., 2021). RCP 2.6 represents a scenario where mitigation actions are taken, leading to a very low forcing level that peaks and declines before 2100. RCPs 4.5 and 6.0 are stabilization scenarios where radiative forcing stabilizes by 2100 for RCP 4.5 but does not peak for RCP 6.0. RCP 8.5 is a very high greenhouse gas emissions climate scenario representing a high-risk future. Considering the significant uncertainty in future global emission trends and policies, it is challenging to identify which climate scenario will become the status quo in the future. As a result, this study accounts for all four Representative Concentration Pathways (RCPs) when calculating the predicted wind speeds and subsequent regional loss estimations. Based on concentration-driven CMIP5 simulations by the IPCC (IPCC, 2013), the mean ocean temperature for the period 2081-2100 is projected to increase by 0.8°C (RCP 2.6), 1.5°C (RCP 4.5), 1.9°C (RCP 6.0), and 2.8°C (RCP 8.5) relative to the period 1986-2005.
To model the decay of the hurricane’s central pressure after it makes landfall until dissipation, a decay model provided by Vickery and Twisdale (1995) is used. Dissipation is assumed to occur when the difference between the central pressure of the hurricane and the atmospheric pressure is less than 1 mb. To account for uncertainties associated with hurricane scenarios, a Monte-Carlo simulation is used to simulate 80,000 years of hurricanes, considering the projected SST changes for each of the studied climate scenarios. The hurricane parameters obtained from the simulation are then input into a wind field model developed by Georgiou (1986) to evaluate the gradient wind speeds. Finally, the gradient wind speed can be converted to surface wind speed using the conversion factors provided by Lee and Rosowsky (2007). Using the simulated hurricane ensembles for each climate scenario, the 3-s gust wind speed at 10 m (V) is extracted for each census tract in a studied county to be used for damage assessment.
For more detailed information on the ETM model used in this study, including model validation, refer to Salarieh et al. (2023).
3.2 Impact of climate change on hurricane wind hazard
To assess the impact of climate change on future hurricane wind hazard, the 3-s gust wind speed under different climate scenarios as a function of the Mean Recurrence Interval (MRI) for the studied counties is evaluated for the present and future climate scenario. Figure 2 presents the projected increases in the 700-year MRI wind speeds on ten-year intervals between the years 2020 and 2100 for the four climate scenarios. The 700-year MRI is presented because it corresponds to the wind design level for Category II structures in ASCE 7-16 (ASCE, 2017), including residential buildings. It is observed that the impact of climate change will lead to a significant increase in the intensity of design wind speed for all the studied locations. Under the RCP 8.5 climate scenario (average SST increase of 2.8℃), the 700-year MRI wind speed for Harris County is predicted to increase by 22% by the end of the century, compared to current conditions. Meanwhile, the corresponding increase for Mobile and Miami-Dade Counties are 20% and 32%, respectively. A similar trend of increase in future wind speeds, with less drastic differences, is observed for more moderate climate scenarios (RCP 4.5 and 6.0). For RCP 2.6, which represents the low-emission climate scenario with approximately 1.0℃ increase in the global average SST, the wind speeds are projected to increase between 9% and 12% compared to current conditions.
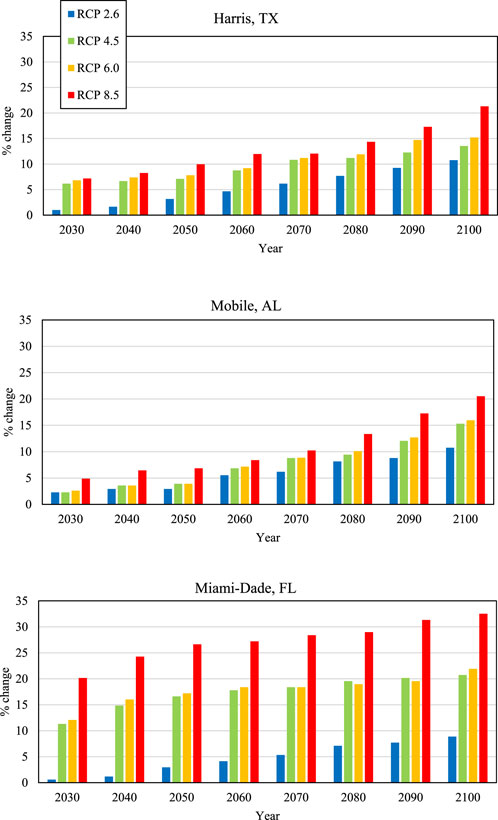
FIGURE 2. Projected percentage increases for the four considered climate scenarios in the 700-year MRI hurricane wind speeds on 10-year intervals across three studied Counties Harris, TX; Mobile, AL; and Miami-Dade, FL.
Additionally, the projected increase in the wind speeds for different decades also suggests a non-linear trend. This is because the projected increase in SST is temporally uneven and fluctuating. For example, a significant increase in 700-year wind speeds is expected for Miami-Dade over the next three decades, while Mobile, AL, and Harris, TX, will be experiencing a significant increase in wind speeds towards the end of the century.
4 Loss assessment
The loss assessment approach involves using building damage state definitions and the wind hazard from the hurricane simulation to evaluate losses at both the individual building and regional levels. Building damage states, corresponding to damage ratios (or loss ratios), are derived from component (building features) damage levels. Structural loss for a single building type can be expressed in terms of the expected annual loss (EAL), based on the structural loss ratio of individual building types under a given hurricane scenario. Subsequently, the expected total loss (ETL) for a region can be estimated using the number of residential buildings by type and the average building value in that region for a specific time frame. The building damage functions and the loss assessment procedure are described in detail below.
4.1 Building performance assessment
Existing damage models for different building types under wind load are employed to predict the damage and loss for the residential buildings in this study. Five descriptive damage states, ranging from 0 (no damage) to 4 (destruction), are considered to assess the structural performance of the buildings. These damage states (DS) are defined based on the building envelope’s performance and the required repair cost/action needed to restore a damaged building. Table 2 provides a summary of the assumed damage states for residential buildings in this study (Vickery et al., 2006a; Vickery et al., 2006b; FEMA, 2012; Unnikrishnan and Barbato, 2016; Masoomi et al., 2018).
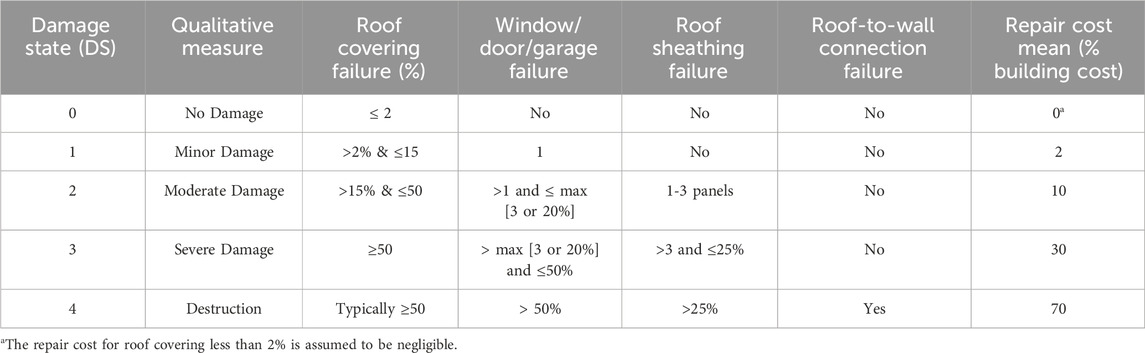
TABLE 2. Damage States (DS) for wooden frame residential buildings.
For each damage state, a damage model or fragility function is extracted for individual building types from Hazus (FEMA, 2012). Fragility functions are cumulative distribution functions (CDFs) and are defined as the probability of damage reaching or exceeding a certain damage level (i.e., damage state) for a given hazard intensity measure. The fragility curves for a specific building type are based on numerous iterations that compare the building feature strength or “Resistance” to the applied wind speed or “Load” to decide whether an element has been damaged in that iteration. Such procedure leads to a probabilistic approach rather than a deterministic method that assumes one single value for strength and load. One advantage of a probabilistic damage modeling approach such as employing fragility functions is that the variations in the resistance of building features will be accounted for and the impact from such variations could be primarily captured. However, there are uncertainties that are difficult to capture even with the probabilistic damage model. Uncertainties due to differences in regional construction practices and regulatory environments (building code variations, year of building construction relative to code updates, materials variations, etc.) cannot be adequately captured in the adopted probabilistic damage model. For hurricane wind hazard, the intensity measure is often assumed as a maximum 3-s gust wind speed (V). As such, the building fragility
where DS is a damage state,
4.2 Loss estimation
Using the fragility functions and the climate-dependent projected wind speed at the location of each census tract, the probability of the damage level exceeding specific damage states (DS) can be computed by employing a Monte Carlo simulation. Since each damage state is defined according to the required repair action/cost, it becomes possible to define the expected loss for a single building in a region based on the functionality of the structure. In this study, the direct loss due to structural damage is emphasized. The expected annual loss (EAL) is calculated by convolving the loss curve and probability density function of the annual maximum wind speed as shown by Eq. 2:
in which
The direct loss in terms of repair cost is calculated based on the damage ratio associated with a structure under a given hurricane scenario. While building loss ratios, based on the level of individual component damage states, are sufficient for quantifying the damage and loss for single buildings, regional loss, and comparison of loss increase due to climate change, the cost-effectiveness analysis of the adaptive measures requires the loss to be expressed in dollar values. Hence, for each Damage State (DS) assumed, a repair cost in the form of a lognormal distribution is generated with a mean value expressed as a percentage of the total building cost (Table 2) and a COV of 0.2 to account for the uncertainty of the repair cost due to factors such as local labor cost, local construction practices, and material availability (Unnikrishnan and Barbato, 2017). The calculated direct loss for each building type can then be used, along with the number of buildings by type and average building value in the investigated census tract, to estimate the regional expected annual loss. Based on the calculated EAL for individual building types and the acquired building inventory of the studied region, the regional expected annual loss (REAL) is given by Eq. 3:
in which
The increase in losses between the present climate and the future climate scenarios for the studied regions is quantified for ten-year intervals between the years 2020 and 2100, as shown in Figure 3. Since the comparison is made in terms of a ratio, the value is normalized for the average building value and number of building types, making it easier to compare regions that vary in size. However, the regional loss is also measured in terms of monetary value, providing further insight, especially when performing the cost-benefit analysis for different adaptation measures, as presented in the next section. It is observed that the estimated annual losses are expected to increase in the future due to the rise in hurricane wind intensities. Nevertheless, similar to the projected wind speeds, the risk in terms of loss increases is not consistent across the studied locations and time frames.
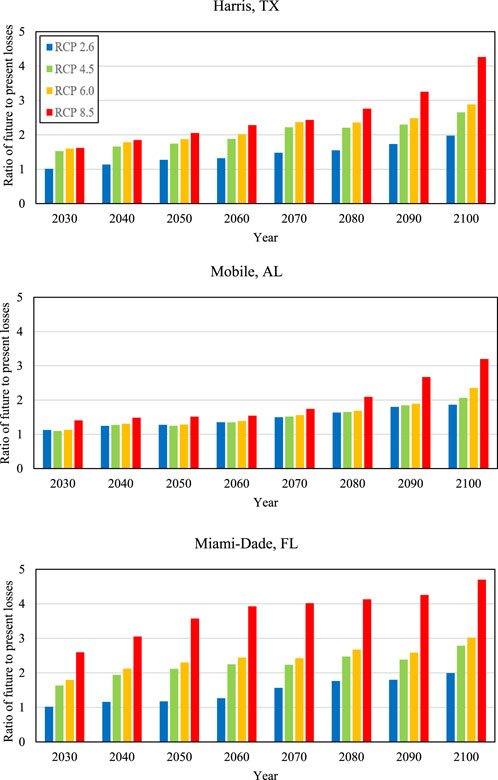
FIGURE 3. Increase in losses in future climates compared to present climate (2020) for the four considered climate scenarios on 10-year intervals across three studied Counties Harris, TX; Mobile, AL; and Miami-Dade, FL.
Figure 3 shows that by the end of the century, Miami-Dade will experience the highest increase in losses, while the lowest loss increase is in Mobile, AL. This trend is particularly prominent for the higher emission scenarios. Under RCP 8.5, the losses in Miami-Dade in the year 2100 will be 4.70 times the losses in 2020. The corresponding increases in Harris and Mobile are 4.26 and 3.20, respectively. Interestingly, this analysis demonstrates that the increases in the loss ratio by the year 2100 for Harris and Miami-Dade are comparable, even though the wind hazard is relatively higher for Miami-Dade and is expected to increase more significantly (as shown in Figure 2). This is because other factors, such as the number and types of buildings, also play a crucial role in determining the level of losses. Harris County has over 500,000 buildings compared with approximately 76,000 in Miami-Dade.
The increase in losses is also dependent on the emission scenarios. Under the low-emission RCP 2.6 scenario with 1 °C increase in average sea surface temperature, all the locations will experience approximately a 100% increase in regional loss by the end of the century. This is because the increase in wind speeds in all three locations is also similar, as seen in Figure 2. Changes in wind speeds for the locations are similar because, under the RCP 2.6 scenario, changes in SST are not drastic across all regions in the Atlantic and the Gulf of Mexico. However, as emissions increase (to RCP 4.5 and 6.0), the increase in losses starts to differ among locations. It is worth noting that the predicted increase in regional loss under the moderate emission scenarios (RCPs 4.5 and 6.0) is comparable across all time frames and studied locations because the expected increase in SST under these two scenarios is relatively close, resulting in comparable wind hazard profiles, as observed in Figure 2.
It is also worth noting that the investigated time intervals (e.g., 10, 20, ., and 80 years from 2020) have a considerable effect on the expected annual loss of the buildings, and the rate of increase is not constant or linear over time. This is especially evident for the RCP 8.5 scenario. In Harris County, the loss ratio will increase from 1.62 in 2030 to 2.28 in 2060 under the RCP 8.5 scenario, indicating a 41% increase. However, the loss ratio would further increase from 2.28 in 2060 to 4.26 in 2100, showing an 87% increase. Hence, the trend demonstrates a faster increase in the second half of the 21st century. The trend is even more pronounced for Mobile, where the loss ratio will increase by 9.2% from 2030 to 2060 and by 108% from 2060 to 2100 under the RCP 8.5 scenario. However, the trend is different in Miami-Dade. Under the RCP 8.5 scenario, the loss ratio will increase by 51% from 2030 to 2060, and by 20% from 2060 to 2100. Note that the trend in the increase in losses follows the trend in the increase in wind speed seen in Figure 2.
5 Adaptation planning
5.1 Adaptation strategies
The adaptation strategy considered in this study involves retrofitting and strengthening existing selected archetype single family homes by implementing robust and stronger component-based setups. Table 3 provides a summary of the considered adaptation strategies and the assumed retrofit implementation cost on existing selected archetype single family homes, extracted from Orooji et al. (Orooji et al., 2022), along with published component-level housing cost data included in RSMeans (Gordian, 2013). Note that in Table 3, “Shutt” indicates the fortification of openings, which includes installing shutters and/or reinforced garage door(s). Following the method used in the previous section for calculation of the regional loss for wind hazard under different climate scenarios, the predicted estimated regional loss considering different adaptation measures are considered by accounting for the changes to the building type and the building composition in a region. The updated fragility curves for the buildings after implementing the adaptation strategies are also obtained from Hazus (FEMA, 2012). To study the effectiveness of the adaptation strategies, it is assumed that the implementation takes place in the year 2020, and the accumulated total lifecycle loss is calculated for the end of the century (i.e., 80 years lifecycle).
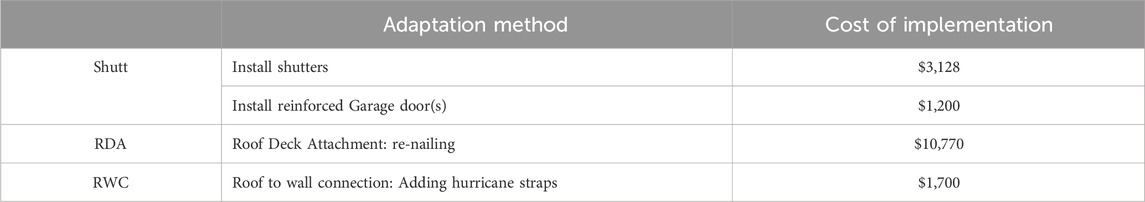
TABLE 3. Retrofit implementation cost for each adaptation strategy for archetype single family, one-story residential building (Note: Costs are for homes with plan area of 1800
To quantify the effectiveness of an adaptive measure, a cost-benefit analysis is implemented, which takes into account the cost of different adaptation techniques and the benefits achieved from the performance improvement of the studied buildings over their entire lifecycle (design life). Incorporating lifecycle engineering is crucial when evaluating the impact of climate change on the expected loss and damage of infrastructures in the future (Dong and Frangopol, 2017), given that climate change is a long-term issue. Additionally, the cumulative damage, losses, and possible benefit in monetary terms over the expected design life are of importance to decision-makers and stakeholders when considering different adaptation options. The expected economic benefit of an adaptive measure (B) is given by Eq. 4 (Liel and Deierlein, 2013):
where
5.2 Adaptation planning approach
To guide the planning and implementation of the adaptation strategies, the estimated annual loss (EAL) for all building types is calculated, which is directly related to the building vulnerability. To identify the retrofits that are beneficial and cost-effective (B > 0), the building types are ranked based on their vulnerability (EAL). While the wind hazard profile varies significantly across different locations, the vulnerability ranking remains unchanged across the regions. For example, the most vulnerable building type considered in this study is a gable roof with 6 days nails @ 6”/12″ roof to deck attachment, a Toe-nail roof-to-wall connection with no shutters, and a weak garage door. Conversely, the most robust building type is a hip roof with 8 days nails @ 6”/6” roof to deck attachment, strap roof-to-wall connection with hurricane shutters installed, and an SFBC 1994 garage door. The outcome based on vulnerability (or, conversely, performance) is directly related to the lifecycle loss within a region. The aim here is to achieve the maximum benefit by reducing the expected lifecycle loss.
It is found that the most effective approach to implementing adaptation strategies is to prioritize the highest exposed of the most vulnerable building types based on the building type vulnerability ranking. Such an approach intuitively leads to the highest reduction of the total lifecycle loss within the investigated region for a given adaptive strategy, thereby maximizing the benefits associated with structural adaptive actions in a lifecycle context. This is because the cost of the adaptation strategies is the same for each specific building component. Furthermore, when similar building types are considered in terms of vulnerability ranking, it is observed that higher loss reduction and benefits are achieved by prioritizing the buildings located in census tracts with higher wind hazard levels. These hazard levels vary among different census tracts within a region and are found to be impacted by average surface roughness and distance from the coast.
First, the effectiveness of the adaptation strategy in terms of its ability to reduce losses is investigated. The level of implementation of the adaptation strategies for all the buildings in a region is also varied from 10% to 100%. For example, 80% implementation implies that a particular adaptation strategy is implemented on 80% of building types in a region that are eligible to receive the adaptation. Eligible buildings are those that would benefit from the adaptation strategy. For instance, buildings eligible to receive hurricane straps are those without hurricane straps. Additionally, the adaptation is planned based on the vulnerability ranking discussed above. Hence, for all implementation levels, buildings are prioritized based on their vulnerability ranking. 100% implementation means all eligible buildings received the adaptation strategy.
The results are presented in Figure 4. Note that the losses in Figure 4 are normalized and represented by the “Total loss ratio,” which is a ratio of the total lifecycle loss with adaptation strategies and climate change to the total lifecycle loss with no climate change and no adaptation. Only results for RCP 2.6, 4.5, 8.5 are shown. Results for RCP 6.0 are not displayed because they are very similar to the RCP 4.5 results, as observed in Figures 2, 3.
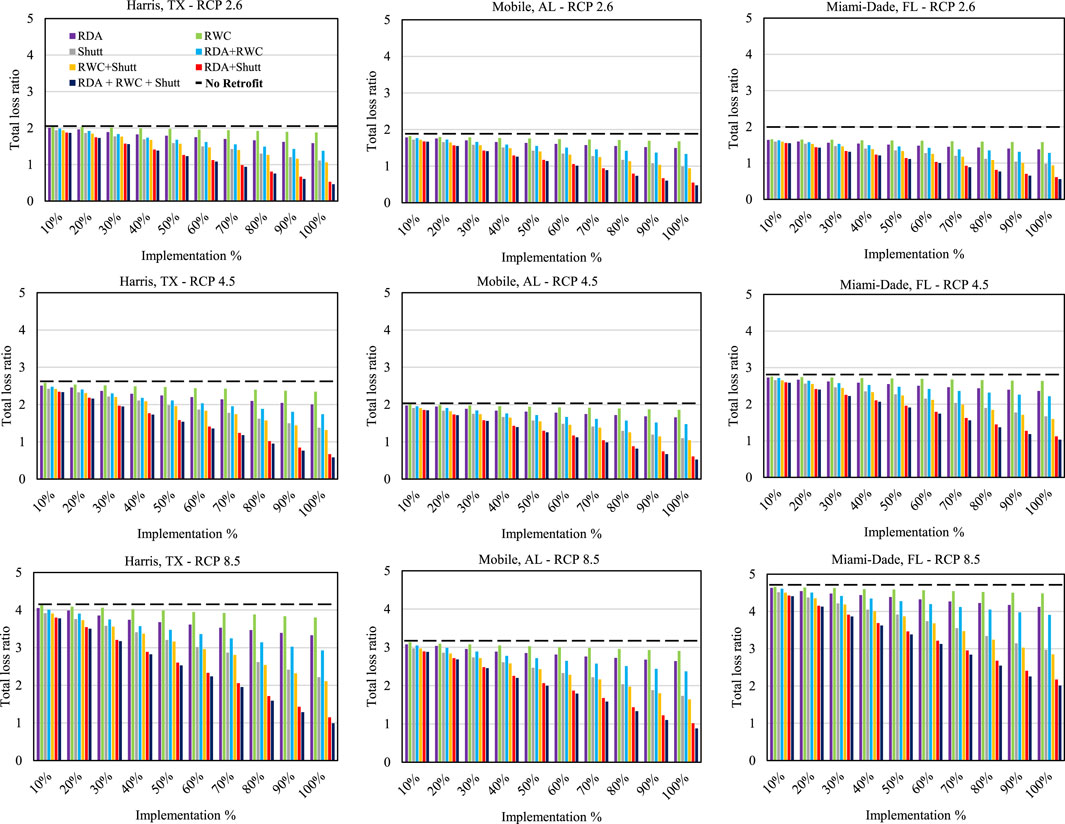
FIGURE 4. Reduction in total lifecycle loss for different levels of adaptation strategy implementation for the considered climate scenarios across three studied Counties Harris, TX; Mobile, AL; and Miami-Dade, FL [“Total loss ratio” (vertical axis) is the ratio of the total lifecycle loss with adaptation strategies and climate change to the total lifecycle loss with no climate change and no adaptation. Dashed lines are total loss with no adaptation].
Figure 4 shows that all the adaptation strategies are effective in reducing losses; however, their effectiveness varies. In all locations and for all RCP scenarios, a robust yet expensive RDA + RWC + Shutt (Roof to Deck Attachment (RDA), Roof to Wall Connection (RWC), and Shutter and garage door (Shutt)) upgrade led to the highest loss reduction. It is also observed that the level of implementation significantly impacts the effectiveness of the adaptation strategies in all locations for all RCPs. For example, at 10% implementation, all seven possible combinations of adaptation strategies did not show significant variation in their effectiveness to reduce losses. However, at 100% implementation, the effectiveness is starkly different. Consider the RDA + RWC + Shutt strategy in Miami-Dade for the RCP 8.5 scenario, where the total loss ratio decreased from 4.4 to 2.0 for 10% and 100% implementation, respectively. In contrast, the RWC strategy only reduced the loss ratio from 4.66 to 4.48 for 10% and 100% implementation, respectively. This pattern is consistent across all locations and RCPs, indicating that the RWC strategy is the least effective in reducing losses. This can be attributed to the fact that Roof to the Wall (RWC) attachments such as hurricane straps mostly prevent significant levels of damage to the building roof by transferring the uplift force to the walls. Such damage mode usually occurs under significantly strong winds that detach the roof of the building, partly or completely. Although a clear increase in the intensity of future winds, especially under RCP 8.5, is observed for all studied locations, the frequency of such occurrence is still not common. Hence, it can be said that hurricane straps prevent significant damage and loss to the building when the rare intense wind incident strong enough to uplift the roof occurs. The figure also show that RDA + Shutt is almost as effective as RDA + RWC + Shutt in all locations. This further underscores the limited impact RWC has in reducing losses.
Among all single-component adaptive actions, hurricane shutter installation and improvement to the garage door (‘Shutt’) are the most effective strategies in reducing losses. The next most effective strategy is RDA, followed by RWC. Additionally, as the percentage of implementation increases from 10% to 100%, the difference in effectiveness between the shutter/garage improvement strategy and the other two widens. When considering a combination of any two strategies, RWC + Shutt and RDA + Shutt upgrades are significantly more beneficial compared to RDA + RWC. In fact, the Shutt strategy alone is more effective than the combined RDA + RWC strategy in all cases. Therefore, protecting windows and doors from damage incurred by intense winds is observed to be among the most beneficial approaches and should be prioritized when considering adaptive actions to reduce structural lifecycle loss.
The results in Figure 4 show that the effectiveness of the adaptation strategies depends on the severity of climate change. In a future where the RCP 2.6 scenario prevails, the RDA + Shutt and RDA + RWC + Shutt strategies decrease losses to levels lower than those with no climate change in all three locations, depending on the level of implementation. For example, at 70% or higher implementation levels, the two strategies would result in a total loss ratio of less than 1.0. This implies that the total loss, considering climate change and adaptation, would be less than the total loss with no climate change and no adaptation. However, as the severity of climate change increases, the effectiveness of the strategies in terms of loss reduction decreases. For instance, at 70% implementation levels under RCP 8.5, the RDA + RWC + Shutt strategy would yield a total loss ratio of 1.95, 1.58, and 2.84 in Harris, Mobile, and Miami-Dade counties, respectively. This means that losses with climate change would be higher than the case with no climate change, despite the implementation of the adaptation strategy.
Meanwhile, the effectiveness of the different strategies varies across the studied sites. For example, the RDA + RWC + Shutt strategy, which is the costliest adaptation studied herein, proves to be more beneficial for Harris, TX, significantly reducing the predicted regional loss ratio. Under the RCP 8.5 scenario, 100% implementation of the RDA + RWC + Shutt strategy decreased the total loss ratio for Harris County from 4.26 to about 1.0. In other words, 100% implementation of the adaptation strategy would make the total loss with climate change about the same as the case with no climate change. This implies that the adaptation strategy can effectively counter the impact of the worst climate change scenario in Harris County. However, in Miami-Dade, 100% implementation of the RDA + RWC + Shutt strategy decreased the total loss ratio from 4.70 to about 2.0, indicating that the strategy is less effective compared to Harris County. This is potentially due to the more resilient “initial” building inventory in Florida compared to the other studied regions due to stricter building code in Florida (e.g., only 15% of the buildings in Miami-Dade have toe-nail Roof-to-Wall attachment while 25% buildings have this setup in Mobile County). Furthermore, the variation of the projected increase in wind hazard in the future between these regions is another contributing factor as it was previously observed that Miami-Dade is expected to experience the highest increase in wind speed among the three investigated counties.
Figure 5 shows plots of adaptation cost against the ratio of benefit to adaptation cost. Each data point in the figure represents a level of implementation of the strategies, ranging from 10% to 100%. Figure 5 provides valuable information that can be used to plan the implementation of the adaptation strategies. Firstly, the figure displays the cost of implementing different levels of the strategies in the three locations. For example, a 100% implementation of the RDA + RWC + Shutt strategy in Harris will require approximately $6.2 billion. In Mobile and Miami-Dade, the corresponding costs are around $880 million and $721 million, respectively. This cost variation is a function of the cost of each adaptation strategy, the number of buildings, and the initial building inventory composition (i.e., number of buildings eligible for mitigation) in each location.
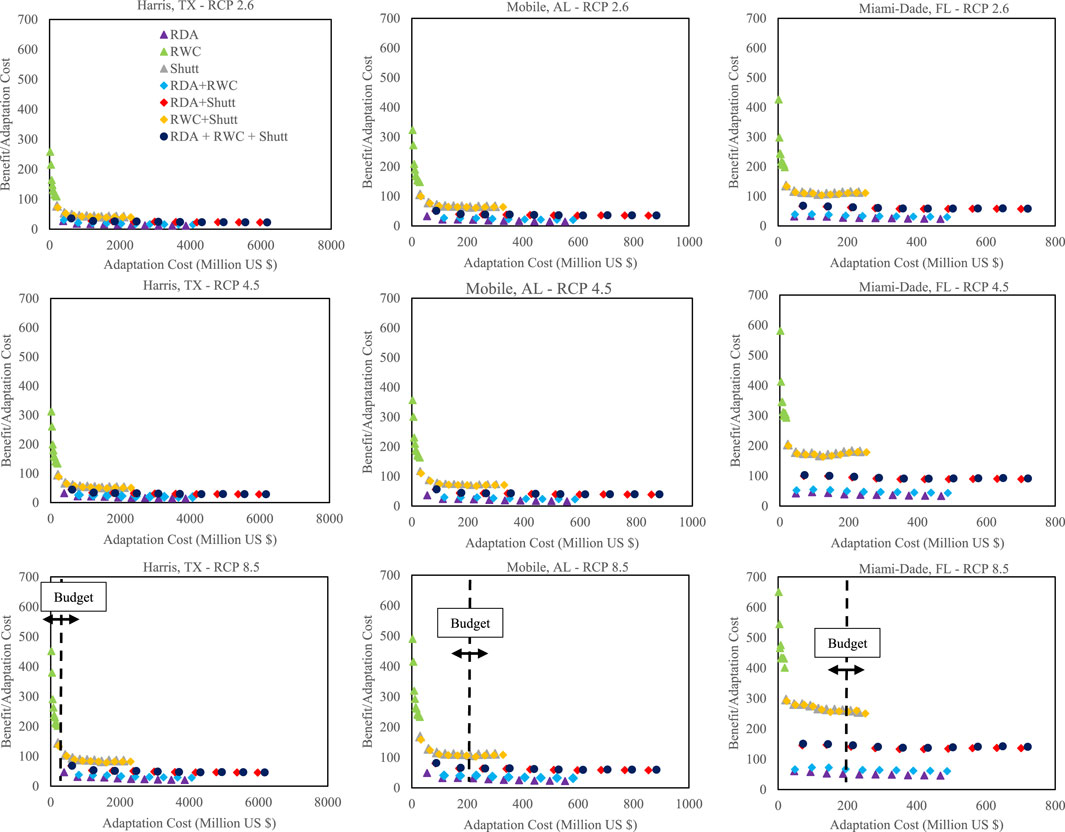
FIGURE 5. Cost effectiveness of different studied adaptive measures for different regions for the considered climate scenarios across three studied Counties Harris, TX; Mobile, AL; and Miami-Dade, FL. The dashed lines represent the budget available for investing in adaptation strategies.
Figure 5 can also assist in selecting adaptation strategies based on their cost-effectiveness, as indicated by the benefit-cost ratio. The results show that the RWC strategy is the most cost-effective for all locations and climate change severities. This is despite the strategy being the least effective in terms of reducing total losses, as seen in Figure 4 and discussed previously. The RWC strategy is the most cost-effective due to its relatively low implementation cost. On the other hand, the RDA strategy is the least cost-effective, despite reducing total losses more than the RWC strategy. This is because of its relatively high implementation cost. Therefore, the benefit gained (reduced total expected loss) from an adaptation strategy and its cost-effectiveness are different and can vary significantly. Cost-effectiveness and benefits depend on various factors, such as wind hazard intensity, building type composition, and assumed adaptation costs. For regions with predicted high-intensity winds and substantial future losses, such as Miami-Dade, hurricane straps (RWC) are considered a cost-effective yet significantly effective adaptation strategy.
Selecting appropriate adaptation strategies is not necessarily a straightforward procedure, as the needs and wants of the decision maker may not align with the strategy that offers the highest loss reduction or highest cost-effectiveness (benefit-cost ratio). Furthermore, limited funding and budget allocations for adaptive action planning make the cost-effectiveness of an adaptation measure critical. For instance, consider a county that raised $200 million from resilience bonds (Dhanjal, 2020) and decided to invest it in adaptation strategies for buildings. In Miami-Dade, under RCP 8.5, the most cost-effective adaptation action would be the RWC + Shutt strategy, with a benefit-cost ratio of about 250. With the $200 million budget, retrofitting will be possible for approximately 80% of the eligible buildings, leading to an estimated $55.4 billion in averted losses over an 80-year period in the region. A similar result can be achieved with the Shutt strategy alone. On the other hand, the least cost-effective strategy is the RDA strategy, with a benefit-cost ratio of about 51, and only about 40% of the buildings will receive the adaptation strategy. For the same allocated budget of $200 million, implementing RDA + Shutt for 28% of the most vulnerable buildings in Miami-Dade County would lead to a $29.9 billion loss reduction compared to the unmitigated estimated regional loss under the RCP 8.5 climate scenario. The same budget in Mobile will yield lower benefit-cost ratios and a lower percentage of implementation. As Harris County has many more buildings than Mobile and Miami-Dade, the same RWC + Shutt strategy that is the most cost-effective in Miami-Dade can only be implemented on about 10% of the buildings in Harris with the same budget, resulting in a benefit-cost ratio of about 135. For the moderate and low emission scenarios, the same budget will result in lower benefit-cost ratios for all locations.
Figure 5 also demonstrates that the cost-effectiveness (benefit-cost ratio) of the strategies increases as the severity of climate change increases. For example, in Miami-Dade, the benefit-cost ratio for 100% implementation of the RDA + RWC + Shutt strategy is 58, 91, and 141 under RCP 2.6, 4.5, and 8.5, respectively. A similar trend is observed for the other locations. Moreover, the benefit-cost ratio varies depending on the location, with Miami-Dade having the highest ratio, followed by Mobile and Harris. For instance, the cost-benefit ratio for 100% implementation of the RDA + RWC + Shutt strategy is 141 in Miami-Dade, compared to 60 and 46 in Mobile and Harris, respectively. This trend aligns with the hurricane wind hazards in each location, with Miami-Dade having the highest hazard level, followed by Mobile and Harris.
6 Conclusion
This study investigates the efficiency and cost-benefit of different adaptation strategies for wooden-frame residential buildings subjected to changing hurricane wind hazards due to climate change. The regional loss of residential buildings in three different coastal communities located in the Southeast U.S., which are expected to have non-uniform exposure to hurricane wind hazards in the future, is computed. Furthermore, the effect of adaptive measures on the structural performance over their lifecycle by the end of the century under different climate scenarios is investigated. Based on the estimated benefits and adaptation costs by the end of the century, the results demonstrate how adaptation strategies can be planned and implemented, considering reduction in losses, benefit-cost ratio, and budget limitations.
The following can be concluded based on the analyses presented in the study:
1. Time-dependent analysis of changes in wind speeds at 10-year intervals shows that the increase in wind speeds is neither linear nor uniform over time. A similar trend is observed for the annual losses over time. While Harris and Mobile Counties are expected to show a higher increase in losses in the second half of the 21st century, Miami-Dade County is projected to experience a higher rate of loss increase in the first half of the 21st century. Hence, investigations of future hurricane wind hazards, regional losses, and other implications under the impact of climate change should carefully consider the temporal nature of expected changes.
2. The estimated regional losses under future climate conditions are predicted to increase significantly, especially for a high emission scenario. Such a significant increase in regional losses due to hurricanes emphasizes the importance of disaster preparedness studies and actions by local and federal governments to improve the resiliency of coastal communities through adaptive measures such as building retrofitting. While Miami-Dade is expected to experience the most intense wind speeds in the future, the regional loss increase ratio by the end of the century (year 2100) for Harris, TX, and Miami-Dade, FL, is comparable under an RCP 8.5 scenario. This result could be attributed to the variation in the current building types in each region and the fact that the ‘as-is’ building inventory of Miami-Dade is more robust and resilient against wind hazards compared to Harris County.
3. While some of the studied retrofitting strategies (a combination of roof deck attachment re-nailing and fortification of openings, for example) lead to a significant mitigated regional loss or benefit, the cost-effectiveness of such strategies, due to their expensive implementation costs, is considerably lower than other studied strategies such as adding hurricane straps or fortification of openings. Hence, it is recommended that decision-makers consider both the gained benefit (mitigated loss) and the cost-effectiveness (ratio of benefit to adaptation cost) of each strategy to make informed decisions based on the community’s needs, wind hazard probability, building composition, and specific goals.
It should be noted that in this study, some assumptions and simplification were made as the purpose of this paper was to provide a comparison of the current and future estimated losses due to potential climate variation and study the efficiency of different retrofitting strategies in terms of benefit gained and cost of implementation. The general procedure described in this study can be applied to study the future hurricane risks and retrofitting benefits in other regions considering different assumptions such as repair cost, building numbers and composition, building type fragilities (fragility can change over time), different building types (multi-family, mobile homes, etc.), and year of construction using more detailed data sets. Furthermore, only the impact of hurricane winds on the structural damage was considered in this study, i.e., impacts from storm surge, rain and flooding or content damage were not included in the loss calculations. Consideration of the loss and damage incurred by these hazards will result in higher loss prediction.
Another limitation of the study is the omission of changes in building inventory and population within the regions. The building type composition in each region is assumed unchanged in the future. Based on this assumption, even if the total number of buildings changes in the future, the estimated loss ratio will remain the same. However, there is no evidence that the building type composition will remain unchanged. A major factor that would impact building inventory and hurricane losses is population growth. The increase in losses from hurricanes over the years is partly due to increasing urbanization and population growth, which has led to increased exposure and vulnerability of infrastructure and communities. Non-stationarity of building inventory and population changes should be incorporated in future research on hurricane loss estimation considering climate change. Additionally, indirect losses (content loss) can be considered in the analysis. Such losses are typically caused by rain ingress and flooding. Hence, indirect loss models that are directly related to the levels of rainfall and storm surge can be employed if available.
Data availability statement
The raw data supporting the conclusions of this article will be made available by the authors, without undue reservation.
Author contributions
BS: Conceptualization, Formal Analysis, Investigation, Methodology, Visualization, Writing–original draft. AS: Conceptualization, Funding acquisition, Supervision, Writing–review and editing.
Funding
The author(s) declare that no financial support was received for the research, authorship, and/or publication of this article.
Acknowledgments
BS is grateful to the American Society of Civil Engineers (ASCE) for the O.H. Ammann research fellowship that provided financial support for this research. The content is solely the responsibility of the authors and does not necessarily represent the official views of the American Society of Civil Engineers.
Conflict of interest
The authors declare that the research was conducted in the absence of any commercial or financial relationships that could be construed as a potential conflict of interest.
Publisher’s note
All claims expressed in this article are solely those of the authors and do not necessarily represent those of their affiliated organizations, or those of the publisher, the editors and the reviewers. Any product that may be evaluated in this article, or claim that may be made by its manufacturer, is not guaranteed or endorsed by the publisher.
References
Abdelhady, A. U., Spence, S. M., and McCormick, J. (2022). Risk and fragility assessment of residential wooden buildings subject to hurricane winds. Struct. Saf. 94, 102137. doi:10.1016/j.strusafe.2021.102137
Allan, R. P., Hawkins, E., Bellouin, N., and Collins, B. (2021). IPCC, 2021: summary for Policymakers.
Amini, M. O., and van de Lindt, J. W. (2014). Quantitative insight into rational tornado design wind speeds for residential wood-frame structures using fragility approach. J. Struct. Eng. 140 (7), 04014033. doi:10.1061/(asce)st.1943-541x.0000914
Angeles, K., and Kijewski-Correa, T. (2022). Advancing building data models for the automation of high-fidelity regional loss estimations using open data. Automation Constr. 140, 104382. doi:10.1016/j.autcon.2022.104382
Angeles, K., and Kijewski-Correa, T. (2023). Advancing parcel-level hurricane regional loss assessments using open data and the regional resilience determination tool. Int. J. Disaster Risk Reduct. 95, 103818. doi:10.1016/j.ijdrr.2023.103818
ASCE (2017). Minimum design loads and associated criteria for buildings and other structures. American Society of Civil Engineers.
ASCE (2022). ASCE/SEI 7-22 minimum design loads and associated criteria for buildings and other structures. ASCE Reston Virginia: American Society of Civil Engineers.
Bjarnadottir, S., Li, Y., and Stewart, M. G. (2011). A probabilistic-based framework for impact and adaptation assessment of climate change on hurricane damage risks and costs. Struct. Saf. 33 (3), 173–185. doi:10.1016/j.strusafe.2011.02.003
Bjarnadottir, S., Li, Y., and Stewart, M. G. (2014). Regional loss estimation due to hurricane wind and hurricane-induced surge considering climate variability. Struct. Infrastructure Eng. 10 (11), 1369–1384. doi:10.1080/15732479.2013.816973
Bjarnadottir, S., Li, Y., and Stewart, M. G. (2019). “Climate adaptation for housing in hurricane regions,” in Climate adaptation engineering (Elsevier), 271–299.
Contento, A., Xu, H., and Gardoni, P. (2019). “Risk analysis for hurricanes accounting for the effects of climate change,” in Climate adaptation engineering (Elsevier), 39–72.
Dhanjal, M. (2020). Why climate resilience bonds can make a significant contribution to financing climate change adaptation initiatives. Available from: https://www.preventionweb.net/news/why-climate-resilience-bonds-can-make-significant-contribution-financing-climate-change (Accessed, 2023).
Dong, Y., and Frangopol, D. M. (2017). Adaptation optimization of residential buildings under hurricane threat considering climate change in a lifecycle context. J. Perform. Constr. Facil. 31 (6), 04017099. doi:10.1061/(asce)cf.1943-5509.0001088
Ellingwood, B. R., Rosowsky, D. V., Li, Y., and Kim, J. H. (2004). Fragility assessment of light-frame wood construction subjected to wind and earthquake hazards. J. Struct. Eng. 130 (12), 1921–1930. doi:10.1061/(asce)0733-9445(2004)130:12(1921)
Emanuel, K., Ravela, S., Vivant, E., and Risi, C. (2006). A statistical deterministic approach to hurricane risk assessment. Bull. Am. Meteorological Soc. 87 (3), 299–314. doi:10.1175/bams-87-3-299
Fema, (2012). Multi-hazard loss estimation methodology hurricane model technical manual. Washington, DC: Department of Homeland Security, Federal Emergency Management Agency, Mitigation Divison.
Fema, H. (2022). Federal emergency management agency. Available from: https://www.fema.gov/flood-maps/products-tools/hazus.
Gurley, K., Pinelli, J., Subramanian, C., Cope, A., Zhang, L., and Murphree, J. (2005). “Florida public hurricane loss projection model engineering team,” in Final report, international hurricane research center (Miami: Florida International University).
Hallegatte, S. (2007). The use of synthetic hurricane tracks in risk analysis and climate change damage assessment. J. Appl. meteorology Climatol. 46 (11), 1956–1966. doi:10.1175/2007jamc1532.1
Held, I., Guo, H., Adcroft, A., Dunne, J., Horowitz, L., Krasting, J., et al. (2019). Structure and performance of GFDL's CM4. 0 climate model. J. Adv. Model. Earth Syst. 11 (11), 3691–3727. doi:10.1029/2019ms001829
IPCC (2013). in Climate change 2013: the physical science basis. Contribution of working group I to the fifth assessment report of the intergovernmental Panel on climate change. Editors T. F. Stocker, D. Qin, G.-K. Plattner, M. Tignor, S. K. Allen, J. Boschunget al. (Cambridge, United Kingdom and New York, NY, USA: Cambridge University Press), 1535.
Kijewski-Correa, T., Cetiner, B., Zhong, K., Wang, C., Zsarnoczay, A., Guo, Y., et al. (2023). Validation of an augmented parcel approach for hurricane regional loss assessments. Nat. Hazards Rev. 24 (3), 04023022. doi:10.1061/nhrefo.nheng-1649
Klepac, S., Subgranon, A., and Olabarrieta, M. (2022). A case study and parametric analysis of predicting hurricane-induced building damage using data-driven machine learning approach. Front. Built Environ. 8, 1015804. doi:10.3389/fbuil.2022.1015804
Knutson, T. R., McBride, J. L., Chan, J., Emanuel, K., Holland, G., Landsea, C., et al. (2010). Tropical cyclones and climate change. Nat. Geosci. 3 (3), 157–163. doi:10.1038/ngeo779
Lee, J. Y., and Ellingwood, B. R. (2017). A decision model for intergenerational life-cycle risk assessment of civil infrastructure exposed to hurricanes under climate change. Reliab. Eng. Syst. Saf. 159, 100–107. doi:10.1016/j.ress.2016.10.022
Lee, K. H., and Rosowsky, D. V. (2007). Synthetic hurricane wind speed records: development of a database for hazard analyses and risk studies. Nat. Hazards Rev. 8 (2), 23–34. doi:10.1061/(asce)1527-6988(2007)8:2(23)
Li, Y., Ahuja, A., and Padgett, J. E. (2012). Review of methods to assess, design for, and mitigate multiple hazards. J. Perform. Constr. Facil. 26 (1), 104–117. doi:10.1061/(asce)cf.1943-5509.0000279
Li, Y., and Ellingwood, B. R. (2006). Hurricane damage to residential construction in the US: importance of uncertainty modeling in risk assessment. Eng. Struct. 28 (7), 1009–1018. doi:10.1016/j.engstruct.2005.11.005
Li, Y., and Ellingwood, B. R. (2009). Framework for multihazard risk assessment and mitigation for wood-frame residential construction. J. Struct. Eng. 135 (2), 159–168. doi:10.1061/(asce)0733-9445(2009)135:2(159)
Liel, A. B., and Deierlein, G. G. (2013). Cost-benefit evaluation of seismic risk mitigation alternatives for older concrete frame buildings. Earthq. Spectra 29 (4), 1391–1411. doi:10.1193/030911eqs040m
Lin, N., Marsooli, R., and Colle, B. A. (2019). Storm surge return levels induced by mid-to-late-twenty-first-century extratropical cyclones in the Northeastern United States. Clim. change 154 (1), 143–158. doi:10.1007/s10584-019-02431-8
Liu, F. (2014). Projections of future US design wind speeds due to climate change for estimating hurricane losses.
Masoomi, H., Ameri, M. R., and van de Lindt, J. W. (2018). Wind performance enhancement strategies for residential wood-frame buildings. J. Perform. Constr. Facil. 32 (3), 04018024. doi:10.1061/(asce)cf.1943-5509.0001172
Mudd, L., Wang, Y., Letchford, C., and Rosowsky, D. (2014). Assessing climate change impact on the US East Coast hurricane hazard: temperature, frequency, and track. Nat. Hazards Rev. 15 (3), 04014001. doi:10.1061/(asce)nh.1527-6996.0000128
Orcesi, A., Bastidas-Arteaga, E., Markogiannaki, O., Li, Y., Schoefs, F., Ballester, J., et al. (2021). “Investigating the effects of climate change on structural resistance and actions,” in IABSE congress, ghent 2021, structural engineering for future societal needs: 22.02.2021 - 24.02.2021, ghent, Belgium (Zürich: International Association for Bridge and Structural Engineering (IABSE)).
Orooji, F., Friedland, C. J., Savio, R. D., Taghinezhad, A., Massarra, C. C., Bushra, N., et al. (2022). Generalized cost-effectiveness of residential wind mitigation strategies for wood-frame, single family house in the USA. Front. Built Environ. 7. doi:10.3389/fbuil.2021.745914
Pant, S., and Cha, E. J. (2018). Effect of climate change on hurricane damage and loss for residential buildings in Miami-Dade County. J. Struct. Eng. 144 (6), 04018057. doi:10.1061/(asce)st.1943-541x.0002038
Pant, S., and Cha, E. J. (2019a). Wind and rainfall loss assessment for residential buildings under climate-dependent hurricane scenarios. Struct. Infrastructure Eng. 15 (6), 771–782. doi:10.1080/15732479.2019.1572199
Pant, S., and Cha, E. J. (2019b). Potential changes in hurricane risk profile across the United States coastal regions under climate change scenarios. Struct. Saf. 80, 56–65. doi:10.1016/j.strusafe.2019.05.003
Pei, B., Pang, W., Testik, F. Y., Ravichandran, N., and Liu, F. (2018). Selection of hazard-consistent hurricane scenarios for regional combined hurricane wind and flood loss estimation. Nat. Hazards 91 (2), 671–696. doi:10.1007/s11069-017-3149-z
Pielke, R. A., Gratz, J., Landsea, C. W., Collins, D., Saunders, M. A., and Musulin, R. (2008). Normalized hurricane damage in the United States: 1900–2005. Nat. Hazards Rev. 9 (1), 29–42. doi:10.1061/(asce)1527-6988(2008)9:1(29)
Pinelli, J.-P., Simiu, E., Gurley, K., Subramanian, C., Zhang, L., Cope, A., et al. (2004). Hurricane damage prediction model for residential structures. J. Struct. Eng. 130 (11), 1685–1691. doi:10.1061/(asce)0733-9445(2004)130:11(1685)
Pita, G., Pinelli, J.-P., Cocke, S., Gurley, K., Mitrani-Reiser, J., Weekes, J., et al. (2012). Assessment of hurricane-induced internal damage to low-rise buildings in the Florida Public Hurricane Loss Model. J. wind Eng. industrial aerodynamics 104, 76–87. doi:10.1016/j.jweia.2012.03.023
Portner, H.-O., Roberts, D. C., Masson-Delmotte, V., Zhai, P., Poloczanska, E., Mintenbeck, K., et al. (2019). (eds.)]. In: IPCC special report on the ocean and cryosphere in a changing climate [H.-O. Portner, D. C. Roberts, V. Masson-Delmotte, P. Zhai, M. Tignor, E. Poloczanskaet al. (eds.)]. IPCC, Technical Summary. Available at: http://www.ipcc.ch/site/assets/uploads/sites/3/2019/11/04_SROCC_TS_FINAL.pdf.(Accessed, July 2020)
Powell, M., Soukup, G., Cocke, S., Gulati, S., Morisseau-Leroy, N., Hamid, S., et al. (2005). State of Florida hurricane loss projection model: atmospheric science component. J. wind Eng. industrial aerodynamics 93 (8), 651–674. doi:10.1016/j.jweia.2005.05.008
Qin, H., and Stewart, M. G. (2020). Risk-based cost-benefit analysis of climate adaptation measures for Australian contemporary houses under extreme winds. J. Infrastructure Preserv. Resil. 1 (1), 3. doi:10.1186/s43065-020-00002-1
Rayner, N., Parker, D. E., Horton, E., Folland, C. K., Alexander, L. V., Rowell, D., et al. (2003). Global analyses of sea surface temperature, sea ice, and night marine air temperature since the late nineteenth century. J. Geophys. Res. Atmos. 108 (D14). doi:10.1029/2002jd002670
Salarieh, B., Ugwu, I. A., and Salman, A. M. (2023). Impact of changes in sea surface temperature due to climate change on hurricane wind and storm surge hazards across US Atlantic and Gulf coast regions. SN Appl. Sci. 5 (8), 205. doi:10.1007/s42452-023-05423-7
Snaiki, R., Wu, T., Whittaker, A. S., and Atkinson, J. F. (2020). Hurricane wind and storm surge effects on coastal bridges under a changing climate. Transp. Res. Rec. 2674 (6), 23–32. doi:10.1177/0361198120917671
Stewart, M. G., and Deng, X. (2015). Climate impact risks and climate adaptation engineering for built infrastructure. ASCE-ASME J. Risk Uncertain. Eng. Syst. Part A Civ. Eng. 1 (1), 04014001. doi:10.1061/ajrua6.0000809
Unnikrishnan, V. U., and Barbato, M. (2016). Performance-based comparison of different storm mitigation techniques for residential buildings. J. Struct. Eng. 142 (6), 04016011. doi:10.1061/(asce)st.1943-541x.0001469
Unnikrishnan, V. U., and Barbato, M. (2017). Multihazard interaction effects on the performance of low-rise wood-frame housing in hurricane-prone regions. J. Struct. Eng. 143 (8), 04017076. doi:10.1061/(asce)st.1943-541x.0001797
Vickery, P., Skerlj, P., and Twisdale, L. (2000). Simulation of hurricane risk in the US using empirical track model. J. Struct. Eng. 126 (10), 1222–1237. doi:10.1061/(asce)0733-9445(2000)126:10(1222)
Vickery, P. J., Lin, J., Skerlj, P. F., Twisdale, L. A., and Huang, K. (2006a). HAZUS-MH hurricane model methodology. I: hurricane hazard, terrain, and wind load modeling. Nat. Hazards Rev. 7 (2), 82–93. doi:10.1061/(asce)1527-6988(2006)7:2(82)
Vickery, P. J., Skerlj, P. F., Lin, J., Twisdale, L. A., Young, M. A., and Lavelle, F. M. (2006b). HAZUS-MH hurricane model methodology. II: damage and loss estimation. Nat. Hazards Rev. 7 (2), 94–103. doi:10.1061/(asce)1527-6988(2006)7:2(94)
Vickery, P. J., and Twisdale, L. A. (1995). Prediction of hurricane wind speeds in the United States. J. Struct. Eng. 121 (11), 1691–1699. doi:10.1061/(asce)0733-9445(1995)121:11(1691)
Vickery, P. J., Wadhera, D., Galsworthy, J., Peterka, J. A., Irwin, P. A., and Griffis, L. A. (2010). Ultimate wind load design gust wind speeds in the United States for use in ASCE-7. J. Struct. Eng. 136 (5), 613–625. doi:10.1061/(asce)st.1943-541x.0000145
Walsh, K. J., McBride, J. L., Klotzbach, P. J., Balachandran, S., Camargo, S. J., Holland, G., et al. (2016). Tropical cyclones and climate change. Wiley Interdiscip. Rev. Clim. Change 7 (1), 65–89. doi:10.1002/wcc.371
Keywords: hurricane, climate change, adaptation, wood-frame structures, wind, lifecycle loss
Citation: Salarieh B and Salman AM (2024) Regional climate change adaptation planning: a case study on single-story wooden-frame residential buildings vulnerable to hurricane winds in selected US coastal locations. Front. Built Environ. 10:1273311. doi: 10.3389/fbuil.2024.1273311
Received: 05 August 2023; Accepted: 08 February 2024;
Published: 22 February 2024.
Edited by:
Chengcheng Tao, Purdue University, United StatesReviewed by:
Tracy Lynn Kijewski-Correa, University of Notre Dame, United StatesCao Wang, University of Wollongong, Australia
Copyright © 2024 Salarieh and Salman. This is an open-access article distributed under the terms of the Creative Commons Attribution License (CC BY). The use, distribution or reproduction in other forums is permitted, provided the original author(s) and the copyright owner(s) are credited and that the original publication in this journal is cited, in accordance with accepted academic practice. No use, distribution or reproduction is permitted which does not comply with these terms.
*Correspondence: Abdullahi M. Salman, YW1zMDA5OEB1YWguZWR1