Comprehensive evaluation of the aggressive certain degree of the chemical components in water to concrete
 Thy Truc Doan
- Department of Technology and Engineering, Kien Giang University, Vinh Hoa Hiep, Kien Giang, Vietnam
Evaluation and research on the aggressive degree to concrete were done in the previous research. However, the evaluation of aggressive certain degree in water to the concrete was experimented comprehensively in the laboratory by the Viet Nam Standard “TCVN 3994:1985” and ISO 14911:1998. In addition, this paper considers water with the chemical name “Chlorite-Bicarbonate-Sodium-Magnesium” by the Kurlov formula and “TCVN 81:1981”. Especially, comprehensive consideration of chemical analysis that includes Cation (Ca2+; Mg2+; ∑(Fe2+; Fe3+; Na+; K+; and NH4+); Anion (Cl−; SO42−; HCO3−; CO32− and OH−); and the other special items analysis which includes Permanent and Temporary hardness; Alkalinity; CO2 free; CO2 corrosive; Total mineralization; pH value; Nitrite (NO2−); and Nitrate (NO3−). The research results presented “water with chemical characteristics can’t create the aggression in concrete,“ which shows pH concentration is 5 and CO2 corrosion is 20 mg/l (approximately 0.04%); whereas ion Mg2+ is 1.5 g/l (approximately 3%) and SO42− is 0,25 g/l (approximately 0.5%). The total salt content in the presence of an evaporating surface obtains 12,5 g/l (approximately 25%). So research results can be used safely for the design or construction of the reinforcement concrete structures in My Thai Canal Bridge, Rach Gia town, Kien Giang province, Viet Nam, and Construction or Geotechnical as good reference documents in the future.
1 Introduction
In recent years, the evaluation and research of the aggressive degree of concrete has been the subject of research. Carbonate and chloride attraction are two causes of corrosion in reinforced concrete but depend on geographic location relative to global weather patterns. Estimated global corrosion costs a staggering $2.5 trillion (2013)—approximately 3.4% of the global GDP. These costs include corrosion incurred in the infrastructure and transport sectors which contribute approximately 38% of the total corrosion costs. Chloride diffusivity is dependent on a cement’s type and the supplementary materials employed in concrete.
This research used experimental measurement in the laboratory combined with an ion chromatography machine to evaluate the aggressive degree on concrete structures located underwater. It is necessary to determine the main chemical components in water, necessitating the measurement of ions, cations, salts, permanent hardness, temporary hardness, and mineralized total because these chemical components in water affect and create chemical reactions with the chemical on the surface of concrete structures and so corrode the structure. A comprehensive evaluation is required of the chemical components (cations, anions, minerals, hardness, alkalinity, and corrosiveness); however, previous research has been incomplete and has not fully evaluated chemical components for permanent hardness, temporary hardness, and total mineralization. The comprehensive evaluation of this study thus improves previous research.
Moreover, the findings of this research were derived using an ion chromatography machine and the “Ion Dionex 3000” measurement system (high-performance liquid chromatography—HPLC) to obtain the best reliable results. A spectrophotometer (S-921/Digital Visible) machine was used with a wavelength of up to 510 nm. Moreover, this study determined total salt content (carbonate and chloride) in the presence of an evaporating surface obtains 12.5 g/L (approximately 25%). Combined with the determination of total hardness, permanent hardness, temporary hardness, alkalinity, nitrite (NO2−), nitrate (NO3−), bicarbonate ion content (HCO3−), and Cl− contained in water when the structures are submerged, these results were full and clear compared to previous research.
However, chemical analysis methods for carbonate do not present the exact percentage of the aggressive degree (Aggarwal and Aggarwal, 2020). Evaluation by Fourier transform infrared spectroscopy analysis and the Weibull distribution have been used to determine the level of corrosion at 95% confidence level (i.e., analysis of corrosion potential values for a particular sample at 95% survival probability). Nevertheless, the research results have not considered Mg2+ and SO42− (Chakraborty et al., 2021).
Research using the copper material sensors to measure pH concentration, and the carbonation process of the sample during the experiment. A pH sensor used with an iridium oxide (IrOx) working electrode and manganese and powder compaction exhibited a dense and homogeneous microstructure, so this has great potential for determining the aggressive degree of concrete. However, the percentage of corrosive degree and pH concentration still is not expressed exactly (Du et al., 2022). Moreover, test results for the effect of acidic water on aggregate–bitumen adhesion have been shown to be pH = 2 after six bitumen-covered aggregate particles in acidic water. Chemical analysis with small bubbles occurs at the edges and corners, but their size decreased and did not appear over time. Research results therefore do not evaluate other mineralized totals or permanent hardness (Feng et al., 2020). On the other hand, using a PHEN sensor as a pre-rust detector to observe corrosion levels in a boiler system is very useful. The material is used to manufacture sensors by mesoporous silica nanospheres and covers the surface with 1, 10-phenanthroline (PHEN). This helps identify the fastest corrosion. However, there is no evaluation of total iron, free and corrosive CO2, and iron Fe3+ to obtain comprehensive results (Hassan et al., 2020).
Moreover, a fluid–solid chemical coupling model can evenly consider the aggressive degree of iron. The aggressive thickness and development of the pore structure of concrete affects the penetration of different chloride concentrations. Results show that the size of the crack curve decreases gradually and then increases strongly in the first stage of corrosion. The diffusion coefficient of chloride ions can be up to 1.3 times greater than at the initial time. However, previous research has lacked other evaluations of chemical analysis, including pH concentration, Mg2+, alkalinity, and SO42− (Hu et al., 2022). On the contrary, fresh concrete coupons are manufactured with the sewer pipe standard. When contact is made with air, the corrosive condition in this sewer system is H2S at 1100 ± 100 ppm. This corrosive process is observed continuously can be pH surface concentration measurement and microbial community. Results show that the pH concentration of concrete decreases from 10.5 ± 0.3 to 3.1 ± 0.5 within 20 days and, with fast corrosive speed, up to 3.5 ± 0.3 mm per year. The ion chromatography (Dionex ICS-2000) machine can the determine sulfur elements at four independent locations. However, it still described full corrosive characteristics in concrete by the other compounds such as NH+4, Cl−, HCO3-, and permanent hardness (Li et al., 2019).
On the other hand, “amphiphilic” mortar maintained hydrophobicity even under acidic and alkaline conditions, and the cumulative water absorption and connected porosity of amphiphilic mortar were reduced by 66.4% and 70.6%, respectively. However, the chemical analysis method is not clear and lacks much other special analysis, including alkalinity, hardness, and total mineralization (Li et al., 2022). Additionally, the effect of Na+ and Ca2+ cations on the chemical activity of NO2–/NO3– corrosion inhibitors on carbon steel rebar was studied in 0.6 M Cl−simulated concrete pore solution. The results of this modeling were supported by an experimental electrochemical thermodynamics study through potentiodynamic polarization and electrochemical impedance spectroscopy at 25, 35, 45, and 55 C. In conclusion, Ca2+ ions decrease the chemical activity and activity coefficients of NO2–/NO3–, which hinders the efficiency of their mobility and inhibition. However, the chemical characteristics of water are not determined by the Kurlov formulas (Mohamed et al., 2022).
An experimental method “ex situ leaching processes method” (ESL) and including cold water and hot water extraction (CWE and HWE). The concentration of pH solution is obtained using many different technologies including pH is measured with electrodes, reverse method, and thermodynamic model defending alkalinity concentration. Results obtained from alkalify concentration are more reliable than fresh concrete pH concentration, which is approximately 13.1 and increases gradually up to 13.8. However, research results -do not show total hardness or other concentrations, including mineralized total, CO32−-, SO42-, and CO2−-free concentrations (Natkunarajah et al., 2022). Additionally, research using temperature measurement, X-ray diffraction, and scanning electron microscopy has determined that concrete corrosion occurs during hydration and the carbonate process. Ettringite formation, calcium hydroxide, and the diffusion of sulfate occur gradually from the exterior to the interior. However, this research does not clearly show other ion analysis, including HCO3−, total iron Fe3+, Fe2+, and pH concentration (Peng et al., 2022).
In contrast, results show steel aggression and cracks into concrete and outside from the θ = ±90° location by the 3D model. K coefficient erosion increases as time and speed gradually decrease (Xu and Song, 2022). Finally, research results on the affection of SO2 are the same as a polluted gas on concrete and reinforcement samples at the different relation humidity ratio (RH) that is mixed by ideal mixing water (IMW) and IMW +80 mg NH4+ (NH4Cl). The potential values of the same specimens exposed to SO2 shift to the active region for 90% and 100% RH rates. However, residue content and alkalinity have not been evaluated (Yilmaza et al., 2002).
From the above analyses, it is apparent that previous research has only concentrated on the measurement of cations, anions, alkalinity, salts, and CO2 corrosion. However, a full evaluation of total hardness, permanent hardness, temporary hardness, and mineralized total has not been made. It is thus necessary to comprehensively investigate the chemical components to derive reliable results for future research.
Moreover, the chemical components contained in water in which concrete structures long submerged need careful measurement to minimize damage and save construction costs, including of total salt content (carbonate and chloride) in the presence of an evaporating surface. Research is also not clear about the bicarbonate ion content (HCO3−) and carbonate (CO32−) combined with the determination of total hardness, permanent hardness, temporary hardness, alkalinity, cation, anion, total mineralization, nitrite (NO2−), nitrate (NO3−), and Cl− contained in water where the structures are submerged. An evaluation of these comprehensive research results will benefit research in civil and geological engineering.
2 Materials and machines
2.1 Water
Water was used for this research from My Thai River, Rach Gia Town, Kien Giang Province, Viet Nam. Water adhered to the Viet Nam standards and the Kurlov formula, including the survey process, sample protection, and experiments.
A polyethylene bottle containing the water had a 31-mm L volume. The bottle was submerged at a 50-cm-depth from the bottle top where the water flowed fastest. We ensured that the bottle was full of water and contained no residue. The room temperature used in the experiments was 28 C.
The blue litmus papers (measure the pH) are used and dipped in water, then compared with the accompanying color chart. If the pH index is from 1 to 7: an acidic environment. From 7 to 14: basic environment. If the litmus paper shows the number 7: neutral environment (see Figure 1).
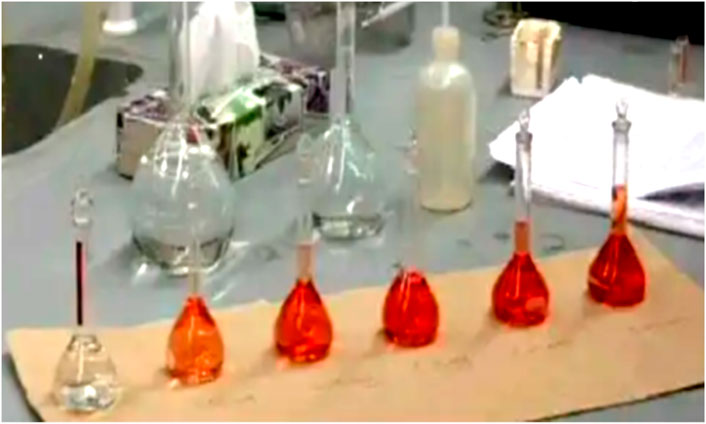
Figure 1. Samples changed colors (TCVN 6660:2000).
2.2 Standards
The research used Viet Nam standards TCXD 81: 1981, TCVN 3994:1985, TCVN 6660:2000, ISO 14911:1998, and the Kurlov formula. We adhered to all standards to measure chemical components (cation, anion, and other special chemical item analysis) in water. The research used the Kurlov formula to determine the water’s chlorite–bicarbonate–sodium–magnesium. Research results showed chemical characteristics in the water that did not erode to the concrete of the My Thai Canal Bridge, Viet Nam.
2.3 Instruments
The research used an ion chromatography instrument and an Ion Dionex 3000 measurement system (high-performance liquid chromatography—HPLC). It has the ability to analyze a variety of sample matrices and a wide analyte concentration range (from trace - ppb, ppm - to macro) with high accuracy and high selectivity. Ion chromatography also uses few solvents and toxic chemicals that can negatively affect the environment. We conducted analysis of ions in water, wastewater, and soil (e.g., Na, Ca, K, Mg, Ni, Cd, Pb, Fe, F−, Cl−, SO42−, SO32−, and PO43−), trace analysis in ultrapure water (ppb) (e.g., F−, Cl−, SO42−, SO32−, and PO43−),analysis of traces of oxyhalide compounds in clean and drinking water (ppb) (e.g. BrO3−, ClO3−, and ClO2−), analysis of compounds such as monophosphate, polyphosphate (dipolyphosphate, tripolyphosphate, and metaphosphate), histamine, choline, chlorate, bromate, and borate, and of organic acids such as citric, lactic, propionic, oxalic, butyric, and formic acids.
The spectrophotometer instrument (S-921/Digital Visible) has a wavelength up to 510 nm. Spectrophotometers are used to determine concentration and are often used to determine the concentration of substances in solution. By measuring the absorbance of a solution at a specific wavelength, the concentration of the analyte can be quantified using standard curves or the Beer–Lambert law. On the other hand, this machine can measure and detect impurities, elucidate the structure of organic compounds, monitor dissolved oxygen and protein characteristics, analyze respiratory gases, determine molecular weight, identify compounds, nucleic acid quantification, and biological material, and analyze color. This machine supported determination of total cations, ions, minerals, and other elements.
3 Methodology and results
3.1 Cation and anion analysis
3.1.1 Cation
Cation content was determined carefully using the standard TCVN 6660:2000, with the results shown in Eq. 1; Table 1; Figure 5.
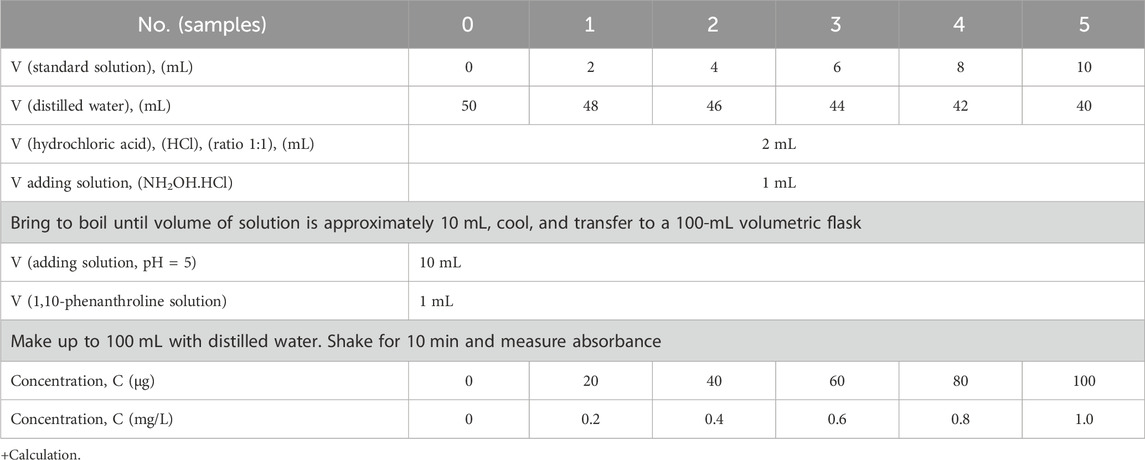
Table 1. Preparation of a series of iron standard solutions with best contents (TCVN 6660:2000).
3.1.1.1
First, using a 25 mm calcium solution was poured into a 250-mL conical bottle and this solution mixed with 100 mL of distilled water. Second, we added the sodium hydroxide 10% with pH = 10 (test by litmus). Then, 0.02 G murexide was added and dollied continuously to reach komplexon III solution (0.05 M solution) until the solution changed from red to purple. Calcium ion content (
where V1 is the volume of komplexon III solution used to indicate titration in milliliters (mL); T is titration of komplexon III solution in gram/mL with calcium ion (Ca2+); and V is water volume in mL. Results show in Eq. 1; Figure 5.
3.1.1.2
Distilled 25 mL of water was used for calcium and magnesium contents with 800 mg/L. Next, we poured this solution into the 250-mL conical bottle. This solution was mixed with 100 mL distilled water, and sodium hydroxide 10% with pH = 10 (test by litmus) was added. We continuously dolled 0.02 g Eriochrome Black T to reach komplexon III solution (0.05 M solution) until the solution changed from red to blue.
Magnesium ion content (Mg 2+), mg/L was calculated by the Eq. 2 below:
where V1 is the volume of komplexon III solution used to indicate the titration total of calcium and magnesium in mL; V2 is the volume of komplexon III solution only using
3.1.1.3
+ Material (chemistry)
We used chemical hydrochloric acid (HCl) ratio 1:1 and hydroxylammonium clorua 10% solution by dissolving 10 G NH2OH.HCl in 100 mL of distilled water. pH = 5 solution was achieved by dissolving 175 g Natri acetate CH3COONa in 150 mL distilled water and 450 mL concentrated acid acetic (CH3COOH) in distilled water to make up the solution of 1,000 mL. We continuously shook the mixture well, then added phenanthroline 0.1% solution (dissolve 0.1 g 1,10-phenanthroline monohydrate (C12H8N2.H2O)) to 80 mL distilled water, dolled it, and heated to 800 C. It did not boil, and we then used the distilled water to make a stable 100 mL. We next added 500 ppm iron storage solution (dissolve 1.7594 g Fe(NH4)2(SO4)2.6H2O in the distilled water and then slowly add 5 mL H2SO4 concentrated and mix evenly). The solution was protected at 28°C. We then poured 500 ppm iron storage solution into the bottle to make up to 10.00 mL, and added the distilled water up to the mark (1 mL = 10.00 mg Fe).
+ Devices and instruments
The glass bottle was cleaned with HCl concentrated solution to completely remove iron that was still attached to the wall before use. Also required were a 100-mL glass Erlenmeyer bottle, 50 mL glass tube, 100 mL volumetric flask (glass bottle), a spectrophotometer (S-921/Digital Visible), and an electric stove.
+ Implementation Process
Samples were acidified with pH < 2 before analysis, using 50 mL samples poured into Erlenmeyer bottle (samples must be mixed evenly). If the sample volume of iron contents was higher than 1 mg, it was diluted to 50 mL. We then added 2 mm HCl (ratio 1:1) and 1 mL NH2OH.HCl. After adding a few pills to the Erlenmeyer, it was necessary to boil it in 15 mL volumes. They were continuously kept at 28 °C and the solution was poured into a 100 mL volumetric flask. Next, we added 10 mm pH = 5 solution and 1 mL 1,10-phenanthroline solution.
The distilled water was then added up to marly and dolled evenly to maintain stability for 10 min to obtain the best colors and maximum stability. Finally, absorbance was measured on a spectrophotometer (S-921/Digital Visible) with a wavelength of 510 nm.
+ Calibration curves
Using solution with mL = 10 mg Fe concentration, we prepared a series of iron standard solutions according to Table 1 and Figure 2.
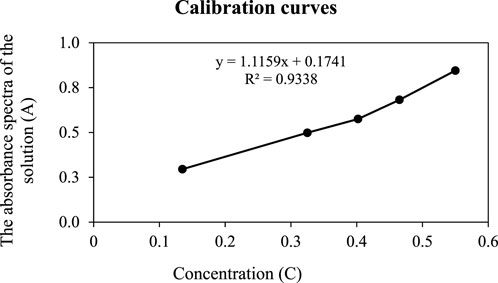
Figure 2. Calibration curves (replace with new curves) (TCVN 6660:2000).
Measurement of a series of absorbances of the samples resulted in the diagram A = f(C), which uses the method of least squares to reach the equation y = ax + b. From the value of absorbance samples solution by spectrophotometer (A), concentration value (C) can be inferred. Results are shown in mg/L in Table 1 and Figure 2.
The experimental method for investigating the effect of epoxy for protecting reinforced concrete from chemical erosion was achieved by adding nanoparticles of Fe2O3 into a carbonaceous matrix. The results show more than 3% of mixed mass with coatings, which remarkably supports concrete surface erosion and limited aging process and solubility (Dorado et al., 2023).
3.1.1.4 Na+, K+
+ Determination condition of Cation Na+ và K+
The determination of cation Na+ và K+ with method condition is 0.1 up to 10 mg/L and 10 μL circle sample. All of these cations were detected by measuring conductivity (washing solution should have a small enough conductivity). The temperature of the bottle in the “detector” needs to be stabile within ±0.1°C. Cation concentrations are determined in “calibration curves.” The resolution (R) of the column is determined by the non-low peak R = 1.3.
+ Sample and material (Use hydrochloric/DAP acid eluent)
We dissolved 5.2 mL solution of hydrochloric acid (c(HCl) = 7.7 mol/L) and 0,562 g ± 0,006 g of Diaminopropionic monohydroclorua (DAP) acid (C3H8N2O2⋅HCl) into the 100 mL volumetric flask (glass bottle) with degassed water. The solution contained 0.04 mol/L hydrochloric acid and 0.004 mol/L DAP. Solution was protected at 4 °C – 6 °C and replaced every 7 days. Samples were kept in sealed containers and filtered (pore size 0.45 μm), with correct pH up to 3 ± 0.5 by nitric acid (c(HNO3) = 1 mol/L) to avoid precipitation, sample contamination, or cation metabolism by microbial growth. Immediate analysis was necessary after 24-h sample protection to obtain the best results.
+ Devices and instruments
We used the ion chromatography system Ion Dionex 3000 (high-performance liquid chromatography—HPLC; see Figures 3, 4) by quality requirements (separation column must ensure separation conditions and not obstruct the cations; concentration of Na+ is 1 mg/L; K+ is 2 mg/L). A polyethylene container was used to store the washing solution. We also used a pump, sample injection system with sample loop (10 μL), separation column with separation efficiency, front column, conductivity detector (uncompressed), recording device, and a polyethylene column containing non-polar phase for pretreatment of samples. We observed from the samples and solution which had high standard concentration that the resolution (R) of the column was determined by the non-low peak R = 1.3 . Results show in Eq. 3 and Figure 4, and any part of peak “pic”:
where R2,1 is the resolution par of peak “pic” 2.1; tR1 is the storage time of peak “pic” 1 in seconds (s); tR2 is the storage time of peak “pic” 2 in seconds (s);
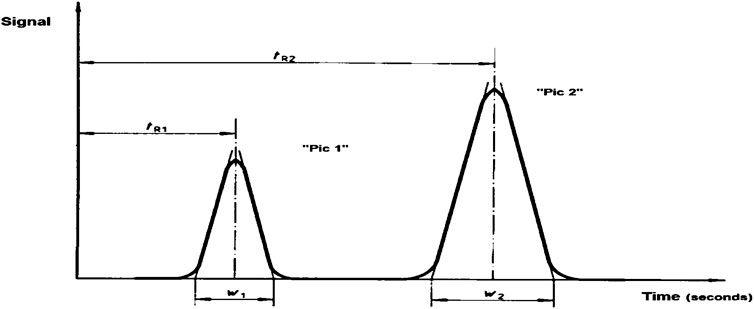
Figure 3. Operation diagram of ion chromatography system (TCVN 6660:2000).
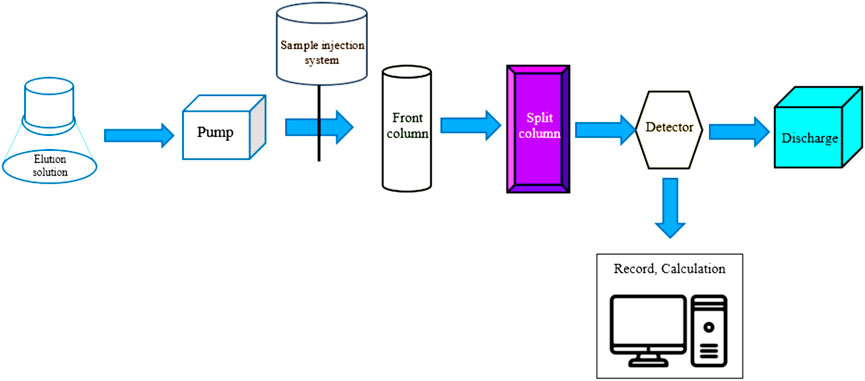
Figure 4. Parameters for calculating the resolution of peak “Pic” R (TCVN 6660:2000).
+ Implementation process
We used the ion chromatography instrument Ion Dionex 3000 for calibration, normalized by first-order normalization function. The first-order standard formula to determine the ions is
where
We measured the samples and white solution by filling a 100 mL flask with water and adding 0.1 mL of nitric acid solution (c(HNO3) = 1 mol/L. After setting up the standard function, we injected the prepared sample into the chromatograph and measured the peak “pic.” (Note: if the ion concentrations in the sample to be analyzed exceed the calibration range, dilute the sample and then analyze). Next, it was necessary to exactly check the standard function and measure the two solutions with the lowest and highest locations in the working areas. A series of samples were measured at any time every 20 measurements. Calculation of the calibration solution concentration was analyzed by the first-order function.
Concentration (
where all of the units in the above formula are the same as for Eq. 2. The final results are shown in Eqs 3, 4; Table 1 and Figure 5.
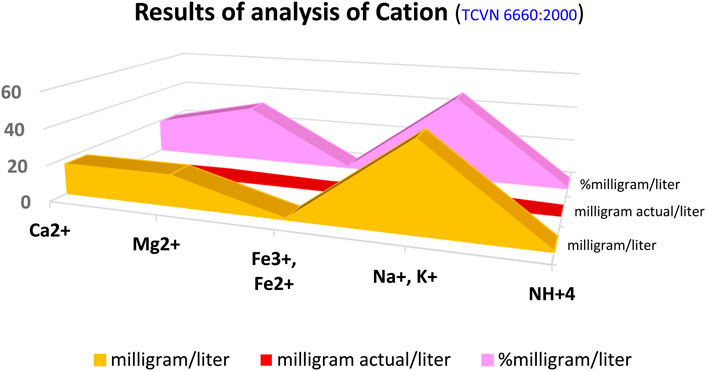
Figure 5. Results of cation analysis (TCVN 6660:2000).
3.1.1.5
We added two drops of Komplexon III solution to 50 mL water and then mixed well. Next, 1 mL of Nessler reagent was added and mixed. After 10 min, we measured the color intensity of the solution using a photoelectric colorimeter. We consistently used a purple filter (diameter O = 400: 425 mm), cuvette dày 1–5 cm (note, after 30 min of showing colors, colors must not change).
Content ion ammonia (
where C is ion ammonia concentration, as read on the standard diagram, in mg/L; V is water volume in mL; the volume of diluent water is 50 mL.
The results of analysis of cation (TCVN 6660:2000) showed 82.33 milli/liter, and 4.366 mg actual/liter and 100% milligram/liter of total ions. The relationship of the conversion unit calculating cations, such as Ca2+, Mg2+, Fe3+, Fe2+, Na+, K+, an NH4+, showing these values were converted, including percentage of mg/L, actual mg/L, and mg/L (see Figure 5; Eqs 1–6).
3.1.2 Anion
3.1.2.1 Cl−
We poured 100 mL water into a 250-mL conical glass bottle and then added potassium chromate (Kali chromate) 1 mL solution with 5% content. Next, we added agentum nitrate 0.05 N solution to ensure calibration and observed the mixture until it precipitated and became orange-red. This was done twice to obtain the average value.
Ion chloride (Cl−) content, mg/L is calculated by Eq. 7:
where V1 is the volume of agentum nitrate 0.05 N solution used as a measurement of the calibration in mg/L; N is the equivalent concentration of agentum nitrate solution; 0.03546 is the value of the equivalent concentration of chloride milligram; V is the volume of water in mL. The results show in Eq. 7; Figure 6.
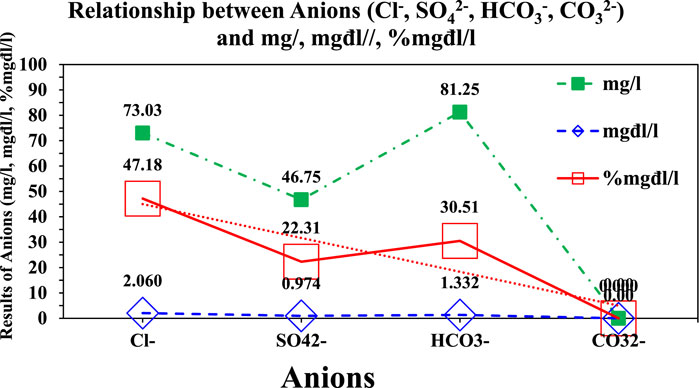
Figure 6. Results of anion analysis (TCVN 6660:2000).
However, an experiment was conducted to determine the erosion of seaside concrete structures by the Cl− and carbonate processes. The research used 5% NaCl and Cl-free particles which showed two factors to evaluate concrete erosion. The microstructure of concrete particles was analyzed by SEM (scanning electron microscope) and XRD (X-ray diffraction). The results clearly showed that nanoconcrete decreases the carbonate process in the same cycle. The contents of nano-SiO2 and nano-ZnO are 2%, and 1% are lower than 19.3% and 17.6% compared with normal concrete. The glue of C-S-H made the internal structure of concrete thickness, so adding nano-SiO2 and nano-ZnO prevents the erosion process of Cl− and carbonation, thus increasing sea concrete safety (Maohua et al., 2023).
Research on the erosion speed of steel into concrete used nano-Ag/AgCl to measure ion Cl concentration on the reinforcement concrete surface and open-circuit voltage of the primary battery and calomel, while the theory of chloride diffusion and open-circuit voltage is used to investigate the erosion process. The results show maximum erosion speed after 15 h and that the cavity of reinforced concrete was proportional to chloride ion in the environment (Yixiao et al., 2023).
3.1.2.2
We poured 50 mL solution
After that, we washed it with hot distilled water until the chloride ion in the washing water was gone (note: wash water does not precipitate when agentum nitrate is added). The filters containing bari sulfate with determined mass were put in a cup and then dried at 105°C, burned and heated at 800°C for up to 40 min, then the temperature was stabilized in a desiccator and it was weighed until constant weight.
Ion sulfate (
where G is the mass of precipitation of bari sulfate in g; 0.4115 is the factor converting the mass of barium sulfate to SO−1; V is the volume of water in mL. The results show in Eq. 8 and Figure 6.
However, a combination of the three methods evaluating sulfate and carbonation affection in concrete showed mass changes, characteristics, and clear forms. On the other hand, the microstructure of characteristics and forms of concrete erosion were clearly revealed by SEM (ESEM-EDS), máy infrared spectrum Fourier (FTIR), and XRD. The results showed the surface characteristics deformed clearly with carbonation time and sulfate affection. Moreover, the relative intensity and mass gradually increased with carbonation time (Chen et al., 2023).
3.1.2.3
Ion bicarbonate content (HCO3−) and carbonate (CO32−) were determined to determine total and free alkalinity (Table 2).
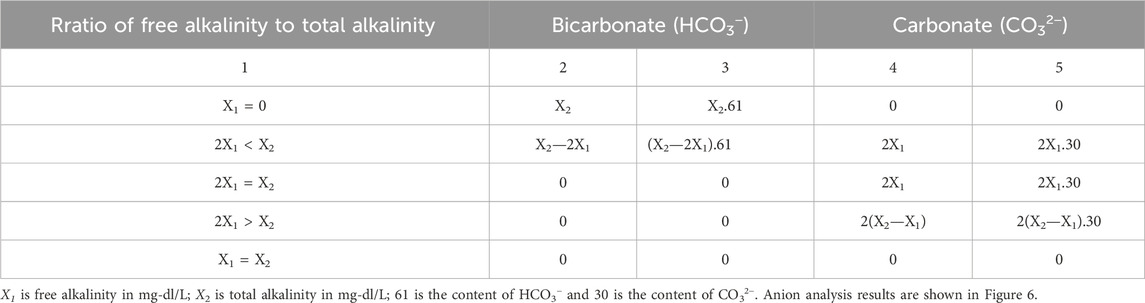
Table 2. Content of bicarbonate and carbonate ions (TCVN 6660:2000).
We experimentally measured the affection the freeze–thaw (F–T) cycles and compound-salt attack for deformed characteristics and microstructures of hybrid fiber reinforced concrete (HFRC). The results showed that the F–T cycles and compound-salt of polypropylene hybrid fiber affected forms and limited mass, relative elastic modulus (RDEM), mechanical reliability, and compressive–flexural strength. On the other hand, pore volume was bigger than 1,2HFRC after F–T salt cycles (Dongtao et al., 2023).
The experimental method used corn-straw fiber (CSF) to add concrete components to prevent erosion by chloride ion attack. A rapid chloride permeability test (RCPT) and rapid chloride movement (RCM) were designed to evaluate the change of ion resistance of reinforcement concrete. Water-absorbed speed (WAR) and mercury penetration porosity (MIP) were used to support information on microstructures. The results show that adding Na2SiO3 of CSF increased strength by 15.7%, 17.8% và 33.4%, whereas absorbed water of CSF and the alkaline environment by Na2SiO3 supply good conditions for the hydration process and decrease of chloride ion movement. Cellulose contained in CSF with the hydroxyl and carboxyl group help improve the chloride ion resistance of concrete by low weak electrical conductivity and ion exchange binding force (Zhipeng et al., 2023).
The results of anion analysis (TCVN 6660:2000) show 201.03 mg/L but 4.366 mg/L and 100% mg/L of the total of ion. Comparison of the conversion units calculating anions, such as Cl−, SO42−, HCO3−, and CO32−, and showed that the conversion of these values included a percentage of milligram per liter, milligram actual per liter, and milligram per liter.
However, the analytical methods of atomic absorption spectrometry, SEM-EDS, nano-indentation, polarization, and macroscopic mechanical testing were used to investigate erosion by chloride. The results’ flexible durability decreased remarkably up to 47%. The elastic modulus and the nano-stiffness are eroded differently approximately 30–189 GPa and 0.16–6.41 GP (Zhaoping et al., 2023).
3.2 Special items of analysis and the Kurlov formula
3.2.1 Special items of analysis
3.2.1.1 CO2 free
We poured 100-mL water into the titration flask and then add 0.5 g potassium sodium tartrate comminute. Next, 0.2 mL phenolphthalein solution was added, mixed evenly, and titrated with sodium hydroxide 0.1 N. This solution was then continuously observed until it was a sustainable pink color (note: to avoid lost carbonate, it was necessary to pour water into the bottle and then close the stopper immediately after filling was complete). This was done twice for this experiment. The water volume at the first and second times was similar. We then added the same amount of sodium hydroxide 0.1 N twice. After adding sodium tartrate 0.2 mL, phenolphthalein sodium, and titration by sodium hydroxide 0.1 N until a sustainable pink color, the results were recorded for two titrations.
Free carbon dioxide (CO2) (mg/L) is used in the formula below:
where Vt is the volume of sodium hydroxide 0.1 N used for titration mL; N is the concentration of sodium hydroxide solution; 0.044 is the concentration of CO2 in mg; and V is water volume in mL. The results show in Eq. 9 and Figure 9.
However, the experimental research used approximately 2–4% nano-silica to investigate the hydrate capability, strength, durability, and microstructure of concrete. The results show an increase in the percentage of nano-silica which made changes in the physical and mechanical properties, and microstructure density and a decrease of the erosion process (Fadi et al., 2023). On the other hand, the influence of alkaline silicate reaction (ASR), hydration, and fly ash mixed with nanoconcrete material created compressive and flexible strength, clearly limiting erosion (Yanjin et al., 2023).
3.2.1.2 CO2 corrosive
We poured 100 mL of water saturated with calcium carbonate into a 250-mL beaker. We then added three drops of methyl orange-red and titrated with hydrochloric acid (HCl) 0.1 N until the solution changed from yellow to orange-red color.
CO2 corrosive content (mg/L) uses the Eq. 10 below:
where V is the volume of hydrochloric acid (HCl); 0.1 N used for the titration of the saturation sample calcium carbonate in mL; V1 is the volume of hydrochloric acid (HCl); 0.1 N used for the titration of total alkalinity in mL; N is the concentration of (HCl) 0.1 N; 0.022 is mg of CO2; V is the volume of water in mL. The results show in Eqs 10–14 and Figure 9.
Experimentation was used to determine the affection degree of temperature, water evaporation, and airspeed to CO2-absorbed process by consideration of Na2CO3 and K2CO3. The results showed that K-based absorbent is rather than Na-based absorbent which obtained at 50°C temperature with 90 mbar H2O. And it is only keeping 2% of the total volume in tight areas (Itzel et al., 2021). Comparison with CO2 absorbed volume in 2023 obtained 170,726 CO2-eq per day (Rafael et al., 2019).
3.2.1.3 Total mineralization
- Drying residue content is at 105 C
We poured 200 mL water into a porcelain cup and then gradually evaporated it at 105 C for drying. We next weighed it under constant weight on the electric stove until completely dry. The porcelain cup contained dry residue within 2 h at 105 C, and then the temperature stabilized in the desiccator and was quickly weighed to constant weight.
Dry residue content t 105°C (mg/L) used the formula below:
where G is the dry residue at 105°C in grams and V is the volume of water in mL.
- “Insoluble” residues content dried at 105°C
Use 200 ml water which is a water test filter by filter paper, dried at 105°C temperature, and then weighted to constant weight. Filter paper contains dried residue after 2 h at 105°C temperature. Next, measure the temperature in the desiccator and quickly weighted it to a constant weight.
“Insoluble” residue content (mg/L) dried at 105°C used the formulas below:
where G is insoluble residues content dried at 105 C in grams and V is the volume of water in mL.
- “Insoluble” residue content burned at 600 C.
The filter paper contained insoluble residue at 105 C (insoluble residues are determined in Eq. 9). This was poured into a porcelain cup, the weight determined, and then was burned at 600 C for 1 h. Finally, the temperature in the desiccator and quickly weighed to a constant weight.
Insoluble residue content (mg/L) burned at 600 C temperature is determined by the formula below:
where G is “insoluble residue content dried at 105 C and the amount of remaining residue after heating at 600 C in grams, and V is the volume of water in mL.
3.2.1.4 pH value
We used a mixed color indicator to measure pH. Each color indicator had a narrow range of 1–2 pH. When using the mixed color indicator, the pH range converted color more widely. The methyl orange was measured (0.2% bromothymol blue solution with 0.1%). Next, part of the solution volume of methyl red was mixed with two parts of the solution volume of bromothymol blue. The mixed color indicator had a range of 4–8 pH. We used sodium hydrogen phosphate solution (0.2 M), nitric acid (0.1 M), and calci phosphate solution with a pH range of 3.0–8.0 (Figure 7). Cr ions and carbonation in reinforced concrete were used to determine the alkalinity and microstructure materials. The results showed that the carbonation process increased gradually with pH = 11, compared with no carbonation with pH = 12.6. X-R diffusion and Mott–Schottky show Cr and Fe oxides/hydroxides independent of the alkaline environment of reinforcement concrete. Conversely, Cr oxides will weaken the passive capability of reinforcement. Thus, erosion process would occur quickly (Gongnian et al., 2023).
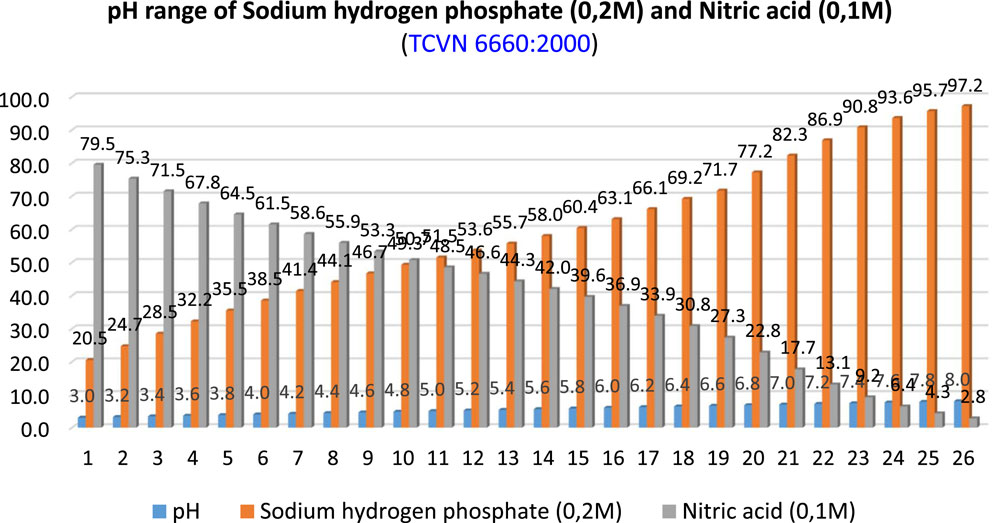
Figure 7. pH range of sodium hydrogen phosphate (0.2 M) and nitric acid (0.1 M) (TCVN 6660:2000).
3.2.1.5 Nitrite (NO2−)
Use 50 ml water pour into an Erlenmeyer flask. Next, we added 1 mL sulfanilic acid solution and mixed evenly. It was stabilized for 5 min and then 1 mL 1-naphthylamine sodium was mixed in. It was continuously stabilized with 40 min. The sample solution intensity was measured by the spectrophotometer (S-921/Digital Visible). A green filter was then used (O = 520 mm, cuvettes 1–5 cm thick).
Ion nitrite content (NO2−), mg/L unit is determined by the formula below:
where C is the concentration of nitrite read on the titration diagram in mg/L; V is the volume of water in mL; 50 is the volume of water dilution in mL. The results show in Eq. 14 and Figure 9.
3.2.1.6 Nitrate (NO3−)
We added 1 mL solution of salicylate sodium to 10 mL water and evaporated it in a porcelain water bowl on a water bath until dry. After cooling, we added 1 L of sulfuric acid. The cup was stirred with a glass rod along its sides and bottom until the residue was completely dissolved, and stability maintained for 10 min. We then poured distilled water into the cup and mixed evenly. It was then poured into a 50-mL Erlenmeyer flask. The cup was washed many times and this water poured into the flask. Next, we added 7 mL sodium hydroxide 10 N solution and evenly mixed the distilled water up to mark level.
Ten minutes after adding sodium hydroxide 10 N solution, the solution color did not change because use color intensity is measured by the spectrophotometer (S-921/Digital Visible) machine; it uses a purple filter (O = 410 mm) cuvette 5 cm thick.
Ion nitrate content (NO3−) (mg/L) was determined by the formula below:
where C is the nitrate concentration read on the chart in mg/L; V is volume of water in mL; 50 is the volume of the color-determination water in mL. The results of the special item analysis with total hardness and alkalinity are shown in Figure 8.
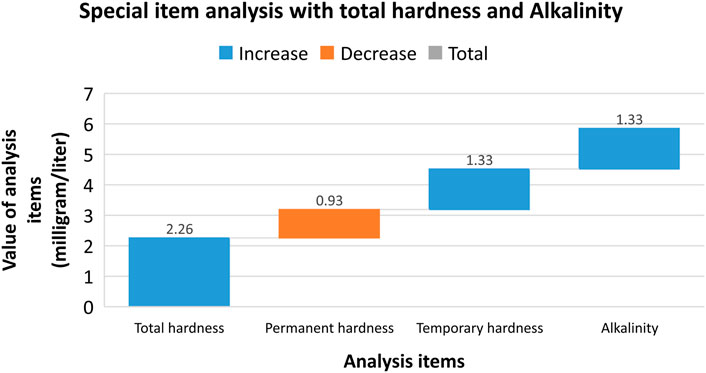
Figure 8. Special item analysis with total hardness and alkalinity (TCXD 6660:2000).
3.2.1.7 Permanent hardness (or total hardness)
We reduced the alkalinity of 100 mL water with hydrochloric acid 0.1 N; the amount of acid consumed as total alkalinity titration. Next, 5 mL solution of 0.2 g Eriochrome Black T and komplexon III solution titration was added until the color turned from red to blue.
Permanent hardness (with the regulation of German degree guidance) is determined by the formula below:
where V1 is the volume of komplexon III solution used for titration in mL; T is titration of komplexon III solutions with calcium oxide (CaO) in g/mL; V is the volume of water in mL. The results show in Eqs 15, 16 and Figure 9.
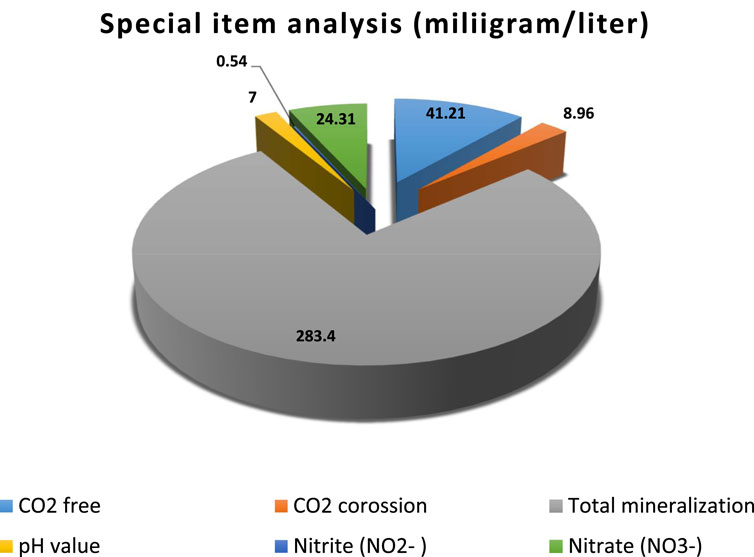
Figure 9. Special item analysis with total hardness and CO2 free and corrosion, total mineralization, pH value, nitrite (NO2−), and nitrate (NO3−) (TCVN 3994:85).
3.2.1.8 Temporary hardness
We poured 100 mL water into a 250-mL Erlenmeyer flask bottle. Next, we added rock or gravel particles and then boiled until one-third of initial volume remained. The precipitate of calcium carbonate and magnesium carbonate was washed several times with boiled and cooled distilled water to make 100 mL of filtered water. Three drops of methyl orange color were added to the water to obtain titration by hydrochloric acid 0.1 N until the color changed from yellow to orange-red.
Carbonate hardness with German degree regulation (10 of German = 10 mg/L of calcium oxide (CaO) was determined by the formula below:
where V1 is the volume of hydrochloric acid solution used for titration with total alkalinity in mL; V2 is the volume of hydrochloric acid solution used for titration with carbonate and bicarbonate alkalinity in mL; N is the concentration of hydrochloric acid; 0.02804 is mg of calcium oxide (CaO); and V is the volume of water in mL. The results show in Eqs 16, 17 and Figure 8.
3.2.1.9 Alkalinity
Because the water had pH < 8.3, it was not necessary to determine free alkalinity, but it was useful to calculate total alkalinity. We poured 100 mL water into a 250-mL Erlenmeyer flask bottle then added three drops solution of methyl orange color and titration hydrochloric acid 0.1 N. We observed the mixture until it changed from yellow to orange.
Total alkalinity X2 (milligram/liter, mgdl/L) is determined by the Eqs 18, 19 and Figure 8:
where V2 is the volume of hydrochloric acid solution 0.1 N used for titration with orange indicator color in mL; N is the concentration of hydrochloric acid; and V is the volume of water in mL.
Results of the special item analysis are shown in Figure 9.
3.2.2 Kurlov formula for aggressive certain degree
The Kurlov formula was used to determine the characteristics and classification of water. In this research, the water is called chloride–bicarbonate–sodium–magnesium. This water is determined by Viet Nam standard TCVN 3994:85 in the condition of liquid environment according to the degree of aggressiveness with no effect on concrete. For this standard, the three levels for evaluating the degree of aggressiveness are in Table 3.
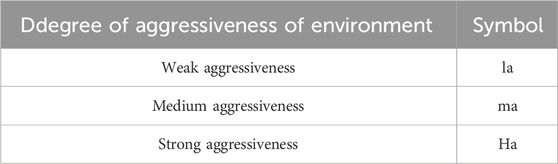
Table 3. Classification of the degree of aggressiveness (TCVN 3994:85).
The best condition for evaluating the aggression degree to concrete needs to consider factors such as the following.
The aggressive degree of the environment was determined at a liquid temperature of 20 C. Almost all structures are subjected to the action of an aggressive environment when there is a column of hydrostatic pressure from one side of 8 m. Structures under the soil have a permeability coefficient of 0.1 m per day. Because the liquid has no organic materials, the aggressive degree in the environment may be negligible. This research result shows the aggressive degree in an environment with ion SO42- content for concrete manufactured from Portland cement with a content of 300 kg/m3 and impermeability as water pressure 0.4 MPa (4.0 kg/cm3).
In addition, the thickness of concrete is up to 150 mm in 24 h. From the above analysis, the results show that water with chemical characteristics cannot create aggression in concrete which shows pH concentration of 5 and CO2 corrosion of 20 mg/L where Mg2+ is 1.5 g/L and SO42- is 0.25 g/L. Moreover, the total salt content in the presence of evaporating surface obtains 12.5 g/L in Eq. 19; Figure 10.
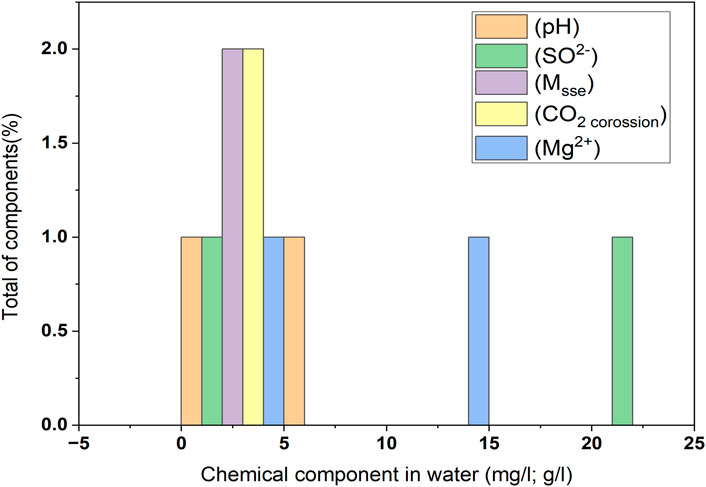
Figure 10. Degree of aggressiveness to concrete (TCVN 3994:85).
4 Discussion
The chemical characteristics and components in water considering cation and anion was carefully evaluated by each specific process using Viet Nam Standard TCVN 3994: 85 to obtain best results. To defend on this standard, a chemical component contains a concentration pH from 4 to 5, which is medium–Ma and with pH < 4 concentration is strong–Ha. Moreover, water with the chemical name chlorite–bicarbonate–sodium–magnesium is determined by the Kurlov formula as having a pH < 4 concentration, which will strongly affect concrete structures. Therefore, it is safe to design or construct any reinforced concrete structure for the My Thai Bridge in Viet Nam. The research results support decreasing spending on costs for everything from design, construction, management, labor, time, and so on.
On the other hand, when considering CO2corrosion content >40 mg/L and the total salt content in the presence of evaporating surface >22.5 g/L, results are Medium-Ma. In addition, with content pH < 4, CO2corrosion, and the total salt content in the presence of evaporating surface up to 54.5 g/L, the concrete structure will not be eroded. The research shows the increase of sulfate components in soil which originated from Precambrian concretions and in combination with dissolved carbonation inorganic concentration affect the structures under seawater levels during the geological process (Sean et al., 2023).
Moreover, this research considered that components ion Mg2+ and SO42+ obtained >2 g/L and value was from 0.5 to 1.0 g/L, which demonstrated water with the medium–Ma erosion characteristics, whereas a pH < 4 concentration, ion Mg2+ cannot be precisely determined and a combination of ion SO42+ is >1.0 g/L. However, a CaCO3/MgO coating protects AZ41 Mg alloy through rapid electrochemical sedimentation to protect the concrete formwork and Portland cement from chloride. The results show that the coating became thicker than that without a connection between the CaCO3 and MgO coating (Ye et al., 2023). On the other hand, an evaluation of salt-freeze damage of hydraulic concrete buildings in cold and saline soil areas. Some concrete samples with polypropylene fibers were collected with two conditions of thaw–freeze cycles and erosion process in cold temperature, whereas the combination of pore structure distribution into concrete was carefully investigated by nuclear magnetic resonance technology (NMR) and scanning electron microscopy (SEM); and salt frost capability of polypropylene concrete. The results show that the ratio of the lost mass of group A4 (1.2 kg/m3 polypropylene fiber) in freeze cycles is lower than 2.06% compared to group A1 (0 polypropylene fiber) (Li et al., 2023). Comparison with use of CaCO3 to prevent permeable capability and erosion speed of sand with wind speed from 5 m/s to 15 m/s (Yang et al., 2023).
On the contrary, consideration between acid rain and carbonation to concrete erosion was made in combination with internal and external factors of pore microstructure to discover decay by acid rain. The results showed that the microstructure of concrete decreased clearly and increased the comprehensive strength by carbonation at relative humidities of 45% to 65% (Jinjun et al., 2023).
On the other hand, some of the other research evaluating the chemical components in water is limited, so this can affect the potential risks of other chemicals. Therefore, chemicals that are not evaluated by research and considered will affect the corrosion process of reinforced concrete structures—for example, if the concentration of cations, anions, and salts are not considered, or if we only measure the total of minerals, pH, and ignore cations, anions, etc. Therefore, these evaluations do not fully demonstrate that the erosion of concrete structures will be affected. Therefore, a comprehensive assessment of all chemicals in water to limit the potential risks that affect the corrosion process of structures is necessary and must be evaluated carefully and fully. This is especially assuming that it is very essential to carefully consider that sulfuric acid (H2SO4) components will affect concrete structure erosion in the future because this chemical component strongly erodes concrete structures.
It can be concluded from the above analysis that the comprehensive evaluation of the chemical components from cation, anion, hardness, mineralized total, and so on presented clear and best comprehensive results about water chemical characteristics as a contact to concrete erosion, which other research has not fully presented.
5 Conclusion
Experimental evaluation has defended Vietnam standards, and an ion chromatography instrument has determined the chemical characteristics including cations, anions, water, permanent and temporary hardness, alkalinity, CO2 free, CO2 corrosive, total mineralization, pH value, nitrite (NO2−), and nitrate (NO3−). The comprehensive evaluation of this research limits the potential of the other chemical components that affect water erosion in concrete structures. It is thus necessary to fully evaluate the chemical components in water to present comprehensive results to minimize other damage to concrete structures. Moreover, these contributions supply more evaluative methods and instruments to support research in geology and civil engineering. It is essential to carefully consider sulfuric acid’s (H2SO4) effect on concrete structure erosion in the future because this chemical component strongly erodes concrete structures.
Data availability statement
The original contributions presented in the study are included in the article/supplementary material, further inquiries can be directed to the corresponding author.
Author contributions
TD: Formal analysis, data curation, and writing–review and editing.
Funding
The author(s) declare that no financial support was received for the research, authorship, and/or publication of this article.
Conflict of interest
The author declares that the research was conducted in the absence of any commercial or financial relationships that could be construed as a potential conflict of interest.
Publisher’s note
All claims expressed in this article are solely those of the authors and do not necessarily represent those of their affiliated organizations or those of the publisher, the editors, and the reviewers. Any product that may be evaluated in this article or claim that may be made by its manufacturer is not guaranteed or endorsed by the publisher.
References
Aggarwal, P., and Aggarwal, Y. (2020). Carbonation and corrosion of SCC. Kurukshetra, India: National Institute of Technology Kurukshetra. doi:10.1016/B978-0-12-817369-5.00007-6
Chakraborty, S., Mandal, R., Chakraborty, S., Guadagnini, M., and Pilakoutas, K. (2021). Chemical attack and corrosion resistance of concrete prepared with electrolyzed water. J. Mater. Res. Technol. 11, 1193–1205. doi:10.1016/j.jmrt.2021.01.101
Chen, Y., Liu, P., Yu, Z., Li, S., Hu, C., and Lu, D. (2023). Research on the performance evolution of concrete under the coupling effects of sulfate attack and carbonation. J. Mater. Res. Technol. 2 6, 4670–4695. doi:10.1016/j.jmrt.2023.08.206
Dongtao, X., Shiting, Y., Jiali, Y., Chenlu, F., Biao, L., Zhi, Z., et al. (2023). Damage characteristics of hybrid fiber reinforced concrete under the freeze-thaw cycles and compound-salt attack. J. Case Stud. Constr. Mater. 18, e01814. doi:10.1016/j.cscm.2022.e01814
Dorado, F., Toledo, L., Osade la, A. R., Esteban, A. A., Sacristan, J., Pellegrin, B., et al. (2023). Adhesion enhancement and protection of concrete against aggressive environment using graphite-Fe2O3 modified epoxy coating. J. Constr. Build. Mater. 379, 131–179. doi:10.1016/j.conbuildmat.2023.131179
Du, Z., Wang, P., Chen, Z., Cui, D., Jin, Z., and Zhang, H. (2022). All-solid-state, long-term stable, and embedded pH sensor for corrosion monitoring of concrete. J. Pre-proof 57, 104978–105045. doi:10.1016/j.jobe.2022.104978
Fadi, A., Osama, Z., Rebeca, M. G., Fahad, A., Mohd, A., and Mohamed, M. A. (2023). Impact of Nano-silica on the hydration, strength, durability, and microstructural properties of concrete: a state-of-the-art review. J. Case Stud. Constr. Mater. 18, e01997. doi:10.1016/j.cscm.2023.e01997
Feng, S., Wang, W., Tan, H., Xue, M., and Höeg, K. (2020). Case Stud. Constr. Mater. 13, 04–45. doi:10.1016/j.cscm.2020.e00445
Gongnian, Z., Qiuyue, W., Guowei, W., Weiling, L., Sijie, Z., Zhiyong, A., et al. (2023). Revealing excellent passivation performance of a novel Cr-alloyed steel rebar in carbonized concrete environment. J. Mater. Res. Technol. 23, 1848–1861. doi:10.1016/j.jmrt.2023.01.118
Hassan, M. A., Shahat, A., Hassan, M. E., Azzazy, , RedaAbd El-aal, M., El-Sayed, W. N., et al. (2020). A novel and potential chemical sensor for effective monitoring of Fe(II) ion in corrosion systems of water samples. Micro-chemical J. 154, 104578–578. doi:10.1016/j.microc.2019.104578
Hu, Y., Liu, G., Yang, Y., Cao, Y., Wang, J., and Ye, D. (2022). Afluid-solid-chemical coupled fractal model for simulating concrete damage and reinforcement corrosion. Chem. Eng. J. 442, 136045–045. doi:10.1016/j.cej.2022.136045
Itzel, Y., Lopez, P., Laura, I., Rodas, Z., Susana, F. T., Carlos, C. Z., et al. (2021). Phycocapture of CO2 as an option to reduce greenhouse gases in cities: carbon sinks in urban spaces. J. CO2 Util. 53, 101–704. doi:10.1016/j.jcou.2021.101704
Jinjun, G., Xiaomeng, L., Yaoqun, X., Peng, Z., and Kun, W. (2023). Neutralization evolution of concrete under acid rain and carbonation erosion: a review. J. Mater. Res. Technol. 25, 1376–1405. doi:10.1016/j.jmrt.2023.06.040
Li, G., Xingbo, Y., Yuting, L., Xuelei, G., and Qiangye, D. (2023). Multi-scale deterioration and microstructure of polypropylene fiber concrete by salt freezing. J. Case Stud. Constr. Mater. 18, e01762. doi:10.1016/j.cscm.2022.e01762
Li, X., O'Moore, L., Song, Y., Bond, P. L., Yuan, L., Wilkie, S., et al. (2019). The rapid chemically induced corrosion of concrete sewers at high H2S concentration. Water Res. 162, 95–104. doi:10.1016/j.watres.2019.06.062
Li, X., Wang, Q., Shi, Z., Lei, L., Mao, J., and Qu, L. (2022). Study of water repellency and corrosion of STA-PFOA modified mortar. Constr. Build. Mater. 322, 126363–363. doi:10.1016/j.conbuildmat.2022.126363
Maohua, Z., Lin, D., Zhiyi, L., and Ronghua, X. (2023). Durability of marine concrete doped with nanoparticles under the joint action of Cl- erosion, and carbonation. J. Case Stud. Constr. Mater. 18, 1–15. doi:10.1016/j.cscm.2023.e01982
Mohamed, A., ViscoJr, D. P., and Bastidas, D. M. (2022). Effect of cations on the activity coefficient of NO2-/NO3-–corrosion inhibitors in simulated concrete pore solution: an electrochemical thermodynamics study. Corros. Sci. 206, 110476–476. doi:10.1016/j.corsci.2022.110476
Natkunarajah, K., Masilamani, K., Maheswaran, S., Lothenbach, B., Amarasinghe, D. A. S., and Attygalle, D. (2022). Analysis of the trend of pH changes of concrete pore solution during the hydration by various analytical methods. Cem. Concr. Res. 156, 106780–780. doi:10.1016/j.cemconres.2022.106780
Peng, Y., Meng, X., Song, F., and Xu, G. (2022). Experimental study on the corrosion characteristics of concrete exposed to acid water containing aggressive carbon dioxide and sodium sulfate. Constr. Build. Mater. 321, 126397–397. doi:10.1016/j.conbuildmat.2022.126397
Rafael, R., Job., M. R., Eddy, A., Bramer, V., and Gerrit, B. (2019). Low-temperature water vapor pressure swing for the regeneration of adsorbents for CO2 enrichment in greenhouses via direct air capture. J. CO2 Util. 29, 65–73. doi:10.1016/j.jcou.2018.11.010
Sean, J. L., Patrick, M., Bo, L., Kevin, N., Frank, A., Corsetti, R. R., et al. (2023). Temporal evolution of shallow marine diagenetic environments: insights from carbonate concretions. J. Geochimica Cosmochimica Acta 351, 152–166. doi:10.1016/j.gca.2023.04.022
Xu, Y., and Song, Y. (2022). Chemical-mechanical transformation of the expansion effect for nonuniform steel corrosion and its application in predicting the concrete cover cracking time. Cem. Concr. Compos. 127, 104376–376. doi:10.1016/j.cemconcomp.2021.104376
Yang, L., Yufeng, G., Jia, H., Yundong, Z., and Weijuan, G. (2023). An experimental investigation of wind erosion resistance of desert sand cemented by soybean-urease induced carbonate precipitation. J. Geoderma 429, 116–231. doi:10.1016/j.geoderma.2022.116231
Yanjin, L., Xi, Z., and Hamid, R. M. (2023). Role carbon nanomaterials in the reinforcement of concrete and cement; A new perspective in civil engineering. J. Alexandria Eng. J. 72, 649–656. doi:10.1016/j.aej.2023.04.025
Ye, W., Wenxin, X., Kai, M., Chaoneng, D., Danqian, W., and Jingfeng, W. (2023). In-situ growth and anticorrosion mechanism of a bilayer CaCO3/MgO coating via rapid electrochemical deposition on AZ41 Mg alloy concrete formwork. J. Mater. Res. Technol. 25, 6628–6643. doi:10.1016/j.jmrt.2023.07.110
Yilmaza, A. B., Dehrib, I., and Erbilb, M. (2002). Effects of ammonium chloride salt added to mixing water on concrete and reinforced concrete subject to atmospheric corrosion. Cem. Concr. Res. 32, 91–95. PII: S0008-8846(01)00634- 2. doi:10.1016/s0008-8846(01)00634-2
Yixiao, W., Ang, Z., and Huijuan, W. (2023). Electrochemical investigation on the effect of chloride ion concentration on the corrosion of concrete reinforcement using in-situ nano-Ag/AgCl electrode. J. Alexandria Eng. J. 66, 451–456. doi:10.1016/j.aej.2022.11.008
Zhaoping, S., Shaohua, L., and Qingliang, Y. (2023). Chloride induced mechanical degradation of ultra-high performance fiber-reinforced concrete: insights from corrosion evolution paths. J. Constr. Build. Mater. 395, 132–329. doi:10.1016/j.conbuildmat.2023.132329
Zhipeng, J., Shihua, M., Yaming, Z., and Kaikang, L. (2023). Pre-treated corn straw fiber for fiber-reinforced concrete preparation with high resistance to chloride ions corrosion. J. Case Stud. Constr. Mater. 19, e02368. doi:10.1016/j.cscm.2023.e02368
Glossary
Keywords: cation, anion, special items, chlorite–bicarbonate–sodium–magnesium, corrosion, Kurlov formula
Citation: Doan TT (2024) Comprehensive evaluation of the aggressive certain degree of the chemical components in water to concrete. Front. Built Environ. 10:1275218. doi: 10.3389/fbuil.2024.1275218
Received: 09 August 2023; Accepted: 24 January 2024;
Published: 16 April 2024.
Edited by:
Xu Yang, Chang’an University, ChinaCopyright © 2024 Doan. This is an open-access article distributed under the terms of the Creative Commons Attribution License (CC BY). The use, distribution or reproduction in other forums is permitted, provided the original author(s) and the copyright owner(s) are credited and that the original publication in this journal is cited, in accordance with accepted academic practice. No use, distribution or reproduction is permitted which does not comply with these terms.
*Correspondence: Thy Truc Doan, dtthy@vnkgu.edu.vn, doantructhy@gmail.com