Efficient data-driven machine learning models for scour depth predictions at sloping sea defences
 M. A. Habib
 S. Abolfathi
 John. J. O’Sullivan
 M. Salauddin
- 1UCD School of Civil Engineering, UCD Dooge Centre for Water Resources Research and UCD Earth Institute, University College Dublin, Dublin, Ireland
- 2School of Engineering, University of Warwick, Coventry, United Kingdom
Seawalls are critical defence infrastructures in coastal zones that protect hinterland areas from storm surges, wave overtopping and soil erosion hazards. Scouring at the toe of sea defences, caused by wave-induced accretion and erosion of bed material imposes a significant threat to the structural integrity of coastal infrastructures. Accurate prediction of scour depths is essential for appropriate and efficient design and maintenance of coastal structures, which serve to mitigate risks of structural failure through toe scouring. However, limited guidance and predictive tools are available for estimating toe scouring at sloping structures. In recent years, Artificial Intelligence and Machine Learning (ML) algorithms have gained interest, and although they underpin robust predictive models for many coastal engineering applications, such models have yet to be applied to scour prediction. Here we develop and present ML-based models for predicting toe scour depths at sloping seawall. Four ML algorithms, namely, Random Forest (RF), Gradient Boosted Decision Trees (GBDT), Artificial Neural Networks (ANNs), and Support Vector Machine Regression (SVMR) are utilised. Comprehensive physical modelling measurement data is utilised to develop and validate the predictive models. A Novel framework for feature selection, feature importance, and hyperparameter tuning algorithms are adopted for pre- and post-processing steps of ML-based models. In-depth statistical analyses are proposed to evaluate the predictive performance of the proposed models. The results indicate a minimum of 80% prediction accuracy across all the algorithms tested in this study and overall, the SVMR produced the most accurate predictions with a Coefficient of Determination (r2) of 0.74 and a Mean Absolute Error (MAE) value of 0.17. The SVMR algorithm also offered most computationally efficient performance among the algorithms tested. The methodological framework proposed in this study can be applied to scouring datasets for rapid assessment of scour at coastal defence structures, facilitating model-informed decision-making.
1 Introduction
Scouring is the process of gradual erosion and removal of bed materials in the vicinity of coastal structures caused by hydrodynamic forces from waves and tidal currents. In addition to the hydrodynamic forces from tides and waves, which can be compounded by climate change influences, critical infrastructures including underwater pipelines, coastal defence structures, and coastal zone management processes such as dredging can contribute to conditions that are favourable to increased seabed scouring through the disruption of natural sediment transport processes and the alteration of the prevailing hydrodynamic environment in the nearshore region. Scouring at the toes of critical coastal defence structures (e.g., sloping and vertical seawalls) can result in the loss of structural integrity (Salauddin and Pearson, 2019a; Salauddin and Pearson, 2019b; Tseng et al., 2022) and ultimate failure, and is particularly critical in the management of coastal flood risks. Toe scouring can elevate wave overtopping discharge at defences, by increasing water depth at the defence and causing the formation of larger waves at the structure (Peng et al., 2023). The sedimentation and scouring in the vicinity of coastal structures can alter the bottom topography and bed slope, which in turn can influence wave shoaling and breaking processes and alters the turbulent kinetic energy budget of waves and their potential to overtop defences (Peng et al., 2023). Given that extreme events in coastal regions are predicted to increase in intensity and frequency under climate change scenarios, increased exposure to toe scouring at coastal defences is likely to be an increasing issue in the coming years (Fitri et al., 2019; Salauddin and O’Sullivan, 2022). The availability of accurate methods to predict toe scour depths is, therefore, critical for mitigating scour related risks.
Reliable prediction of scour depths at coastal defences challenging and is influenced by complex wave-structure interactions and a range of nearshore processes (hydrodynamic and morphological). The prediction of scour depth, therefore, involves the consideration of parameters that reflect the diverse processes. These relate to wave and current conditions, tide and wave approach angles, sediment and bathymetric characteristics and features, and water depth at the structure (Müller et al., 2008; Pourzangbar et al., 2017a). For example, the scouring patterns observed in fine and coarse grained bed material are distinctly different (Pourzangbar et al., 2017b). Previous studies also highlighted that scour depth from regular waves are generally larger than those observed for irregular waves.
A significant number of beaches globally are coarse-gained shingle beaches, often with man-made coastal defences such as vertical seawalls or sloping structures (Powell and Lowe 1994; Salauddin and Pearson, 2018; Salauddin and Pearson, 2020). Although the literature (e.g., Pourzangbar et al., 2017a; Pourzangbar et al., 2017b) has demonstrated the robust performance of ML algorithms in predicting scour depth at sandy beaches, the capabilities of ML techniques for predicting scour in shingle foreshores are much less reported. The recent study by Salauddin et al. (2023) focussed on evaluating the effectiveness of ML algorithms for predicting scour depths at vertical seawalls and showed that ML models were able to predict scour depths with good accuracy for experimental data. Nevertheless, there remains a scope of the application of such algorithms to other structure types such as a sloping structure on a permeable shingle bed and investigate the performance of such algorithms in predicting scour depths for the same.
Here we present for the first time the development and testing of ML algorithms (namely, Support Vector Machines Regression (SVMR), Gradient Boosted Decision Trees (GBDT), Random Forests (RF) and Artificial Neural Networks (ANN)) at a sloping structure with a sloping shingle foreshore. The models were trained and tested on a physical modelling experimental dataset of scour depths at a 1 in 2 (1 V:2H) impermeable sloping seawall located on a permeable 1 in 20 (1 V:20H) shingle foreshore. Advanced novel pre-processing and post-processing techniques such as feature selection and feature importance are proposed to facilitate ML-based modelling for scouring datasets and we devise a stepwise methodological framework for scouring prediction. The predictive performance of ML models are investigated through well-established statistical metrics. The key objectives of this study are (i) to develop a robust methodological framework to use data driven ML algorithms for predicting scour depth at coastal defences, and (ii) quantify the predictive performance of selected ML-based models for estimating scour depths at sloping coastal sea defences.
2 Scour prediction methods
Existing studies assessing scour at sea defences such as vertical seawalls and sloping seawalls are typically underpinned by numerical, laboratory and field-based modelling approaches to derive empirical relations and engineering guidance. Fowler (1992) developed empirical formulae for toe scour depth based on physical modelling of scouring at a vertical seawall placed on a sandy foreshore. Wallis et al. (2010) and Sutherland et al. (2003, 2006) proposed an improved guidance for predicting scour depths at vertical walls constructed on sandy foreshores using field and laboratory observations. These authors also claimed that for the tested conditions, maximum scour depths at a plain vertical wall were similar to those observed for a 1 in 2 sloping seawall. In recent years, Salauddin and Pearson (2019a), Salauddin and Pearson, (2019b) conducted a comprehensive suite of laboratory-based physical modelling experiments to characterise scouring at both vertical and sloping structures on shingle foreshores, subjected to a wide range of irregular wave conditions (including storm and swell sea states).
The review of literature relating to scour at seawalls reveals a substantial correlation between toe scour depth and relative water depth at the toe (ht/L0m), where, ht is the toe water depth (m) and L0m is the mean deep water wavelength (m), for defences on sandy foreshores. Sutherland et al. (2008) proposed an empirical relationship (Eq. 1) between the dimensionless scour depth (St/Hs), [calculated from scour depth St (m) and significant wave height (m), Hs (m)], and relative toe water depth (ht/L0m) for the prediction of toe scour depth at a plain vertical seawall in a sandy beach. This was later verified by Müller et al. (2008). Similar findings were also observed for scouring at a plain vertical wall with a shingle foreshore slope (Salauddin and Pearson, 2019a; Salauddin and Pearson, 2019b). Sutherland et al. (2008) also proposed an empirically based equation to predict the toe scour depth for vertical seawalls considering the influence of beach slope (Eq. 2).
where, St and
Numerical modelling tools have also developed and applied to simulate scour behaviour at coastal defences (Peng et al., 2018; Peng et al., 2023; Yeganeh-Bakhtiary et al., 2020). For example, Peng et al. (2023) utilized Reynolds Averaged Navier–Stokes equations (RANS) and the Volume of Fluid (VOF) modelling technique, coupled with wave-sediment transport and morphological factors, to simulate scour dynamics in front of an impermeable plane vertical seawall under specific wave conditions. However, robust numerical modelling techniques for estimating scour in wave environments still remain limited, largely as a result of the complexity of multiphase flow simulations, but also as a result of the high computational requirements (due to the involvement of intrinsic equations) that are involved. For example, in numerical simulations of estimating scour depths, uncertainty is induced from the dependency of such models on empirical parameters of the scouring process (Yang et al., 2018).
In recent years, with advancements in data science and computational resources, Artificial Intelligence (AI) in the form of Machine Learning (ML) has been successfully employed to address a wide range of coastal engineering problems. For example, significant research relating to the development of AI based decision-support algorithms for the prediction of wave characteristics (Yeganeh-Bakhtiary et al., 2023) and wave overtopping at coastal defences has been undertaken (see, for example, den Bieman et al., 2021a, 2021b; den Bieman et al., 2020; Elbisy, 2023; Elbisy and Elbisy, 2021; Habib et al., 2022b; Habib et al., 2023a; Habib et al., 2023b). Habib et al. (2022a) has provided an overview of recent studies on the applications of ML approaches in coastal engineering problems.
Data-driven ML modelling approaches have been applied to predict scour depths at vertical breakwaters. Pourzangbar et al. (2017a), Pourzangbar et al. (2017b) successfully applied several ML algorithms, including Genetic Programming (GP), Artificial Neural Network (ANN), Support Vector Machine Regression (SVMR) and the M5’ Decision Tree model to predict scour depth from physical modelling data for impermeable vertical breakwaters with sandy foreshores. However, the development to date of ML-based scour prediction models have thus far been applied to vertical breakwaters and sandy foreshores with fine grains. Previous studies however have not dealt with the prediction of scour depth at a sloping structure on a permeable shingle foreshore using advanced ML algorithms, which has been addressed for the first time in this work.
3 Materials and methods
3.1 Scouring dataset
The scour dataset used in this study was obtained from experimental studies conducted in a 2D wave flume, 22 m long, 0.6 m wide, and 1 m deep (Figure 1), at the University of Warwick’s Water Engineering Laboratory (Salauddin and Pearson, 2019b). The flume was equipped with a piston-type wave paddle, six Wave Gauges (WG) and active adsorption system capable of generating monochromatic and random waves, generating realistic sea states in the wave channel. The dataset consisted of over 120 experiments in which the scour characteristics at the toe of a sloping wall (1:2) with a shingle foreshore, of approximately 6 m length, on a 1:20 slope were observed and included a comprehensive range of incident wave conditions including both impulsive and non-impulsive waves. The JONSWAP wave spectrum with a peak-enhancement factor of 3.3 was applied to generate incident waves that were representative of the young sea state. The relative crest freeboard (Rc/Hm0), (where Rc is the crest-freeboard of the defence structure and Hmo is the wave height at the toe of the structure) ranged from 0.5 to 5.0 and this was achieved by applying six different types of toe water depths. The scouring characteristics were measured for both impulsive and non-impulsive wave conditions. The dataset comprising of 120 sets of observations, was split into a train-test set of 70%–30%.

FIGURE 1. Schematic of the Experimental setup for measuring scour depth at a sloping wall with a shingle foreshore (Adopted from Salauddin and Pearson, 2019b).
For each test configuration, the scour depth was measured at the toe of the structure and at different locations along the wave flume in front of the structure. The maximum scour depth was then determined from these measurements. Analysis of the experimental data showed that, for the wave conditions tested, the maximum scour depth occurred at the toe of the structure. An insight into the database in terms of statistical correlation (Pearson R) revealed very low correlative relations between the scour parameters (described in the Glossary section) and the relative scour depth (=St/Hm0; where, St is the measured scour depth and Hm0 is the water depth at the toe of the structure). No negative correlation was observed between the variables, however, only Rc/H1/3,deep and Ir showed a maximum correlation of 0.25 with the relative scour depth. Two kernel (ANN and SVMR) and two DT-based (RF and GBDT) algorithms were investigated in the study of Habib et al. (2023a) and it was reported that the algorithms performed satisfactorily in predicting wave overtopping at a vertical sea wall. The algorithms are hence also investigated for a scour dataset, since the intrinsic nature of the scour dataset is similar to what was applied in the overtopping study (Habib et al., 2023b).
The workflow followed in the data preparation, together with model development and testing is summarised in Figure 2.
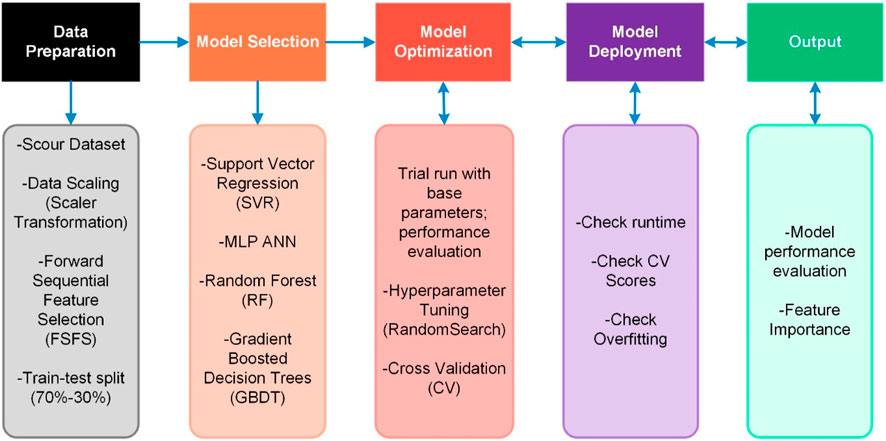
FIGURE 2. The methodological approach adopted for the ML based modelling.
3.2 SVMR
SVMR is a category of supervised ML algorithms and an extension of the classification-based Support Vector Machines (SVM), typically employed for regression tasks (Noori et al., 2022). SVMR algorithms aim to minimize the prediction error and simultaneously maximize the margin around the fitting function, effectively identifying the best-fit function for a given dataset. Figure 3 illustrates a typical workflow structure for SVMR. For a regression problem using a training dataset containing interlinked input features (xi) and target values (yi), SVMR deduces a function f(x) that predicts the target values y based on input features x. The fundamental goal of SVMR is to construct a hyperplane that closely fits the training data within a specified tolerance of error margin (ε). Feature points inside the epsilon tube surrounding the hyperplane are regarded as support vectors, w, and do not incur any penalties. Points outside of this tube are penalized because they add to the error. The loss function is determined using Eq. 3:
where,
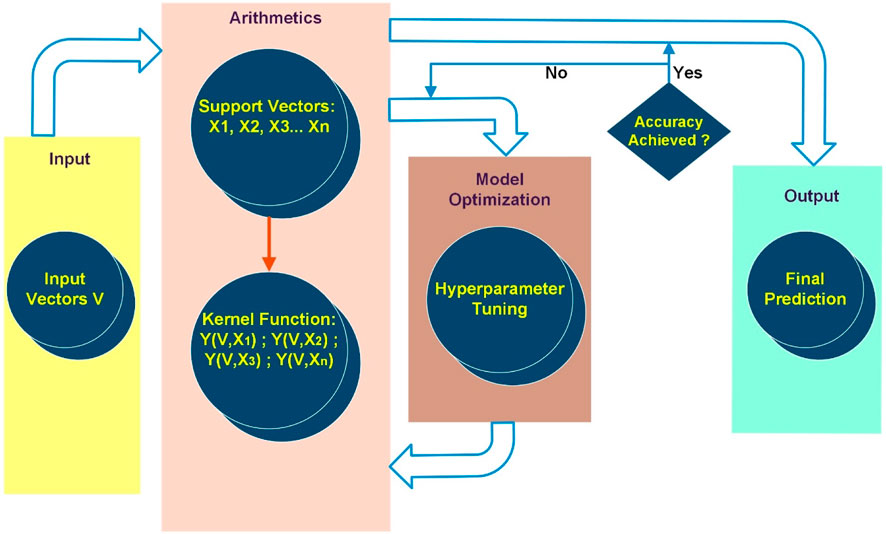
FIGURE 3. The workflow of a SVMR algorithm adopted in this study.
The main goal of the optimisation approaches related to SVMR is deducing the optimal values for w, and the slack variables,
where,
3.3 ANN
ANNs are well established in coastal engineering applications for tackling classification and regression tasks by mapping inputs to outputs, assigning weights to specific inputs, estimating and minimizing a loss function (example.g., Raikar et al., 2018; Verhaeghe et al., 2008; Zanuttigh et al., 2016; Formentin et al., 2017; EurOtop, 2018; Habib et al., 2023a; Habib et al., 2023b). Figure 4 illustrates the workflow of a feed-forward and back propagation ANN algorithm, including the input, hidden, and output layers. The input layer receives data from the training set. The information is only communicated to and from each layer within the neural network and not between neurones in the same layer. The model’s hidden layers are responsible for assigning numerical weights to the incoming information from the input layers and to the activation functions. The output layer of the network estimates the quantity predicted by the activation functions and then calculates the dependent feature(s) from the independent feature(s) in the input layers (Babaee et al., 2021; Khosravi et al., 2023).
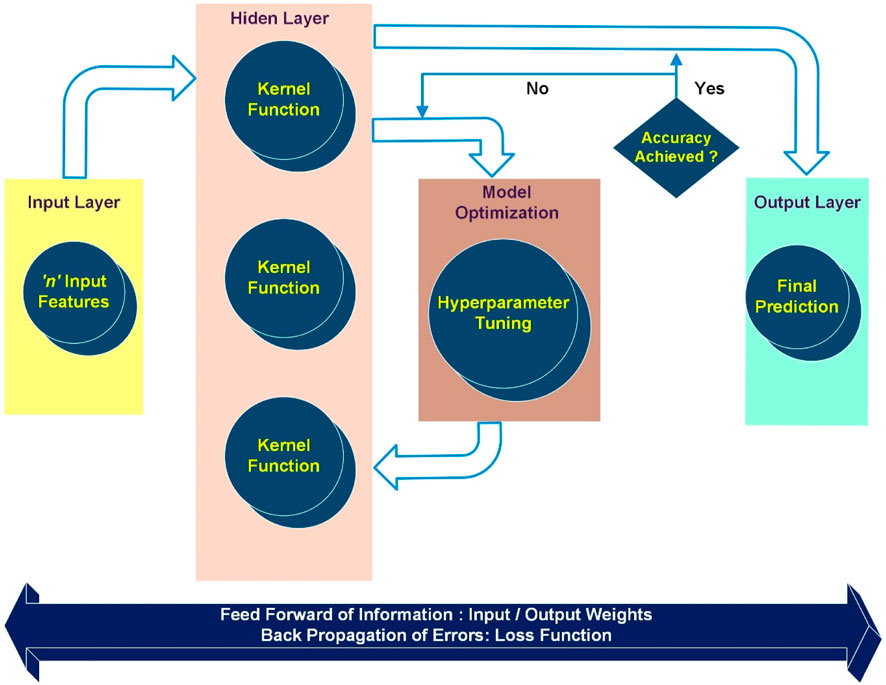
FIGURE 4. Schematic of a feed-forward and back propagation ANN algorithm adopted in this study.
A Multi-Layered Perceptron (MLP) ANN, which is feed-forward and back-propagation in nature, is adopted in this study (Figure 4). The term feed-forward and back-propagation essentially means that until a predetermined allowable error rate is achieved, the error rates are minimized by altering the loss functions through a combination of feed-forward (exchange of information from Input to Hidden to Output Layers) and back propagation (exchange of information from Output to Hidden and Hidden to Input Layers). The adjustment of weights and biases during the backpropagation stage is determined by the error rate. This process involves assigning new weights and activation functions to the hidden layers. The optimization of the number of hidden layers is usually based on the complexity of the input data, aiming to minimize prediction error (Elbeltagi et al., 2021; 2022).
3.4 RF and GBDT
RF and GBDT algorithms are typically categorised as Decision Trees (DTs). DTs are supervised machine learning algorithms used to predict an output variable (i.e., dependent or target variable) based on a set of independent variables (i.e., features). DTs are capable of tackling both classification and regression problems. In regression, they predict continuous or numerical output variables, while in classification, they predict class labels for discrete output variables (Yeganeh-Bakhtiary et al., 2022).
In the case of regression-based DTs, the training data is iteratively partitioned into rectangular regions, and the mean and median values within each region is estimated until a pre-determined stopping criteria are met. For example, given a training dataset, X =
A Random Forest (RF) algorithm is an ensemble of DTs constructed from a random sub-set of training data. Figure 5 illustrates a schematic of methodological workflow for RF modelling approach.
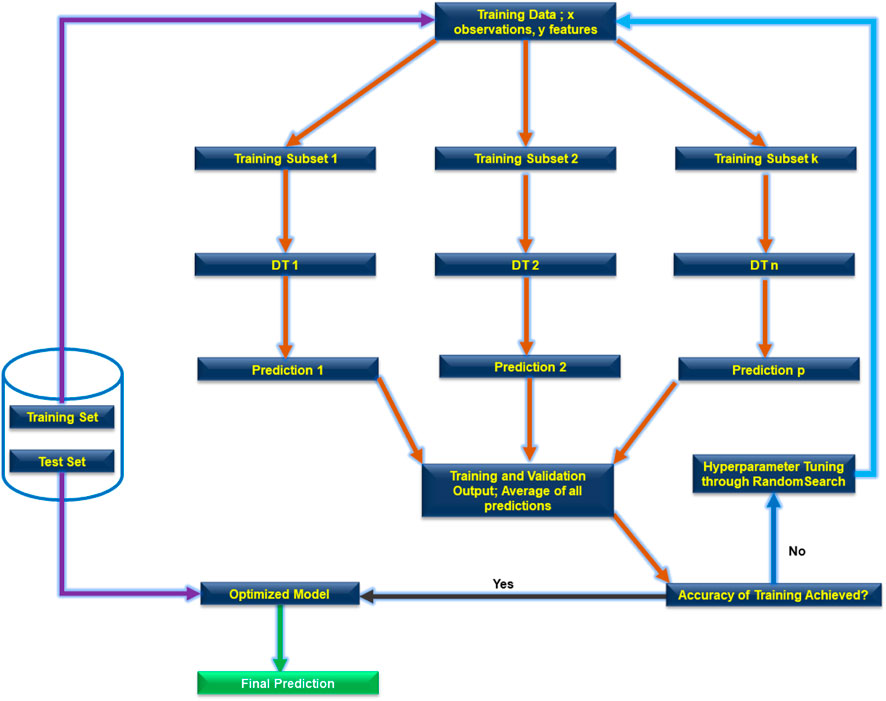
FIGURE 5. The workflow of a RF algorithm [Adopted from Habib et al. (2023a)].
RF model aims to reduce overfitting and enhance generalization by minimizing overexposure to any specific set of training data. The final prediction from tRF is the average of predictions made by individual DTs, often referred to as bagging. An additional advantage of RF is its capability handle both categorical and numerical data, further minimising overfitting.
The boosting strategy is another method for enhancing DTs’ predictive capabilities. An example of a Boosting approach is the GBDT algorithm (see Figure 6). The Mean Squared Error (MSE) between the predicted and actual values is measured in the boosting technique using a loss function. During training, the boosting algorithm aims to minimize this loss function by assigning numerical coefficients to input data, often through gradient descent. The GBDT algorithm, in particular, is known for rapidly minimizing the loss function, resulting in faster and more accurate predictions from DT models (Sutton, 2005).
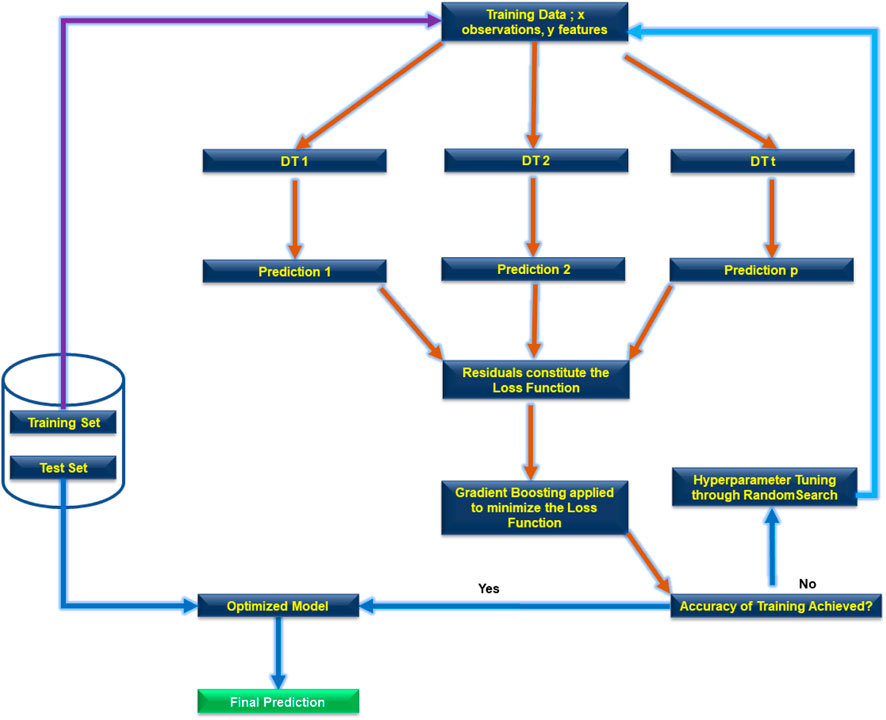
FIGURE 6. The workflow of a GBDT algorithm. Adopted from Habib et al. (2023b).
3.5 Model optimization
3.5.1 Hyperparameter tuning
Hyperparameters refer to the parameters of a ML algorithm that can be adjusted or tuned by the user, as opposed to model parameters, such as the coefficients of mapping functions, which are not user-accessible. Hyperparameter tuning is a crucial process for reducing overfitting and ensuring that the ML algorithm is well-suited for a specific set of input data. Hyperparameter tuning was conducted for all the ML adopted models in this study using the open-source scikit-learn library in Python (Pedregosa et al., 2011). Table 1 summarises the optimum hyperparameters adopted for the SVMR, RF, GBDT, and ANN models. The SVMR algorithm’s regularization parameter is represented by the C term in Table 1. The algorithm’s “engine” is a function called the kernel that maps input parameters (independent variables) onto output values (dependent variable). This study investigates the performance of linear, polynomial and RBF kernels. Gamma (Table 1) is a kernel function coefficient. This study combines “RandomizedSearch” and a k-fold Cross Validation (CV) to find the best parameters. CV is a popular resampling method that eliminates bias from prediction models (Pedregosa et al., 2011; Salauddin et al., 2023). The data is randomly divided into k sets of nearly similar size for k-fold cross validation. The ML algorithms are first tested on these folds to validate the training, and then applied to the test set. The validation step ensures that the algorithms explicitly capture the variations and patterns in the training set. The function RandomizedSearchCV (RS) uses a set number of random combinations of hyperparameters. The RS function is particularly suitable for performing hypertuning when there are a large number of hyperparameters involved, i.e., similar to this work.
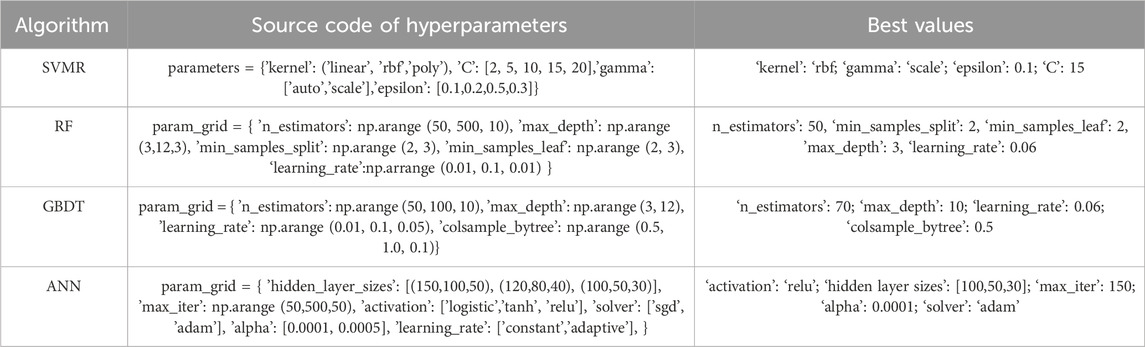
TABLE 1. Set of hyperparameters and their optimised values.
The key functional components of a DT network can be found in the hyperparameters of the RF model (Table 1). “n_estimators” determines the number of trees in an RF, while “max_depth” and “min_samples_split” help mitigating overfitting. In this study, a random search with Cross Validation (CV) was used for hyperparameter tuning in the RF model.
GBDT and RF are both based on DTs, with GBDT relying on gradient boosting. GBDT’s hyperparameters (Table 1) determine the size of the decision tree that best suits the input data. “learning_rate” is crucial for reducing overfitting as it computes the weights of input features to converge the error in the loss function. “max_depth” also plays a role in reducing overfitting by limiting the number of nodes in the trees. For GBDT, hyperparameter tuning was performed using a random search with 5-fold cross validation. The scope of hyperparameter tuning with ANN is limited (Huang et al., 2012; Ghiasi et al., 2022). RS with a k-fold CV approach is implemented in this study to enhance the learning rate “alpha,” and the best model is determined based on the model loss criterion. Typical hyperparameter tuning values for the ANN models are adopted from LeCun et al. (2015) and Glorot and Bengio (2010). The kernel function of the ANN is located in the hidden layers, and the user can predetermine both the number of layers and neurons in each layer. Additional to the ‘alpha’ parameter’ and the activation function, the number of epochs was adjusted to attain the optimal set of hyperparameters for the ANN in this study.
3.5.2 Feature selection and feature transformation
Robust ML-based predictions can be challenging when dealing with high-dimensional data that can reduce the effectiveness and accuracy of machine learning algorithms due to data redundancy. Additionally, computational resource costs can increase due to prolonged algorithm runtimes. To address the issue of data redundancy, feature selection techniques are employed. These techniques aim to filter a subset of relevant features from a large dataset, effectively eliminating redundancy and irrelevance (Cai et al., 2018). Feature selection is typically achieved through statistics-based permutation combinations, which measure the correlation of individual features with a target feature. The most important features are then deduced based on their correlation scores, as highlighted by Liu and Motoda (2012) and Donnelly et al. (2024).
Feature transformation is a technique used for extracting useful features from a large dataset, where the initial number of features is transformed into a new, more compact dataset with fewer but relevant features, while conserving the implicit and/or explicit information of the original dataset. One well-known feature transformation technique is Principal Component Analysis (PCA) (Roessner et al., 2011; Noori et al., 2022). PCA is particularly useful for capturing and reducing variance in large datasets by selecting the most relevant features that account for the majority of variance across the dataset. It is characterized as a dimensionality reduction technique that converts the original variables into uncorrelated principal components.
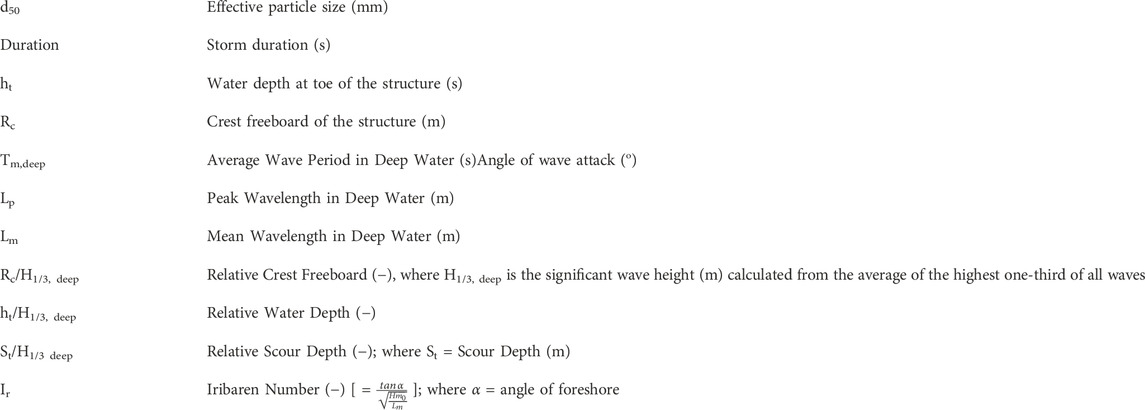
This study adopts a combination of feature selection and feature transformation techniques to discover and filter the most relevant features in the scour dataset. A Forward Sequential Feature Selection (FSFS) method is employed for feature selection. FSFS is a “greedy” method that iteratively builds a set of selected features (S) by adding new features, one at a time, and performing prediction tasks using a chosen estimator. In more concrete terms, FSFS starts with zero features and identifies the feature that, when used to train an estimator (e.g., linear regression in this study), maximizes a Cross Validation (CV) score. This process is repeated, adding one feature at a time, until all features in the dataset have been considered. The number of features that maximizes the CV score is considered the optimal number. FSFS is widely accepted for its simplicity and accuracy in estimating the number of important features in a dataset (Marcano-Cedeno et al., 2010). In this study, FSFS determined 10 parameters as the optimum number of features (see Figure 7). Subsequently, PCA was applied to gain insight into the 10 most important features of the dataset utilised in this study, including d50 (mm), Duration (s), ht (m), Rc (m), Tm,deep (s), Lp (m), Lm (m), Rc/H1/3,deep, ht/H1/3,deep and Ir (terms are explained in the glossary). The data corresponding to the features proposed by FSFS are selected as predictive model input for the training and testing phase of the ML algorithms.
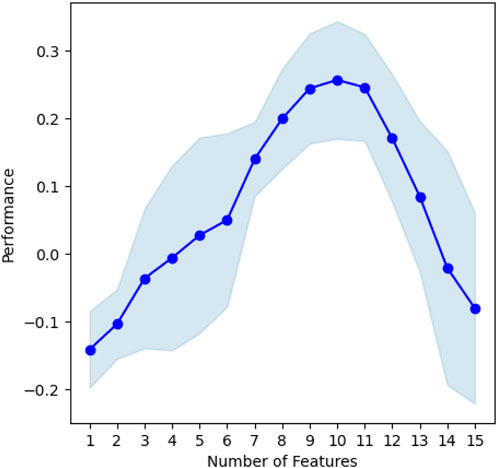
FIGURE 7. Variation of performance metric (CV score) with the number of features during Forward Sequential Feature Selection (FSFS).
Further analysis of the training phase was conducted by examining the variation of RMSE in the training set (Figure 8). The CV value and the number of training and validation iterations were set at 5 and 100, respectively. Figure 8 illustrates that, despite observing RMSE variations across all the algorithms, the average RMSE remained consistent in all the cases. This indicates that the selected algorithms in this study are capable of producing similar performance on the given dataset.
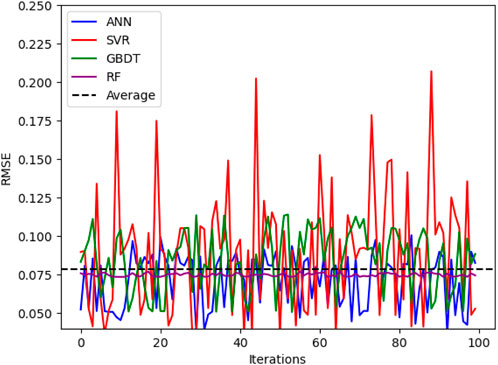
FIGURE 8. Variation of RMSE during the training phase for SVMR, ANN, RF and GBDT algorithms.
3.6 Evaluation metrics
To evaluate the performance of the machine learning algorithms in predicting relative scour depth, the predicted values were compared to the observed values using statistical metrics including the coefficient of determination (R2), root mean square error (RMSE), mean absolute error (MAE), and relative absolute error (RAE). The Coefficient of Determination (Eq. 5) describes the percentage of the dependent variable’s fluctuation that can be predicted from the independent variables and, as such, serves as a gauge to evaluate the overall effectiveness of ML models (Cheng et al., 2014):
where
The standard deviations between the observed and predicted values are reflected in the Root Mean Square Error (RMSE) calculated from Eq. 6, and discrepancies between these values, averaged across the number of observations, is expressed in terms of the Mean Absolute Error (MAE) as in Eq. 7:
where, qA and qP are the actual and predicted relative scour depths, respectively.
In a regression test, the null hypothesis is that all of the regression coefficients are zero, i.e., the model is not predictive. The F-test is performed to determine whether accept or reject the null hypothesis. The F-test assesses whether the addition of predictor or dependent variables improves the model compared to a model with only an intercept (zero predictor variables). It quantifies the ratio of explained variance to unexplained variance (residuals) as (Eq. 8):
where,
The plot of the residuals or the Discrepancy Ratio (DR) against the predicted values is also an important criteria about the relevancy of a prediction model and the residuals should ideally exhibit zero correlation with the predicted values (Sahay and Dutta, 2009; Salauddin et al., 2023).
The study of Kissell and Poserina, (2017) suggested that the statistical significance of regression models (where predicted values are compared against observed ones) should be holistically evaluated in terms of the r2 score, F-test score and the p-value. The values obtained from these statistical parameters should be in agreement to deduce the stability and accuracy of regression models.
4 Results and discussion
4.1 Model performances
The experimental dataset of Salauddin and Pearson (2019a) was deployed for training and testing of all the ML algorithms examined in this study following scalar transformations and feature selection. Training and testing of the models followed a common methodology which provided the basis for comparing modelled and measured dimensionless scour depths (St/H1/3 deep [-]) in Figure 9. Results indicate that all the four ML-based models tested in this study are capable of providing realistic approximation of scour depths. In-depth statistical evaluation of the predictive models is presented in Table 2.
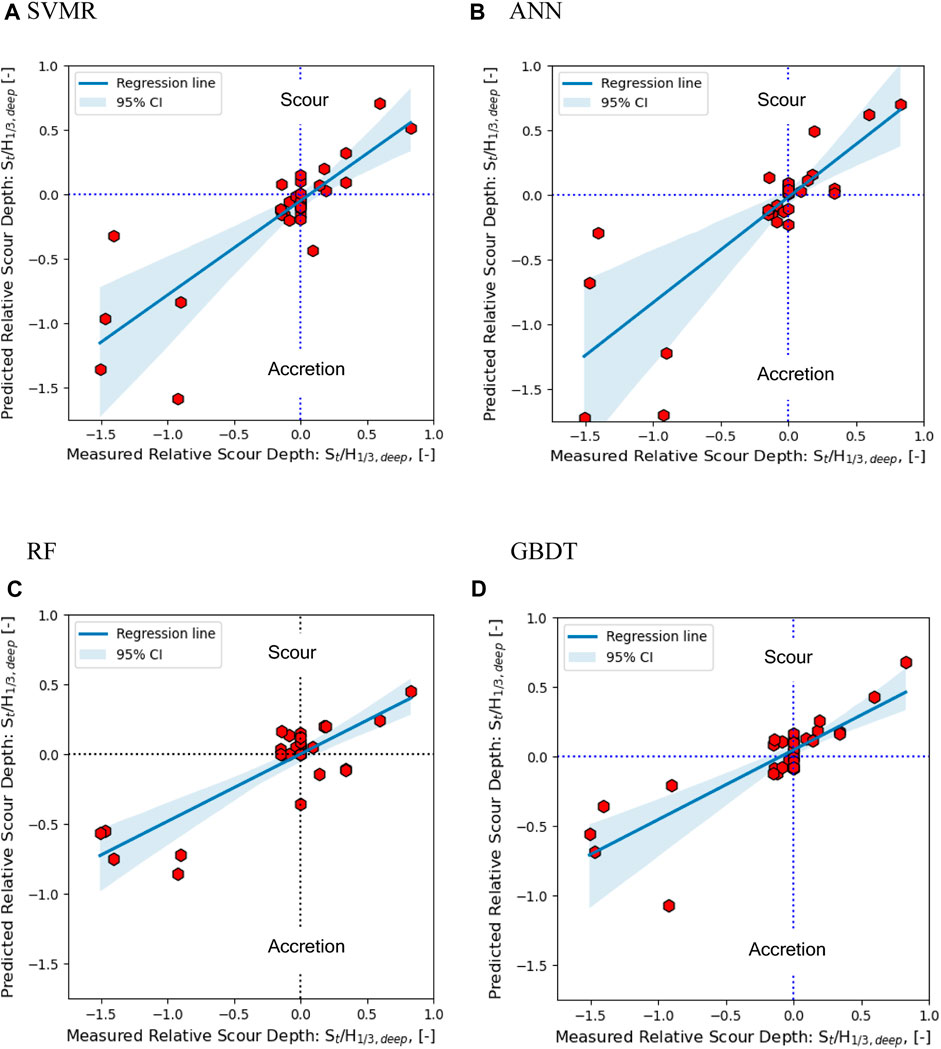
FIGURE 9. Comparison of predicted versus actual relative scour depths (=St/H1/3 deep [-]) for (A) SVMR, (B) ANN, (C) RF, and (D) GBDT.
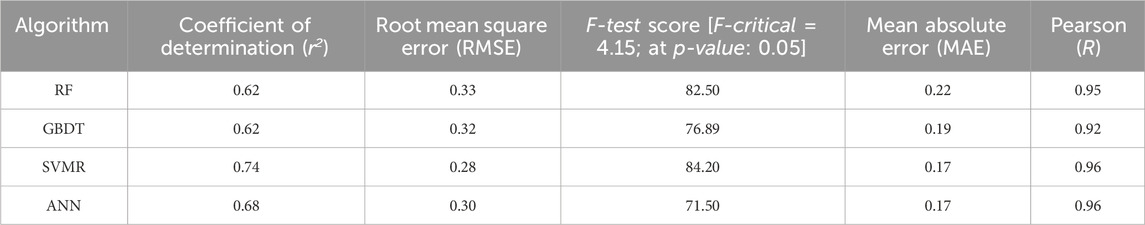
TABLE 2. Prediction evaluation metrics and statistical scores for ML-based models.
Notably, a number of data points for smaller (near to 0.0) relative scour depths fall outside the 95% CIs. This pattern is also evident for a few datapoints of large relative scour depth, while a few data points representing larger relative scour depths were inside the 95% CI zone. This suggests that while the algorithms were capable of robust overall predictions, but in the case of both smaller and larger relative scour depths, they exhibited some inconsistency. However, predictions for larger relative scour depths were more accurate (positioning on or very close to the regression line in Figure 9). The scatter in the graphs can be explained by the Pearson R score. Among the tested algorithms, ANN, GBDT, and RF showed similar scatter with relatively lower R scores compared to SVMR. SVMR, in particular, demonstrated comparatively more accurate predictions, as reflected by the highest r2 and R scores of 0.74 and 0.85, respectively. The RMSE values of the algorithms did not vary by a large margin with respect to one another. The SVMR yielded the lowest RMSE value of 0.28 while that of the RF was the highest at 0.33. The highest RMSE value was approximately 22% of the predicted maximum relative scour depth. From a computational efficiency perspective, under the given hyperparameter conditions (Table 1) and using a computer with an 8 cores CPU, 16 GB RAM, and 6 GB of dedicated GPU memory, the SVMR, ANN, GBDT and RF algorithms completed the prediction task (for the test set) in 2.5, 6.93, 14.83 and 22.3 s, respectively. This information suggests that SVMR outperforms the other algorithms in terms of computational efficiency.
Comprehensive statistical analyses of the developed ML-based models’ performance were conducted in this study. Statistical scores are then used to rank the performance of the four tested ML algorithms in predicting scour depth at sloping structures with shingle foreshore. Table 2 shows the results of performance evaluation of the algorithms according to the criteria outlined in Section 4.1.
The results from the evaluation metrics indicate that all the algorithms yielded strong r2 scores (r2 scores >0.40; Kissell and Poserina, 2017). Hence, the F-test was performed and it was observed that all the models yielded F-score higher than the critical F-test score of 4.15 (Table 2) and also the p-values for all the models were substantially (∼10−6) lower than the significance level of 0.05. These findings reflect the statistical significance of the results obtained from the ML algorithms and it can be inferred that the variations in the independent variable (actual relative scour depth) were accounted for by the dependent variable (predicted relative scour depth). The cumulative number of outliers in the models is expressed in the form of the RMSE. The SVMR algorithm yielded the predicted relative scour depth quantity with the smallest number of outliers, reflected in the lowest RMSE of 0.28 across all the tested algorithms. The RMSE of the other algorithms is not shown to differ significantly, suggesting the appropriateness and robustness of the proposed ML algorithms for predicting relative scour depth. A higher RMSE and MAE was coupled with lower r2 and vice versa for all the models. It is noted that the scale of MAE is dependent on the scale of the outputs (here, the predicted relative scour depth). The maximum and minimum absolute relative scour depth in the test set was 1.5 and 0.8, respectively, giving a mean relative scour depth of 1.15. The maximum MAE of 0.22 across the models was observed for the RF model. Conversely, the minimum MAE of 0.17 was determined for the SVMR model. Therefore, the range of MAE evaluated for this study was between 14.7% and 19% for the mean relative scour depth in the test set, consisted of 32 observations derived from the original set of 120 observations using a train-test split of 70%–30%. The significance of the MAE analysis is that the models were able to predict the relative scour depth with an approximate accuracy of 80%. Overall, the most accurate scour predictions were attributed to the SVMR model, with the least accurate predictions being associated with the RF and GBDT models, suggesting that DT based algorithms may be less suited for obtaining predictions from smaller datasets.
4.2 Feature importance
The method of evaluating the relative contribution of various features, also referred to as variables or predictors, in a predictive model is known as Feature Importance (FI). It is useful for selecting features, comprehending the underlying data, and getting new perspectives on the subject at hand. FI reveals which features have the most impact on the model’s predictions, essentially bridging the findings from ML to the physical consistency of the underlying processes (i.e., scouring in this study). The FI results are reported in two formats here, namely, the magnitude of the coefficients method and the permutation importance method. This is due to the fact that although the DT-based algorithms (i.e., RF and GBDT) had in-built FI analysis functions, the other two algorithms (SVMR and ANN) did not possess this function in Scikit-Learn’s module. In the magnitude of the coefficients method, the size of the coefficients directly reflects the significance of the feature. Greater absolute values imply greater significance of the predictors. The permutation importance method involves permuting a predictor’s values at random and analyzing the impact on model performance. The more performance is lost, the more significant the feature is thought to be. The results are reported in a similar format to that of the magnitude of coefficients method. Figure 10 summarizes the impact of the predictors on the prediction analysis.
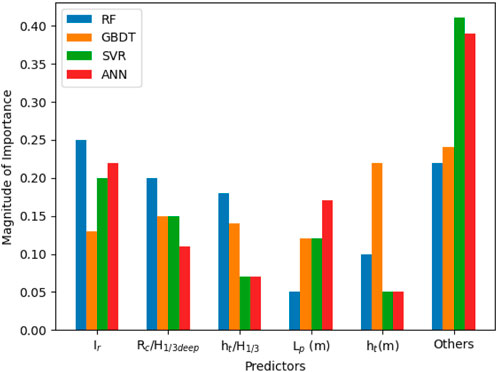
FIGURE 10. Feature Importance Analysis showing the impact of predictors.
In some experiments related to the measurement of relative scour depth at sloping walls with gravel foreshore, it was reported that the Iribarren Number Ir had a strong positive correlation with the measured scour depths for a given relative toe water depth (ht/L0m) (Salauddin and Pearson, 2019b). Hence, it was expected that Ir would have the maximum influence in the prediction analysis to ensure consistency with experimental results. The FI analysis results show that 3 out of 4 (i.e., ANN, SVMR, and RF) algorithms identified Ir as the most important predictor. For the GBDT algorithm, Ir is ranked as one of the top three predictors, while the water depth at the toe of the structure (ht) is identified as the most important predictor. In Figure 10, the bars labelled as ‘others’, comprises the summation of the magnitude of importance of features including d50, Duration, Rc, Tm deep, and Lm from the four tested algorithms. Therefore, it can be inferred from the results of FI, that the physical scouring processes are reasonably well-captured in the proposed ML-based models.
4.3 Residuals
The residual plot for all of the tested algorithms is shown in Figure 11. The residuals are independent of the predicted values, highlighting that the results are in good agreement regarding the reliability of the models.

FIGURE 11. Variation of Residuals with predicted relative scour depth.
4.4 Taylor’s diagram
An effective visual method to describe the statistical metrics from predictive models is the Taylor’s Diagram (Taylor, 2001). The Taylor’s Diagram (Figure 12) shows three statistical parameters, including the correlation coefficient projected as an azimuthal angle (in black), the radially plotted Centered Root Mean Square (cRMS) (in green), and the horizontally plotted standard deviations (in blue). Taylor diagram is particularly robust for assessing and comparing several performance aspectsof complicated models.
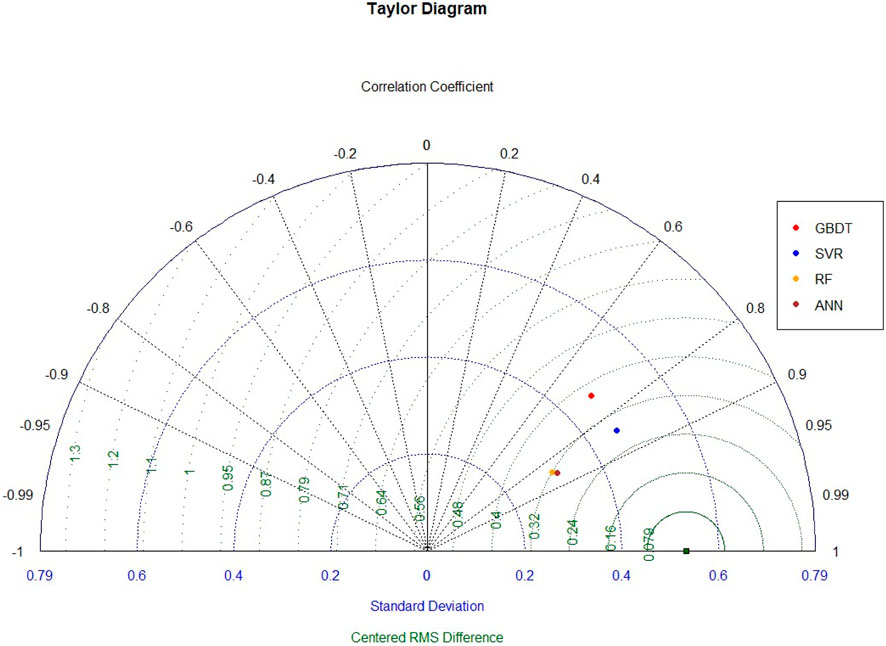
FIGURE 12. Taylor’s Diagram of the statistical metrics determined for all tested ML-based models.
Due to the fact that they are both the square roots of squared differences between the actual and predicted values, standard deviation and the cRMS are comparable. However, they differ from one another in the context that RMSE is used to gauge the gap between actual values and the corresponding predictions while standard deviation accounts for the spread of data around the mean. The error of prediction, or the quantitative deviation is measured using the cRMS. Here, the cRMS of the SVMR is the lowest, while the standard deviation is the highest. This essentially means that while the predicted results are more spread across the regression line, the quantity of spread is small, indicated by the low cRMS score. Conversely, RF and ANN has lower standard deviation, but the quantity of deviation is high which is reflected by the higher cRMS score. The SVMR model also yielded the highest correlation coefficient of 0.96 followed by that of ANN (0.955), RF (0.95) and GBDT (0.92). Therefore, from a holistic point of view it could be inferred from the Taylor’s Diagram that the SVMR produced the more accurate values of predicted relative scour depth.
5 Conclusion
Climate change-induced extreme climatic events intensify scouring in front of coastal infrastructures, posing a significant threat to their structural integrity and reliability. The development of robust prediction tools for coastal scouring is crucial for enhancing coastal resilience and safeguard these vital defences. This study examined the capabilities of advanced ML techniques for prediction of relative scour depths at sloping seawalls with shingle foreshores. This study developed a methodological framework for implementing of ML-based models for accurate predictions of relative scour depths at sloping walls with shingle foreshore. Four ML algorithms including RF, GBDT, SVMR, and ANN were utilised and tested on an experimental dataset of scour depths. We proposed a robust and efficient framework including detailed procedures for data scaling, feature selection, and tuning of the modelling parameters.
A methodological approach is proposed for pre-processing the physical modelling dataset to conduct missing value imputations, feature transformation (PCA), selection, and data scaling to ensure redundant data and missing values do not impair the performance of the ML models. In order to verify the ML algorithms on a randomly selected sub-set of training data, cross validation was carried out in the training step. A typical train-test split of 70%–30% was implemented. These precautions ensured that a consistent methodology was followed to achieve comparable outcomes from the predictions made by the four algorithms. Iribarren Number (Ir) was identified as the most important parameter influencing the scouring process, in agreement with the physical process of scouring.
The performance of the proposed ML-based predictive models were evaluated for a comprehensive experimental dataset. The predicted relative scour depth and comprehensive statistical evaluation confirmed the robust performance and accuracy of all the tested algorithms.
A set of statistical indices, (r2, RMSE, MAE, F-test and Pearson R) were incorporated to gauge the efficiency of the tested ML algorithms. The SVMR algorithm showed superior performance compared to the other tested algorithms with an r2 score of 0.74, RMSE of 0.28, MAE of 0.17 and Pearson R value of 0.96. The DT based algorithms were not able to match performance of SVMR and ANN with scores of 0.62 for r2 for both RF and GBDT. ANN was identified as the second-best performing algorithm with a r2 score closest to that of SVMR the (0.68). The F-test score and the Pearson R values of the algorithms are indicative of the fact that the variation of the independent variable is accounted for by the dependent variables or the predictors and that there is strong correlation between the actual and predicted values. These findings were reinforced by the high Pearson R values of 0.96, 0.955, 0.95 and 0.92 for SVMR, ANN, RF and GBDT, respectively. The SVMR model was also the most computationally efficient model (<3s), more than two times faster than ANN (6.93s) followed by DT based GBDT (14.83s) and RF (22.3s). The comparison of MAE revealed that accuracy of predictions was over 80% for all the algorithms. One important reason of DTs underperforming in this study may be due to the relatively small number of training data. Although there is no explicit requirement of the amount of training data required by ML algorithms, larger and more diverse datasets could improve the performance of ML-based models presented in this study. Future studies should focus on further improving the performance of the proposed predictive tool by the inclusion of larger experimental datasets. Hybrid machine learning approaches with optimisation techniques could potentially enhance predictive performance of the models proposed here and should be tested on wave-induced scouring datasets. The method proposed in this study could be adopted by coastal engineers for rapid scour depth prediction and inform design and maintenance of coastal defence structures.
Data availability statement
The data analyzed in this study is subject to the following licenses/restrictions: Data will be made available on reasonable request. Requests to access these datasets should be directed to md.salauddin@ucd.ie.
Author contributions
MAH: Conceptualization, Data curation, Formal Analysis, Investigation, Methodology, Software, Validation, Visualization, Writing–original draft. SA: Writing–review and editing. JO’S: Writing–review and editing, Supervision. MS: Conceptualization, Funding acquisition, Methodology, Project administration, Resources, Supervision, Writing–review and editing.
Funding
The author(s) declare that no financial support was received for the research, authorship, and/or publication of this article.
Conflict of interest
The authors declare that the research was conducted in the absence of any commercial or financial relationships that could be construed as a potential conflict of interest.
Publisher’s note
All claims expressed in this article are solely those of the authors and do not necessarily represent those of their affiliated organizations, or those of the publisher, the editors and the reviewers. Any product that may be evaluated in this article, or claim that may be made by its manufacturer, is not guaranteed or endorsed by the publisher.
References
Babaee, M., Maroufpoor, S., Jalali, M., Zarei, M., and Elbeltagi, A. (2021). Artificial intelligence approach to estimating rice yield. Irrigation Drainage 70 (4), 732–742. doi:10.1002/ird.2566
Cai, J., Luo, J., Wang, S., and Yang, S. (2018). Feature selection in machine learning: a new perspective. Neurocomputing 300, 70–79. doi:10.1016/j.neucom.2017.11.077
Cheng, C.-L., Shalabh, , and Garg, G. (2014). Coefficient of determination for multiple measurement error models. J. Multivar. Analysis 126, 137–152. doi:10.1016/j.jmva.2014.01.006
den Bieman, J. P., van Gent, M. R. A., and van den Boogaard, H. F. P. (2021a). Wave overtopping predictions using an advanced machine learning technique. Coast. Eng. 166, 103830. doi:10.1016/j.coastaleng.2020.103830
den Bieman, J. P., Wilms, J. M., van den Boogaard, H. F. P., and van Gent, M. R. A. (2020). Prediction of mean wave overtopping discharge using gradient boosting decision trees. Water 12 (6), 1703. doi:10.3390/w12061703
Donnelly, J., Daneshkhah, A., and Abolfathi, S. (2024). Forecasting global climate drivers using Gaussian processes and convolutional autoencoders. Eng. Appl. Artif. Intell. 128, 107536. doi:10.1016/j.engappai.2023.107536
Elbeltagi, A., Kumari, N., Dharpure, J., Mokhtar, A., Alsafadi, K., Kumar, M., et al. (2021). Prediction of combined terrestrial evapotranspiration index (CTEI) over large river basin based on machine learning approaches. Water 13 (4), 547. doi:10.3390/w13040547
Elbeltagi, A., Pande, C. B., Kouadri, S., and Islam, A. R. M. T. (2022). Applications of various data-driven models for the prediction of groundwater quality index in the Akot basin, Maharashtra, India. Environ. Sci. Pollut. Res. 29 (12), 17591–17605. doi:10.1007/s11356-021-17064-7
Elbisy, M. S. (2023). Machine learning techniques for estimating wave-overtopping discharges at coastal structures. Ocean. Eng. 273, 113972. doi:10.1016/j.oceaneng.2023.113972
Elbisy, M. S., and Elbisy, A. M. S. (2021). Prediction of significant wave height by artificial neural networks and multiple additive regression trees. Ocean. Eng. 230, 109077. doi:10.1016/j.oceaneng.2021.109077
EurOtop, (2018). Manual on Wave Overtopping of Sea Defences and Related Structures. 2nd Edn. Available online at: www.overtopping-manual.com (accessed July, 2023)
Fitri, A., Hashim, R., Abolfathi, S., and Abdul Maulud, K. N. (2019). Dynamics of sediment transport and erosion-deposition patterns in the locality of a detached low-crested breakwater on a cohesive coast. Water 11 (8), 1721. doi:10.3390/w11081721
Formentin, S. M., Zanuttigh, B., and van der Meer, J. W. (2017). A neural network tool for predicting wave reflection, overtopping and transmission. Coast. Eng. J. 59 (1), 1750006. doi:10.1142/S0578563417500061
Fowler, J. E. (1992). “Scour problems and methods for prediction of maximum scour at vertical seawalls,” in Us army corps of engineers (Vicksburg, MS, USA: Coastal Engineering Research Center). W. E. S. (eds.), Technical Report CERC-92–16.
Ghiasi, B., Noori, R., Sheikhian, H., Zeynolabedin, A., Sun, Y., Jun, C., et al. (2022). Uncertainty quantification of granular computing-neural network model for prediction of pollutant longitudinal dispersion coefficient in aquatic streams. Sci. Rep. 12, 4610. doi:10.1038/s41598-022-08417-4
Glorot, X., and Bengio, Y. (2010). “Understanding the difficulty of training deep feedforward neural networks,” in International conference on artificial intelligence and statistics. 2010.
Habib, M. A., Abolfathi, S., O'Sullivan, J. J., and Salauddin, M. (2023b). “Prediction of wave overtopping rates at sloping structures using artificial intelligence,” in Proceedings of the 40th IAHR World Congress. Rivers–Connecting Mountains and Coasts, 404–413. doi:10.3850/978-90-833476-1-5_iahr40wc-p0115-cd
Habib, M. A., O'Sullivan, J., and Salauddin, M. (2022a). Comparison of machine learning algorithms in predicting wave overtopping discharges at vertical breakwaters. Austria: EGU General Assembly Vienna, EGU22–329. 23–27 May 2022. doi:10.5194/egusphere-egu22-329
Habib, M. A., O’Sullivan, J. J., Abolfathi, S., and Salauddin, M. (2023a). Enhanced wave overtopping simulation at vertical breakwaters using machine learning algorithms. PLOS ONE 18 (8), e0289318. doi:10.1371/journal.pone.0289318
Habib, M. A., O’Sullivan, J. J., and Salauddin, M. (2022b). Prediction of wave overtopping characteristics at coastal flood defences using machine learning algorithms: a systematic rreview. IOP Conf. Ser. Earth Environ. Sci. 1072 (1), 012003. doi:10.1088/1755-1315/1072/1/012003
Huang, G. B., Zhou, H., Ding, X., and Zhang, R. (2012). Extreme learning machine for regression and multiclass classification. IEEE Trans. Syst. Man. Cyber Part B 42, 513–529. doi:10.1109/tsmcb.2011.2168604
Kawashima, I., and Kumano, H. (2017). Prediction of mind-wandering with electroencephalogram and non-linear regression modeling. Front. Hum. Neurosci. 11, 365. doi:10.3389/fnhum.2017.00365
Khosravi, K., Rezaie, F., Cooper, J. R., Kalantari, Z., Abolfathi, S., and Hatamiafkoueieh, J. (2023). Soil water erosion susceptibility assessment using deep learning algorithms. J. Hydrology 618, 129229. doi:10.1016/j.jhydrol.2023.129229
Kissell, R., and Poserina, J. (2017). “Regression models,” in Optimal sports math, statistics, and fantasy (Elsevier), 39–67. doi:10.1016/B978-0-12-805163-4.00002-5
Kotu, V., and Deshpande, B. (2015). “Classification,” in Predictive analytics and data mining (Elsevier), 63–163. doi:10.1016/B978-0-12-801460-8.00004-5
Lan, J., Zheng, M., Chu, X., and Ding, S. (2023). Parameter prediction of the non-linear nomoto model for different ship loading conditions using support vector regression. J. Mar. Sci. Eng. 11 (5), 903. doi:10.3390/jmse11050903
LeCun, Y., Bengio, Y., and Hinton, G. (2015). Deep learning. Nature 521, 436–444. doi:10.1038/nature14539
Liu, H., and Motoda, H. (2012). Feature selection for knowledge discovery and data mining. Springer Science & Business Media.
Marcano-Cedeno, A., Quintanilla-Dominguez, J., Cortina-Januchs, M. G., and Andina, D. (2010). “Feature selection using sequential forward selection and classification applying artificial metaplasticity neural network,” in IECON 2010 - 36th Annual Conference on IEEE Industrial Electronics Society, 2845–2850. doi:10.1109/IECON.2010.5675075
Müller, G., Allsop, W., Bruce, T., Kortenhaus, A., Pearce, A., and Sutherland, J. (2008). “The occurrence and effects of wave impacts,” in Proceedings of the ICE-Maritime Engineering (ICE), 167–173.
Noori, R., Ghiasi, B., Salehi, S., Esmaeili Bidhendi, M., Raeisi, A., Partani, S., et al. (2022). An efficient data driven-based model for prediction of the total sediment load in rivers. Hydrology 9 (2), 36. doi:10.3390/hydrology9020036
Pedregosa, F., Varoquaux, G., Gramfort, A., Michel, V., Thirion, B., Grisel, O., et al. (2011). Scikit-learn: machine learning in Python. doi:10.48550/arXiv.1201.0490
Peng, Z., Zou, Q. P., and Lin, P. (2018). A partial cell technique for modeling the morphological change and scour. Coast. Eng. 131, 88–105. doi:10.1016/j.coastaleng.2017.09.006
Peng, Z., Zou, Q. P., and Lin, P. (2023). “Impulsive wave overtopping with toe scour at a vertical seawall,” in ICE Breakwater Conference 2023, UK.
Pourzangbar, A., Brocchini, M., Saber, A., Mahjoobi, J., Mirzaaghasi, M., and Barzegar, M. (2017b). Prediction of scour depth at breakwaters due to non-breaking waves using machine learning approaches. Appl. Ocean. Res. 63, 120–128. doi:10.1016/j.apor.2017.01.012
Pourzangbar, A., Losada, M. A., Saber, A., Ahari, L. R., Larroudé, P., Vaezi, M., et al. (2017a). Prediction of non-breaking wave induced scour depth at the trunk section of breakwaters using Genetic Programming and Artificial Neural Networks. Coast Eng. 121, 107–118. doi:10.1016/j.coastaleng.2016.12.008
Powell, K. A., and Lowe, J. P. (1994). The scouring of sediments at the toe of seawalls. In: Proceedings of the Hornafjordor International Coastal Symposium, Iceland, 749–755.
Raikar, R. V., Wang, C.-Y., Shih, H.-P., and Hong, J.-H. (2016). Prediction of contraction scour using ANN and GA. Flow Meas. Instrum. 50, 26–34. doi:10.1016/j.flowmeasinst.2016.06.006
Roessner, U., Nahid, A., Chapman, B., Hunter, A., and Bellgard, M. (2011). “Metabolomics – the combination of analytical biochemistry, biology, and informatics,” in Comprehensive biotechnology (Elsevier), 435–447. doi:10.1016/B978-0-444-64046-8.00027-6
Roushangar, K., and Koosheh, A. (2015). Evaluation of GA-SVR method for modeling bed load transport in gravel-bed rivers. J. Hydrology 527, 1142–1152. doi:10.1016/j.jhydrol.2015.06.006
Sahay, R. R., and Dutta, S. (2009). Prediction of longitudinal dispersion coefficients in natural rivers using genetic algorithm. Hydrology Res. 40 (6), 544–552. doi:10.2166/nh.2009.014
Salauddin, M., O’Sullivan, J., Abolfathi, S., Peng, Z., Dong, S., and Pearson, J. M. (2022). New insights in the probability distributions of wave-by-wave overtopping volumes at vertical breakwaters. Sci. Rep. 12, 16228. doi:10.1038/s41598-022-20464-5
Salauddin, M., and Pearson, J. (2018). A laboratory study on wave overtopping at vertical seawalls with a shingle foreshore. Coast. Eng. Proc. (36), 56. doi:10.9753/icce.v36.waves.56
Salauddin, M., and Pearson, J. M. (2019a). Wave overtopping and toe scouring at a plain vertical seawall with shingle foreshore: a Physical model study. Ocean. Eng. 171, 286–299. doi:10.1016/j.oceaneng.2018.11.011
Salauddin, M., and Pearson, J. M. (2019b). Experimental study on toe scouring at sloping walls with gravel foreshores. J. Mar. Sci. Eng. 7, 198. doi:10.3390/jmse7070198
Salauddin, M., Shaffrey, D., and Habib, M. A. (2023). Data-driven approaches in predicting scour depths at a vertical seawall on a permeable shingle foreshore. J. Coast Conserv. 27, 18. doi:10.1007/s11852-023-00948-w
Salauddin, M., and Pearson, J. M. (2020). Laboratory investigation of overtopping at a sloping structure with permeable shingle foreshore. Ocean Engineering 197. doi:10.1016/j.oceaneng.2019.106866
Sutherland, J., Brampton, A. H., Motyka, G., Blanco, B., and Whitehouse, R. J. W. (2003). Beach lowering in front of coastal structures-Research Scoping Study. London, UK. Report FD1916/TR.
Sutherland, J., Brampton, A. H., Obrai, C., Dunn, S., and Whitehouse, R. J. W. (2008). Understanding the lowering of beaches in front of coastal defence structures, Stage 2-Research Scoping Study. London, UK. Report FD1927/TR.
Sutherland, J., Obhrai, C., Whitehouse, R., and Pearce, A. (2006). “Laboratory tests of scour at a seawall,” in Proceedings of the 3rd International Conference on Scour and Erosion, CURNET (Gouda, Netherlands: Technical University of Denmark).
Sutton, C. D. (2005). Classification and regression trees, bagging, and boosting (pp. 303–329). doi:10.1016/S0169-7161(04)24011-1
Taylor, K. E. (2001). Summarizing multiple aspects of model performance in a single diagram. J. Geophys. Res. Atmos. 106 (D7), 7183–7192. doi:10.1029/2000JD900719
Tseng, I.-F., Hsu, C.-H., Yeh, P.-H., and Lin, T.-C. (2022). Physical mechanism for seabed scouring around a breakwater—a case study in mailiao port. J. Mar. Sci. Eng. 10 (10), 1386. doi:10.3390/jmse10101386
Verhaeghe, H., De Rouck, J., and van der Meer, J. (2008). Combined classifier–quantifier model: a 2-phases neural model for prediction of wave overtopping at coastal structures. Coast. Eng. 55 (5), 357–374. doi:10.1016/j.coastaleng.2007.12.002
Wallis, M., Whitehouse, R., and Lyness, N. (2010). Development of guidance for the management of the toe of coastal defence structures. In Coasts, marine structures and breakwaters: Adapting to change: Proceedings of the 9th international conference organised by the Institution of Civil Engineers and held in Edinburgh on 16 to 18 September 2009. Thomas Telford Ltd., 696–707.
Yang, J., Low, Y. M., Lee, C.-H., and Chiew, Y.-M. (2018). Numerical simulation of scour around a submarine pipeline using computational fluid dynamics and discrete element method. Appl. Math. Model. 55, 400–416. doi:10.1016/j.apm.2017.10.007
Yeganeh-Bakhtiary, A., EyvazOghli, H., Shabakhty, N., and Abolfathi, S. (2023). Machine learning prediction of wave characteristics: comparison between semi-empirical approaches and DT model. Ocean. Eng. 286 (2), 115583. doi:10.1016/j.oceaneng.2023.115583
Yeganeh-Bakhtiary, A., EyvazOghli, H., Shabakhty, N., Kamranzad, B., and Abolfathi, S. (2022). Machine learning as a downscaling approach for prediction of wind characteristics under future climate change scenarios. Complexity 2022, 8451812. doi:10.1155/2022/8451812
Yeganeh-Bakhtiary, A., Houshangi, H., and Abolfathi, S. (2020). Lagrangian two-phase flow modeling of scour in front of vertical breakwater. Coast. Eng. J. 62 (2), 252–266. doi:10.1080/21664250.2020.1747140
Zanuttigh, B., Formentin, S. M., and van der Meer, J. W. (2016). Prediction of extreme and tolerable wave overtopping discharges through an advanced neural network. Ocean. Eng. 127, 7–22. doi:10.1016/j.oceaneng.2016.09.032
Glossary
Keywords: random forest, gradient boosted decision trees, Support Vector Machine Regression, marine and coastal management, coastal hazards mitigation, toe scouring, sloping structures
Citation: Habib MA, Abolfathi S, O’Sullivan JJ and Salauddin M (2024) Efficient data-driven machine learning models for scour depth predictions at sloping sea defences. Front. Built Environ. 10:1343398. doi: 10.3389/fbuil.2024.1343398
Received: 23 November 2023; Accepted: 26 January 2024;
Published: 09 February 2024.
Edited by:
Nobuhito Mori, Kyoto University, JapanReviewed by:
Sooyoul Kim, Kumamoto University, JapanMohammad Khajehzadeh, Islamic Azad University, Anar, Iran
Copyright © 2024 Habib, Abolfathi, O’Sullivan and Salauddin. This is an open-access article distributed under the terms of the Creative Commons Attribution License (CC BY). The use, distribution or reproduction in other forums is permitted, provided the original author(s) and the copyright owner(s) are credited and that the original publication in this journal is cited, in accordance with accepted academic practice. No use, distribution or reproduction is permitted which does not comply with these terms.
*Correspondence: M. Salauddin, md.salauddin@ucd.ie