 Junren Yang
 Jun Xie1
- 1School of Traffic and Transportation Engineering, Changsha University of Science and Technology, Changsha, China
- 2Liuyang City Highway Construction and Maintenance Center, Liuyang, China
- 3Guangxi Hetian Highway Co., Guangxi, China
Based on the confined test results and the viscoelastic constitutive model of asphalt mixtures, a three-dimensional finite element model of an asphalt pavement was established to study the effect of different working conditions on asphalt pavement. With the actual pavement structure response, a comparative analysis was conducted to assess the stress and strain experienced by the asphalt pavement under various working conditions. The results show that the asphalt pavement structure model can reflect the effect of different working conditions on asphalt pavement; the transverse stress and strain of asphalt pavement are most significantly affected by the working conditions during cornering, and the position of the maximum value is concentrated on the outer edge line of the wheel and a distance away from it; however, the longitudinal tensile stress and strain of the asphalt pavement are most significantly impacted by the working conditions of driving and braking, and the position of the maximum value is mainly distributed in the center line of the single wheel. The research results can provide a reference for the design of asphalt pavement structures.
1 Introduction
In the calculation of theoretical mechanics for traditional asphalt pavement, the asphalt pavement is usually considered as a layered elastic system. In fact, the material of the asphalt pavement surface course has obvious stress and temperature dependences. With variations in temperature and load, the mechanical properties of this material undergo alterations as is characteristic of viscoelastic substances. Therefore, the mechanical behavior of asphalt mixture is described by considering the viscoelastic properties, which are used to calculate the pavement structure, which can be closer to the actual situation.
Many scholars at home and abroad have studied the viscoelastic properties of asphalt mixtures. Williams et al. (1955) proposed the WLF equation of time-temperature equivalence by studying the time-temperature equivalence principle of viscoelastic materials, which greatly simplified the process of solving linear viscoelastic problems. Erkens et al. (1999) used repeated or dynamic loading tests to study and assess the deformation properties of asphalt mixtures and to establish prediction models. Sousa et al. (2006) developed a non-linear elastic-viscous model of asphalt mixtures. However, it is important to mention that the model does not accurately depict the permanent deformation response of asphalt mixtures when subjected to repeated loads. Cai et al. (2014) carried out three constant strain rate tests on graded asphalt mixtures using a discrete element model and then adopted a modified Burger model with bending and torsion resistances to simulate the constant strain rate test of these mixtures. The simulation outcomes are in strong accord with the laboratory findings, indicating that the modified Burger is a useful tool to simulate the bending and torsion resistances of asphalt mixtures. Arabani and Kamboozia (2014) established a study conducted on a viscoelastic test model of glass asphalt mixture to investigate how the creep properties of the mixture are affected by loading stress and temperature. At the same time, the experimental results were compared with the predicted results of Burgers model. The findings indicated that the experimental viscoelastic model and the Burgers model have good accuracy in simulating the creep response of materials in the viscoelastic range. Pei et al. (2016) used the improved Burgers model to construct the non-linear viscoelastic asphalt mixture model. The three parameters of the improved Burgers model are closely related to the test temperature and stress, and their quantitative relationship is established. Xu Shifa (Xu, 1992) created a model that is based on the Burgers model but has four units and five parameters. By utilizing test data, the parameters of the model were determined. It was observed that this model is capable of more accurately representing the “consolidation effect” of asphalt mixtures.
The application of the visco-elasto-plastic mechanics model of asphalt mixtures is closer to the actual pavement situation, which is still more complicated (Miao-juan and Zhi-hong, 2006; Dong and Tan, 2015). The applicability and simplicity of the model need to be further studied, and the traditional layered elastic system of asphalt pavement cannot accurately characterize the mechanical behavior of the actual pavement structure. In general, a set of recognized, simple, and easy-to-solve constitutive theory of viscoelastic materials has not yet been formed.
In order to analyze the mechanical behavior of actual asphalt pavement, a three-dimensional asphalt pavement structure model is established using finite element software such as ANSYS or ABAQUS (Dong, 2013; Koohmishi, 2013; Si et al., 2018; Liu et al., 2019; Zhang, 2020a). According to the structural thickness and material parameters of the actual pavement, different constitutive relations are selected, and force fields, such as vehicle load and temperature, are applied as close as possible to the actual pavement. Meanwhile, to analyze the structural response of asphalt pavement, other environmental factors that are similar are taken into consideration. By combining with the use situation of the actual pavement, its performance and stress are judged and analyzed.
The researchers conducted the repeated load permanent deformation test in this study. Based on the viscoelastic properties of asphalt mixtures, the modified Burgers model and the multi-parameter regression analysis, the viscoelastic parameters and permanent deformation law of asphalt mixtures were obtained, and the applicability of the model was verified. In addition, the three-dimensional asphalt pavement structure model was established by using the finite element calculation software ABAQUS, and the structural response of asphalt pavement under different driving working conditions was analyzed. Through the structural response, the shear deformation law of asphalt pavement was finally analyzed. This study can provide a reference for the structural design of asphalt pavements.
2 Viscoelastic constitutive model theory of the asphalt mixture
2.1 Burgers model
Asphalt mixture is a typical viscoelastic-plastic material. It shows different characteristics in different temperature ranges. It has linear elasticity at low temperatures and small deformation, viscoelasticity at high temperatures and large deformation, and viscoelasticity at temperature transition ranges. Therefore, the appropriate viscoelastic mechanical model should be selected for in-depth study to obtain the viscoelastic parameters of asphalt mixture.
The Kelvin model can describe the creep behavior but cannot reflect the phenomenon of instantaneous elastic deformation and stress relaxation. The mechanical behavior is obviously inconsistent with the viscoelastic deformation behavior of asphalt mixture. The Maxwell model can reflect the elastic and viscous characteristics, but the characteristics of the viscous fluid are closer to the fluid in nature, which is far from the deformation characteristics of the typical viscoelastic solid material (asphalt mixture).
As shown in Figure 1, the Burgers model is composed of the Kelvin and Maxwell models in series, which can better describe the mechanical behavior of asphalt mixture in a certain temperature range. By solving the viscoelastic parameters of the mechanical elements in the model, the constitutive equation can predict the stress-strain relationship of the material. This model can reflect instantaneous elastic deformation, viscoelastic deformation, and viscous flow deformation. However, the viscous flow deformation is expressed as a linear function of loading time, and the actual viscosity increases as the loading increases. Therefore, the increment of permanent deformation decreases with the time. Therefore, the model cannot well reflect the deformation characteristics of asphalt mixture in the whole loading and unloading process.
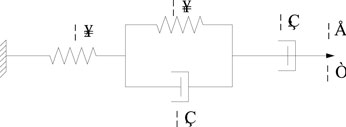
FIGURE 1. Burgers model.
2.2 Modified Burgers model
In Figure 2, an improved Burgers model, namely, the modified Burgers model, is proposed in this study; the “consolidation effect” of asphalt mixture can be demonstrated by this, and better describe the high temperature deformation law of asphalt mixture (Xu, 1992).

FIGURE 2. Modified Burgers model.
The model extends the external sticky pot element that characterizes the viscous flow deformation characteristics of the material in the Burgers model to a generalized sticky pot, and its viscosity is expressed as:
where
Zhang Yuqing (Zhang and Xiao-ming, 2008) derived the functional expression of the permanent strain under repeated loading and obtained the functional relationship between
where
2.3 Revised Burgers model fitting formula
The test data cannot be directly fitted using Formula 1. Therefore, it is also necessary to substitute the half-sine wave load used in the repeated load permanent deformation test into Formula 1, including the loading time
where
3 Testing
3.1 Raw materials
In this study, asphalt mixtures AC-13, AC-20, and AC-25 widely used in China’s expressway asphalt pavement were adopted. In all of them, the asphalt is 70 # road petroleum asphalt and the aggregate is limestone. The gradation of these three asphalt mixtures is shown in Table 1.

TABLE 1. Gradation of the three asphalt mixtures.
The optimum asphalt-aggregate ratio of the asphalt mixture was determined by the Marshall test. The optimum asphalt-aggregate ratios of AC-13, AC-20, and AC-25 are 5.0%, 3.8%, and 3.6%, respectively.
With the optimal asphalt-aggregate ratio, the specimen was molded using the rotary compaction method. After demoulding, the molded specimen was 170 mm in height and 100 mm in diameter. With its two ends cut, a specimen with a height of 150 mm and a diameter of 100 mm was obtained, as shown in Figure 3.

FIGURE 3. Specimen after cutting at both ends.
3.2 Lateral repeated loading test
In this paper, a simple performance testing machine (SPT) was used to test the permanent deformation of AC-13, AC-20, and AC-25 with lateral repeated loads. The confining pressure was 138 Kpa, and it remained constant throughout the whole testing process. In addition, the stress level was 0.7 Mpa; the loading waveform was half-sine wave intermittent load; the loading time was 0.1 s; the intermittent time was 0.9 s; the temperatures were 40°C and 60°C; and the number of specimens in each group of parallel tests was three. The experimental device is shown in Figure 4.
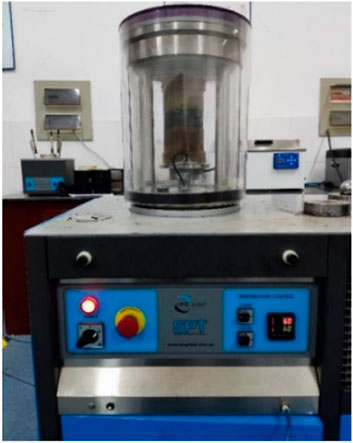
FIGURE 4. Simple performance tester (SPT).
3.3 Data processing analysis and model applicability verification
The test results of AC-13, AC-20, and AC-25 at the same stress level and different temperatures are shown in Figure 5. Additionally, the test results of the same mixture under the above conditions are displayed in Figures 6, 7.
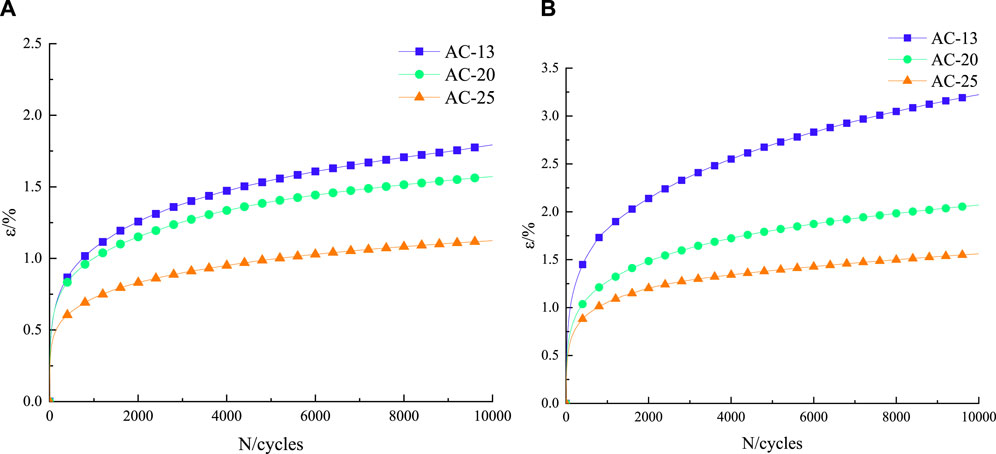
FIGURE 5. Permanent strain curves of AC-13, AC-20, and AC-25 at 40°C (A) and 60°C (B).
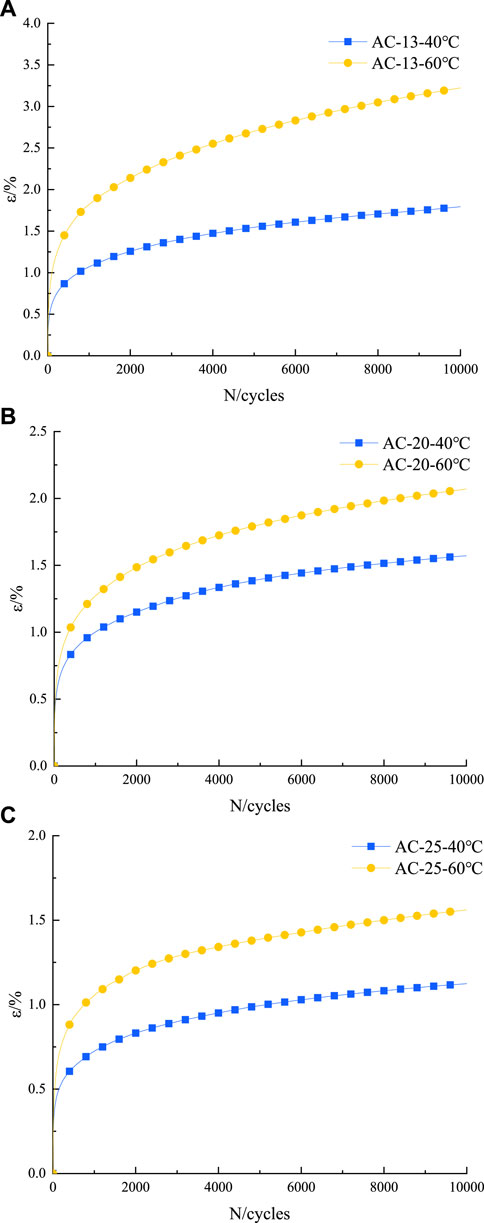
FIGURE 6. Permanent strain curves of AC-13 (A), AC-20 (B), and AC-25 (C) at 40°C and 60°C.
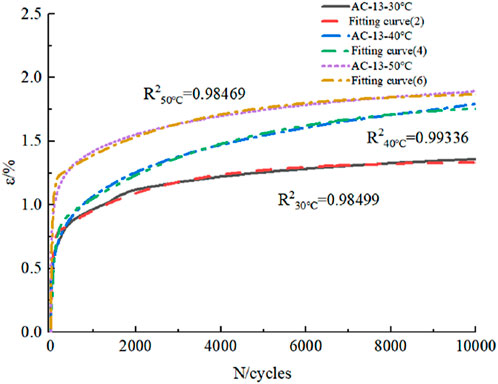
FIGURE 7. Fitting test data of AC-13, AC-20, and AC-25 using Formula 3.
Figure 5 reveals that the permanent deformation of asphalt mixtures escalates as the number of loading cycles amplifies. Additionally, it demonstrates that asphalt mixtures with different gradations exhibit two distinct stages of permanent deformation growth, that is, the rapid growth stage of strain and the relatively stable stage of strain growth.
By observing Figure 6, we can ascertain that the stress level remains consistent and the loading cycle remains constant; the permanent deformation of asphalt mixtures continues to increase as the temperature increases, indicating that the increase of temperature has a great influence on the high temperature deformation resistance of asphalt mixtures.
The multi-parameter regression analysis of the permanent strain change curves of asphalt mixtures at 40°C and 60°C with the number of loading cycles was carried out to obtain the mechanical model parameters
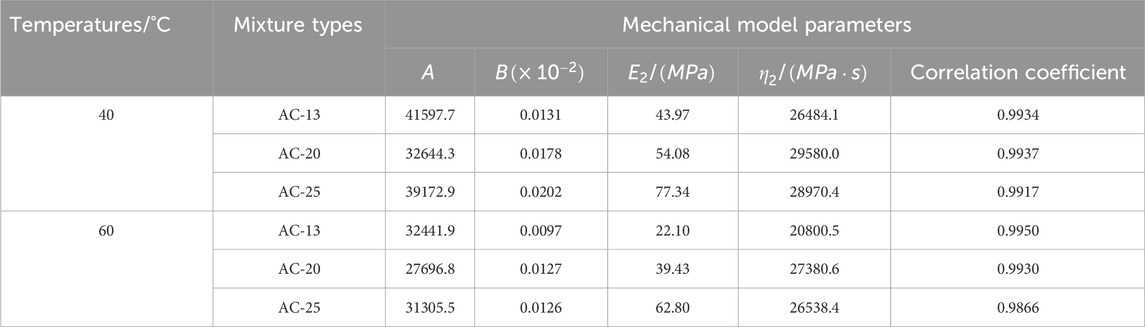
TABLE 2. Regression of mechanical model parameters.
To verify the applicability of the model, the repeated load permanent deformation test of AC-13 at 30°C, 50°C, and 0.7 Mpa was conducted, and the test results are shown in Figure 7. It can be seen that the red curve is the measured value of the test, the blue curve is its fitting value, and the correlation coefficient is 0.98499. It is demonstrated that the permanent strain mechanical model equation derived from viscoelastic mechanics under repeated load can accurately characterize the variation law of permanent deformation of asphalt mixtures in the rapid growth stage and relatively stable stage of strain.
4 Establishment of three-dimensional pavement structure model
In this research, an asphalt pavement structure with a typical semi-rigid base was selected to study its structural dynamic response under non-uniform three-dimensional stress.
4.1 Model parameters setting
In this paper, the representative values of the dynamic modulus of each structural layer were selected; the surface courses of AC-13, AC-20, and AC-25 were chosen, respectively. Considering its viscoelastic properties, the structural damping coefficient 0.05 of the base course and the soil base was taken.
In ABAQUS, the parameters of viscoelastic material were generally defined by inputting the Prony series parameters of the shear relaxation modulus. Based on the convolution relationship between the creep compliance and the relaxation modulus, the modified Burgers model is used to determine the parameters of the viscoelastic material. The viscoelastic parameters of the modified Burgers model were transformed into the Prony series form of the shear relaxation modulus by the Laplace transform, as shown in Table 3.
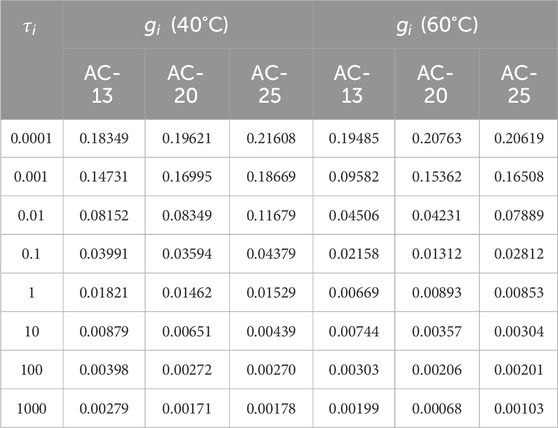
TABLE 3. Input model parameters.
4.2 Establishment of pavement structure model
Before modeling, the pavement structure was simplified. According to the current specification requirements, the structural layers were regarded as completely continuous, and infinite elements were added around the model to reflect the non-reflective boundary conditions. The road surface model is shown in Figure 8. It can be seen that both the length and width of the model are 3 m, and the depth direction regarding the structure of the pavement is 2 m. In this study, the dual-wheel spacing is 0.320 m and the single-wheel grounding width is 0.223 m; therefore, the total loading width is 0.543 m. The pavement model unit type adopts C3D8R, which reduces the amount of calculation by refining the finite element mesh in the loading area along the wheel path. It is 23.4 cm long and 32 cm wide (middle) at the place where the loading needs to be analyzed. The mesh is fine, and the mesh density is reduced in other parts to locally refine the mesh. The minimum size is 0.02 m and the maximum size is 0.2 m. The central part of the grid is 19 according to the number of transverse roads, 30 along the driving direction(y-axis), and the surrounding grids are encrypted toward the middle.
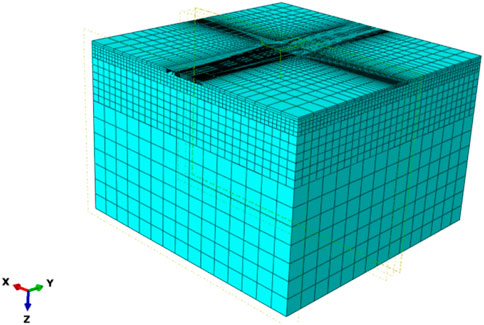
FIGURE 8. Finite element model of pavement structure.
The technical route of finite element modeling is shown in Figure 9.
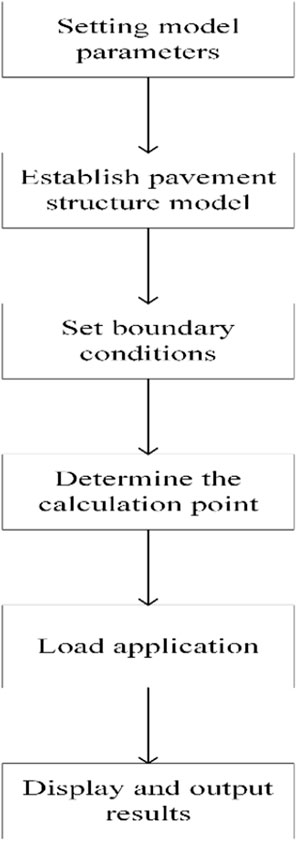
FIGURE 9. Finite element modeling route.
4.3 Boundary condition setting
The boundary conditions of the model are set, the bottom is fixed, and the four sides of the model are symmetrically constrained. According to the current specification requirements, each structural layer is considered to be completely continuous, and infinite elements are added around the model to reflect the non-reflective boundary conditions.
4.4 Load application
In order to ensure continuous and in-depth study, the moving load in this paper uses the tire load in Zhang (2020b). Moreover, DLOAD was adopted to realize the pressure loading on the user defined surface, and UTRACLOAD was utilized to achieve the arbitrary distributed force loading on the user defined surface. The relationship among the distributed force coordinate and time was provided by the DLOAD and UTRACLOAD subroutines to simulate the application of non-uniform moving load.
In this study, the x-axis, y-axis, and z-axis were the transverse, driving, and depth directions of the pavement structure, respectively. The moving load working conditions were divided into four types: cornering, driving, braking, and free rolling working conditions. The cornering angle of the cornering working condition was 8°; the angular velocity of the driving and braking working conditions was 46.0588 rad/s and 40.0588 rad/s, respectively; and the free rolling speed was 80 km/h.
4.5 Description for calculation and analysis point
In this study, research was focused on the analysis of the stress and strain between the dual-wheel and road surface and between the road structure layers under different load working conditions. Figure 10 presents the schematic diagram illustrating the calculation and analysis points, where A is the center line of dual wheels, B is the inner side line of the wheel edge, C is the center line of the single wheel, D is the outer side line of the wheel edge, and E is a calculation point line a distance away from the outer side of the wheel edge. The actual distance can be determined according to the distribution of stress and strain.
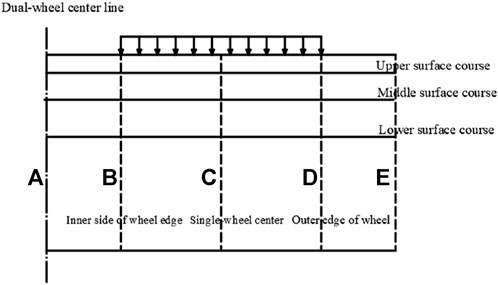
FIGURE 10. Calculation and analysis point.
5 Response analysis of asphalt pavement viscoelastic structure
If the results of the chart are not specially marked or explained, all the models are the outcomes of analyzing the viscoelastic structure of asphalt pavement at 40°C.
5.1 Analysis of the maximum principal stress and strain along the direction of X-Y planes
From Figures 11 and 12, it can be seen that:
(1) Except for the maximum principal strain of the cornering working condition being biased toward the turning side, the maximum principal strain and stress distributions of the other working conditions show the same law, which have obvious symmetry. The stress distribution of the free rolling condition shows uniformity, which is roughly symmetrical along the center line of the two wheels, and is roughly symmetrical along the transverse axis of the tire center.
(2) The largest values of stress and strain occur during cornering. The distributions of the maximum principal stress and strain values are very close to the outer side line D and at the edge line of the wheel edge, respectively.
(3) In the driving working condition, the vehicle has large tensile and compressive stresses on the driving direction (the direction y) and reverse driving direction of the pavement, respectively. In the braking working condition, the force is opposite to the driving working condition, which is consistent with the actual situation.
(4) The maximum principal strain value of the cornering condition is the largest compared with the other three load conditions, and the maximum principal strain value is distributed at the tire edge line. This finding also explains that the cornering condition has a greater destructive force on the road surface, and the outer side of the vehicle wheel track will cause the road surface to move and generate a more obvious rutting effect.
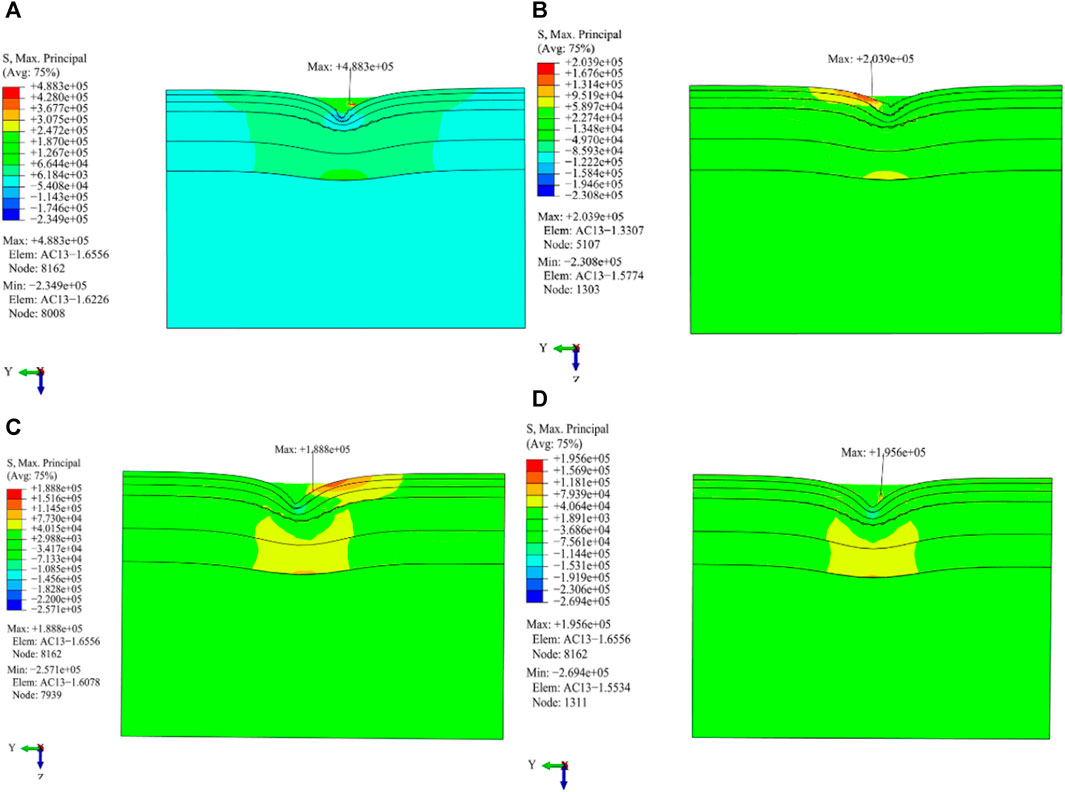
FIGURE 11. The maximum principal stress of the pavement is distributed differently under different load working conditions. (A) Cornering working condition; (B) Driving working condition; (C) Braking working condition; (D) Free rolling working condition.
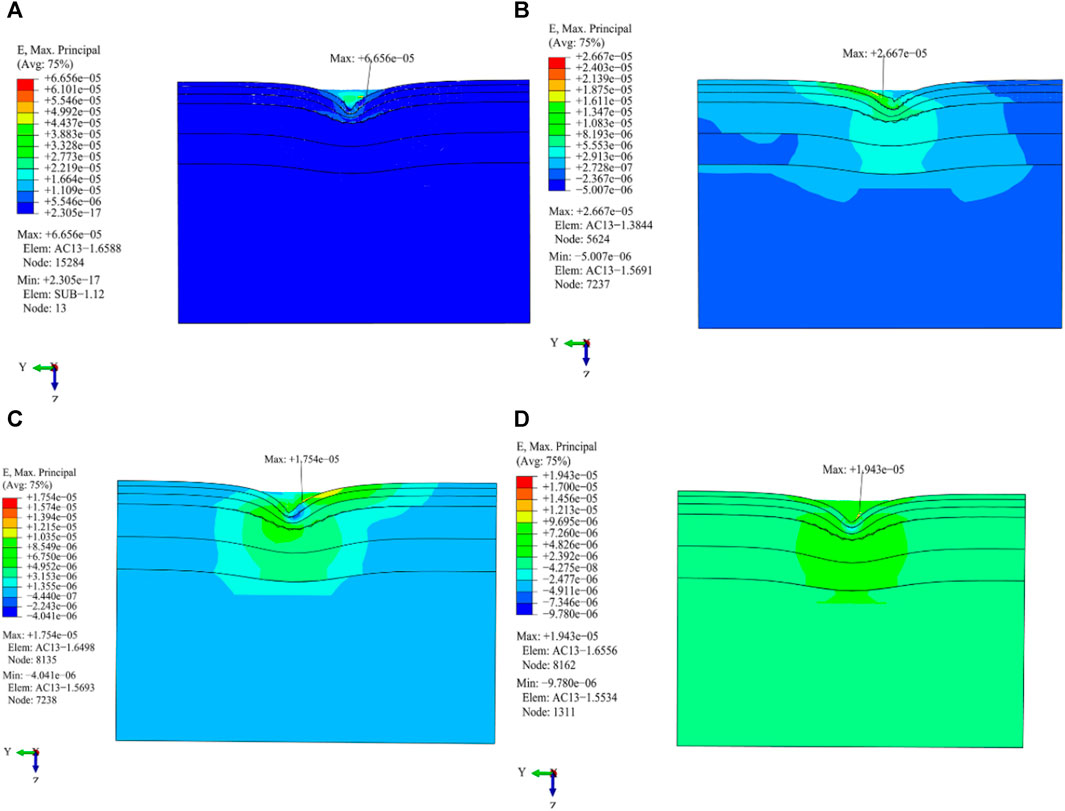
FIGURE 12. Distribution of the maximum principal strain of the pavement under different load working conditions. (A) Cornering working condition; (B) Driving working condition; (C) Braking working condition; (D) Free rolling working condition.
From the analysis of the stress and strain of the pavement, it was found that the maximum strain does not necessarily appear at the position where the maximum three-way stress is generated.
5.2 Analysis of the maximum principal stress and strain along the direction of X-Z planes
In Figures 13 and 14, it is shown that:
(1) Except for that of the cornering working condition, there is clear symmetry in the distribution of the maximum principal stress and strain for the other three load working conditions. The cornering and driving working conditions produce a large principal stress on the pavement.
(2) The highest value of principal strain under the condition of cornering is the largest among the four load working conditions. The greatest magnitude of the principal strain of the cornering and driving working conditions appears at the outer edge line of the right and left wheels on the AC-13 pavement layer, respectively, while the greatest magnitude of the principal strain of the driving and the free rolling working conditions occurs at the center line of the right wheel on the AC-25 pavement layer.
(3) The maximum principal strain of the above four load working conditions is not the position of the maximum principal stress.
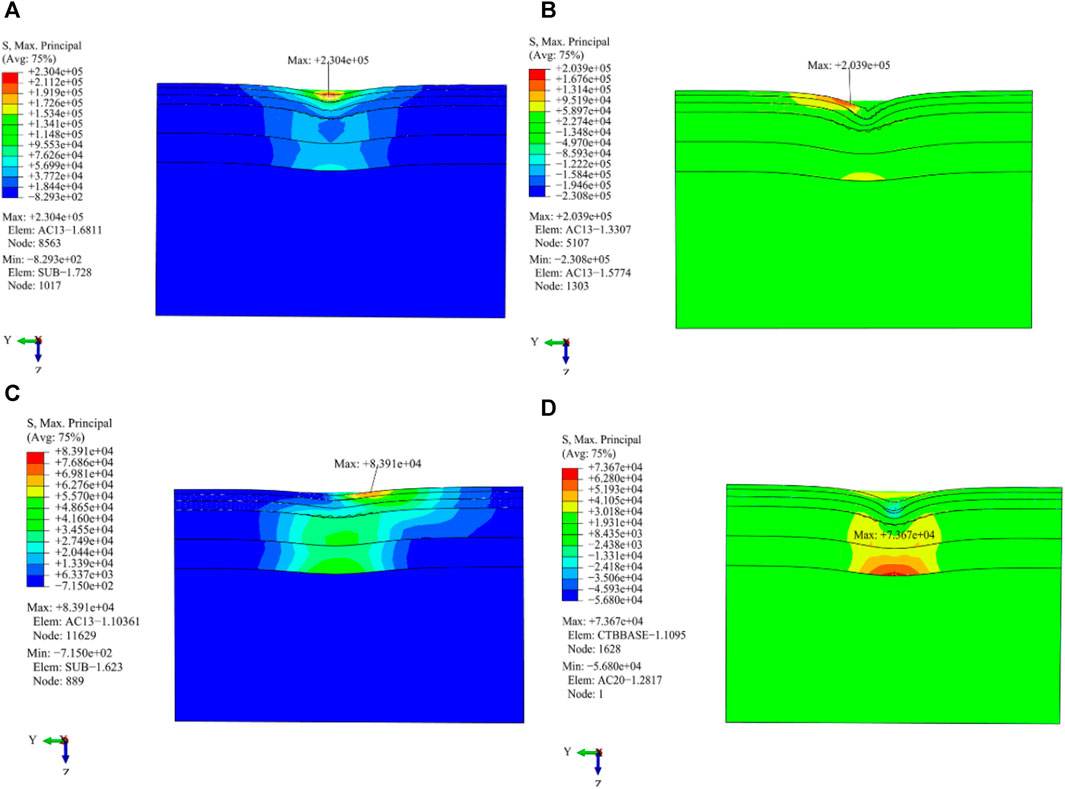
FIGURE 13. Distribution of the maximum principal stress in the vertical driving direction under different load working conditions. (A) Cornering working condition; (B) Driving working condition; (C) Braking working condition; (D) Free rolling working condition.
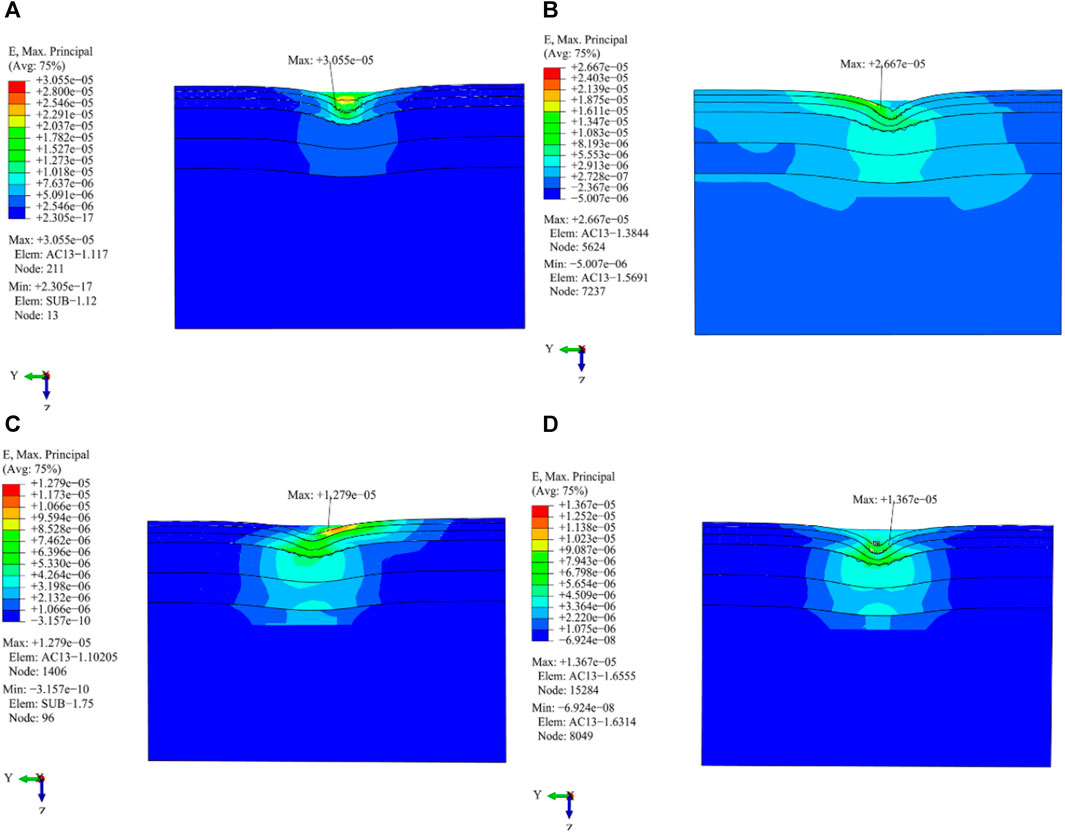
FIGURE 14. Distribution of the maximum principal strain in the vertical driving direction under different load working conditions. (A) Cornering working condition; (B) Driving working condition; (C) Braking working condition; (D) Free rolling working condition.
5.3 Analysis of transverse tensile stress and strain along the direction of X-Z planes
As shown in Figures 15 and 16, it can be found that:
(1) The position of the maximum transverse tensile strain value is different from that of the maximum transverse tensile stress value. The maximum value for transverse tensile stress is situated at the midpoint of the subgrade and dual wheels, and the maximum transverse strain value is distributed at the outer edge line of the wheel or a distance away from it.
(2) Al the four load working conditions produce larger transverse tensile stress at the edge of the wheel and the center line of the subgrade and dual wheels. The driving, braking, and free rolling working conditions generate stress concentration on the AC-25 pavement layer under the outer line of the wheel.
(3) The distribution of transverse tensile strain of the other three load working conditions shows obvious symmetry except for that of the cornering working condition. The outer edge of the wheel experiences a greater amount of transverse tensile strain. In particular, the highest level of transverse tensile strain is observed when the wheel is in a cornering working condition.
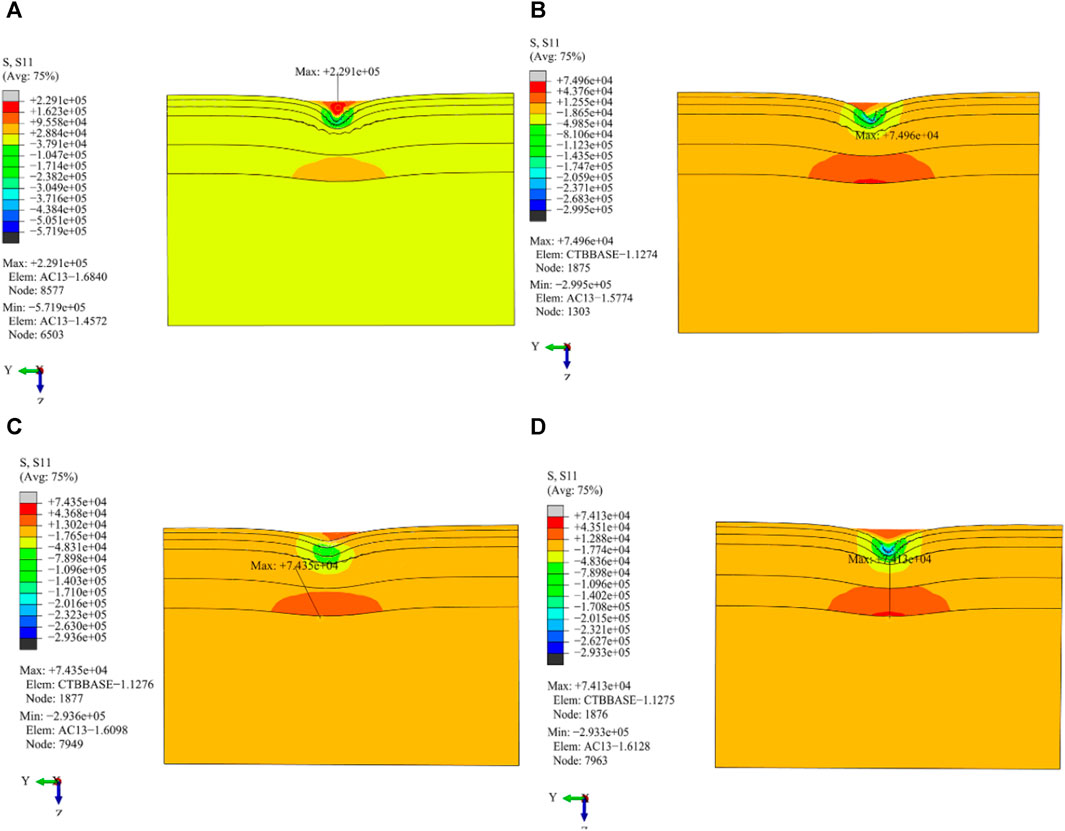
FIGURE 15. Distribution of transverse tensile stress in the vertical driving direction under different load working conditions. (A) Cornering working condition; (B) Driving working condition; (C) Braking working condition; (D) Free rolling working condition.
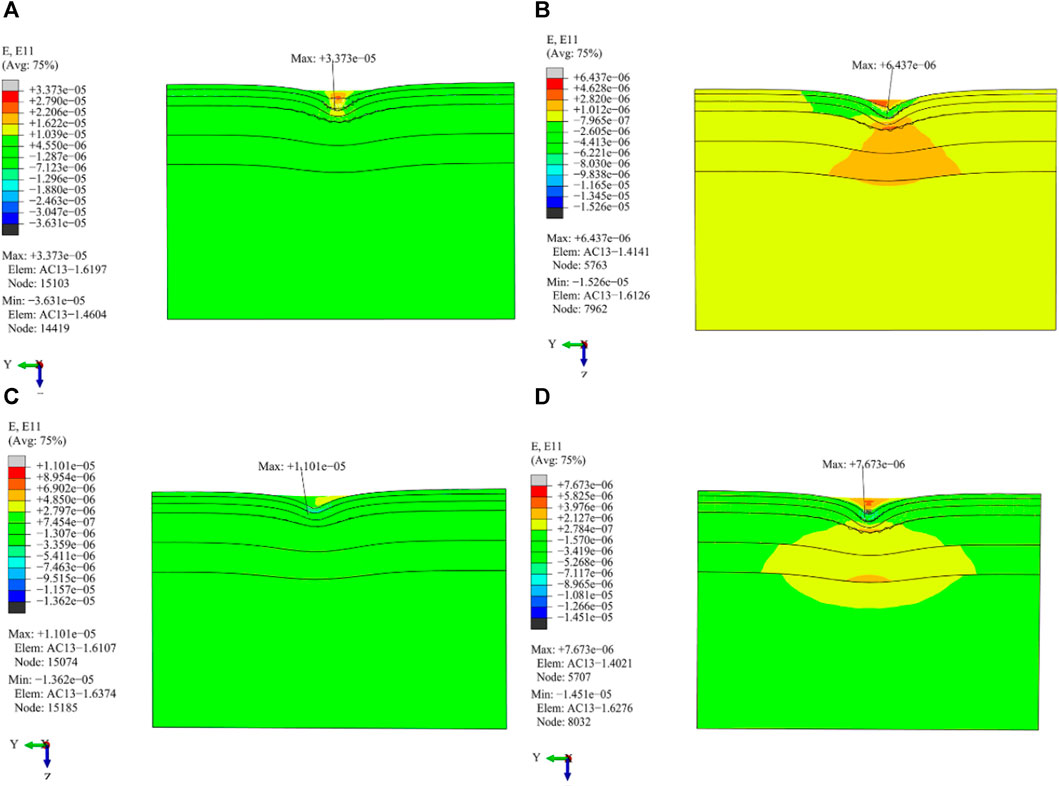
FIGURE 16. Distribution of transverse tensile strain in the vertical driving direction under different load working conditions. (A) Cornering working condition; (B) Driving working condition; (C) Braking working condition; (D) Free rolling working condition.
5.4 Analysis of longitudinal tensile stress and strain along the direction of X-Z planes
It can be seen from Figures 17 and 18 that:
(1) The driving working condition produces larger longitudinal tensile stress and strain values on the pavement layer, which is differently distributed. The maximum longitudinal tensile stress and strain values are distributed at the center line of the left wheel and single wheel on the AC-13 pavement layer, respectively.
(2) The maximum transverse tensile stress generated by the cornering condition is the largest, which is located at a distance from the tire edge line on the right side of the AC-13 pavement layer. The transverse tensile stress distribution of the remaining conditions is symmetrically distributed, and the maximum transverse tensile stress is located at the center line of the roadbed-double wheel.
(3) Except for that of the cornering working condition, the distribution of longitudinal tensile stress and strain stresses of the other three load working conditions show obvious symmetry.
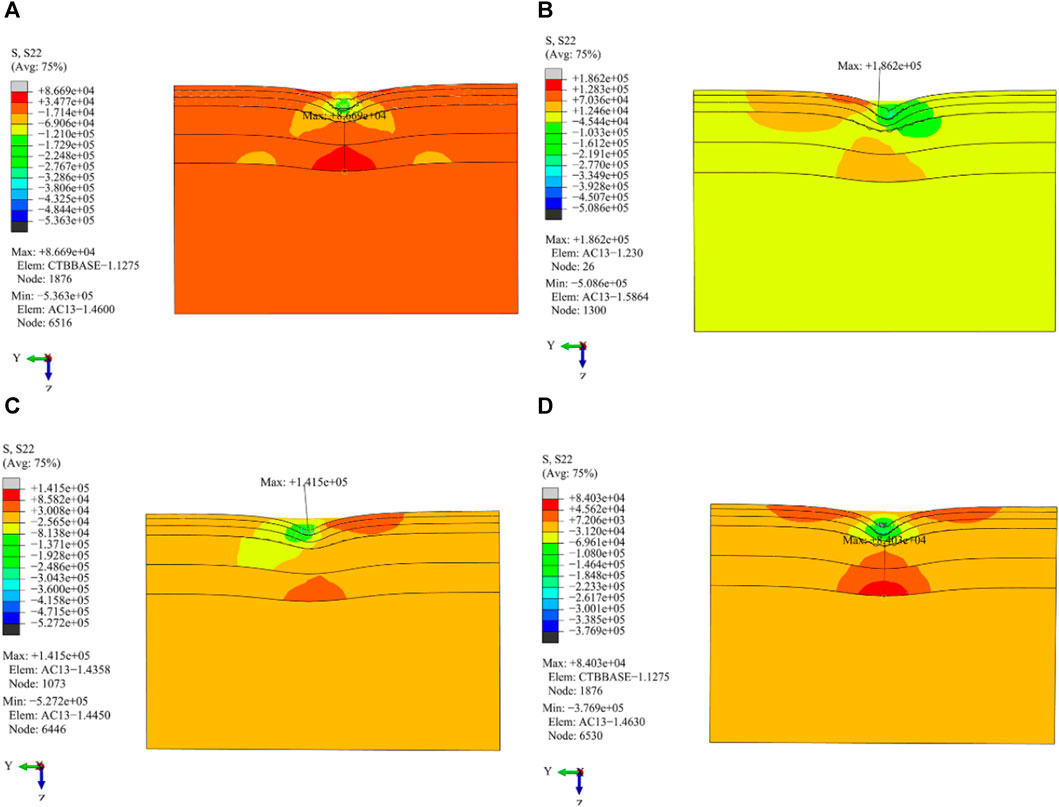
FIGURE 17. Distribution of longitudinal tensile stress in the vertical driving direction under different load working conditions. (A) Cornering working condition; (B) Driving working condition; (C) Braking working condition; (D) Free rolling working condition.
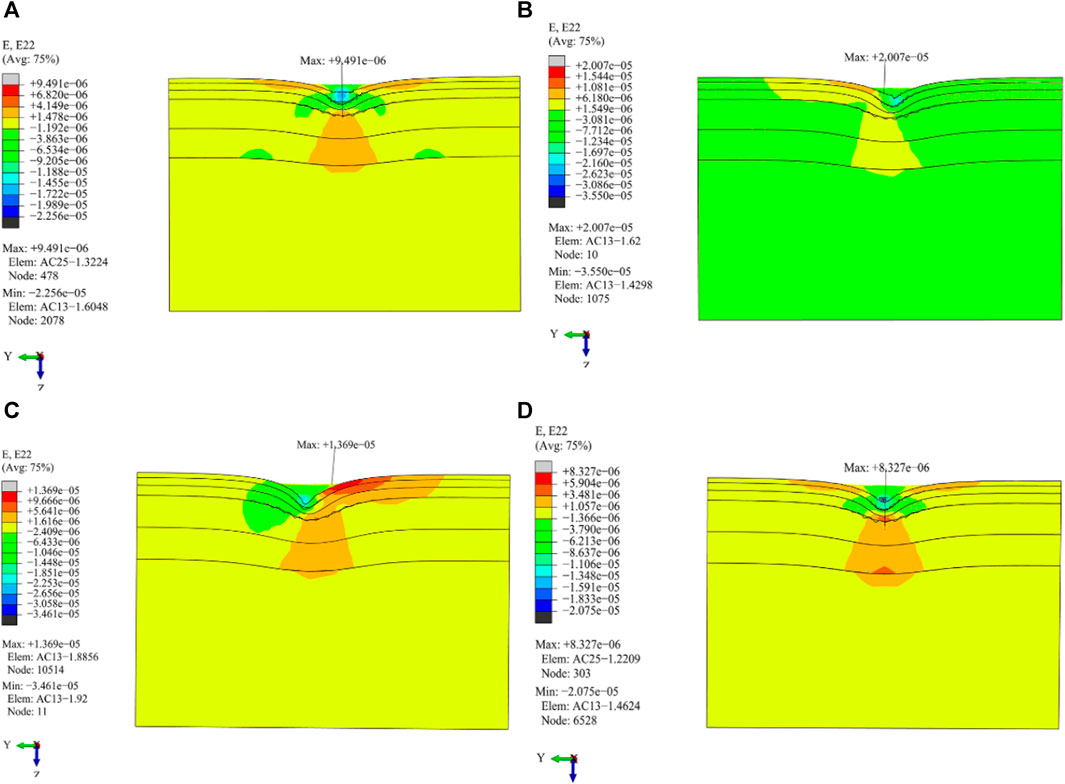
FIGURE 18. Distribution of longitudinal tensile strain in the vertical driving direction under different load working conditions. (A) Cornering working condition; (B) Driving working condition; (C) Braking working condition; (D) Free rolling working condition.
5.5 Shear stress and strain along the direction of X-Z planes
From Figures 19 and 20, it is demonstrated that:
(1) The shear stress distribution of the driving and braking working conditions is roughly anti-symmetrical except for that of the cornering working condition; however, there is no shear stress distribution in the free rolling working condition of the section in the middle of the area where the wheel touches the road surface.
(2) Among the four load working conditions, in the driving and cornering working conditions, the maximum shear stress value is highest and lowest, respectively. The inner edge line of the wheel experiences the maximum shear stress value during cornering. The outer edge line of the wheel, on the other hand, exhibits the highest shear stress and strain values of the remaining working conditions.
(3) Except for that of the cornering working condition, the shear strain distribution law of the other three load work conditions is consistent with that of shear stress. There is no strain generated in this section under the free rolling working condition.
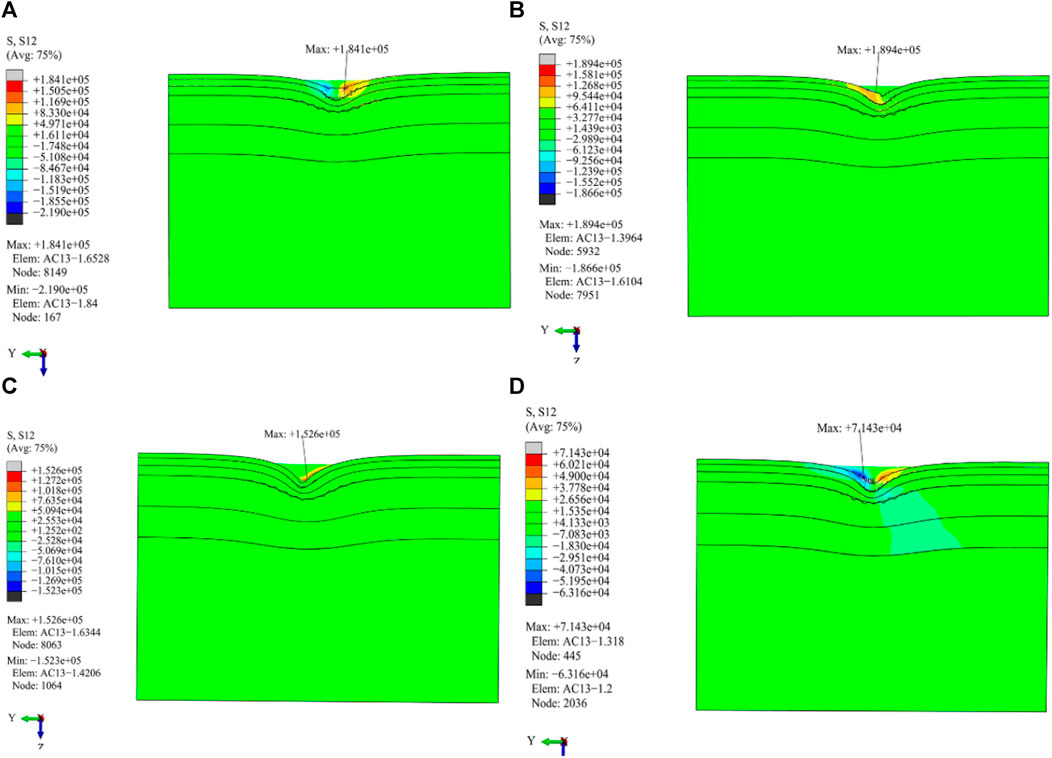
FIGURE 19. Distribution of shear stress in the vertical driving direction under different load working conditions. (A) Cornering working condition; (B) Driving working condition; (C) Braking working condition; (D) Free rolling working condition.
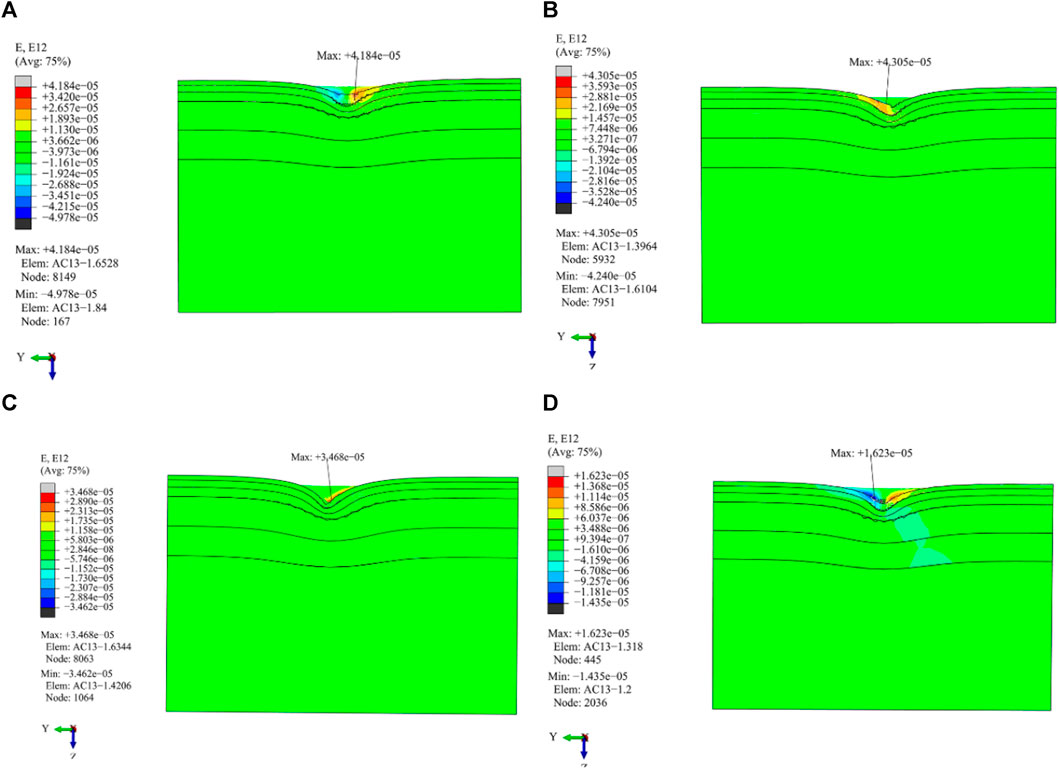
FIGURE 20. Distribution of shear strain in the vertical driving direction under different load working conditions. (A) Cornering working condition; (B) Driving working condition; (C) Braking working condition; (D) Free rolling working condition.
6 Conclusion
(1) The maximum principal stress generated by the pavement structure under different load working conditions is significantly different. Among them, the maximum principal stress value produced by the cornering working condition is the largest, and the stress concentration effect along the cornering direction is obvious. The pavement is most affected by the working condition of cornering, and the stress and strain generated in this condition are kept at a high level, which is also one of the main driving reasons leading to pavement diseases.
(2) Except for the cornering condition, the transverse tensile stress and strain of the other three load conditions are mainly distributed on both sides of the wheel. The maximum transverse tensile strain produced by the working condition is the largest, and the position of the maximum transverse tensile strain appears in the AC-13 pavement layer. The maximum transverse tensile strain does not necessarily occur at the maximum transverse tensile stress value.
(3) Under the cornering condition, the maximum transverse tensile stress and transverse tensile strain are generated at a distance E from the outer edge of the tire. The transverse tensile stress is one of the important reasons for the longitudinal cracks and transverse displacement of the road.
(4) Under different working conditions, the distribution of shear stress on the pavement varies significantly. Except for that of the cornering working condition, the shear stress of the other three load working conditions is basically anti-symmetrically distributed. The maximum shear stress and strain occur at the outer periphery of the wheel.
Data availability statement
The original contributions presented in the study are included in the article/Supplementary material, further inquiries can be directed to the corresponding author.
Author contributions
JY: Writing–review and editing. JX: Writing–review and editing. XT: Writing–review and editing. HZ: Writing–review and editing.
Funding
The author(s) declare that financial support was received for the research, authorship, and/or publication of this article. The funding comes from the National Natural Science Foundation of China (grant numbers: 51978083).
Conflict of interest
Author HZ was employed by Guangxi Hetian Highway Co.
The remaining authors declare that the research was conducted in the absence of any commercial or financial relationships that could be construed as a potential conflict of interest.
Publisher’s note
All claims expressed in this article are solely those of the authors and do not necessarily represent those of their affiliated organizations, or those of the publisher, the editors and the reviewers. Any product that may be evaluated in this article, or claim that may be made by its manufacturer, is not guaranteed or endorsed by the publisher.
References
Arabani, M., and Kamboozia, N. (2014). New achievements in visco-elastoplastic constitutive model and temperature sensitivity of glasphalt. Int. J. Pavement Eng. 15 (9), 810–830. doi:10.1080/10298436.2014.893317
Cai, W., McDowell, G. R., and Airey, G. D. (2014). Discrete element visco-elastic modelling of a realistic graded asphalt mixture. Soils Found. 54 (1), 12–22. doi:10.1016/j.sandf.2013.12.002
Dong, Z.-J (2013). Dynamic response analysis of asphalt pavement under three-directional nonuniform moving load. China Civ. Engin 46 (06), 122–130. doi:10.15951/j.tmgcxb.2013.06.003
Dong, Z.-J., and Tan, Y.-Q. (2015). Research on dynamic response of asphalt pavement. Beijing: Science Press.
Erkens, S., Molennar, A. A. A., and Scarpas, A. (1999). “Relating performance tests to fundamental material behavior,” in 7thConference on Asphalt Pavements for SouthernAfrica, VictoriaFalls, Zimbabwe, 29 August to 2 September 1999.
Koohmishi, M. (2013). Comparison of pavement layers responses with considering different models for asphalt concrete viscoelastic properties. Slovak J. Civ. Eng. 21 (2), 15–20. doi:10.2478/sjce-2013-0008
Liu, P., Chen, J., Lu, G., Wang, D., Oeser, M., and Leischner, S. (2019). Numerical simulation of crack propagation in flexible asphalt pavements based on cohesive zone model developed from asphalt mixtures. Materials 12 (8), 1278. doi:10.3390/ma12081278
Miao-juan, P., and Zhi-hong, X. U. (2006). Study of nonlinear principal structure model for permanent deformation of asphalt pavement. China Sci. Ser. G 36 (4), 415–426.
Pei, J., Fan, Z., Liu, H., Zhang, J., Li, R., and Li, Y. (2016). Nonlinear viscoelastic model for asphalt mixture subjected to repeated loading. Road. Mater. Pavement Des. 17 (4), 892–905. doi:10.1080/14680629.2015.1137781
Si, C., Cao, H., Chen, E., You, Z., Tian, R., Zhang, R., et al. (2018). Dynamic response analysis of rutting resistance performance of high modulus asphalt concrete pavement. Appl. Sci. 8 (12), 2701. doi:10.3390/app8122701
Sousa, J. B., Mansour, S., and Weissman, S. L. (2006). Development and use of the repeated shear test (constant height): an optional superpave mix design-tool. Washington D C: Strategic Highway Research: National Research Program Council, 32–34. Report No. SHRP-A-698.
Williams, M. L., Landel, R. F., and Ferry, J. D. (1955). The temperature dependence of relaxation mechanisms in amorphous polymers and other glass-forming liquids. Jam. Chem. Soc. 77 (4), 3701–3707. doi:10.1021/ja01619a008
Xu, S.-F. (1992). A rheological model for characterizing the high and low temperature creep properties of asphalt and asphalt mixtures. Mech. Pract. 14 (1), 37–40.
Zhang, E. (2020a). “A study on the friction dynamic response of asphalt Pavement.Considering.the.Unevenness,” in IOP Conference Series: Earth and Environmental Science 455(1): 012145, Changchun, China, 23 August 2020 (Changsha, Hunan, China: IOP Publishing).
Zhang, H.-J. (2020b). Study on dynamic response of asphalt pavement structure under three-dimensional contact stress of tire-pavement. Changsha, China: Changsha University of Science and Technology.
Keywords: modified Burgers model, asphalt mixture, viscoelastic mechanical model, permanent deformation, finite-element model
Citation: Yang J, Xie J, Tang X and Zhang H (2024) Study on the permanent deformation of asphalt mixtures based on the modified Burgers model. Front. Built Environ. 10:1357396. doi: 10.3389/fbuil.2024.1357396
Received: 18 December 2023; Accepted: 25 January 2024;
Published: 11 March 2024.
Edited by:
Francisco Alonso, University of Valencia, SpainReviewed by:
Huanan Yu, Changsha University of Science and Technology, ChinaRostand Moutou Pitti, Université Clermont Auvergne, France
Copyright © 2024 Yang, Xie, Tang and Zhang. This is an open-access article distributed under the terms of the Creative Commons Attribution License (CC BY). The use, distribution or reproduction in other forums is permitted, provided the original author(s) and the copyright owner(s) are credited and that the original publication in this journal is cited, in accordance with accepted academic practice. No use, distribution or reproduction is permitted which does not comply with these terms.
*Correspondence: Junren Yang, MTc0ODU3Njc4M0BxcS5jb20=