Automatic completion of geometric models from point clouds for analyzing historic timber roof structures
 Taşkın Özkan
 Norbert Pfeifer
 Georg Hochreiner2
- 1Research Unit of Photogrammetry, Department of Geodesy and Geoinformation, Technische Universität Wien, Vienna, Austria
- 2Institute for Mechanics of Materials and Structures (IMWS), Technische Universität Wien, Vienna, Austria
Laser scanners are being increasingly utilized in the engineering community to collect accurate and dense 3D data on timber roof structures. Point clouds, which are produced by either scanning or photogrammetry, can be subsequently processed using specialized software to create geometric models of individual components of the roof structure manually. Manual modeling of each structural element in a computer-aided-design-based structural analysis software application is a labor-intensive and time-consuming process, whereas automatic modeling typically yields incomplete results in terms of the numbers and sizes of individual beams owing to shortcomings in data acquisition or data processing. In the context of structural assessment, full-scale modeling of each beam is mandatory for a holistic analysis of structural health. This study addresses the gap between automated roof-structure models and preliminary structural assessments through a hierarchical analysis and refinement of the geometric model. The proposed method was applied to two different roof structures, and structural assessments show that it is feasible to import and process the generated models in a structural analysis software application. The resulting structural models indicate that the workflow improves the months of time consumed by optional mistakes from manual contributions to less than a week without the uncertainties caused by human error.
1 Introduction
Timber has been used for construction since before recorded history, and timber has remained as the primary construction material in “tree-rich” rural societies ever since. This reflects its easy availability, excellent mechanical properties, light weight, and ease of shaping (Smith and Snow, 2008). Additionally, using timber as the construction material offers advantages such as thermal insulation, high versatility, and ecological characteristics. However, there are also some disadvantages like uncertainties in the structural behavior because of its inhomogeneous nature, irregular shape, or surface damages (Cabaleiro et al., 2017). The primary issue here is that timber structures also require the same professionalism and skills as those expected for other building materials like concrete and steel. Therefore, structural models are indispensable for assessments. To assess the structural safety of a timber element, a preliminary diagnostic analysis involving visual or mechanical criteria is required. Additionally, it is necessary to conduct a strength check of each member by identifying the strength of the material through structural classification of timber. Assessments of the structural conditions and load-bearing capacities of timber roof structures are possible by structural analyses (Chapman et al., 2006; Yang et al., 2017). Thus, accurate and detailed data acquisition tools must be used to achieve consistent and complete structural assessments of historic timber-based constructions (Santos et al., 2022).
Structural assessments of timber structures have been the main focus of several scientific research activities in recent times. Cruz et al. (2015) and Riggio et al. (2018) have presented the standards and guidelines for assessing historic timber roof structures. In the context of these guidelines, the present study starts from a geometric survey of the structure to the generation of a structural model for preliminary analysis. For detailed structural analyses, the additional information needed includes variability of the cross sections, typology of the connections between the structural elements, and condition and characteristics of the material.
Conventional data collection methods, including tape or digital distance measures, are time-consuming and usually result in 2D geometric information. Survey instruments like the total station can provide 3D information on individually measured points. The resulting information from a total station is a list of 3D points, which in itself still represents a rather low level of detail in the context of the surfaces of the construction elements. Laser-scanned point-cloud data based on light detection and ranging (LIDAR) are popular and efficient for capturing the geometries of complex structures. Detailed and highly accurate point-cloud data can be quickly and precisely collected on site using terrestrial laser scanning (TLS) (Vosselman and Maas, 2010). Photogrammetry is another method of acquiring dense 3D points based on images captured from different focal points. These images are first processed to extract the 3D information (Schönberger and Frahm, 2016). Point-cloud data can successfully replace the labor-intensive data collection work on site. In contrast to a laser scanner, the quality of a photogrammetric point cloud in terms of density and metric accuracy depends greatly on the light conditions and textures of the objects. Integrated survey techniques have also been applied in many studies (Alshawabkeh et al., 2021; Lo Brutto et al., 2021; Gaspari et al., 2022), and these studies show that photogrammetry can reduce the occlusions in the scan data to improve the surface coverage of the resulting point cloud.
A point cloud is a 3D representation that contains not only coordinates but also other information like the color and intensity of the return signal of the environment (Otepka et al., 2013; Barazzetti, 2016). Point-cloud data can then be processed using specialized software to create highly detailed and accurate 3D models, such as timber structures. On-the-shelf solutions allow users to model individual construction objects manually. Automation of the time-consuming 3D structural modeling of beams from point-cloud data is an ongoing research topic, as will be discussed in the related works below.
The resulting structural models address various purposes, including design, analysis, and visualization (Eßer et al., 2016; Hochreiner and Styhler-Aydın, 2019; Prati et al., 2019). For example, a model can be used to identify potential design issues or evaluate the structural integrity of a roof. A given structure may have different failure scenarios, and analysis reveals these while helping to decide if reinforcements are necessary. Monitoring a structure in intervals using 3D scans, evaluating the geometry, and comparing against previous versions can help identify intermediate changes to the structure, e.g., damage by moisture and vandalism. Changes to the stiffnesses of the connections of members can imply changes to structural deformations and therefore the geometry of the system.
For an appropriate structural analysis of a timber roof structure, the input parameters like structural specifications in terms of the cross sections and individual beam axes, typology of connections between the structural elements, and materials must fit well with the conditions of the real situation. Manual modeling of each element in a complex structure can take several months, and automated models may have missing or incomplete beams because of process-based or data-driven occlusions (Prati et al., 2019). The objective of this study is to refine automated 3D models using a postprocessing step in the context of integrity and completeness to generate structural models that can be imported into structural engineering software for preliminary structural analyses. Starting from cuboid fitting of the point cloud, the typology of a roof structure is used to complete the 3D model and establish connections between the beams. Thus, performing a structural analysis based on an automatically generated structural model is possible for a majority of the historic timber roof structure types noted in Serafini et al. (2017). However, some limitations regarding the beam shapes and structure outlines are explained in the discussion section.
1.1 Related work
TLS, photogrammetry, or a combination of both techniques is used in many geometric documentation applications of existing structures. For example, the feasibility of unmanned aerial vehicle photogrammetry for the dimensional measurements of structural elements in a traditional timber building was investigated by Jeong et al. (2020). Alshawabkeh et al. (2021) used laser scanners and photogrammetry together to enhance the historical building information modeling (HBIM) process; registration of the point clouds acquired by two different methods was handled using the ICP algorithm, and the authors were able to achieve complete geometrical reality of the investigated structure. This study followed a different approach with a lower complexity of data acquisition using only one sensor (LIDAR) that did not require additional lighting.
Semantic segmentation of point clouds using different approaches has been proposed in many studies (Poux and Billen, 2019; Grilli and Remondino, 2020; Haznedar et al., 2023; Song et al., 2023). Yang et al. (2023) presented a review of the methods used for semantic segmentation of point clouds for cultural heritage; this classification has lower importance in the present study because beams represent the majority of the data, while the roof cover and floor can be easily filtered.
Structural models of historic timber structures provide basic information for geometric evaluations in structural health assessments. For example, Tsakanika (2007) investigated the failure to identify the structural roles of the original “post and beam system” in sample Byzantine and post-Byzantine historic timber roofs. In the study by Gocál et al. (2015), a parametric work employing a numerical model was used to analyze roof structure behaviors with and without particular truss members and to evaluate the differences in the displacements and stress values of the main, secondary, and longitudinal trusses of the roof structure of the Roman Catholic Church of the Holiest Christ. Both studies highlight the need for numerical models and the definitions of master geometries for analyzing structures. This concept of a master geometry is studied herein for incorporating the original design idea of the structure.
Some studies have directly focused on various cross sections along the beam extent for structural analyses. For example, Branco et al. (2010) presented an accurate geometric and mechanical evaluation of the timber elements of two King-post timber trusses. Lourenço et al. (2013) proposed a method to evaluate the uncertainties of cross-section geometric measurements in existing timber structures and to describe the usage of complex and simplified probabilistic methodologies for analyzing the safety of old timber structures. Cabaleiro et al. (2017) proposed a method that allows automatic derivation of the deformations from laser scanning data of timber beams with randomly irregular cross sections; although the irregularity of the cross section is not the focus of this study, such information should be used for further analyses.
The conditions of materials are also important factors in structural health assessments. Given this scope, the aim of Cuartero et al. (2019) was to define a methodology to create 3D parametric models to assess the structural safety of existing timber roofs with intricate geometries and the effects of decay using a combination of laser scanning data and drilling resistance tests. Sola-Caraballo et al. (2022) presented a synthetic method and some basic guidelines to assess the structural behavior of a timber structure through the implementation of non-destructive tests (NDTs) and subsequent verifications. While the present work concentrates on transforming the original geometry of the timber roof structure to a model ready for a first structural analysis, the inclusion of these approaches would further help assess the current (decayed) states of the structures. These works demonstrate the importance of structural analyses of timber roof structures even as the authors mention the problems or high effort involved in obtaining these models.
While the foregoing review concentrated on structural analysis requirements, the following part focuses on building information model (BIM) and geometric reconstruction. Existing buildings with no prior BIMs require segmentation and classification of the point-cloud data to reconstruct the BIM objects. The process starts with data collection using TLS, and the point cloud is then used as a reference during manual modeling of the structural members in computer-aided design (CAD) or BIM software (Prati et al., 2019). The automation of this process is strongly desired since the manual scan-to-BIM procedure is both time-consuming and error-prone (Bassier et al., 2020). Wang et al. (2022) developed a BIM-based management platform for more convenient protection of heritage timber structures. Thus, a dual-indicator early warning mechanism was proposed for long-term static monitoring of structures. In the review by Santos et al. (2022) that focused on HBIM applications to historic timber structures, individual steps of the structural assessment, including data acquisition, material condition and type estimation, geometric modeling, and structural analysis, were investigated in detail; they demonstrated that the geometric complexity of a historic timber structure makes their modeling with a 3D modeling software laborious and time-consuming. For example, in the study by Balletti et al. (2013), data acquisition using TLS resulted in more than 800 million points but 3D modeling of the entire structure took several months. Yang et al. (2018) developed an API for Revit to hasten rectangular beam geometry construction using total station data. Pöchtrager et al. (2017, 2018) focused on beams with rectangular cross sections, and their approach is based on segmenting the point cloud and matching straight-beam side surfaces before fitting cuboids to the adjacent segments. Murtiyoso and Grussenmeyer (2020) applied Hough transform to split complex facets into linear parts; however, their approach was limited to L- and Y-shaped segments. Massafra et al. (2020) proposed a workflow for automatic transformation of a point cloud into a 3D model; this workflow detects cross sections of the beam members in a clipped truss and then applies the “loft” command for extrusion of the beams. Özkan et al. (2022a) presented a set of methods to filter the roof cover from the input data and split the complex-shaped point-cloud segments into linear subsegments to increase the number of automatically modeled beams of an entire timber roof structure. In Özkan et al. (2022b), the authors presented a workflow to refine incomplete rafter beams in an automated 3D roof-structure model; this study focused only on beams that are connected to the planes of roof tiles. Selman et al. (2022) proposed an automated method similar to that of Özkan et al. (2022a) that computes the beam geometry and connectivity directly from point clouds for structural analysis; in contrast to Özkan et al. (2022a), the roof cover filtering step was ignored in this approach. Additionally, they used an interactive editing interface to reduce the missing cuboid intersections for generating a suitable model for structural analysis. Even though there are significant efforts to automate processes for 3D timber structures, the variability of the geometry along the length of each beam is still an issue when forwarding the model to a structural assessment (Santos et al., 2022). The present study addresses minimizing any manual interventions and the processing time during the 3D structural modeling of historic timber structures. Moreover, the structural components like rafters, trusses, and beams as well as their relationships are extracted from the point cloud to handle 3D documentation of the structural assembly.
The aim of this study is to reduce the gap between automated geometric modeling and structural modeling. In the structural domain, the level of interoperability between the modeling and calculation software causes loss of information during data exchange, which is still an ongoing issue (Gomes et al., 2022). Various techniques have been employed for structural modeling of historic timber roof structures. Structural analysis cannot be applied directly to automatically acquired models owing to their incomplete nature, which may result in a lack of integrity. The present study aims to refine such models and minimize the manual effort required for preliminary structural analyses.
2 Materials and methods
2.1 Materials
Two timber roof structures, as shown in Figure 1, are selected to demonstrate the functionality of the proposed methods. Both roof structures are scanned using a Riegl VZ-400i TLS device1. The laser pulse repetition rate (PRR) of the device is in the range of 100–1200 kHz. Thus, up to 500,000 points can be measured every second by the near-infrared laser beams. The 3D position accuracy of the device is documented as 3 mm at 50 m and 5 mm at 100 m. The PRR is set to 1200 kHz for both studies. In the first case study, the scanner is used with a mounted camera, so the resulting point cloud has true color (RGB) information. In the second case study, scanning was done without a mounted camera, and the intensity was also recorded by the scanner. However, neither true color nor intensity is used as the input for processing. Thus, this information is used only for visualization purposes. Postprocessing of the scanned data, including coarse registration of the different scan positions, multistation adjustment, and exporting the point cloud, is realized using RiscanPRO2 software. The exported point clouds are the essential input to the workflow shown in Figure 2. The individual point clouds were registered with “multistation adjustment” (MSA) that computes the orientations of all scans simultaneously in an iterative process using the entire point cloud (Besl and McKay, 1992). MSA resulted in a mean absolute deviation (MAD) of 1 mm for both studies; the standard deviation of the registration is 22 mm for the first dataset and 18 mm for the second dataset. The average point sampling distance on the object space is approximately 3 mm.

Figure 1. Roof structures of the case studies based on aerial images (left) and their point-cloud data (right).
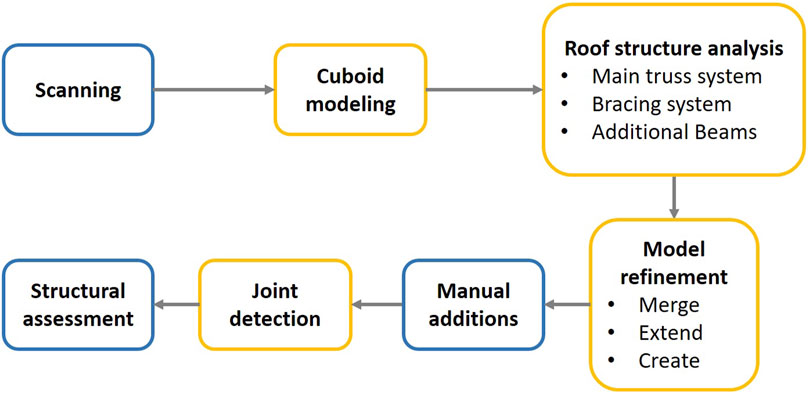
Figure 2. Creation of a complete 3D roof structure model from a cuboid model automatically generated from point clouds for structural analysis. The steps requiring human interactions are shown in blue, and yellow indicates fully automated data processing steps driven by Python scripts.
2.1.1 Case study 1: Castle Gutenbrunn
The first case study was on Castle Gutenbrunn, which is a late baroque castle near Herzogenburg in the district of Sankt Pölten, Lower Austria. The entire roof structure of the castle is an assembly of several buildings. This study focuses on one of these sections located above the northern entrance of the castle, as shown in Figure 1. The roof was scanned from inside the structure, and a total of 217 million points were surveyed by TLS from 13 positions. Then, after applying preprocessing steps such as merging, subsampling, and segmentation (as explained in Özkan et al. (2022a)), approximately 11 million points were considered for further processing. The scanner was always positioned at ground level because of the lack of a suitable place above ground. The scanning process took approximately one hour.
2.1.2 Case study 2: Michaeliskirche roof structure–northern transept
The second case study was on the St. Michael church, which is a medieval church in the city center of Vienna, Austria. The northern transept of this church was scanned by TLS to generate the structural model. Figure 1 shows that the roof was built as a rafter structure with main and subsidiary truss systems, a bracing truss system parallel to the ridge, and two subsidiary truss systems on the sides. 720 million points were collected by TLS from 38 scan positions. After preprocessing the raw points, approximately 15 million points were left, which were used for cuboid fitting of the beams. The scans included data from the ground level and first floor of the roof. The results showed fewer gaps around the top in comparison to the first case study. The on-site scanning process took approximately two hours.
3 Methods
With reference to state-of-the-art developments related to automated timber-beam modeling using point clouds (Pöchtrager et al., 2018; Prati et al., 2019; Özkan et al., 2022a; Selman et al., 2022), a workflow (Figure 2) was developed to convert the incomplete models to fully connected and useful models for the structural analysis software. These methods are applied using Python 3.8 version with the scikit-learn package (Pilgrim and Willison, 2009; Pedregosa et al., 2011). Python scripts are designed to read the input parameters, such as point clouds, and predefined threshold values from a configuration file. The output of this processing is the structural model that includes beams and coupling objects that can be imported and processed by structural engineering software.
The workflow presented in Figure 2 focuses on the generation of cuboids and model refinements in the context of connectivity of the timber beam frame. The resulting model can be used for preliminary structural analyses. However, characterization of the beam-to-beam connections, estimation of the material type and condition, and variation of the cross section along the beam extent need to be considered for advanced structural analysis. The limitations of the workflow and the assumptions made for processing are explained further in the Discussion section.
The preliminary result of cuboid modeling is a set of beam objects represented as cuboids. The connectivity and completeness of these cuboids are unknown when they are generated from point clouds (Özkan et al., 2022a). The cuboid models may be affected by the lack of information in the point cloud or process-driven missing elements. To prepare an analyzable model in the context of structural assessment, manual editing of the beams was suggested by Selman et al. (2022).
The roof structure analysis and model refinement stages in Figure 2 aim to analyze and understand the repetitive structure of the roof and then refine the model by applying the merge, extend, or create operation. In the final stage, the close spatial vicinities of the refined beams are used to identify and implement the presumable joints for structural assessment3.
3.1 Cuboid modeling
The basic steps of beam modeling proposed in extant works (Pöchtrager et al., 2018; Murtiyoso and Grussenmeyer, 2020; Özkan et al., 2022a; Selman et al., 2022) involve modeling beams as cuboids using TLS point clouds. The present study follows the workflow of Özkan et al. (2022a) for cuboid modeling and assignment of the roof covering points as a separate domain of geometrical information. The process starts with scanning the interior of a roof structure from several positions. The first step here is to register all scans to a superior coordinate system. Then, a set of point cloud processing methods is applied to extract the side surfaces of beams. OPALS (Pfeifer et al., 2014) is used to segment the input point cloud; segmentation is used to obtain the planar or slightly bending, curved, or twisted beam surfaces.
Ideally, the side surfaces of beams are represented by segments with elongated rectangular shapes. As noted in Pöchtrager et al. (2018), linear segments can be defined using shape factors computed based on principal component analysis (PCA) (Jolliffe, 2011). A segment can be classified as linear (e.g., side faces of beams), compact (e.g., large planes of the floor or walls), or non-linear but comprising linear sub-segments. For the decomposition of a non-linear segment into linear sub-segments, the methods proposed by Özkan et al. (2022a) that comprise region growing and RANSAC (Fischler and Bolles, 1981; Gambotto, 1993) are applied.
To estimate the best-fitting cuboid for a beam, the first step is identification of adjacent beam segments (Pöchtrager et al., 2018). The geometric proximity and angles between the beam segments are used to group the side surfaces of the beams into a single beam. The best-fitting cuboid can then be saved in a well-known 3D format, such as the design data exchange format DXF4. The resulting model is a list of cuboids and is not directly applicable to structural assessment but still remains an essential first input to a structural model.
3.2 Automated roof-structure modeling
The result of the sequence of methods explained in Section 3.1 is obtained in the form of beams as cuboids. To generate a complete model from the cuboids, an analysis of the design principle of the roof structure can guide further automation.
The first roof structure “rafters detection” idea was presented by Özkan et al. (2022b). In this study, large planar roof tiles were detected using RANSAC (Fischler and Bolles, 1981) on the roof-cover point cloud. Then, the beams connected to the detected planes were defined as rafter beams. In the final stage, the rafter beams were refined through an interval-based analysis. The present work proposes a more robust solution, as explained in Section 3.2.1, using binary comparisons of the point cloud and cuboid models instead of interval analysis. With this new approach, the missing, incomplete, or aggregatable beams can be detected even if they do not follow a constant distance interval. Additionally, both the repetitive rafter beams and all beams inside the structure are involved in the refinement process in a hierarchical manner.
The rafter pairs are first detected, and all beams that form the rafter truss are then analyzed together to reveal the initial design idea. Section 3.2.2 presents the detection and analysis of the further bracing elements that are perpendicular to the rafter truss planes. In the last stage, the cuboids that were not investigated in the prior analyses are checked for connectivity. The final automated roof-structure result is a fully interlocked roof-structure model that includes information on relationships between the beams, trusses, and bracing systems.
3.2.1 Truss system modeling
3.2.1.1 Rafter beam detection
The best-fitting planes of the large roof tiles are acquired using the RANSAC algorithm on the roof-cover point cloud. A plane is formulated as ax + by + cz + d = 0 and specified by the normal unit vector of the plane
In Eq. (1),
3.2.1.2 Refinement of the beams
Figure 4 illustrates the sub-steps for modeling the rafter beams. First, the 3D convex hull of the rafter beams of the same roof tile is obtained using Open3D (Zhou et al., 2018). Then, the points within the 3D convex hull are projected onto the plane of the roof tile, and a binary image is generated from the projected points to define a reference for beam refinement. Unlike Özkan et al. (2022b), an image-processing-based beam refinement approach is used instead of beam interval distance analysis. Using OpenCV (Bradski, 2000), the Canny edge detection algorithm (Canny, 1986) is performed on the binary image. Then, the Hough transform (Matas et al., 2000) is applied to the edge image to detect the beam sides as 2D line segments. By matching the closest corresponding parallel lines, the beam positions are defined based on the point-cloud-projected image as individual 2D rotated rectangles, which are named “reference rectangles” (green rectangles in Figure 35)). Then, the overlapping information between the projection of the cuboid beam as a 2D rectangle and the reference rectangle guides the model refinement operations via the following rules.
• Merging: If more than one beam intersects with the same reference rectangle
• Creating: If no beam intersects with the reference rectangle
• Extending: If dStart > dmax OR dEnd > dmax, where dStart is the distance between the starting point of the beam axis and the closest intersection point between the reference rectangle and elongated beam axis, dmax is the maximum distance threshold to extend a beam (e.g., 5 cm), dEnd is the distance between the end point of the beam and the closest intersection point between the reference rectangle and elongated beam axis.
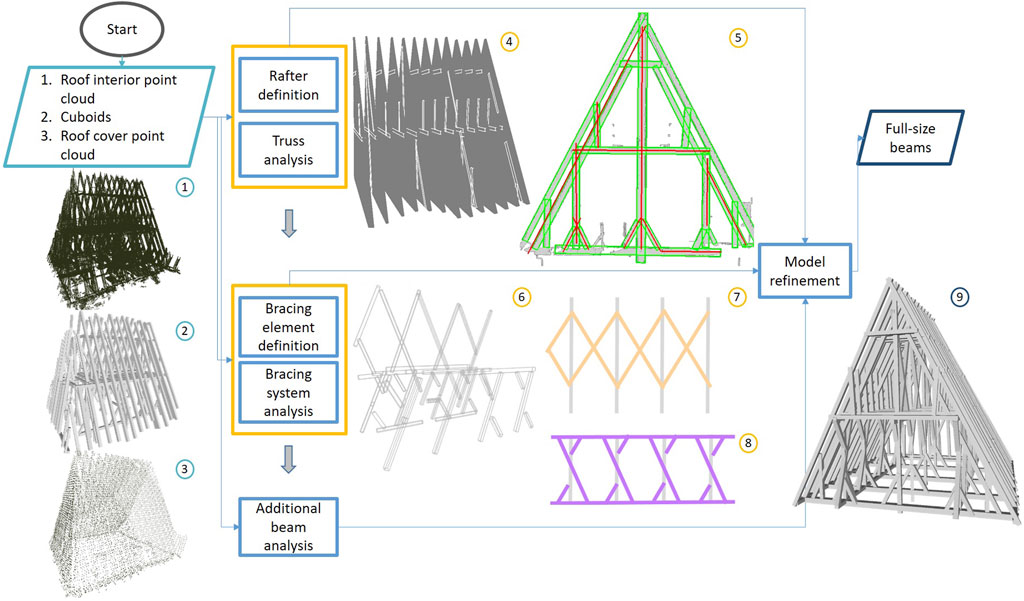
Figure 3. Roof structure analysis and structural model refinement workflow. (1) Roof interior point cloud, (2) set of cuboids, (3) roof-cover point cloud, (4) convex hull of the corresponding rafter beams (gray) and interior truss system (white), (5) 2D projected points inside a rafter truss (gray) with beam positions obtained from the 2D image (green rectangles) and central axes of the beam cuboids (red lines), (6) truss elements in the longitudinal direction as bracing elements, (7) primary longitudinal bracing system, (8) secondary longitudinal bracing system, and (9) 3D roof-structure model after refinements.
Regarding the operation decision rules, beam refinement is done by refitting a cuboid to all the 3D points such that the 2D projections are inside the reference 2D rectangle. In Figure 4B, a created beam (blue), extended beams (yellow), and merged beams (green) are shown inside an alpha-shape roof tile.
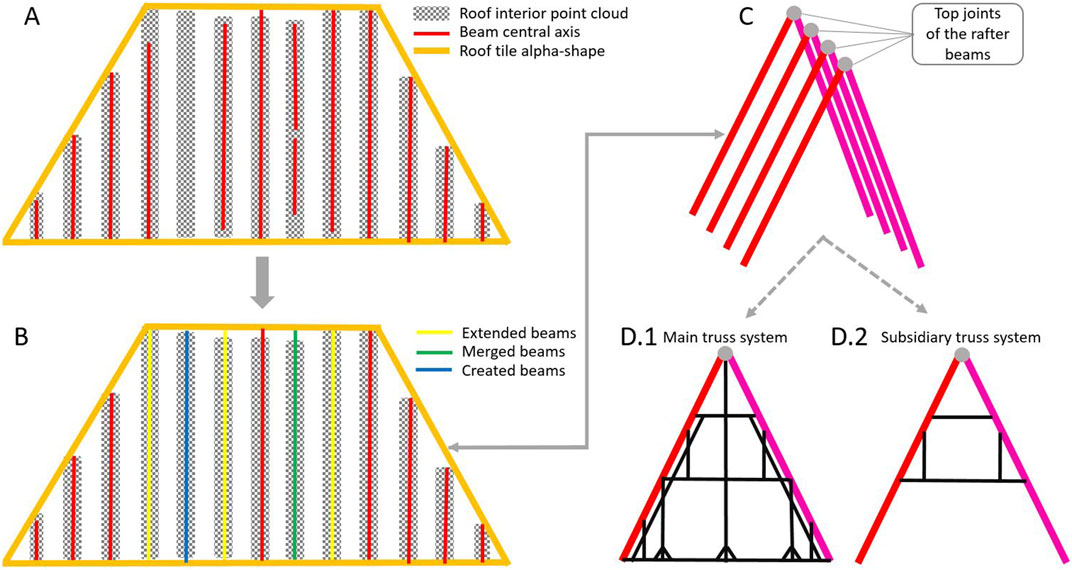
Figure 4. (A) Alpha shape of a roof tile (orange), rafter beams (red), and roof interior point cloud within the 3D convex hull of the rafter beams (gray); (B) model refinement results with extended (yellow), merged (green), and created (blue) beams; (C) rafter pairs from corresponding roof tiles; (D) main and subsidiary truss systems.
The first stage of model refinement is based on the point cloud and is an attempt to minimize the process-driven defects. The second stage of model refinement focuses on extending the beams that are affected by the lack of measured point clouds. Figure 4C shows that rafter beams of the corresponding roof tiles intersect near the top. This logic is used if a top joint is missing, and the respective left and right beams are extended toward each other around the top to interlock with the rafter truss system.
3.2.1.3 Truss system analysis
In Figure 4C, each rafter-beam couple connected to the ridge together represents the plane of a rafter truss. The interior beams of a rafter truss can be acquired using the 3D convex hull of the outer rafter couple (Figure 3(4)). First, the plane of the rafter-beam couple is obtained using least-squares fitting on the vertices of the rafter-beam axes. If a beam intersects with the convex hull, and the longitudinal beam axis is approximately perpendicular to the normal vector of the plane of the rafter-beam couple, then this beam is assigned as a member of the reference rafter truss system. Then, the beam refinement rules explained in the “Refinement of the Beams” section are followed for merging, creating, and extending.
Figure 4D shows the rafter-beam couples (red and magenta) and the interior beams of the trusses (black). To cluster the truss types, a truss is chosen as the reference and compared with the others in 2D space. If the compared truss has different members, it is assumed as a new reference rafter truss type for searching.
3.2.2 Bracing system modeling
Bracing systems are used to connect and stabilize several rafter truss systems in the longitudinal direction. Thus, the beam members of a bracing system, as shown in Figure 36), must intersect with at least one convex hull of a rafter truss system. The second step is to identify the reference plane along which a bracing system lies.
Figure 5 shows the relationship between the normal vector of the plane of a rafter truss system

Figure 5. Bracing system search reference plane estimation.
In Eq. (4), the joint point
3.2.3 Investigation of additional beams
The first two processing steps of the workflow are shown in Figure 3 by focusing on the truss and bracing systems as roof-structure objects. The additional beams refer to beams that are not a part of any processed truss or bracing system. As a design rationale, beams cannot be kinematic in the sense of floating freely in space but must be connected to the structure of the roof. Connections of these additional beams to the existing structure are thus investigated.
First, all refined beams are added to a scene as mesh objects of cuboids using Open3D. Then, the mesh objects of the additional beams are involved in the same scene. Rays are created from the starting and ending vertices of the additional beams along their longitudinal axes. The closest intersection points between the rays and meshes are computed using the ray-casting algorithm (Roth, 1982). To fulfill the connectivity between the additional and existing beams, the additional beams are extended along their longitudinal axes if the distance between the ray starting point and the first mesh intersection is less than a defined threshold (e.g., the mean value of the cross-sectional dimensions +30%).
Figure 6 visually depicts an additional beam and the closest intersection point of its ray on the beam of a truss.
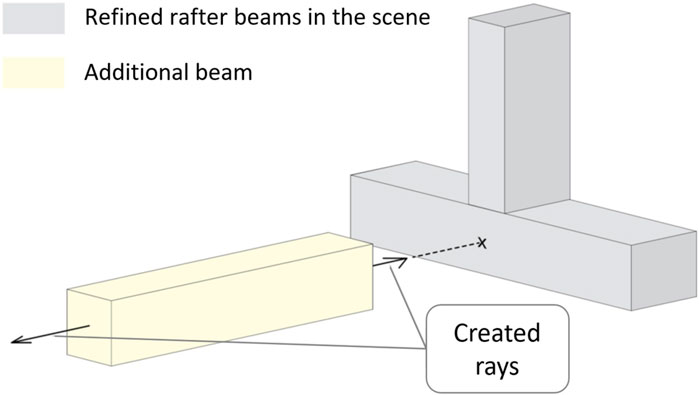
Figure 6. Additional beam extension using ray casting.
3.2.4 Comparative analyses of point clouds and beam models
The structural model refinement in Figure 3 comprises the identification of each beam within the automatically generated cuboids from a segmented point cloud. Additionally, the extracted reference planes help with detecting and creating the missing beams in the automatically generated model. However, there may be other beams that cannot be modeled. To highlight the points that do not correspond with any beam, the distances between the meshes of the refined beams and the point cloud are computed using CloudCompare5. Then, all points that are at a distance of less than 1 m from the mesh are extracted. Large planar segments are also excluded from the extracted point cloud. The remaining point cloud would now show only those points that do not belong to an automatically generated beam or non-construction objects that are visible during scans. This point cloud shows the exact positions of the beams that cannot be modeled automatically and must be modeled manually. In this study, to visualize the modeled beams and apply manual beam modeling, DLUBAL RSTAB86 structural engineering software is used.
3.3 Structural model generation
The structural model of a timber roof structure must be composed of connected beams. Additionally, the connections between the intersecting beams should be involved in terms of connections with specific mechanical characterizations by degrees of freedom (DOFs) in the structural model. Another key information embedded in the structural model is the material information of the beam elements.
As seen from the workflow in Figure 2, joint detection is necessary before structural assessment. The joints are generated as the shortest line segments connecting neighboring or intersecting beam connectors between the intersecting beam volumes.
The output of the primary processing chain is a set of cuboids that represents the beams and 3D line segments that refer to the joints. These geometric objects must be converted to a structural model. The Industry Foundation Classes (IFC)7 establish international standards to import and export structural objects and their properties. The IFC standards can be represented in different file formats like STEP physical file structure according to ISO 10303–218, ifcXML as an XML file, or ifcZIP as a compressed file. The beams are stored in STEP format as beam objects whose cross sections and longitudinal axes are extracted from the cuboids. The joints are stored as rigid to rigid couplings. The C24 softwood timber material is typically assigned to all beams, e.g., for historic timber constructions. The structural model, which is specified in terms of software and generated as a STEP file, can be imported and interpreted by other structural engineering software. DLUBAL RSTAB8 is used to investigate the current situation of the structural model and also the application of external loads and further support devices.
4 Results
The methods proposed in this study are applied using a computer with an AMD Ryzen 7 2700X 8-core processor with 32 GB RAM.
4.1 Cuboid modeling results
Segmentation of the point cloud is performed before cuboid fitting. Table 1 shows that the output of the segmentation is the number of detected segments. Then, only the linear segments are used as inputs for cuboid fitting. The numbers of modeled cuboids are shown in the output column for both case studies. The column on processing time shows that cuboids can be automatically generated from the point cloud in less than 3 h of fully automated processing depending on the processed points and numbers of detected linear segments.
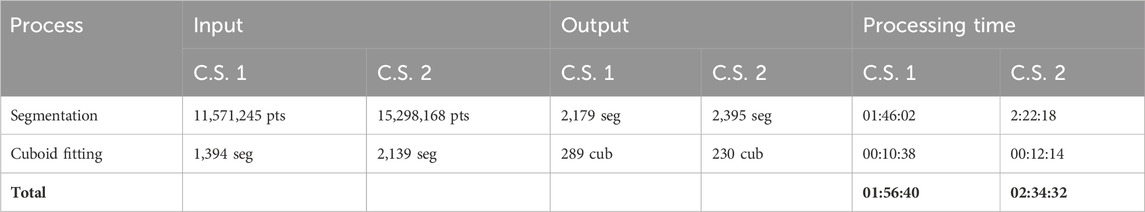
Table 1. Cuboid modeling processing stages of the case studies (C.S.).
4.2 Roof structure modeling
Figure 7 shows the detection and refinement of the rafter beams, along with the detected trusses and the final structural model. The cuboid models in Figure 7E that were acquired by the method explained in Section 3.1 are the input data of the subsequent refinement process. In Figure 7B, the refined blue and red beams that intersect with each other show the rafter truss system positions.
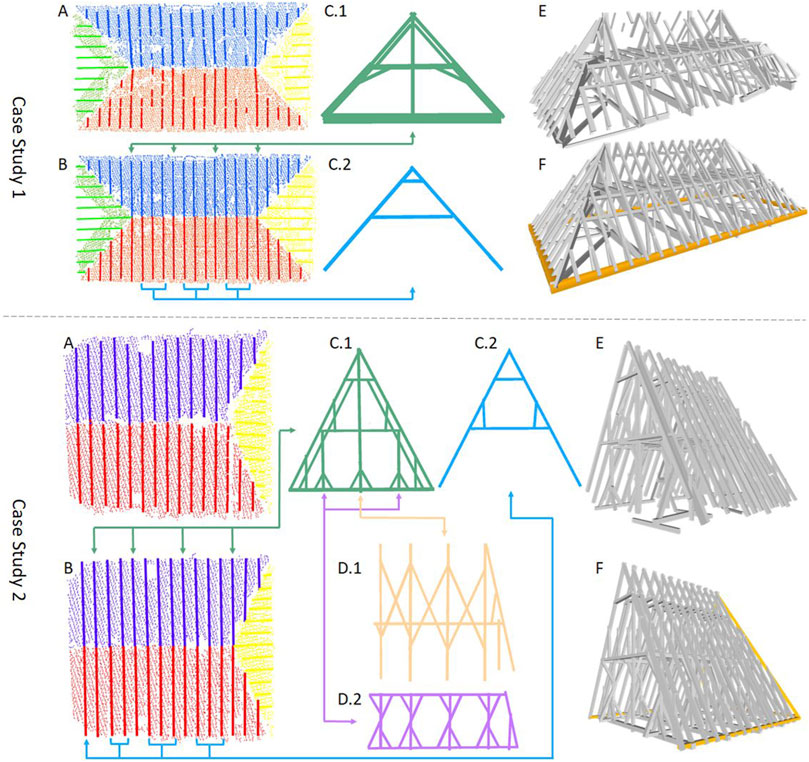
Figure 7. Roof structure modeling outputs for both case studies: (A) segmented planar roof tiles and their connected rafter beams, (B) rafter beams after refinement, (C.1) and (C.2) detected main and subsidiary rafter truss systems, (D.1) bracing system, (D.2) sub-system for implementation of the rafter system that also partially contains elements from (C.1), (E) input cuboid model, and (F) final structural model.
For the first case study, the rafter truss system classification resulted in four main (Figure 7C.1) and nine subsidiary trusses (C.2). As this roof structure does not have a bracing system, the purlin structure with long horizontal beams that pass through the middle of the main rafters are used to connect the rafters to each other. These beams are connected to the roof tiles, so they may be involved in the refinement operation similar to the rafter beams. Thereafter, 14 “additional beams” that were not involved in any of the prior refinement steps and had no connections with the main structure were extended along their longitudinal axes (via the automatic method in Section 3.2.3). The automated roof structure modeling took 08′11″. In Figure 7F, the four orange-colored horizontal beams on the ground-level borders of the roof structure were modeled manually. Together with the manual additions, the resulting structural model has 241 beams, with a total volume of 52.74 m3. The joint detection step resulted in 877 joints.
For the second case study, four main and nine subsidiary rafter truss systems were obtained as shown in Figure 7C.1 and Figure 7C.2. The bracing system modeling resulted in one system at the center (Figure 7D.1) and two subsidiary bracing systems (Figure 7D.2) located on both sides of the bracing truss system below the ridge. From the investigation of additional beams, six beams were considered as extendable beams. The automated process for this roof structure took 07′27′′. Similar to case study 1, as seen in Figure 7F, three horizontal beams on the ground level as well as two beams lying on the intersection of the side rafter plane and both main rafter planes were modeled manually. The manually modeled beams are shown in orange color. The final structural model in Figure 7F has 213 beams, 596 joints, and 39.19 m3 volume.
4.3 Structural assessment
The purpose of the structural analysis in this study is to demonstrate that the generated models can be imported and processed using structural engineering software. Therefore, the results of this analysis are only meant to be very basic, preliminary assessments.
The result of the automated roof structure modeling, comprising beams and links, is stored in the STEP file format. For structural assessment, the model is imported into a structural engineering software. In the case studies, DLUBAL RSTAB8 software was used. In the imported model, the beams are elements with constant dimensions along the beam axes. The very rough first setting of hinges is in line with the typology of the structure. Slip curves depending on the types of individual connections have not yet been implemented in this preliminary stage of structural investigation. The links between the structural elements are necessary to avoid kinematic systems, which cannot be assessed at all. Therefore, the connections are initially defined as the shortest line segments between the intersecting beams.
As the coordinate system of the scanned data may differ from the main axis of the building/structure, the orientation of the scan should be rotated if needed. To analyze a structure, the first step is defining the absolute height in the context of the entire building. With the help of on-the-site information and visual guidance from the point cloud, nodal support devices with the correct mechanical settings of kinematic constraints are allocated at points that are in contact with the substructure below. This operation is applied manually using the graphical user interface of RSTAB8 software.
To assess the stress components and utilization grades in the context of material strength parameters, the TimberPRO module is used. First, a load case along the negative direction of Z-axis, with a permanent load duration and self-weight, is defined in the software application. Then, the TimberPRO module is used to apply the defined load case to the model. In the preliminary assessment shown in Figure 8, only the dead loads (self-loads) of the structures are applied; this assessment shows that both structures are stable under the dead loads. The maximum global deformation is minimal for both structures even after neglecting the stiffness of the connections, which are assumed to be rigid during the first stage of assessments. The colorized deformed models under the dead loads are scaled using a scale factor (1,100 and 625 for the first and second case studies, respectively) to highlight the differences between the deformations on the beams. The right column in Figure 8 shows the calculated internal forces for the individual structural elements, which are between −26 kN and 18 kN for the first structure and between −24 kN and 12 kN for the second structure. Here, the negative values indicate compressions and positive values indicate tension.
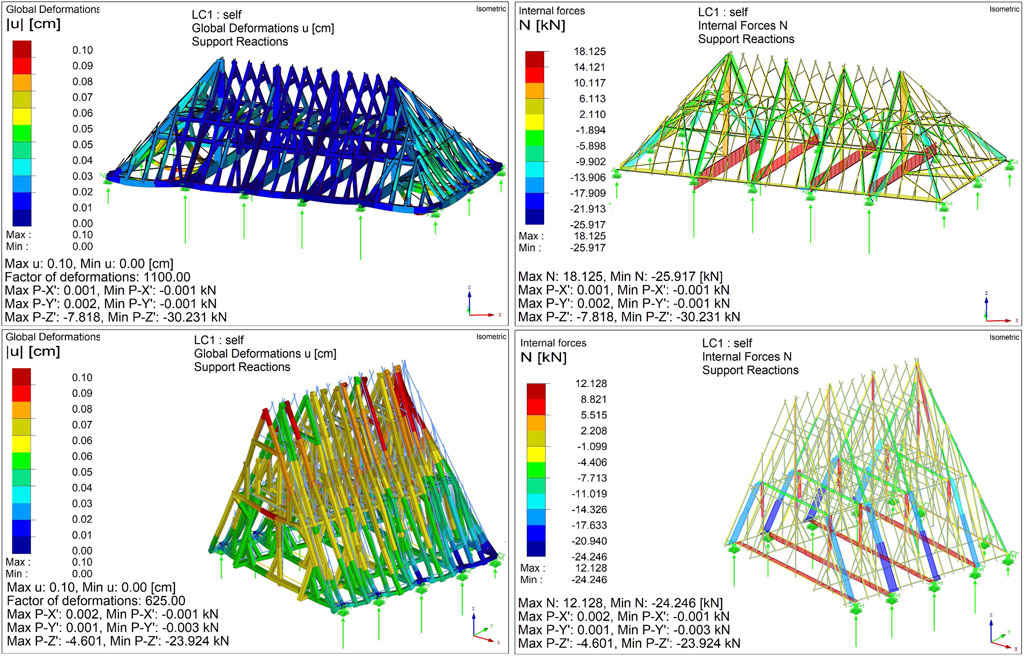
Figure 8. Structural assessment results. Global deformations in cm units under dead loads (left) and the internal forces in kN units that affect the structural elements (right).
5 Discussion
Data acquisition using TLS is the starting point of the analysis of a timber roof structure in this study. To generate the 3D model of the beams, the scan positions must contain as many possible side faces of the beams. Even if more scan positions are used to provide a more detailed point cloud, there may still be some limitations on site that prevent complete data collection. First, the time can be limited by some factors like unstable conditions of the structure, availability of equipment and staff, or permissions from the authorities. Second, with respect to the current condition of the structure, the scanner can only be positioned in accessible and secure regions. For example, in the first case study, the second floor was not suitable for placing the scanner. Thus, all scans were obtained at the ground level. Given the number of available scan positions and density of the structure, gaps (visible in the top-right part of Figure 1) occur in the point cloud near the top part of the roof. In contrast, the second roof structure had scans from two levels, so the point cloud is more complete even if there are small gaps caused by the shadow effect. Third, rigid obstacles in front of the beams, like wooden walkways, handrails, unused construction materials, or several objects stored inside the structure, make it impossible to collect data from some beam surfaces. The effect of the completeness of the point cloud is visible in Figures 7A,E for both roof structures. The rafter beams and cuboid model look more complete for the second structure, in parallel with the completeness of the point cloud.
Generation of a complete timber-structure wire-frame model from a point cloud is often required. Therefore, beams are modeled as straight linear objects with rectangular cross sections. This method allows generation of the basic geometry, cross section, and axis of each beam. Point clouds with 1 cm subsamples are adequate for generating the simple models as explained by Pöchtrager et al. (2018). After acquiring the timber wire-frame formed by the simple beam geometry, the original point cloud can be used to generate solid parametric models of the beams to improve the level of detail, as explained by Bassier et al. (2016). There are some assumptions to consider before processing the point cloud to generate a structural model.
• Beams are considered linear or slightly deformed geometric objects with rectangular cross sections;
• The roof structures are covered by large planar roof tiles connected to the rafter beams;
• All structural sub-systems are planar;
• Roof structures have rafter truss systems that are linearly repeated, are built using pairs of beams connected at the ridge where the pair forms the vertical rafter plane, and contain additional connected beams within their rafter plane for bracing;
• The roof extends in the longitudinal direction perpendicular to the plane of a rafter truss system, and bracing systems are formed by beams in vertical planes that are perpendicular to the rafter truss system planes.
With respect to these assumptions, both case studies are suitable for applying the methods explained in Section 3.2. The first case study is a complete roof structure with a rafter truss system stabilized by the purlin structure, so the bracing system modeling step was skipped. In contrast, the second case study has both rafter truss and bracing systems; hence, only the northern transept was investigated instead of the entire roof structure; thus, this structure has no symmetry because of the two different types of end faces perpendicular to the ridge.
Both case studies have the same numbers of main and subsidiary rafter truss systems and similar numbers of beams generated from similar numbers of points. The fully automated processing, including cuboid modeling and automated roof structure modeling, took 02h 05′01″ and 02h 41′59″ for the first and second roof structures, respectively. The number of segments generated in the segmentation step is the reason for the extra processing time of the second roof structure. Additionally, for both case studies, approximately 3 h of user-guided postprocessing of the scan data was needed before the automated structural modeling. After generating the model, an extra hour of human interaction or work on a computer was needed for the manual beam additions, nodal support application, and loading.
The main rafter system shown in Figure 7C.1 has stacked beams with different cross sections on the left and right sides of the truss. The beams with larger cross sections start from the ground level and end at the horizontal collar beam. The beams with smaller cross sections are modeled from the ground level to the ridge. As the cuboid fitting process is based on minimizing the distance between the side faces and their corresponding points, the orientation of the stacked beams may differ slightly. In this special case, the generated model can be modified using structural engineering software depending on the needs of the analysis. For the first case study, the stacked beams are already linked to each other during joint detection. The observed differences in the orientations of the stacked beams were very small. For this study, no manual modifications were performed on these beams.
In Section 3.2.3, a comparison is provided between the mesh model of the roof structure and its point cloud. Figure 9 shows the point cloud in the distance range of 0−1 m to the closest mesh surface of the roof-structure model. A majority of the points, as shown in blue color, are close to the modeled beams. The green color in the map refers to a distance of 15–45 cm and highlights that four large beams are placed along the outer border of the structure. This visualization helps identify where the beams cannot be modeled by the workflow. As many rafter beams are connected to these large beams, the parts between the connection points are shown in green, while the connection regions are in blue. The remaining greenish points refer to irrelevant objects.
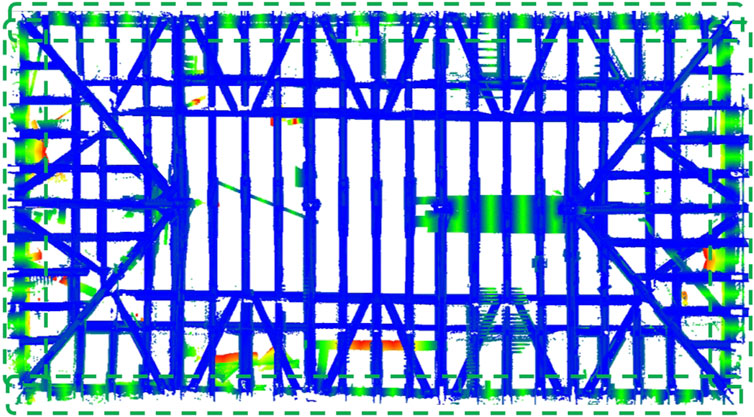
Figure 9. Distance map between the point cloud and mesh model of the roof structure.
For manual beam modeling, the cross-sectional dimensions and extents of the beams are directly measured from the point cloud. Then, these beams are involved in the main model. Then, joint detection is used to obtain the connectivity of the structural model. To affirm this connectivity, the number of independent systems is counted using DLUBAL RSTAB8. In the experiments, the structural models have one independent system each after joint detection.
Regarding the state-of-the-art solutions in the related works, there were no publicly available codes or datasets that were directly related to this topic. As a reference for future studies, the point clouds in .laz format files, generated cuboid models in .ply format mesh files, and resulting structural models in .stp format files are made publicly available by Özkan (2024).
In Table 2, the first method refers to Özkan et al. (2022a), the second one refers to the automation achieved in this study, and the third is the combination of the second model with manually modeled beams. Because of the beam singularization step in this study, even the number of modeled beams seems to decrease between the first and second methods; however, this does not mean a reduction of the completeness. In contrast, the number of detected joints and hence the connectivity of the entire structure increased for both case studies. In terms of the number of independent systems, Method 2 has an important impact on fulfilling the connectivity of the structural model. However, for the second case study, manual beam modeling is mandatory to obtain a single independent system.
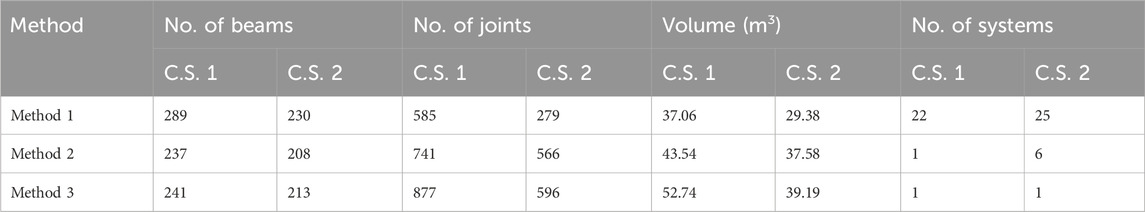
Table 2. Comparisons of the method by Özkan et al. (2022a) (Method 1), automated refinement result of this study (Method 2), and contributions of manually modeled beams to the refined models (Method 3).
The structural assessments with the dead loads shown in Figure 8 resulted in minor global deformations (total deflection in space) for both roof structures. These assessments show that the generated models are suitable for computing the internal forces and respective moments on the individual structural elements; thus, the forces and deformations can be calculated. This result is a starting point for the structural assessment. However, the influences of the typologies of the connections, deformed shapes of the timber beams, and conditions of the materials are still missing. In addition, the initial states of the structures were without deformations, and any deformations scanned should be considered as the results of the structural analyses. Usually, an already deformed generated model can be used for a first assessment.
Naturally, the proposed approach has some limitations, which are as follows. Some advancements need to be made to generalize the presented solution to different structures. If the cross sections are different, then the segmentation step would be the same but the cuboid fitting would have to be replaced by a different solution. If the regularity of the structure is more complex (e.g., different hierarchy levels or missing of a hierarchy) the completeness would be lower or different assumptions must be introduced for completion. If point clouds of lower geometric quality are used, this could be compensated partly by adapting thresholds, but this would eventually affect both the accuracy and completeness of the model. If the completeness of the point cloud is higher, fewer heuristic assumptions would be required to complete the structure by introducing information on completely scanned beams (currently achieved using 2D bounding boxes, etc.). For generalization to strongly deformed beams, segmentation and subsequent model fitting would have to be adapted, and this would require further adaptations when exporting to different structural analysis software. Structures like towers with the rotation axis at the center do not meet the assumptions noted for the refinement stage. For such structures, the workflow must be extended to identify reference planes of the sub-structures to apply refinements.
6 Conclusion
A highly automated workflow is proposed for 3D structural modeling of timber roof structures using laser-scanned point clouds. In addition to the structural model that includes beams and joints (rigid to rigid connectors in this study), segmentation and documentation of the structure in the context of sub-structures like rafter truss and bracing systems were achieved. For the two roof structures investigated, half a day on the site and half a day of office work was sufficient to generate the models used for the structural analyses shown in Figure 8. This shows that the generated models fulfill the requirements for preliminary structural assessments. Even if there exist some limitations, as explained in the discussion section, the proposed solution is expected to play a critical role in many cases, especially historic roof structures that are waiting for rapid estimations of their current states.
Together with the achieved level of automation for some roof-structure types, towers with specific axes of rotations, initially curved beams like domed halls, and beams with non-rectangular cross sections are potential subjects of further studies. In addition to the geometry of the beams, estimation of the typology of the connections is another future research topic that can be built upon this work. Furthermore, even if the developed workflow has only been used by the authors so far, making it available to the engineering community at large is intended in the future.
Data availability statement
The raw data supporting the conclusions of this article will be made available by the authors without undue reservation.
Author contributions
TÖ: conceptualization, formal analysis, methodology, software, validation, and writing–original draft. NP: conceptualization, methodology, project administration, validation, and writing–review and editing. GH: conceptualization, formal analysis, methodology, validation, and writing–review and editing.
Funding
The author(s) declare that no financial support was received for the research, authorship, and/or publication of this article.
Acknowledgments
The authors acknowledge TU Wien Bibliothek for financial support through its Open Access Funding Program. The authors acknowledge that this work is a part of the research project “PBS—Points-Beams-Structures” funded by TU Wien through the “Innovative Idea” program.
Conflict of interest
The authors declare that the research was conducted in the absence of any commercial or financial relationships that could be construed as a potential conflict of interest.
Publisher’s note
All claims expressed in this article are solely those of the authors and do not necessarily represent those of their affiliated organizations, or those of the publisher, the editors, and the reviewers. Any product that may be evaluated in this article, or claim that may be made by its manufacturer, is not guaranteed or endorsed by the publisher.
Footnotes
1Riegl VZ-400i Terrestrial Laser Scanner. Available at: http://www.riegl.com/nc/products/terrestrial-scanning/produktdetail/product/scanner/48/(Accessed on 12 October 2023).
3Airbus, European Space Imaging, Maxar Technologies. Available at: https://www.google.com/maps/(Accessed on 12 October 2023).
2RiScanPRO 2.15. Available at: http://www.riegl.com/products/software-packages/riscan-pro/(Accessed on 12 October 2023).
4DXF Open Data Exchange Format (Version AC1014). Available at: https://help.autodesk.com/view/ACD/2019/ENU/?guid=GUID-98DB6853-71EE-4E10-A8C3-9BD21A2A6143 (Accessed on 27 March 2023).
5CloudCompare Version 2.11.3. Available at: www.cloudcompare.org (Accessed on 15 November 2023).
6DLUBAL RSTAB. Available at: https://www.dlubal.com/en/products/rstab-beam-structures/what-is-rstab (Accessed on 28 July 2023).
7IFC, Industry Foundation Classes (IFC), IFC Data File Formats. Available at: https://docs.fileformat.com/cad/ifc/(Accessed on 28 July 2023).
8STEP, Industrial Automation Systems, and Integration—Product Data Representation and Exchange (Version ISO 10303-21:2016). Available at: https://www.loc.gov/preservation/digital/formats/fdd/fdd000448.shtml Accessed on 28 July 2023.
References
Alshawabkeh, Y., Baik, A., and Miky, Y. (2021). Integration of laser scanner and photogrammetry for heritage bim enhancement. ISPRS Int. J. Geoinf. 10, 316. doi:10.3390/ijgi10050316
Balletti, C., Berto, M., Gottardi, C., and Guerra, F. (2013). Ancient structures and new technologies: survey and digital representation of the wooden dome of ss. giovanni e paolo in venice. ISPRS Ann. Photogramm. II-5/W1, 25–30. doi:10.5194/isprsannals-ii-5-w1-25-2013
Barazzetti, L. (2016). Parametric as-built model generation of complex shapes from point clouds. Eng. Inf. 30, 298–311. doi:10.1016/j.aei.2016.03.005
Bassier, M., Hadjidemetriou, G., Vergauwen, M., Van Roy, N., and Verstrynge, E. (2016). “Implementation of scan-to-bim and fem for the documentation and analysis of heritage timber roof structures,” in Digital heritage. Progress in cultural heritage: documentation, preservation, and protection, 79–90.
Bassier, M., Yousefzadeh, M., and Vergauwen, M. (2020). Comparison of 2d and 3d wall reconstruction algorithms from point cloud data for as-built bim. J. Inf. Technol. Constr. 25, 173–192. doi:10.36680/j.itcon.2020.011
Besl, P., and McKay, N. (1992). A method for registration of 3-d shapes. IEEE Trans. Pattern Anal. Mach. Intell. 14, 239–256. doi:10.1109/34.121791
Branco, J., Piazza, M., and Cruz, P. (2010). Structural analysis of two king-post timber trusses: non-destructive evaluation and load-carrying tests. Constr. Build. Mater. 24, 371–383. doi:10.1016/j.conbuildmat.2009.08.025
Cabaleiro, M., Hermida, J., Riveiro, B., and Caamano, J. (2017). Automated processing of dense points clouds to automatically determine deformations in highly irregular timber structures. Constr. Build. Mater. 146, 393–402. doi:10.1016/j.conbuildmat.2017.04.037
Canny, J. (1986). “A computational approach to edge detection,” in Pattern Analysis and machine intelligence (IEEE Transactions on PAMI-8), 679–698. doi:10.1109/TPAMI.1986.4767851
Chapman, M., Norton, B., Taylor, J., and Lavery, D. (2006). The reduction in errors associated with ultrasonic non-destructive testing of timber arising from differential pressure on and movement of transducers. Constr. Build. Mater. 20, 841–848. doi:10.1016/j.conbuildmat.2004.11.004
Cruz, H., Yeomans, D., Tsakanika, E., Macchioni, N., Jorissen, A., Touza, M., et al. (2015). Guidelines for on-site assessment of historic timber structures. Int. J. Archit. Herit. 9, 277–289. doi:10.1080/15583058.2013.774070
Cuartero, J., Cabaleiro, M., Sousa, H., and Branco, J. (2019). Tridimensional parametric model for prediction of structural safety of existing timber roofs using laser scanner and drilling resistance tests. Eng. Struct. 185, 58–67. doi:10.1016/j.engstruct.2019.01.096
Eßer, G., Styhler-Aydin, G., and Hochreiner, G. (2016). Construction history and structural assessment of historic roofs - an interdisciplinary approach. Struct. Analysis Hist. Constr. Anamnesis, Diagnosis, Ther. Controls 1, 6. doi:10.1201/9781315616995
Fischler, M., and Bolles, R. (1981). Random sample consensus: a paradigm for model fitting with applications to image analysis and automated cartography. Commun. ACM 24, 381–395. doi:10.1145/358669.358692
Gambotto, J. P. (1993). A new approach to combining region growing and edge detection. Pattern Recognit. Lett. 14, 869–875. doi:10.1016/0167-8655(93)90150-c
Gaspari, F., Ioli, F., Barbieri, F., Belcore, E., and Pinto, L. (2022). Integration of uav-lidar and uav-photogrammetry for infrastructure monitoring and bridge assessment. Int. Archives Photogrammetry, Remote Sens. Spatial Inf. Sci. XLIII-B2-2022, 995–1002. doi:10.5194/isprs-archives-xliii-b2-2022-995-2022
Gocál, J., Sousa, H., Brites, R., and Neves, L. (2015). Analysis of the historical truss in village bela dulice. Acta Sci. Pol. Form. Circumiectus 14, 57–73. doi:10.15576/asp.fc/2015.14.1.57
Gomes, A., Azevedo, G., Sampaio, A., and Lite, A. (2022). Bim in structural project: interoperability analyses and data management. Appl. Sci. 12, 8814. doi:10.3390/app12178814
Grilli, E., and Remondino, F. (2020). Machine learning generalisation across different 3d architectural heritage. ISPRS Int. J. Geo-Inf 9, 379. doi:10.3390/ijgi9060379
Haznedar, B., Bayraktar, R., Ozturk, A. e. a., and Arayici, Y. (2023). Implementing pointnet for point cloud segmentation in the heritage context. Herit. Sci. 11, 2. doi:10.1186/s40494-022-00844-w
Hochreiner, G., and Styhler-Aydın, G. (2019). 19th century iron dome structures in the vienna hofburg. an insight into the simplified structural assessment of that period and its evaluation using modern engineering software. Struct. Analysis Hist. Constr. RILEM Bookseries 18, 891–900. doi:10.1007/978-3-319-99441-3_96
Jeong, Y., Nguyen, T., Riveiro, B., Tran, D., and Hoang, T. (2020). Applying unmanned aerial vehicle photogrammetry for measuring dimension of structural elements in traditional timber building. Measurement 153, 107386. doi:10.1016/j.measurement.2019.107386
Jolliffe, I. (2011). “Principal component analysis,” in International encyclopedia of statistical science. Editor M. Lovric (Springer Berlin Heidelberg), 1094–1096.
Lo Brutto, M., Iuculano, E., and Lo Giudice, P. (2021). Integration topographic, photogrammetric and laser scanning techniques for a scan-to-bim process. Int. Archives Photogrammetry, Remote Sens. Spatial Inf. Sci. XLIII-B2-2021, 883–890. doi:10.5194/isprs-archives-xliii-b2-2021-883-2021
Lourenço, P., Sousa, H., Brites, R., and Neves, L. (2013). In situ measured cross section geometry of old timber structures and its influence on structural safety. Mater. Struct. 46, 1193–1208. doi:10.1617/s11527-012-9964-5
MacQueen, J. B. (1967). Some methods for classification and analysis of multivariate observations. Proc. 5th Berkeley Symposium Math. Statistics Probab. 1, 281–297.
Massafra, A., Prati, D., Predari, G., and Gulli, R. (2020). Wooden truss analysis, preservation strategies, and digital documentation through parametric 3d modeling and hbim workflow. Sustainability 12, 4975. doi:10.3390/su12124975
Matas, J., Galambos, C., and Kittler, J. (2000). Robust detection of lines using the progressive probabilistic hough transform. Comput. Vis. Image Underst. 78, 119–137. doi:10.1006/cviu.1999.0831
Murtiyoso, A., and Grussenmeyer, P. (2020). Virtual disassembling of historical edifices: experiments and assessments of an automatic approach for classifying multi-scalar point clouds into architectural elements. Sensors 20, 2161. doi:10.3390/s20082161
Otepka, J., Ghuffar, S., Walshauser, C., Hochreiter, R., and Pfeifer, N. (2013). Georeferenced point clouds: a survey of features and point cloud management. ISPRS Int. J. Geo-Information 2, 1038–1065. doi:10.3390/ijgi2041038
Özkan, T., Pfeifer, N., Styhler-Aydin, G., Hochreiner, G., Herbig, U., and Döring-Williams, M. (2022a). Historic timber roof structure reconstruction through automated analysis of point clouds. J. Imaging 8, 10. doi:10.3390/jimaging8010010
Özkan, T., Pfeifer, N., Styhler-Aydin, G., Hochreiner, G., Herbig, U., and Döring-Williams, M. (2022b). “Structural assessment of historic timber roofs by improved automation of point cloud processing,” in International Conference on Structural Health Assessment of Timber Structures (SHATIS - 2022), Prague, Czechia, 7th - 9th September, 119–124.
Pedregosa, F., Varoquaux, G., Gramfort, A., Michel, V., Thirion, B., Grisel, O., et al. (2011). Scikit-learn: machine learning in Python. J. Mach. Learn. Res. 12, 2825–2830. doi:10.48550/arXiv.1201.0490
Pfeifer, N., Mandlburger, G., Otepka, J., and Karel, W. (2014). Opals—a framework for airborne laser scanning data analysis. Comput. Environ. Urban Syst. 45, 125–136. doi:10.1016/j.compenvurbsys.2013.11.002
Pöchtrager, M., Styhler-Aydin, G., Döring-Williams, M., and Pfeifer, N. (2017). Automated reconstruction of historic roof structures from point clouds—development and examples. ISPRS Ann. Photogramm. Remote. Sens. Spat. Inf. Sci. IV-2/W2, 195–202. doi:10.5194/isprs-annals-iv-2-w2-195-2017
Pöchtrager, M., Styhler-Aydin, G., Döring-Williams, M., and Pfeifer, N. (2018). Digital reconstruction of historic roof structures: developing a workflow for a highly automated analysis. Virtual Archaeol. Rev. 9, 21–33. doi:10.4995/var.2018.8855
Poux, F., and Billen, R. (2019). Voxel-based 3d point cloud semantic segmentation: unsupervised geometric and relationship featuring vs deep learning methods. ISPRS Int. J. Geo-Information 8, 213. doi:10.3390/ijgi8050213
Prati, D., Zuppella, G., Mochi, G., Guardigli, L., and Gulli, R. (2019). Wooden trusses reconstruction and analysis through parametric 3d modeling. Int. Archives Photogrammetry, Remote Sens. Spatial Inf. Sci. XLII-2/W9, 623–629. doi:10.5194/isprs-archives-xlii-2-w9-623-2019
Riggio, M., D’Ayala, D., Parisi, M., and Tardini, C. (2018). Assessment of heritage timber structures: review of standards, guidelines and procedures. J. Cult. Herit. 31, 220–235. doi:10.1016/j.culher.2017.11.007
Roth, S. (1982). Ray casting for modeling solids. Comput. Graph. Image Process. 18, 109–144. doi:10.1016/0146-664x(82)90169-1
Santos, D., Sousa, H., Cabaleiro, M., and Branco, J. (2022). Hbim application in historic timber structures: a systematic review. Int. J. Archit. Herit. 17, 1331–1347. doi:10.1080/15583058.2022.2034071
Schönberger, J. L., and Frahm, J.-M. (2016). “Structure-from-motion revisited,” in 2016 IEEE Conference on Computer Vision and Pattern Recognition. (Las Vegas, NV: Computer Vision and Pattern Recognition (CVPR)), 4104–4113. doi:10.1109/CVPR.2016.445
Selman, Z., Musto, J., and Kobbelt, L. (2022). Scan2fem: from point clouds to structured 3d models suitable for simulation. The Eurographics Association. doi:10.2312/gch.20221215
Serafini, A., Riggio, M., and González-Longo, C. (2017). A database model for the analysis and assessment of historic timber roof structures. Int. Wood Prod. J. 8, 3–8. doi:10.1080/20426445.2016.1232929
Smith, I., and Snow, M. A. (2008). Timber: an ancient construction material with a bright future. For. Chron. 84, 504–510. doi:10.5558/tfc84504-4
Sola-Caraballo, J., Rincón-Calderón, J., Rivera-Gómez, C., López-Martínez, J., and Galán-Marín, C. (2022). On-site risk assessment methodology of historic timber structures: the case study of santa cruz church. Buildings 12, 935. doi:10.3390/buildings12070935
Song, W., Luo, J., Zhao, D., Fu, Y., Cheng, C., and Furukawa, Y. (2023). A-scan2bim: assistive scan to building information modeling. Br. Mach. Vis. Conf. (BMVC). doi:10.48550/arXiv.2311.18166
Tsakanika, E. (2007). “Byzantine and post-byzantine historical timber roofs in Greece. typical failures, misunderstanding of their structural behaviour, restoration proposals,” in ICOMOS (Wood committee), 16th International Conference and Symposium, From Material to Structure, Florence, Venice and Vicenza.
Vosselman, G., and Maas, H. (2010). Airborne and terrestrial laser scanning. Dunbeath, Scotland: Whittles Publishing.
Wang, J., You, H., Qi, X., and Yang, N. (2022). Bim-based structural health monitoring and early warning for heritage timber structures. Automation Constr. 144, 104618. doi:10.1016/j.autcon.2022.104618
Yang, S., Hou, M., and Li, S. (2023). Three-dimensional point cloud semantic segmentation for cultural heritage: a comprehensive review. Remote Sens. 15, 548. doi:10.3390/rs15030548
Yang, X., Koehl, M., and Grussenmeyer, P. (2017). Parametric modelling of as-build beam framed structure in bim environment. Int. Arch. Photogramm. Remote Sens. Spat. Inf. Sci. XLII-2/W3, 651–657. doi:10.5194/isprs-archives-xlii-2-w3-651-2017
Yang, X., Koehl, M., and Grussenmeyer, P. (2018). “Automating parametric modelling from reality-based data by Revit API development,” in Latest developments in reality-based 3D surveying (MDPI). doi:10.3390/books978-3-03842-685-1-14
Keywords: historic timber roof structures, terrestrial 3D laser scanning, point clouds, automated structural modeling, structural assessment
Citation: Özkan T, Pfeifer N and Hochreiner G (2024) Automatic completion of geometric models from point clouds for analyzing historic timber roof structures. Front. Built Environ. 10:1368918. doi: 10.3389/fbuil.2024.1368918
Received: 11 January 2024; Accepted: 11 March 2024;
Published: 17 April 2024.
Edited by:
Joan Ramon Casas, Universitat Politecnica de Catalunya, SpainReviewed by:
Belen Riveiro, University of Vigo, SpainGiovanni Fabbrocino, University of Molise, Italy
Copyright © 2024 Özkan, Pfeifer and Hochreiner. This is an open-access article distributed under the terms of the Creative Commons Attribution License (CC BY). The use, distribution or reproduction in other forums is permitted, provided the original author(s) and the copyright owner(s) are credited and that the original publication in this journal is cited, in accordance with accepted academic practice. No use, distribution or reproduction is permitted which does not comply with these terms.
*Correspondence: Taşkın Özkan, taskin.oezkan@tuwien.ac.at