 Arturs Lešinskis
 Uldis Strauts
- Department of Heat Engineering and Technology, Faculty of Civil Engineering, Riga Technical University, Riga, Latvia
Society needs long-term sustainability and healthy building projects, and indoor air quality assurance engineering systems play a pivotal role in the energy performance of buildings. Therefore, when designing heating, ventilation, and air conditioning systems, it is crucial to make the most technically sound decisions in terms of energy consumption and assess their impact on the building’s energy performance. This article delves into the design of ventilation and air conditioning systems, presenting a method for evaluating their performance. The foundation of project development is an agreement on the design criteria, which are developed based on a preliminary analysis of the building concept. This agreement ensures cohesive collaboration among all stakeholders: the client, the architect, the system designer, the contractor, and ultimately the personnel responsible for commissioning, operating, and maintaining the systems post-construction. We suggest conducting a comprehensive analysis of the processes occurring within the space without initially linking them to room air exchange. From this analysis, we derive the angular coefficient for the direction of the air condition change on both a psychrometric chart and a Mollier diagram. The process line on the psychrometric chart provides insights into how the performance factor of the air distribution system will influence the desired supply air parameters. We can then evaluate how significantly the gap between the supply air and the exhaust air parameters expands if the room’s air exchange volume is reduced for budgetary reasons. The article showcases this design methodology using a simplified case study.
1 Background and purpose
Our hypothesis centers on the performance factor of the air distribution system and a detailed analysis of air parameters within air handling unit and serviced rooms. We propose a novel approach that diverges from traditional reliance on room air exchange rates. We advocate for a comprehensive analysis of the processes within the space without initially tying them to room air exchange. Our method relies on the angular coefficient for the direction of air condition change within the serviced room, resulting in a familiar process line on the psychrometric chart. Our approach focuses on the angular coefficient indicating the direction of air condition changes within the room, our method reveals critical insights from the psychrometric chart. This approach provides an immediate understanding of the detrimental effects on room comfort when air exchange volume is reduced for budgetary reasons, a common yet overlooked issue. With this comprehensive analysis, using specific air exchange volumes and selected air treatment processes in the air handling unit, we can optimize energy consumption for both cooling and heating. Our article delves into the air treatment for cooling and drying mode, employing the psychrometric chart or the Mollier diagram as tools for enhancing communication among specialists. This method not only aids in developing sustainable system projects but also assists in accurately determining the cooling and heating capacities of air handling units. Use of the psychrometric chart or the Mollier diagram can create better communication between specialists, regardless of the habit of using one or the other diagram.
2 Introduction
The design criteria for air conditioning projects require meticulous coordination and documentation of various aspects. We present a description of the sequence of theoretical judgments essential to the successful development of ventilation and air conditioning projects. 1) The intended use of the building, including the modes of use, technological processes within the premises, projected number of occupants, workplaces, and lighting. 2) Detailed insights on the thermal attributes of external boundaries and the thermal inertia of the premises’ internal structures (Saleh Pascha et al., 2016; Millers et al., 2020; Borodinecs et al., 2022a; Borodinecs et al., 2022b; Metals et al., 2022; Prozuments et al., 2023; Staveckis and Zemitis, 2023). 3) The type and operational principles of the envisioned heating system. 4) The target temperature and indoor humidity levels for which the comfort systems are designed. 5) The preferred design system types, which can range from pure ventilation to combinations such as ventilation with air heating, room cooling with either partial or non-guaranteed dehumidification, controlled dehumidification, air humidification, and comprehensive air conditioning as formulated in Table 2 (Types of ventilation, air conditioning, and room conditioning systems based on functions) in Claus, 2015. 6) The maximum conceivable outdoor air climatic parameters essential for the design of ventilation and air conditioning systems (ASHRAE climatic design conditions, 2021; Krumins et al., 2022). 7) The desired class or category of indoor air quality, along with the volume of air necessary to purge harmful emissions. 8) The optimal or architecturally viable method for distributing the supply air and draining exhaust air from the rooms; this also considers the air pressure distribution across different areas. 9) Lastly, the strategy for the indoor air quality control building management system (Krumins et al., 2022). Our study’s hypotheses and theoretical approach aim to expand the understanding among air conditioning system designers about the extensive capabilities of performance analysis using the psychrometric chart or Mollier diagram. By examining a simplified case study, we make a significant contribution to both the theory and practice of air conditioning. This aligns with our ultimate goal of improving energy efficiency in air conditioning systems, an increasingly vital aspect of sustainable building design.
3 Methodology
We appreciate Professor S.A. Sherif’s publication „Overview of Psychrometrics” in ASHRAE Journal 2022 (Sherif et al., 2002). The publication provides a comprehensive overview of air conditioning processes on the psychrometric chart. The considered air handling unit serves a virtual room in which the air is distributed according to the principle of mixed ventilation. It is possible that due to architectural spatial considerations, only a mixed distribution of ventilation air was possible in this conditioned space. We hope that our manuscript complements and expands the discussion on the design of air conditioning systems initiated by Professor S.A. Sherif’s publication.
Professor S.A. Sherif’s publication discusses the case where the exhaust air parameter point coincides with the desired room air parameter point. However, it is much more energy efficient to distribute supply air according to the displacement principle, where the point of the supply air parameters coincides with the desired point of the air parameters in the conditioned space. Therefore, we propose the hypothesis that in the design practice of air conditioning systems, it is necessary to apply the performance factor of the supply air distribution system, which is marked with " Mad ". Eqs 3–6 allow to implement a new approach to the theoretical analysis of the air conditioning system by using a psychrometric chart or a Mollier diagram and performance factor Mad of the supply air distribution system. We also theoretically prove that in the an enclosed area within a building devoid of external walls and windows (congress halls, theaters, conference rooms), which are not affected by outdoor air parameters and solar radiation, it is recommended to move the cooling coil before the recirculation mixing chamber. Such an option for improving the energy performance of air conditioning is not discussed in Professor S.A. Sherif’s publication.
Heat and moisture load balances for the premises can be constructed using the information from the design agreement. For both the heating and cooling periods, the heat loss and heat inflow loads are calculated. These should be gauged at their maximum potential, keeping in line with the permissible room air temperature variations and any potential outdoor climate conditions specified in the design brief. In determining these balances, one must factor in the heat and moisture inflows from occupants, which should be estimated based on the premises’ full occupancy capacity. A similar approach applies when computing the loads from technological processes and lighting within the room (Sherif et al., 2002).
The heat offered by heating systems must be accounted for, as must the influence of any local cooling units present within the premises. In certain cases, a well-designed heating system might entirely offset a room’s heat loss. Alternatively, the local coolers in a room (such as internal units of direct-expansion systems, fan coils, cooled ceilings, or cooling beams) might either partially or wholly counterbalance the influx of solar heat.
The rate of sensible heat gain for the space is represented by Hs, measured in kilowatts, and we have that the room’s Σqs is the rate of addition (or removal) of sensible heat, also given in kilowatts (remember that 1 kW equals 1 kJ/s). Similarly, for the room, the cumulative rate of moisture gain within the space is represented by Σṁw, given in units of kgw/s.
The ratio of a room’s sensible heat balance to its moisture inflow balance dictates the angular coefficient of the direction of the air condition change process in units of kJ/kgw. This is also expressed as the ratio of air enthalpy change (ΔHs) to air moisture content change (ΔW), given as ΔHs/ΔW. As defined in the ASHRAE Handbook, this is represented in units of kJ/kgw or kJ/gw and can be visualized on a psychrometric chart (Figure 1) (ASHRAE handbook online, 2023). Similarly, a Mollier diagram demonstrates this as the angular coefficient of the process change in air parameters and Δh/Δx is given in units of kJ/kgw where Δh is change of the enthalpy of moist air and Δx change of the humidity ratio of moist air (Figure 2) (Claus, 2015).

Figure 1. Principle of reference line on ASHRAE psychrometric chart protractor, where the angular coefficient of changes in air condition is in units of kJ/gw.

Figure 2. Angular coefficient of process change of air parameters on Mollier diagram, where ∆h/∆x is in units of kJ/kgw.
It is important to understand that when evaluating the functioning of room air conditioning systems, the angular coefficient of the reference line on the psychrometric chart remains constant. Irrespective of the air parameters introduced into the room, this coefficient persists because the heat and moisture processes within the space are not conditional on the introduced air parameters.
With this, we can theoretically locate the following three points: point C represents the desired air comfort parameters within the serviced room; point S describes the parameters of the incoming supply air; point E indicates the parameters of the room’s exhaust air.
The enthalpies of the supply, room, and exhaust air sources are denoted respectively by hS, hC, and hE (in units of kJ/kgda). The moisture content of these respective air sources is symbolized by WS, WC, and WE (in units of g/kgda).
The relative positioning of points S, C, and E on the reference line is contingent upon the performance factor Mad of the supply air distribution system (Figure 3) (Krēsliņš and Ramata, 2011; Kosonen et al., 2017). For instance, if the air is distributed throughout the occupied zone based on displacement ventilation system principles, then we have Mad = 0. However, if a mixing air distribution system is utilized, where air is spread remotely from the occupied zone and polluted air is directly extracted from this zone, then we have Mad = 1. Indeed, for mixing ventilation, the coefficient Mad tends to a limiting value of 1.

Figure 3. Performance factor Mad of supply air distribution system.
When mixed ventilation is employed, the properties of the expelled air are virtually identical to those of the occupied zone, i.e., points C and E coincide. In instances of displacement ventilation, the parameters of the supply air align closely with the desired air comfort criteria of the occupied area, meaning that points C and S coincide. The span between points S and E on the reference trajectory is dictated by the volume of ventilation air passing through the space.
Assuming steady-state conditions, the positioning of air parameter markers on the psychrometric chart can be deduced via the following equations:
where h [kJ/kgda] is the specific enthalpy of moist air, W [kgw/kgda] is the humidity ratio of moist air, x [gw/kgda] is the humidity ratio of moist air on the Mollier diagram, Σqs [kW or kJ/s] is the rate of addition (or removal) of sensible heat in the space, Σṁw [kgw/s] is the net sum of all rates of moisture gain per second on the space, Mad [dimensionless] is the performance factor of the air distribution system, Q [kg/s] is the volume of supply air, Σqs/Σṁw [kJ/kgw] is the angular coefficient guiding the direction of air condition alteration, and ΔHs/ΔW is the reference line on the chart protractor. In these terms and units, the subscripts are as follows: da stands for dry air, w indicates water in any phase, s signifies sensible heat gain, ad denotes air distribution, SE indicates the distance from the supply air point to the exhaust point on the chart, and C indicates the targeted air comfort parameters in the serviced room.
The volume of air that must be cycled should be established either via hazard assessment or by referring to indoor air quality norms. This is essential to mitigate health risks in spaces designed for studying, working, or leisure. Multiple international benchmarks exist that outline indoor air quality parameters in public buildings (EN ISO 7730:2005, 2005; EN 16798-1:2019, 2019).
The technologies employed in such buildings can differ greatly, and their influence on indoor air quality necessitates meticulous assessment during air conditioning system design. If the sole source of contamination in a room is human occupants, then a rough estimate suggests that an allocation of 15 m3/h per individual implies subpar air quality in the space. By factoring in 30 m3/h per person in the project, one can anticipate achieving moderate air purity. When accommodating 45 m3/h for each person, the ambient air quality would be rated as average. To ensure premium indoor air standards, it is vital to provide at least 60 m3/h per individual, if not more (EN 13779:2007).
Heating, ventilation, and air conditioning (HVAC) professionals bear the responsibility of advocating for the significance of indoor air quality when stakeholders make investment decisions regarding the development and operation of air conditioning systems. This advocacy is pivotal for the construction of healthy, sustainable edifices.
In practical terms, during the budgeting phase of designing a building, there is often a tendency toward curbing the expenses by reducing investment in HVAC systems. However, that approach overlooks instances in which modest expenditures can lead to notable enhancements in work efficiency and simultaneously decrease illness incidences and subsequent sick leaves (Wargorcki et al., 2006). The same way, recreational areas are mandated to guarantee both comfort and a wholesome environment.
4 Simplified case study
Air Conditioning System in a Historical Theater Hall.
As an illustrative example, we consider the air conditioning system of an auditorium within a historical theater hall. A theater hall typically epitomizes an enclosed area within a structure devoid of external walls and windows. In vast theaters with multistory balconies, it is imperative to facilitate enhanced air circulation to preclude zones of stagnant air. The air exchange rate in such halls should be sufficient to remove the heat and humidity generated by the densely seated audience. As a result, usually the air exchange rate significantly exceeds the amount of air required for CO2 removal.
To economize on the energy expended on heating and cooling, air recirculation can be an alternative (Sherif et al., 2002). Balancing the mix of fresh and recirculated air can be managed adeptly using CO2 concentration sensors. Leveraging polluted air heat via recuperators or regenerators is not a viable strategy because theater performances are infrequent and relatively brief.
Auditoriums can accommodate up to a thousand attendees, and when assessing the total sensible heat load of a packed auditorium and factoring the heat influx from the balcony floodlights, the comprehensive sensible heat rate is Σqs = 130 kW or 130 kJ/s. Gauging the moisture inflow from attendees is challenging, but a ballpark figure suggests Σṁw = 70 kg/h or 19.44 g/s.
A century ago, the air conditioning system of this historical theater hall was devised to accommodate a peak output of 50000 m3/h of supply air. Modern renovations adhered to this original capacity, which translates to roughly 60,000 kg/h or 16.67 kg/s of air throughput. As a result, the air enthalpy rises from supply point S to exhaust point E by ∆h = Σqs/Q = 130÷16.67 = 7.8 kJ/kgda, and the moisture content changes by ΔW = Σṁw/Q = 19.44÷16.67 = 1.17 g/kgda.
This calculation establishes the process line, with the air condition’s angular coefficient given in units of kJ/gw. By referencing the ASHRAE psychrometric chart protractor, the angular coefficient is 7.8÷1.17 = 6.67 kJ/gw, which on the Mollier diagram is 7.8÷0.00117 = 6700 kJ/kgw.
During the nascent stages of redesigning the historic theater’s air conditioning system, a blueprint was proposed incorporating an air handling unit with recirculation capabilities (see Figure 4). The proposed strategy was to channel cooled air via ceiling grates and extract contaminated air through grates placed beneath each audience member’s seat during the cooling season. Conversely, during the heating phase, the design involved channeling the supply air through floor grates and extracting polluted air via the ceiling grates. This proposition is arguably flawed, but to ensure the selection of an energy-efficient solution, both approachesceiling grate and beneath-seat grate distribution—are evaluated. Also, a modification to the air handling unit is recommended.
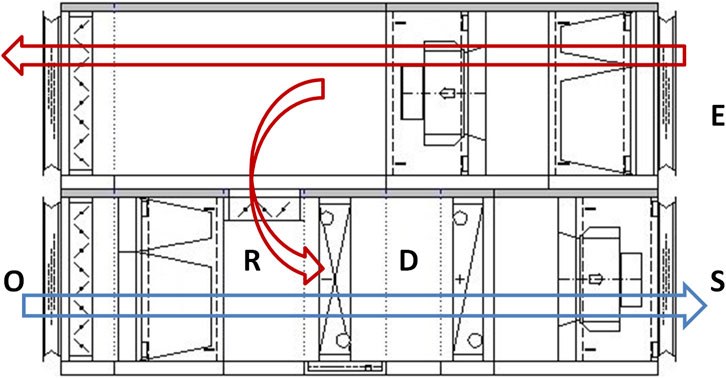
Figure 4. Air handling unit 1 (E—exhaust air; O—fresh incoming air; R—air post-recirculation; D—air post-cooling and dehumidification; S—supply air).
When air is distributed far from the occupied zone, it should be treated as a mixing air distribution. Consequently, the performance factor of the air distribution system will be Mad = 1. As such, the parameters of the air in the occupied zone (denoted as point C on the chart) practically mirror the parameters of the polluted air extracted from the room (points E and C coinciding on the chart, as illustrated in Figure 5).
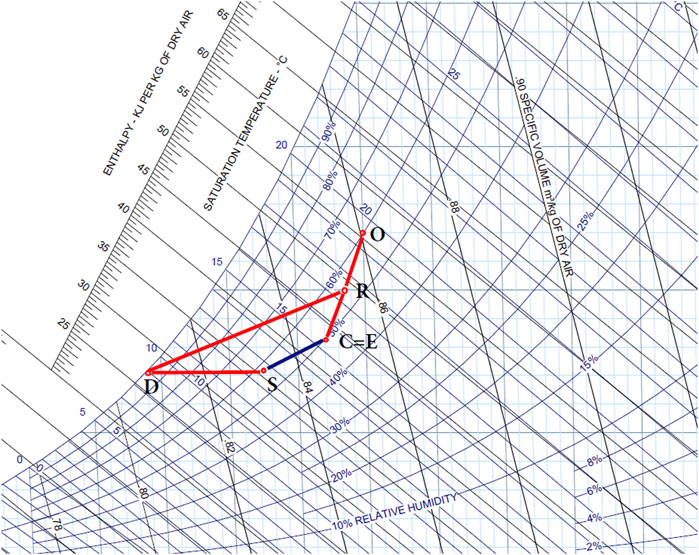
Figure 5. Schematic of air conditioning process on a psychrometric chart, illustrating a design concept utilizing recirculation.
The proposed strategy was to channel cooled air via ceiling grates and extract contaminated air through grates placed beneath each audience member’s seat during the cooling season. Conversely, during the heating phase, the design involved channeling the supply air through floor grates and extracting polluted air via the ceiling grates. This proposition is arguably flawed. However, to assure the selection of an energy-efficient solution, both approaches—ceiling grate and beneath-seat grate distribution—are evaluated. Additionally, a modification to the air handling unit is recommended.
When air is distributed far from the occupied zone, it should be treated as a mixing air distribution. Consequently, the performance factor of the air distribution system will be Mad = 1. As such, the parameters of the air in the occupied zone (denoted as point C on the chart) practically mirror the parameters of the polluted air extracted from the room (point E = C on the chart, as illustrated in Figure 5).
The inlet air parameter (point S on the chart) aligns with the reference line based on the angular coefficient of the changes in the air conditions. The distance SE represents the anticipated sensible heat load Σqs and supply air volume Q, as determined by Eqs 4, 6.
A pivotal query arises: should the design agreement for ventilation and air conditioning systems be grounded based on the outdoor air climate parameters? Specifically, in the context of this theater, the considerations include its operational nuances during the cooling season and the climatic data about its geographical location. The consensus dictates that air conditioning will account for an outdoor air temperature of +25°C and an enthalpy of 55 kJ/kg, which is represented by point U on the chart.
Should the project’s designer posit that the CO₂ concentration in the occupied zone remains non-problematic, even with 50% recirculation, then points O and E must be linked on the chart. Point R on the line OE designates the air parameters resulting from the amalgamation of both air flows; in this specific scenario, it is precisely at the midpoint. A reduction in the recirculation percentage would cause point R to gravitate toward point O.
The subsequent phase entails cooling and dehumidifying the processed air until it matches the desired humidity ratio W of the supply air, indicated by point D on the chart. The next step involves heating this air to the necessary supply air temperature, as indicated by point S.
One should not be concerned about discomfort when disseminating supply air via grates beneath each spectator’s seat in the cooling mode. Given that the theater hall essentially remains insulated from external climatic fluctuations, factors such as the sensible heat load, moisture gain rate, and the angular coefficient of air condition changes are influenced solely by the audience number and hall lighting.
Observing the comfort zones on both the chart and Mollier diagram across heating and cooling seasons reveals a notable insight: to maintain comfort, the heated air should be cooler during winter, and conversely the cooled air should be warmer in summer. The rationale for this is straightforward: theater attendees wear warmer clothing in winter and cooler attire in summer. Consequently, achieving displacement air distribution using grates beneath each spectator is viable, ensuring year-round comfort.
Some modifications to the air handling unit are proposed. By relocating the air recirculation grills behind the cooler relative to the airflow direction, the sequence of cooling and drying shifts from point O to point D. It is essential to recognize that only fresh airdevoid of recirculated airundergoes this cooling and drying process. In the discussed scenario, merely half of the overall supply air volume will traverse the cooling coil (as depicted in Figure 6). It might be possible to maintain the mixing point R on the supply-air humidity ratio W line. Consequently, the air would need to undergo minor heating from parameter R to parameter S (Figure 7).

Figure 6. Air handling unit 2 (E—exhaust air from room; O—incoming fresh outside air; D—air after cooling and dehumidification; R—air post-recirculation of outgoing air; S—supply air). After the cooling and drying process of fresh air, the recirculation is facilitated by combining the cooled and dried air (point D) with the exhaust air (point E).
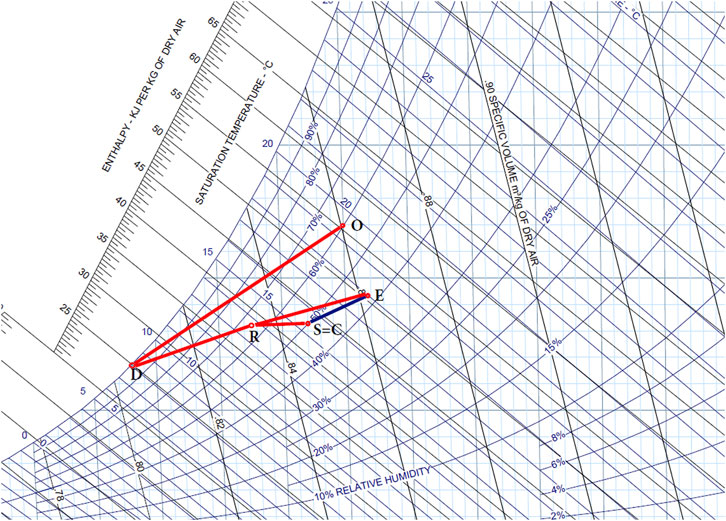
Figure 7. Schematic of air conditioning process on psychrometric chart for design concept utilizing recirculation prior to cooling and dehumidifying the incoming fresh outside air.
When we replicate these processes on the Mollier diagram and calculate the necessary cooling and heating capacities using the Menerga software, the outcomes are as depicted in Figures 8A, B and Figures 9A, B. (Claus, 2015; Geometrico GmbH & Co, 2021). The derived requirements amount to 366 kW for cooling and 140 kW for air heating when dispersing the supply air through the ceiling’s air grills. Furthermore, to extract the excess heat from the room, supply air at a temperature of 17°C must be channeled through these ceiling air grills. Such cool air distribution, especially through historic, rudimentary ceiling air grills, might induce a vertical downward flow of cool air, potentially discomforting the audience members seated below.
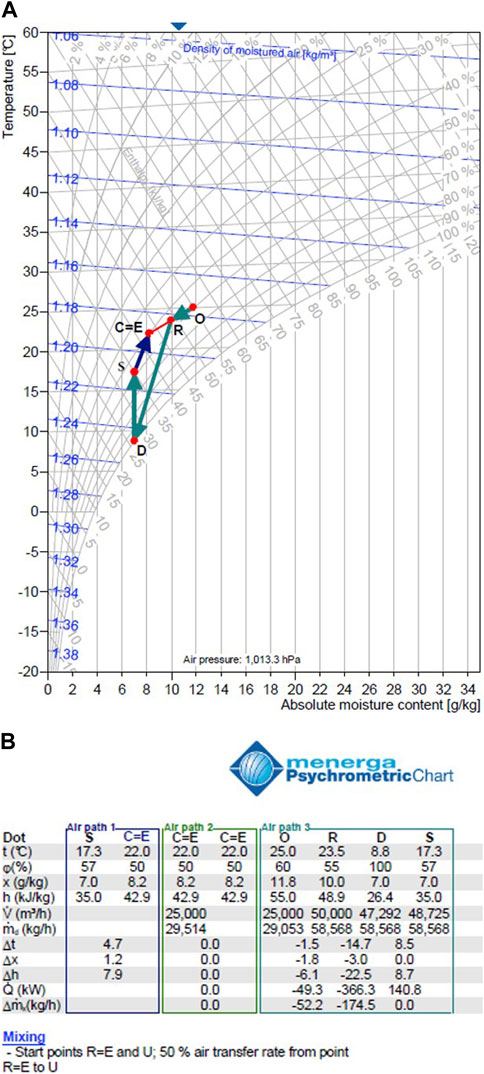
Figure 8. (A) Menerga Mollier diagram showcasing computation using Menerga software when disseminating supply air via the ceiling’s air grills. (B) Menerga Mollier diagram showcasing computation of essential cooling and heating capacities using Menerga software when disseminating supply air via the ceiling’s air grills.
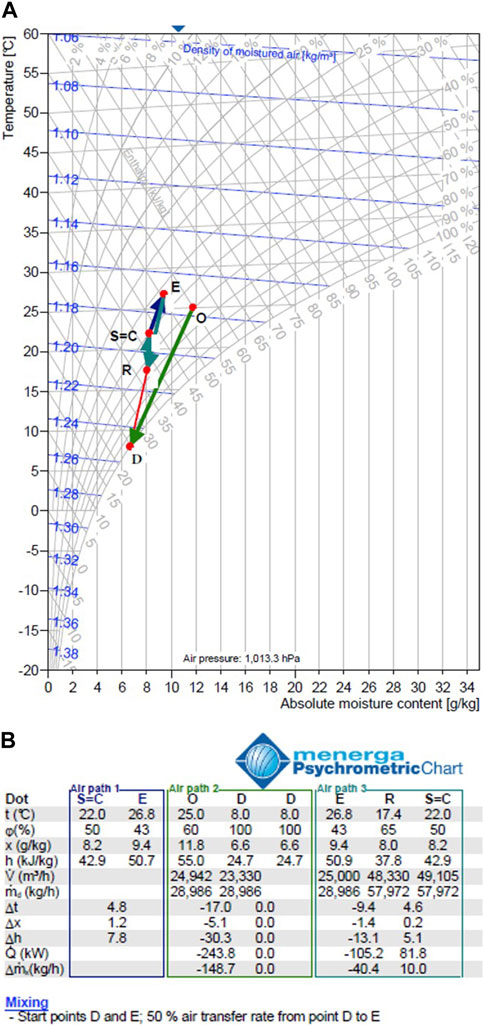
Figure 9. (A) Menerga Mollier diagram illustrating calculation using Menerga software, which involves applying displacement air distribution beneath chairs and only fresh air cooling and drying without recirculation, exaust air mixing to it. (B) Menerga Mollier diagram illustrating calculation of essential cooling and heating capacities using Menerga software, which involves applying displacement air distribution beneath chairs and only fresh air cooling and drying without recirculation, exaust air mixing to it.
5 Results
Employing displacement air distribution beneath the chairs and only fresh air cooling and drying without recirculation, exaust air mixing to it, reduces the cooling requirement to 244 kW, while heating needs just 82 kW. It is vital to remember during the automation of air handling equipment that all air parameters exhibit some fluctuations. The desired air parameters do not represent single fixed points but rather a range of comfortable conditions. Recirculation percentages might also shift based on the CO₂ sensor readings of the exhaust air quality. External air conditions can fluctuate significantly. This discussion has not delved into air treatment during the heating season, a time when air humidification becomes crucial.
6 The conclusions
Drawn from this study are as follows. 1) Detailed design criteria agreements are essential and merit attention. 2) Ventilation and air conditioning designs should begin with analyzing both technological and human activities within the space and the impact of external climates. However, these should not be tied exclusively to ventilation flow or conditioned air circulation within the room. 3) Intake air quantities should be ascertained based on indoor air contamination, while also considering the external air quality in the specific construction location. 4) Adjustments to the supply air volume might be necessary to meet indoor air quality standards and cost-effectiveness. 5) Analyzing ventilation and air conditioning processes on psychrometric charts or Mollier diagrams is pivotal for developing sustainable system projects and determining the type, cooling, and heating capacities of air handling units. 6) Only after these steps have been followed can an annual energy consumption simulation for the proposed ventilation or air conditioning system be conducted. 7) With the cooling and heating capacity optimization calculation for the simplified case study has proven the hypothesis that it is purposeful to use the performance factor of the air distribution system and the process line on the diagram for finding an optimal air treatment processes.
Data availability statement
The raw data supporting the conclusion of this article will be made available by the authors, without undue reservation.
Author contributions
AL: Conceptualization, Methodology, Validation, Writing–original draft. US: Resources, Visualization, Writing–review and editing. MM: Resources, Writing–review and editing. RM: Resources, Writing–review and editing. VA: Resources, Writing–review and editing.
Funding
The author(s) declare that financial support was received for the research, authorship, and/or publication of this article. This research was supported by ERDF project “Development of a new prototype of adiabatic cooling panels to ensure the sustainability and energy efficiency of cooling equipment” Funding number Nr. 1.1.1.1/19/A/002.
Conflict of interest
The authors declare that the research was conducted in the absence of any commercial or financial relationships that could be construed as a potential conflict of interest.
Publisher’s note
All claims expressed in this article are solely those of the authors and do not necessarily represent those of their affiliated organizations, or those of the publisher, the editors and the reviewers. Any product that may be evaluated in this article, or claim that may be made by its manufacturer, is not guaranteed or endorsed by the publisher.
References
Ansi/Ashrae, (2022). Ventilation and acceptable indoor air quality (ANSI approved).Standard 62.1-2022
Ashrae, (2021). Climatic design conditions 2009/2013/2017/2021. http://ashrae-meteo.info/v2.0/" title="http://ashrae-meteo.info/v2.0/">http://ashrae-meteo.info/v2.0/[Accessed June 8, 2023].
Ashrae, (2023). Handbook online. https://handbook.ashrae.org/Handbook.aspx" title="https://handbook.ashrae.org/Handbook.aspx">https://handbook.ashrae.org/Handbook.aspx [Accessed May 18, 2023].
Borodinecs, A., Lebedeva, K., Sidenko, N., and Prozuments, A. (2022). Enhancement of chiller performance by water distribution on the adiabatic cooling pad’s mesh surface. Clean. Technol. 4, 714–732. doi:10.3390/cleantechnol4030044
Borodinecs, A., Palcikovskis, A., and Jacnevs, V. (2022). Indoor air CO2 sensors and possible uncertainties of measurements: a review and an example of practical measurements. Energies 15, 6961. doi:10.3390/en15196961
Claus, H. (2015). Ventilation for non-residential buildings - performance requirements for ventilation and room-conditioning system. REHVA J. 1 (52), 24–29.
En, (2007). Ventilation for non-residential buildings - performance requirements for ventilation and room-conditioning systems. 13779 https://webstore.ansi.org/standards/bsi/bsen137792007.
En, (2019). Energy performance of buildings – ventilation for buildings - Part 1: indoor environmental input parameters for design and assessment of energy performance of buildings addressing indoor air quality, thermal environment, lighting and acoustics – module M1-6 (German version). 16798-1:2019.
En, I. S. O. (2005). Ergonomics of the thermal environment - analytical determination and interpretation of thermal comfort using calculation of the PMV and PPD indices and local thermal comfort criteria, 2005. 7730.
Geometrico GmbHCo, (2021). Menerga psychrometric chart. https://www.hx-diagramm.de/(Accessed May 22, 2023.
Kosonen, R., Melikov, A., Mundt, E., Mustakallio, P., and Nielsen, P. V. (2017). Displacement ventilation REHVA guidebook No.23 Brussels, Belgium: REHVA.
Krēsliņš, A., and Ramata, A. (2011), Calculations of energy consumption in ventilation systems 6th Int. Green Energy Conf. (IGEC-VI) Proc. Turk. Eskisehir 5-9. Eskisehir, Turkey: Anadolu University Print House, 1–6.
Krumins, A., Lebedeva, K., Tamane, A., and Millers, R. (2022). Possibilities of balancing buildings energy demand for increasing energy efficiency in Latvia. Environ. Clim. Technol. 26, 98–114. doi:10.2478/rtuect-2022-0009
Metals, M., Palcikovskis, A., Borodinecs, A., and Lesinskis, A. (2022). Typology of Latvian Churches and preliminary study on indoor air temperature and moisture behavior. Buildings 12, 1396. doi:10.3390/buildings12091396
Millers, R., Korjakins, A., Lešinskis, A., and Borodinecs, A. (2020). Cooling panel with integrated PCM layer: a verified simulation study. Energies 13, 5715. doi:10.3390/en13215715
Prozuments, A., Borodinecs, A., Bebre, G., and Bajare, D. (2023). A review on Trombe wall technology feasibility and applications. Sustainability 15, 3914. doi:10.3390/su15053914
Saleh Pascha, K., Saleh Pascha, V., and Winter, W. (2016). “Geometrical aspect for the design of prefabricated load-bearing timber-glass.facades,” in CD-ROM proceedings of the world conference on timber engineering (WCTE 2016). Editors J. Eberhardsteiner, W. Winter, A. Fadai, and M. Pöll (Vienna University of Technology) Vienna, Austria, 1–9. http://hdl.handle.net/20.500.12708/64635.
Sherif, S. A. (2002). Overview of psychrometrics. ASHRAE J. 44 (7), 33–41. Available from: https://www.techstreet.com/standards/overview-of-psychrometrics?product_id=1719625.
Staveckis, A., and Zemitis, J. (2023). Impact of the limited heat source capacity on indoor temperature and energy consumption in serial nZEB residential buildings across the Baltic region. Energies 16, 5924. doi:10.3390/en16165924
Keywords: ventilation, air conditioning, building renovation, public buildings, energy saving
Citation: Lešinskis A, Strauts U, Metāls M, Millers R and Afoņičevs V (2024) Ventilation and air conditioning design approach based on ASHRAE psychrometric chart and Mollier diagram. Front. Built Environ. 10:1372288. doi: 10.3389/fbuil.2024.1372288
Received: 17 January 2024; Accepted: 11 March 2024;
Published: 27 March 2024.
Edited by:
Roberto Alonso González-Lezcano, CEU San Pablo University, SpainReviewed by:
Eduardo López-Fernández, CEU San Pablo University, SpainTamar Awad, Comillas Pontifical University, Spain
Copyright © 2024 Lešinskis, Strauts, Metāls, Millers and Afoņičevs. This is an open-access article distributed under the terms of the Creative Commons Attribution License (CC BY). The use, distribution or reproduction in other forums is permitted, provided the original author(s) and the copyright owner(s) are credited and that the original publication in this journal is cited, in accordance with accepted academic practice. No use, distribution or reproduction is permitted which does not comply with these terms.
*Correspondence: Arturs Lešinskis, YXJ0dXJzQGxhZml2ZW50cy5sdg==