Performance based concrete quality assessment with gas permeability testing on site
 Lisa Ptacek1*
  Alfred Strauss1
  Damjan Grba1
  Fabian Sattler1 Makrini Macha1 Angeliki Kosta1 Stefan Marchtrenker2 Philip Boisits2 Tanja Manninger2 Stefan Krispel2 Michael Kleiser3 Rainer Hausenberger4 Roberto Torrent5
- 1Department of Civil Engineering and Natural Hazards, Institute of Structural Engineering, University of Natural Resources and Life Sciences, Vienna, Austria
- 2Smart Minerals GmbH, TU Vienna Science Center, Vienna, Austria
- 3Asfinag AG, Vienna, Austria
- 4ÖBB-Infrastruktur AG, Vienna, Austria
- 5Materials Advanced Services Ltd, Buenos Aires, Argentina
In terms of sustainability and durability, performance-based design is becoming increasingly important for the quality assessment of concrete structures. Up to now, prescriptive approaches for concrete composition and processing and the determination of concrete strength on cast samples have primarily been used as quality assurance. As this does not take into account the quality and pore structure of the as-built concrete cover, which has a significant influence on durability as a protective zone against penetrating media, the conventional approach to quality control is not representative for this zone. In particular, the permeability of the concrete cover, which is largely dependent on the pore structure, is responsible for the ability of aggressive substances from the environment to ingress into the concrete and, depending on its quality, determines damage processes in the reinforced concrete, such as carbonation. For this reason, investigations to gas permeability on real structures are presented here, which include the possibilities and limitations of measuring and evaluating gas permeability as a durability indicator. Long-term observation was carried out on concrete walls of a motorway construction site, from a young concrete age of 14 days to a higher age of max. 800 days, in order to determine changes in the material structure of the surface area and to analyse their influence on the gas permeability. The concrete walls were treated in advance during hydration up to an age of 7 days with different curing times and types in order to simulate good, medium and poor concrete surfaces. Clear differences in the quality of the concrete cover could already be determined by means of gas permeability. The influence of the surface structure, the effect of the environment and the long-term development of the concrete structure on the permeability are also addressed in this work.
1 Introduction
Currently, the durability of concrete structures is defined almost exclusively by the description of requirements regarding concrete composition, concrete strength, processing and curing. In many cases, however, inadequate results are achieved due to incorrect placement and curing conditions, even though the concrete composition complies with the standards (Bergmeister et al., 2003). The trend is therefore moving towards a performance-based approach to quality assurance of concrete structures by defining performance criteria. This approach achieves more reliable statements about the potential durability of a concrete structure, if the actual quality of the structure is evaluated (Hilsdorf, 1989).
In most standards, only the compressive strength of concrete is used as a criterion for sufficient durability. Although the compressive strength allows statements to be made about the general quality of the concrete, this property alone is not a suitable durability indicator, as it is not an indicator of resistance to carbonation, chloride penetration, etc (Hilsdorf and Kropp, 1995; Parrott, 1990). The quality of the near-surface layers and its resistance to environmental influences is therefore of key importance. A meaningful criterion would be a property based on resistance to penetrating (aggressive) media. These media can be liquid or gaseous and enter the concrete through transport mechanisms such as diffusion, absorption, capillary rise and permeability (Basheer et al., 2001). It can be assumed that one criterion is not sufficient to describe durability. The following material properties have an influence on the concrete’s resistance to external influences and could therefore be used to evaluate durability: carbonation rate, chloride content, permeability, porosity, voids and inhomogeneities (Bergmeister et al., 2003). Consequently, the performance-based approach involves testing all relevant performance properties. This concept is particularly important regarding the development of new, innovative, eco-efficient concretes.
Concrete with an open pore structure or microcracks is more sensitive to environmental attacks than concrete with a tighter pore structure. This indicates that a higher permeability is a sensitive indicator for the permeability of aggressive substances and therefore there is a direct correlation between the permeability and the durability of concrete (Torrent et al., 2021).
Numerous standardised methods are already available for measuring the permeability of concrete. However, for a property to be adopted as a durability indicator for performance-based design, clearly defined limit values based on reproducible laboratory and in-situ tests are required. The assessment of permeability properties can be carried out by determining gas permeability, water permeability, capillary absorption or the resistance of the concrete to chloride penetration.
In order to obtain meaningful results regarding the durability assessment of a structure, an examination of separately produced concrete samples is not representative. As the concrete cover is heavily dependent on the curing and compaction of the concrete during production and hydration, only direct on-site measurement or the extraction of drill cores is meaningful in order to determine the actual quality.
A completely non-destructive method that has proven itself and has already been included in standardised regulations for assessing concrete quality in Switzerland (Swiss Standard SIA 262/1:2019 (SIA Zurich, 2019)), Japan (Japanese Standard NDIS 3436-2: 2020) and Argentina (Argentine Standard IRAM 1892: 2022) is the so-called Torrent method for measuring gas permeability (Ebensperger and Torrent, 2012). The device for the method can be applied to vertical as well as horizontal surfaces. A vacuum chamber is used to create an air pressure gradient between the surface and the pore network. In the test chamber, the increase in pressure caused by the air flowing through the concrete is measured as a function of time. The air permeability is calculated from the change in pressure over time and other parameters as the dynamic viscosity of air and the open porosity of concrete. In contrast to the single-chamber method of, e.g., Schönlin and Hilsdorf (Schönlin and Hilsdorf, 1987), the Torrent method is a two-chamber method, which ensures that the air only flows one-dimensionally into the test chamber, i.e., flows exclusively out of the component (Torrent, 1992; Jacobs, 2006). As environmental conditions such as humidity and temperature have a significant influence on the test results, these must be adequately documented and taken into account when assessing the concrete quality (Beushausen and Fernandez Luco, 2015).
2 Motivation
Curing is an important step in the construction of reinforced concrete structures (Alexander et al., 2017). Complete hydration of the areas close to the surface of a structure - the concrete edge zone - can only be guaranteed with adequate curing. The quality of this edge zone is partially responsible for the durability of the whole structure and serves as a barrier against numerous negative environmental influences. Inadequate curing primarily leads to premature drying of the concrete edge zone, hydration comes to a standstill and the porosity of the cement paste is increased compared to properly hydrated parts (fib, 2013), besides the higher risk of shrinkage cracking. Increased porosity of the concrete edge zone accelerates and promotes damaging processes such as carbonation and the penetration of chloride ions, which lead to corrosion of the reinforcement. Furthermore, the strength and thus also the wear resistance are reduced (fib, 2013; Deutscher Zementwerke, 2008; Springenschmid, 2007; Wasserman and Bentur, 2013).
In the OptiNb project (Bos et al., 2020), test specimens made of concretes with varying curing quality were analysed in the laboratory using various measurement methods. The results of the project showed that measuring gas permeability is a reliable method for analysing and evaluating concrete surface quality. A clear correlation was established between the quality of curing and the quality of the concrete surface and thus its durability against environmental influences. Due to a lack of empirical values from measurements on real structures, extensive construction site measurements were recommended and carried out. The aim was to observe concrete surfaces with different curing conditions over a longer period of time and to carry out measurements on young and older concrete, taking into account influencing factors such as moisture and exposure of the component to the environment.
While the differences in the curing types could be clearly recorded by means of the gas permeability measurements within the individual concrete sections investigated, it was also found that surfaces with the same concrete and the same curing from different concrete sections sometimes differed greatly in terms of their condition and permeability development over time. Therefore, additional investigations were carried out to analyse this effect. Further research questions arose, which are presented in the following chapter.
3 Research questions
The long-term observation of the concrete surfaces examined on the construction sites showed very different developments with regard to gas permeability. While some concrete structures showed consistent trends in terms of permeability (and concrete quality) over time, strong changes were observed in other concrete sections with the same curing properties. In order to get to the bottom of the observed phenomena, these concrete surfaces were re-examined at a concrete age of more than 500 days. During these investigations, additional measurement methods and documentation procedures were used to analyse the different developments in the concrete surface quality (porosity, structure, etc.).
The following questions were to be answered by the investigations:
• To what extent does the texture or surface conditions influence the results of the gas permeability measurements?
• Why are non-standardised values (based on the SIA 262/1:2019 (SIA Zurich, 2019)) obtained on well-treated surfaces at an advanced concrete age (>280 days)?
• Are there limit values that can be recommended for measurements up to a concrete age of 90 days?
4 Materials and methods
Permeability tests were carried out in the early concrete age (<28 days) and additionally in the medium (<120 days) and higher concrete age (>200 days) of the ASFINAG S7 motorway construction project in the western section near Fürstenfeld, Austria. A further measurement was carried out at a concrete age >500 days.
The tests were carried out with the PermeaTORR B and PermeaTORR AC + instruments. In addition, moisture measurements were performed with the TRAMEX CMEX 2 and CMEX5 moisture meters, compressive strength measurements with the Proceq Model N concrete test hammer (rebound hammer) and pore tests (Adapted Sheen Karsten Tube Penetration Test) using isopropyl alcohol for the visual detection of cracks and surface pores.
4.1 Concrete properties and curing
The measurement objects were concrete walls constructed with an optimised waterproof concrete BS1C PLUS. This concrete corresponds to the BS1C PLUS concrete from the ÖBV guideline "Water-impermeable concrete structures - white tanks” (öbv - Österreichische Bautechnik Vereinigung, 2018). It is generally used for traffic structures exposed to de-icing agents and is characterised by low heat development (fresh concrete temperature at the placement site ≤22°C), low cracking tendency and a dense structure. The concrete was produced with a C3A-free CEM I cement with a w/b ratio of 0.49.
Measurements were taken on the walls of blocks 10, 25, 30 and 34, see location in Figure 1. The blocks were divided into three different curing areas. The "well” cured areas analysed in this measurement campaign were stripped after 36 h and then covered with a construction protection mat for 7 days. Three to four measurements were carried out per block at concrete ages between 13 and 799 days (see Table 1).
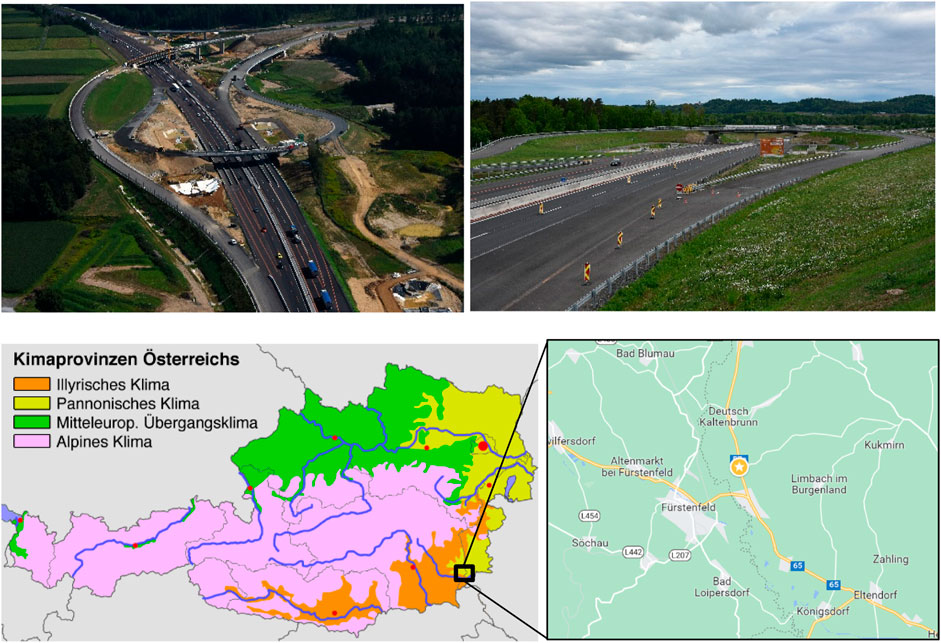
Figure 1. View and location of the ASFINAG S7 Fürstenfeld motorway, western section, with regard to the climate provinces in Austria (Fridrich and Kulhanek-Wehlend, 2002).
Table 1. Concrete and curing properties and measurement dates of the analysed blocks 10, 25, 30, 34.
4.2 Guidelines for the formwork removal and curing times of waterproof concrete
The duration of curing depends on the average daily temperature, the type of concrete and the strength development class. It must be selected in such a way that sufficient hydration of the concrete also occurs in the areas close to the surface. The minimum curing times shown in Table 2 apply for average daily temperatures of 12°C. At lower temperatures, the curing time must be extended in accordance with ÖNORM B 4710-1 (ON Österreichisches Normungsinstitut, 2018). The strength development classes ES, EM, EL and E0 shown in the table indicate the ratio of the strength after 2 days to the strength after 28 days. The strength development classes range from ES - fast to E0 - very slow. Furthermore, the curing depends on the exposure classes, which are listed in the column “Permissible concrete type” in Table 2.
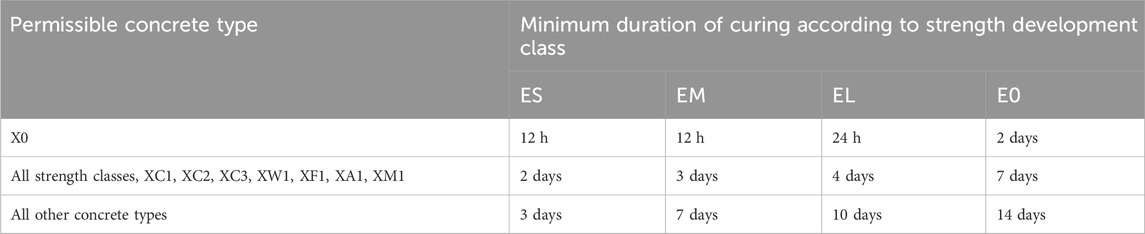
Table 2. Curing durations according to ÖNORM B 4710-1 (ON Österreichisches Normungsinstitut, 2018).
The curing of the tested walls on the S7 was carried out in accordance with the ÖBV guideline "Water-impermeable concrete structures - white tanks” (öbv - Österreichische Bautechnik Vereinigung, 2018) (hereinafter referred to as RL-WW) and served to protect against rapid cooling and severe drying out.
The standard specification for the demoulding period in normal operation (at temperatures >0°C) is 36 h. In the cold season (temperatures <0°C), a duration for leaving the concrete in the formwork of 72 h is specified.
Concrete surfaces need to be covered immediately after removing the formwork in accordance with RL-WW (with Protek 300 cover (300 g/m2) or similar) up to a concrete age of 7 days.
4.3 Description of the measurement object
4.3.1 Prevailing climate
Austria can be divided into four climate provinces. These are characterised by relatively cool summers and long winters in the Alpine climate zone, low temperature fluctuations and precipitation in all seasons in the Central European transitional climate, dry summers and cold winters with low precipitation throughout the year in the Pannonian climate province and high temperature changes between the seasons, but with high humidity in the Illyrian climate zone (Fridrich and Kulhanek-Wehlend, 2002; Wurzer and Sündhofer, 2014; Scheidl and Lechleitner, 1967; Klimaprovinzen Österreichs—Theoretisches Material, 2023).
As can be seen in Figure 2, the section of the S7 motorway under investigation is located in the Pannonian climate province. It is characterised by a warm, dry climate with hot summers. Winters are dry and can be very cold. Compared to Austria’s other climate zones, this province has the lowest rainfall and the highest temperature fluctuations. Evaporation in the Pannonian province is very high due to the abundant air movement, which dries out the soil. The warm season extends over five to 7 months (Klimaprovinzen Österreichs—Theoretisches Material, 2023; global 6, 2023).
Figure 2. Loctation of the investigated blocks of ASFINAG S7 Fürstenfelder motorway, western section.
4.3.2 Location, orientation and dimensions of the measurement areas
The measurements were carried out at the S7 motorway construction project, western section of ASFINAG AG near Fürstenfeld, Styria. The two walls of the waterproof concrete construction are located to the north and south of the motorway. In the course of the project, measurements were taken on both sides (road and ground side) of the walls (wall 1 and wall 2), as shown in Figure 3. Only the south side of wall 1 was examined during the last measurement in July 2023, as the exposure conditions on this side contributed to the fact that larger differences in the measurement data were visible in the different curing areas.
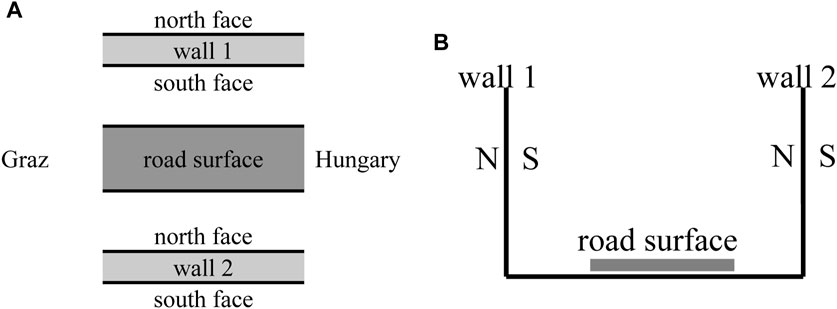
Figure 3. (A) Floor plan of the analysed areas, (B) Cross-section through the building.
Figure 4 shows a schematic representation of the curing areas of the investigated blocks 10, 25, 30 and 34. The blocks each have a length of 12 m, the height of the walls ranged from 1.25 m for block 10 to 5.96 m for block 34. These wall surfaces are all facing south.
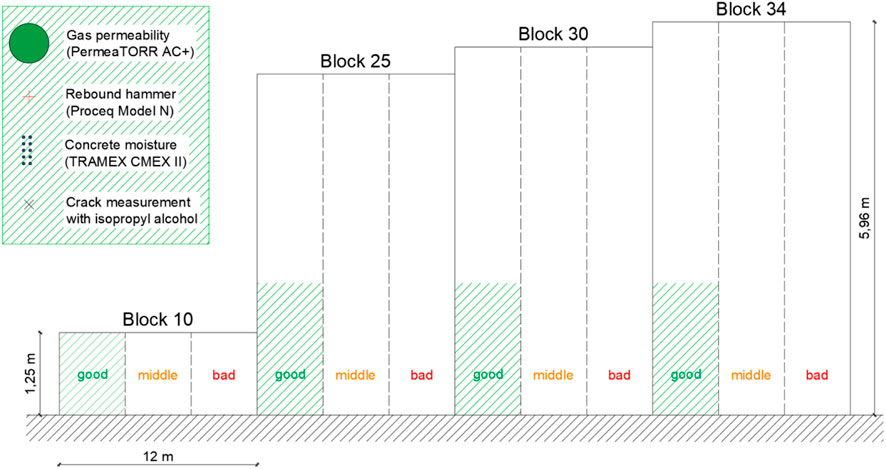
Figure 4. Schematic representation of wall 1 (south). The good, medium and poor curing areas of blocks 10, 25, 30, 34 and the measurement areas of 11 July 2023 in the well-cured areas of blocks 10, 25, 30, 34 are shown with green dashed lines.
During the first three measurement dates, all curing areas (good, medium and poor) of the four blocks were analysed using gas permeability tests and moisture measurements. Measurements were taken up to a maximum height of 2 m. During the measurement campaign on 11 July 2023, the measurements were concentrated on the “well” cured areas (shown with green dashed lines in Figure 4) on the south side of wall 1. In addition to the gas permeability measurements and the moisture measurements, rebound hammer tests and crack measurements with isopropyl alcohol were carried out. Supposedly “bad” measuring points (due to high porosity or unevenness of the surface) were grinded after the initial gas permeability measurements in order to repeat the tests afterwards to check if there are any changes in the measurement results after grinding.
4.4 Limit values for gas permeability
The limit values for gas permeability kT are set in the Swiss standard SIA 262/1:2019 (SIA Zurich, 2019) for Swiss concrete types according to SN EN 206 + A1. The values apply to a concrete age of 1–3 months and range between 0.5 10−16 m2and 2.0 10−16 m2. It should be noted that these values are not directly applicable to Austrian concrete types (according to ÖNORM EN 4710-1), as the names and composition of Austrian and Swiss concrete types differ. A limit value (statistical upper characteristic value) between 0.5 10−16 m2 and 2.0 10−16 m2 is subsequently assumed for the waterproof concrete examined.
The kT values determined can also be assessed using the permeability classes from the paper by R. Torrent and G. Frenzer (Torrent and Frenzer, 1995). Table 3 shows the limit values for “very good” to “very poor” concrete cover quality for the kT value measured after 28 days.
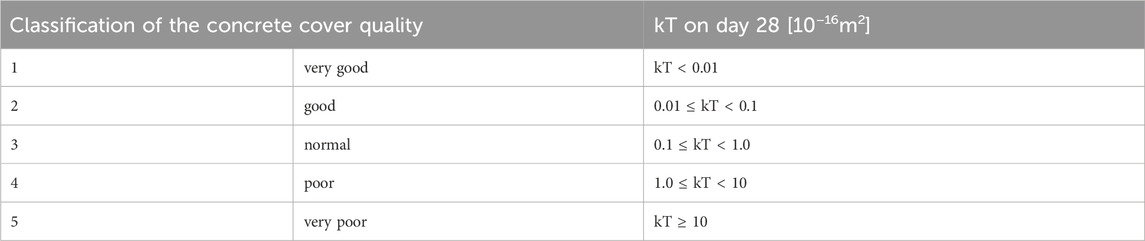
Table 3. Classification of the quality of the concrete cover depending on the gas permeability kT (Torrent and Frenzer, 1995).
5 Results
The results of the gas permeability measurements and the moisture measurements are described in relation to the development over time for the good curing areas. The crack measurements and the rebound values of the measurements from 11 July 2023 are also listed.
5.1 Gas permeability and moisture
Figure 5 shows the development of the permeability values of blocks 10, 25, 30 and 34 in the good curing area as a function of the concrete age. The values continue to increase for all blocks up to a maximum concrete age of 800 days. The lowest permeability is recorded at concrete ages up to 22 days, which is primarily due to the higher concrete moisture content. A strong increase in the gas permeability of block 30 at the age of 658 days was observed. Block 10 has the lowest permeability values.
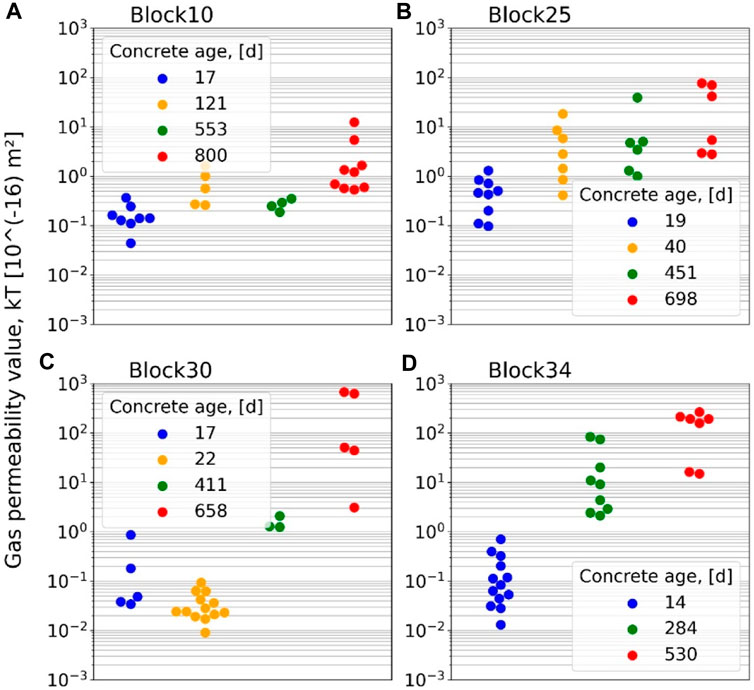
Figure 5. Decadic logarithmic representation of the gas permeability values kT in 10−16 m2 as a function of the concrete age in days of (A) block 10, (B) block 25, (C) block 30, (D) block 34.
Note: Figure 5 does not show the number of measurements that could not be carried out due to excessive permeability values during the measurements on 11 July 2023 (shown in red). The number of these measurements that could not be carried out is shown in Table 4. As defined in the Swiss Standard SIA 262/1:2019 (7), new spots were chosen if areas turned out to be not measurable.
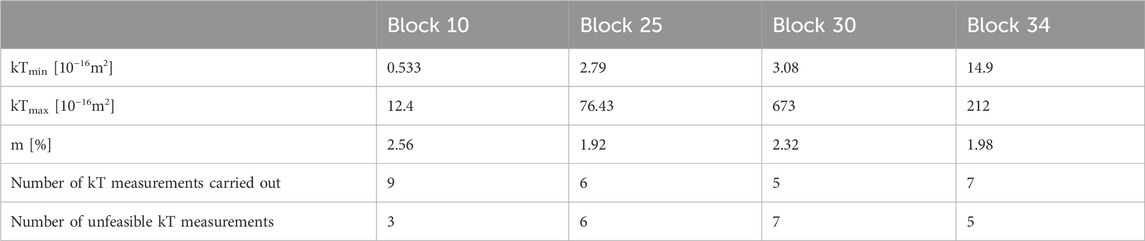
Table 4. Minimum (kTmin) and maximum (kTmax) gas permeability values and humidity (m) of blocks 10, 25, 30, 34.
The development of the concrete moisture (determined by non-destructive measurement of the electrical impedance) over time can be seen in Figure 6. This ranges between 4% and 6% at a low concrete age (up to 22 days) and falls to just under 2% at a high concrete age. It can be seen from the graph that the moisture decreases up to an age of 300–400 days and then levels off at constant values.
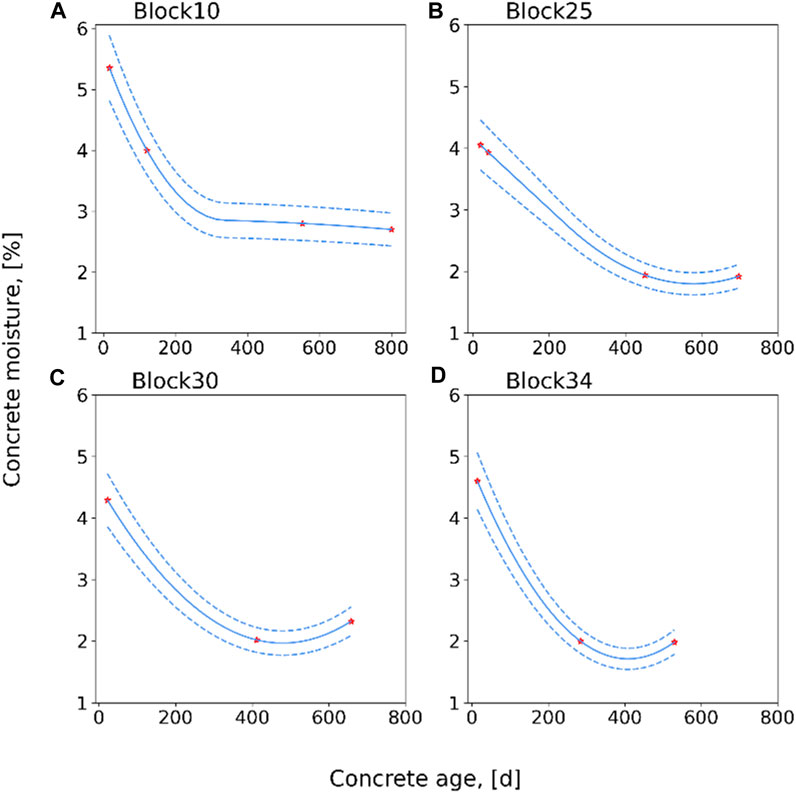
Figure 6. Development of concrete moisture over time from (A) block 10, (B) block 25, (C) block 30, (D) block 34.
The gas permeability values are strongly influenced by the moisture content of the structure. In order to be able to better compare kT values that were measured at different concrete ages and thus at different moisture levels, the kT values were compensated for moisture. There are two possible approaches for correcting the kT values according to (Bueno et al., 2021):
1. If the data was recorded at the same points, the data of the 2nd measurement (moisture m2) can be related to that of the 1st measurement (moisture m1):
Where kT is the value of the 2nd measurement (at humidity m2), converted into the humidity m1 of the 1st measurement.
2. All data (1st and 2nd measurement) can be related to a reference moisture condition (e.g., m = 5%) as follows:
Where
The results from Figure 5 were corrected according to Eq. 2 and related to a reference moisture content of 5%. The corrected values can be seen in Figure 7. An "improvement” in the permeability of block 10 can be clearly seen from the first day of measurement to day 553. In contrast, the permeability of blocks 30 and 34 becomes increasingly higher with increasing age. Block 25 shows roughly constant values.
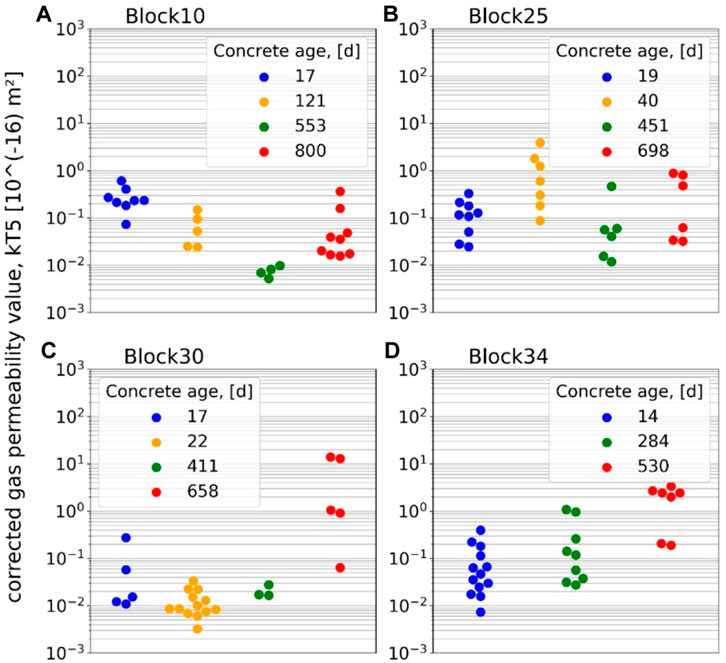
Figure 7. Decadic logarithmic representation of the corrected gas permeability values kT5 in 10−16 m2 as a function of the concrete age in days of (A) block 10, (B) block 25, (C) block 30, (D) block 34.
Note: Figure 7 does not show the number of measurements that could not be carried out due to excessive permeability values during the measurements on 11 July 2023 (shown in red). The number of these measurements that could not be carried out is shown in Table 4.
5.2 Gas permeability vs grinding
For blocks 25, 30 and 34, measuring points in the "good” curing area with unusually high gas permeability values or with poor texture and unevenness were polished and measured again to determine whether there were any measurement differences compared to uneven measuring points. A standard angle grinder was used as the grinding device.
Figure 8 shows that there are hardly any differences between unrefined (blue dots) and polished measuring points (orange dots). All measured gas permeability values of the four blocks from measurement day on 11 July 2023 are shown here.
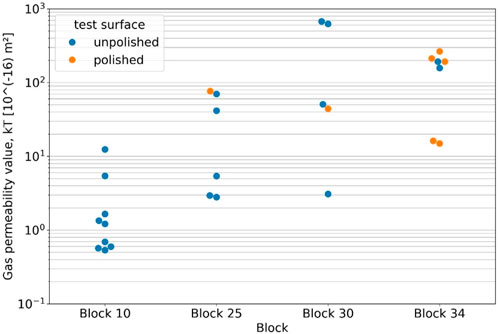
Figure 8. Decadic logarithmic representation of the gas permeability values kT in 10−16 m2 of the grinded and ungrinded measuring points of (A) block 10, (B) block 25, (C) block 30, (D) block 34.
Note: Figure 8 does not show the number of measurements that could not be carried out due to excessive permeability values during the measurements on 11 July 2023. The number of these measurements that could not be carried out is listed in Table 4.
As an example, Figure 9 shows surfaces before and after grinding. In the unpolished state (Figures 9A, C), the formwork texture is still clearly visible, and small pores can also be recognised on the surface. By grinding off the visible surface texture Figures 9B, D, it was possible to eliminate the inhomogeneities and make the pore structure more recognisable. Overall, it can be stated that the measured kT values differed only marginally between unpolished and polished surfaces. Therefore, based on the results, no influence of the original surface texture can be determined.
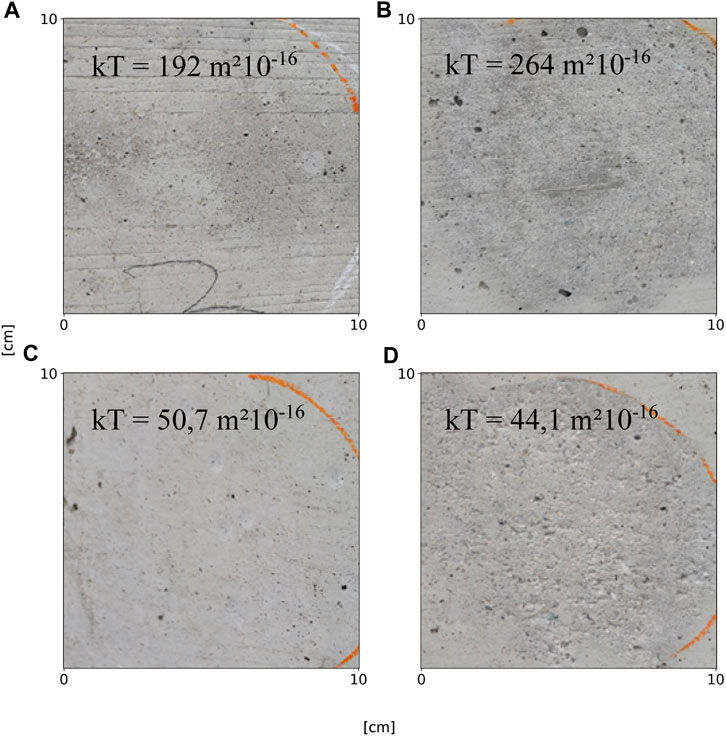
Figure 9. Comparison of unpolished (A, C) and polished (B, D) surfaces of (A, B) block 34 and (C, D) block 30.
5.3 Rebound values vs gas permeability
The rebound hardness of the surface was measured using a rebound hammer at all the measuring points analysed. The values for all blocks are shown in Figure 10 and show rebound values in the range between 34 and 44. As can be seen in this figure, hardly any correlation between the gas permeability results and the rebound values could be determined.
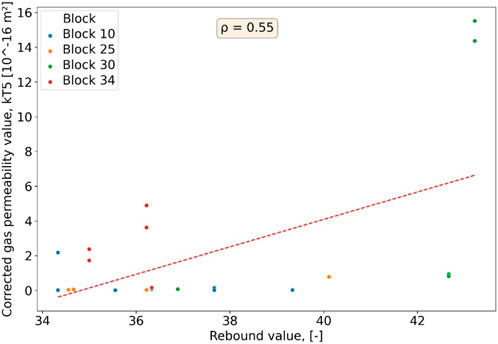
Figure 10. Comparison of the kT5 value and the rebound values, measured with a Schmidthammer.
5.4 Pore test using a diffusing alcohol solution
Selected concrete surfaces of blocks 10 and 25 were analysed with regard to the surface pores using a diffusing alcohol solution. Isopropyl alcohol was applied to partial areas measuring approx. 10 × 10 cm. Surface pores and possible crack development become visible after the solution has diffused. The images in Figures 11, 12 show the surfaces after 30 and 40 s from application of the alcohol solution, as the pores and cracks were most clearly recognisable at this time.
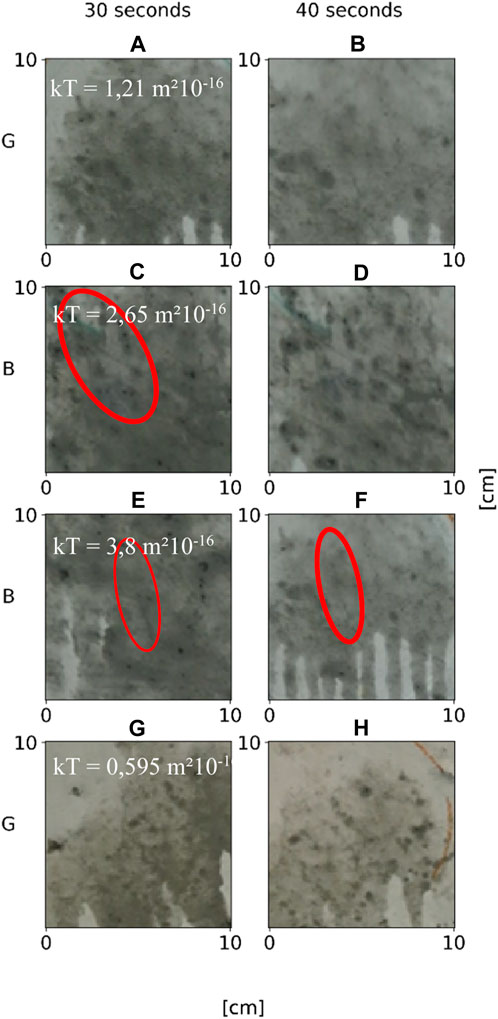
Figure 11. Pore test with diffusing alcohol solution after 30 s (A,C,E,G) and 40 s (B,D,F,H) of impact on concrete surfaces of block 10.
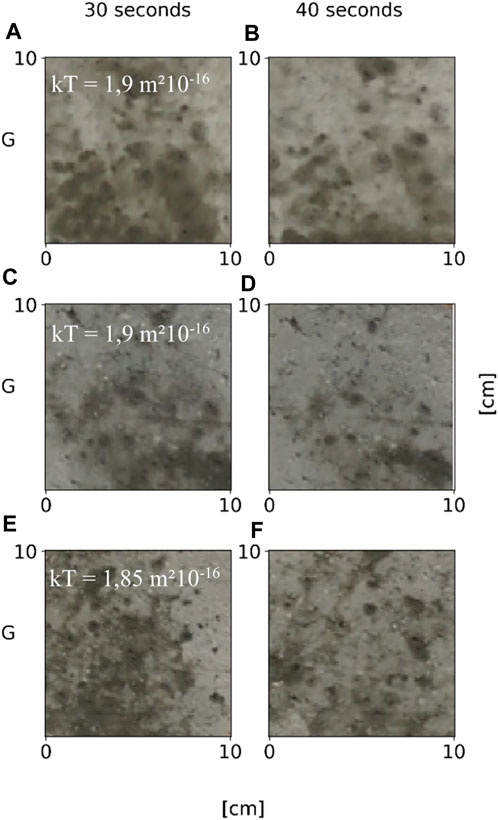
Figure 12. Pore test with diffusing alcohol solution after 30 s (A,C,E) and 40 s (B,D,F) of impact on concrete surfaces of block 25.
The images show a homogeneous surface, isolated larger pores up to a diameter of 5 mm are recognisable in Figures 11G, H.
Based on the gas permeability values and the surface images, the surface shown in Figures 11A, B is classified as "good”; these images are labelled "G". Images with high gas permeability and an inhomogeneous surface are labelled "B". In Figures 11C, D a porous surface structure is recognisable, here a comparatively higher gas permeability was measured. Figures 11E, F also show an increased gas permeability; in addition to the pore structure, a fine crack can also be recognised here, which can influence the permeability.
Numerous cracks were visible to the naked eye in blocks 30 and 34, which have a negative effect on permeability.
5.5 Overall comparison of the surfaces of blocks 10 to 34
Significant differences were found between the concrete surfaces of the analysed blocks 10, 25, 30 and 34. In order to analyse these and determine possible roughness, unevenness or textures, the blocks were recorded with a video camera at a distance of approx. 3 m from the wall and at a height of approx. 1 m. The recordings started at block 34 and ended at block 10. Figure 13 shows representative image sections of the video and their position on the wall. It is noticeable that some images clearly show imprints of the timber formwork texture, such as sections c) and e), while block 10 in particular, with the lowest gas permeability values (see Table 4), has the smoothest surface. The most irregular surface can be seen at Block 30 (Figures 13C, D), where the highest gas permeability was measured according to Table 4. In the dark grey areas, especially in sections c), e) and g), an increasing pore structure is visible to the naked eye compared to block 10 section i), where the surface is rather homogeneous.
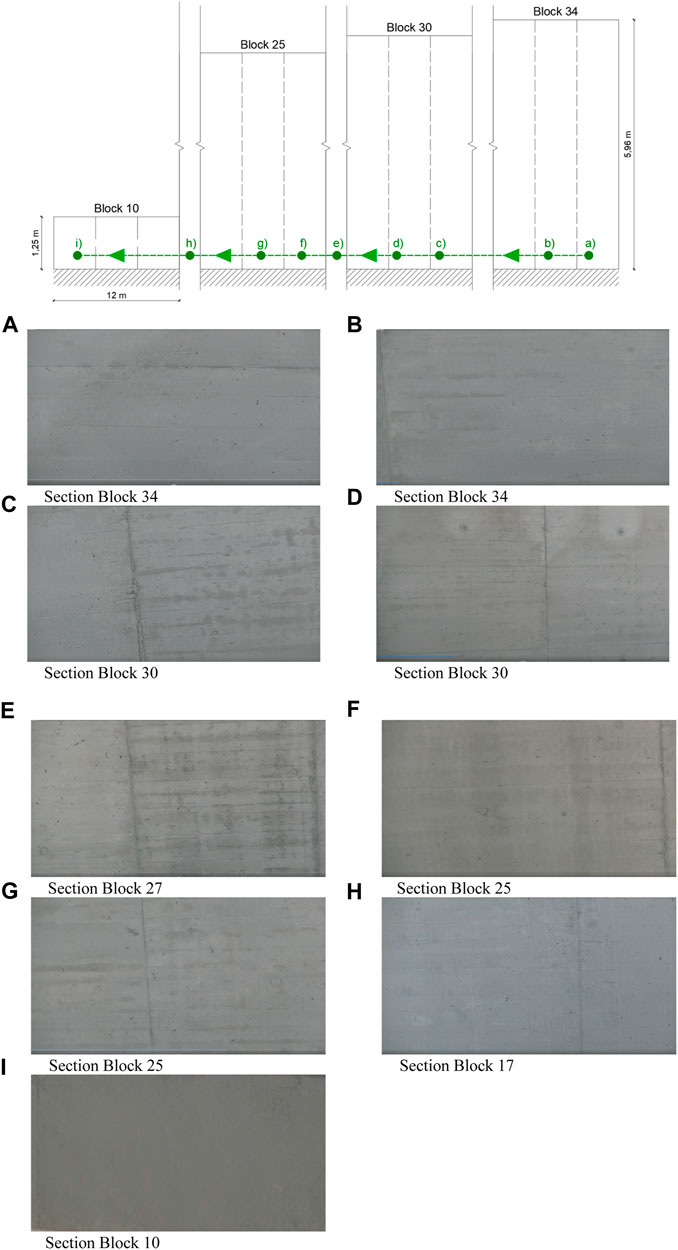
Figure 13. Images of the surfaces of blocks 34 (A,B), 30 (C,D), 27 (E), 25 (F,G), 17 (H), 10 (I) at a scale of approx. 1:20.
The inhomogeneous surfaces of blocks 25, 30 and 34 correlate with the high gas permeability values measured, as shown in Table 4. Block 10 with the lowest gas permeability has the smoothest and most homogeneous surface.
6 Analysis
The supplementary investigations on the ASFINAG motorway S7 construction project were carried out to analyse the condition of concrete walls from different concreting periods at a concrete age of over 500 days. The four investigated south-facing concrete wall sections exhibited very different surface properties despite the same concrete composition. Gas permeability measurements, compressive strength tests with a rebound hammer, pore tests with isopropyl alcohol, moisture measurements and surface photographs using a digital camera were carried out in order to better assess the test method and to be able to make statements about the durability of these concrete structures. Furthermore, the focus of this additional measurement day was on investigating the influence of the texture of the concrete surfaces on the measured gas permeability values.
7 Conclusion
An increase in gas permeability was found for all walls compared to measurements taken when the concrete was younger. However, it is noticeable that the values for blocks 25, 30 and 34 increased very sharply, with very high kT values of up to 673 10−16 m2. In comparison, the maximum values for block 10 were 12.4 10−16 m2. Furthermore, no significant influence of the concrete texture on the gas permeability values could be determined. Cavities have no influence on the measurement result, provided that it is ensured that the outer sealing ring of the pump is not positioned directly on a cavity.
It is assumed that the drying and shrinkage effect is the cause of increased cracking and porosity in older concrete. These properties are clearly visible and measurable at an age of over 500 days. It can be assumed that the prevailing dry and windy climate favours these effects.
The following main conclusions can be drawn from the surveys carried out:
• The condition of the concrete edge zone can be determined using gas permeability.
• The measurements have shown that the limit value recommendations kT ≤ 1.0 10−16 m2 are suitable for testing curing up to approx. 90 days for homogeneous concrete surfaces without microcracking.
• The long-term measurements of blocks 30 and 34 in particular show a clear deterioration of the concrete surface at an advanced age of >500 days (among other things due to the formation of microcracks).
• Grinding the surface has no significant influence on the gas permeability measurement values.
• Moisture compensation of the measured kT values help in identifying abnormally high values, attributable to drying shrinkage cracking.
Data availability statement
The raw data supporting the conclusion of this article will be made available by the authors, without undue reservation.
Author contributions
LP: Methodology, Investigation, Data curation, Writing–review and editing, Writing–original draft, Validation, Supervision, Project administration. AS: Validation, Writing–review and editing, Supervision, Methodology, Investigation, Data curation, Conceptualization. DG: Writing–review and editing, Visualization, Project administration, Investigation. FS: Writing–review and editing, Project administration, Investigation. MM: Writing–review and editing, Investigation. AK: Writing–review and editing, Investigation. SM: Writing–review and editing, Supervision, Conceptualization. PB: Writing–review and editing, Investigation. TM: Writing–review and editing, Supervision. SK: Writing–review and editing, Supervision, Conceptualization. MK: Writing–review and editing, Supervision. RH: Writing–review and editing, Supervision. RT: Writing–review and editing, Supervision, Investigation, Data curation.
Funding
The author(s) declare that financial support was received for the research, authorship, and/or publication of this article. This work was carried out during VIF OptiNB activities. The authors would like to acknowledge the financial support by Bundesminsterium für Klimaschutz, Umwelt, Energie, Mobiliät, Innovation und Technologie, ÖBB and ASFINAG as well as the Austrian Research Promotion Agency (FFG) for supporting this project.
Conflict of interest
This study received funding from ÖBB-Infrastruktur AG and ASFINAG AG. The funders had the following involvement in the study: provision of documents and test objects, support and advice on test execution, expertise on the production of test objects and infrastructure. Authors SM, PB, TM, and SK were employed by Smart Minerals GmbH. Author MK was employed by Asfinag AG. Author RH was employed by ÖBB-Infrastruktur AG. Author RT was employed by Materials Advanced Services Ltd.
Publisher’s note
All claims expressed in this article are solely those of the authors and do not necessarily represent those of their affiliated organizations, or those of the publisher, the editors and the reviewers. Any product that may be evaluated in this article, or claim that may be made by its manufacturer, is not guaranteed or endorsed by the publisher.
References
Alexander, M., Bentur, A., and Mindess, S. (2017) Durability of concrete: design and construction. London, United Kingdom: CRC Press.
Basheer, L., Kropp, J., and Cleland, D. J. (2001). Assessment of the durability of concrete from its permeation properties: a review. Constr. Build. Mater. 15, 93–103. doi:10.1016/S0950-0618(00)00058-1
Bergmeister, K., Aktan, A. E., Bucher, C., Dorfmann, L., Fehling, E., Frey, R. P., et al. (2003) Fib Bulletin 22. Monitoring and safety evaluation of existing concrete structures. fib. Lausanne, Switzerland: The International Federation for Structural Concrete. doi:10.35789/fib.BULL.0022
Beushausen, H., and Fernandez Luco, L. (2015) Performance-based specifications and control of concrete durability: state-of-the-art report RILEM TC 230-PSC. Vol. 18. doi:10.1007/978-94-017-7309-6
Bos, C., Peyerl, M., Strauss, A., Ptacek, L., and Boisits, P. (2020). Optimale NachBehandlung für verbesserte Qualität bei der Bauausführung - OptiNB. Projektbericht.
Bueno, V., Nakarai, K., Nguyen, M. H., Torrent, R. J., and Ujike, I. (2021). Effect of surface moisture on air-permeability kT and its correction. Mater Struct. 54, 89. doi:10.1617/s11527-021-01666-1
Deutscher Zementwerke, V. (2008). in Zement-taschenbuch. 51. Aufl (Düsseldorf: Verlag Bau + Technik).
Ebensperger, L., and Torrent, R. (2012) Measurement of the air permeability of concrete “in situ”: status quo, Cape Town. doi:10.13140/2.1.3575.1367
Fridrich, C., and Kulhanek-Wehlend, G. (2002) unterwegs 3 Geographie und Wirtschaftskunde. 1. Auflage. Wien: Österreichischer Bundesverlag ÖBVHPT.
global 6 (2023) Geographie und Wirtschaftskunde, Schulbuch. Available at: https://www.oebv.at/flippingbook/9783209085726/20/(Accessed October 31, 2023).
Hilsdorf, H., and Kropp, J. (1995) Performance criteria for concrete durability. London: E and FN SPON. doi:10.1201/9781482271522
Hilsdorf, H. K. (1989). Durability of concrete: a measurable quantity? IABSE Symp. Rep. Lisbon 57/1, 111–123. doi:10.5169/seals-44200
Jacobs, F. (2006). “Luftpermeabilität als Kenngrösse für die Qualität des Überdeckungsbetons von Betonbauwerken,” in Wildegg: Technische Forschung und Beratung für Zement und Beton.
Klimaprovinzen Österreichs — Theoretisches Material (2023) Geografie und Wirtschaftskunde, 11. Schulstufe. Available at: https://www.yaclass.at/p/geografie-und-wirtschaftskunde/11-schulstufe/oesterreich-raum-gesellschaft-wirtschaft-19273/naturraeumliche-chancen-und-risiken-19089/re-23f1fdc4-b3a6-4806-9742-cd4136336650 (Accessed October 31, 2023).
öbv - Österreichische Bautechnik Vereinigung (2018) Richtlinie “wasserundurchlässige betonbauwerke - weiße wannen”.
ON Österreichisches Normungsinstitut (2018) ÖNORM B4710-1 Beton - Festlegung, Eigenschaften, Herstellung, Verwendung und Konformität Teil 1.
Parrott, L. J. (1990). “Carbonation, corrosion and standardization,” in Protection of concrete (Dundee, Scotland: E and FN Spon), 1009–1023.
Schönlin, K., and Hilsdorf, H. K. (1987). Evaluation of the effectiveness of curing of concrete structures. SP 100, 207–226. doi:10.14359/3541
SIA Zurich (2019) Schweizer norm SIA 262/1:2019, betonbau - ergänzende festlegungen. Zürich, Switzerland: Anhang E.
Torrent, R., and Frenzer, G. (1995). A method for the rapid determination of the coefficient of permeability of the “covercrete.”. Int. Symposium Non-Destructive Test. Civ. Eng. (NDT-CE), 985–992.
Torrent, R. J. (1992). A two-chamber vacuum cell for measuring the coefficient of permeability to air of the concrete cover on site. Mater. Struct. 25, 358–365. doi:10.1007/BF02472595
Torrent, R. J., Neves, R. D., and Imamoto, K. (2021) Concrete permeability and durability performance: from theory to field applications. Boca Raton: CRC Press. doi:10.1201/9780429505652
Wasserman, R., and Bentur, A. (2013). Efficiency of curing technologies: strength and durability. Mater Struct. 46, 1833–1842. doi:10.1617/s11527-013-0021-9
Keywords: concrete quality, curing, gas permeability, non-destructive testing, durability
Citation: Ptacek L, Strauss A, Grba D, Sattler F, Macha M, Kosta A, Marchtrenker S, Boisits P, Manninger T, Krispel S, Kleiser M, Hausenberger R and Torrent R (2024) Performance based concrete quality assessment with gas permeability testing on site. Front. Built Environ. 10:1396801. doi: 10.3389/fbuil.2024.1396801
Received: 06 March 2024; Accepted: 07 May 2024;
Published: 28 May 2024.
Edited by:
Numa Bertola, University of Luxembourg, LuxembourgReviewed by:
David Conciatori, Laval University, CanadaMarijana Serdar, University of Zagreb, Croatia
Copyright © 2024 Ptacek, Strauss, Grba, Sattler, Macha, Kosta, Marchtrenker, Boisits, Manninger, Krispel, Kleiser, Hausenberger and Torrent. This is an open-access article distributed under the terms of the Creative Commons Attribution License (CC BY). The use, distribution or reproduction in other forums is permitted, provided the original author(s) and the copyright owner(s) are credited and that the original publication in this journal is cited, in accordance with accepted academic practice. No use, distribution or reproduction is permitted which does not comply with these terms.
*Correspondence: Lisa Ptacek, lisa.ptacek@boku.ac.at