Long Non-coding RNA H19 Regulates Porcine Satellite Cell Differentiation Through miR-140-5p/SOX4 and DBN1
 Jingxuan Li1,2,3†
  Tao Su1,2†
  Cheng Zou1,2 Wenzhe Luo1,2
  Gaoli Shi1,2
  Lin Chen1,2
  Chengchi Fang1,2,4
  Changchun Li1,2,4*
- 1Key Laboratory of Agricultural Animal Genetics, Breeding and Reproduction of the Ministry of Education, Huazhong Agricultural University, Wuhan, China
- 2Key Laboratory of Swine Genetics and Breeding of the Ministry of Agriculture, Huazhong Agricultural University, Wuhan, China
- 3Shandong Provincial Key Laboratory of Animal Disease Control and Breeding, Institute of Animal Science and Veterinary Medicine, Shandong Academy of Agricultural Sciences, Jinan, China
- 4The Cooperative Innovation Center for Sustainable Pig Production of Hubei Province, Wuhan, China
The H19 gene promotes skeletal muscle differentiation in mice, but the regulatory models and mechanisms of myogenesis regulated by H19 are largely unknown in pigs. Therefore, the regulatory modes of H19 in the differentiation of porcine skeletal muscle satellite cells (PSCs) need to be determined. We observed that H19 gene silencing could decrease the expressions of the myogenin (MYOG) gene, myogenic differentiation (MYOD), and myosin heavy chain (MYHC) in PSCs. Therefore, we constructed and sequenced 12 cDNA libraries of PSCs after knockdown of H19 at two differentiation time points to analyze the transcriptome differences. A total of 11,419 differentially expressed genes (DEGs) were identified. Among these DEGs, we found through bioinformatics analysis and protein interaction experiment that SRY-box transcription factor 4 (SOX4) and Drebrin 1 (DBN1) were the key genes in H19-regulated PSC differentiation. Functional analysis shows that SOX4 and DBN1 promote PSC differentiation. Mechanistically, H19 regulates PSC differentiation through two different pathways. On the one hand, H19 functions as a molecular sponge of miR-140-5p, which inhibits the differentiation of PSCs, thereby modulating the derepression of SOX4. On the other hand, H19 regulates PSC differentiation through directly binding with DBN1. Furthermore, MYOD binds to the promoters of H19 and DBN1. The knockdown of MYOD inhibits the expression of H19 and DBN1. We determined the function of H19 and provided a molecular model to elucidate H19’s role in regulating PSC differentiation.
Introduction
Myogenesis in the adult pig is a highly regulated process that includes the activation of muscle stem cells, proliferation and differentiation of myoblasts, and cell fusion to form multinucleated myotubes, which eventually differentiate into muscle fiber (Li et al., 2016, 2019; Zhu et al., 2017). The canonical adult myogenic progenitors, named satellite cells (SCs) and located between the basement membrane and the muscle sarcolemma in myofibers, are essential for skeletal muscle maintenance, regeneration, and differentiation (Wang and Rudnicki, 2011; Relaix and Zammit, 2012; Ding et al., 2017; Zammit, 2017). Several long non-coding RNAs (lncRNAs) are involved in this process. For example, lncRNA AK017368 can promote proliferation and restrain differentiation of C2C12 cells (Liang et al., 2018). lncMD can promote the differentiation of bovine myoblasts by acting as a ceRNA to sequester miR-125b, thereby leading to the rise of the insulin-like growth factor 2 (IGF2) expression level (Sun et al., 2016). Recently, Jin et al. (2018) found that the SYISL gene recruits the enhancer of zeste homolog 2 (EZH2) protein to the promoters of the cell-cycle inhibitor gene p21 and muscle-specific genes and further regulates proliferation and differentiation of SCs in mice.
H19 is among the best-known lncRNAs and also has a critical function in skeletal muscle differentiation (Giovarelli et al., 2014; Liu et al., 2017). For example, H19-encoded microRNAs miR-675-5p and miR-675-3p can execute the prodifferentiation function of H19 in skeletal muscle lacking endogenous H19 (Dey et al., 2014). Xu et al. (2017) also demonstrated that H19 could promote the differentiation of bovine skeletal muscle SCs by suppressing Sirt1/FoxO1. These discoveries demonstrate that H19 plays an important role in porcine skeletal muscle SC (PSC) differentiation and myogenesis through different molecular mechanisms in different species or different tissues. However, the function of H19 gene in PSC differentiation is poorly understood. Meanwhile, we aimed to explore new molecular mechanisms in this process.
In this study, we found that H19 is essential and required for PSC differentiation. We performed transcriptome analysis of PSCs after knockdown of H19 to identify the candidate genes regulated by H19 and their potential roles in PSC differentiation. The candidate target genes of H19, microRNA miR-140-5p and mRNA SRY-box transcription factor 4 (SOX4), were predicted by bioinformatics analysis and validated in vitro. Simultaneously, the function of miR-140-5p and SOX4 in PSC differentiation was explored. Moreover, we used a pull-down experiment to find the protein binding with H19. Then, we explored the role of this protein in cell differentiation. In summary, this study aimed to facilitate the understanding of the mechanisms of H19 in PSC differentiation and construct a potential gene network between H19 and the target genes affecting this process.
Materials and Methods
Animals and PSCs Isolation
Animal care and all the experimentation in this study were carried out in accordance with the preapproved guidelines from Regulation Proclamation No. 5 of the Standing Committee of Hubei People’s Congress. All experimental protocols were approved by the Ethics Committee of Huazhong Agricultural University, Wuhan City, Hubei Province, China.
Seven tissues, including myocardium, lung, stomach, skeletal muscle (the skeletal muscle tissue was collected from the biceps femoris), lymph, kidney, and encephalon, were collected strictly according to the anatomy of the pigs. All tissue samples came from three 2-year-old Yorkshire boars.
All the PSCs were isolated from 3-day-old Yorkshire male pigs. The muscle of extremities (including triceps, biceps femoris, semitendinosus, semimembranosus, and gastrocnemius) were collected and kept in PBS supplement with 1% antibiotic-antimycoti. The tissues were dissected and digested with collagenase II (Gibco, Life Technologies, United States, Cat#17101-015, 1 mg/mL) in a 37°C water bath shaking table for 2 h. After digestion was termination with DMEM, including 10% FBS. The mixture was filtered through a 100-μm cell strainer and centrifuged at 2500 r/min for 15 min. Then, we removed the supernatant, and the precipitation was resuspended by PBS and centrifuged at 2200 r/min for 12 min. Next, 70- and 40-μm cell strainers were continued and the supernatant similarly removed and then resuspended with RPMI 1640 (Gibco, United States, Cat#A10491-01) and centrifuged at 2000 r/min for 10 min. Last, the cells were suspended with 20% FBS (Gibco, Life Technologies, United States, Cat#10270) and transferred to the culture dish. After 2.5 h, the cell suspension was transferred to the new culture dishes, which were coated with Matrigel (Corning, BD, United States, Cat# 356234); the cells left in the original cell culture dishes are fibroblasts.
PSCs Culture and Differentiation
Isolated PSCs were cultured on Matrigel (BD, Cat# 356234) coated 10-cm plates (Corning Cat#430167) in PM + medium (PM + medium containing 76.5% RPMI 1640 (Life, Cat#A10491), 20% FBS, 0.5% chicken embryo extract (GEMINI, Cat#100-163P), 1% GlutaMax (Gibco, Life Technologies, United States, Cat#35050-061), 1% non-essential amino acids (Gibco, Life Technologies, United States, Cat#11140-050), 1% antibiotic-antimycotic (Gibco, Life Technologies, United States, Cat#15240-062), and 2.5 ng/mL human recombinant basic fibroblast growth factor (Gibco, Invitrogen, United States, Cat#13256029). When cells grow to 70%, they can be inoculated into six-hole plates or new culture dishes for subsequent experiments. In order to separate SCs from fibroblast cells, the cells were incubated in an uncoated dish at 37°C for 2.5 h and then transferred to a new Matrigel-coated dish.
To observe the formation of myotubes, PSCs were differentiated in DMEM containing 5% horse serum (HyClone, Cat#SH30074.02) for different time points, changing the culture medium every day.
5′ and 3′ Rapid Amplification of cDNA Ends (RACE) and Full-Length lncRNA Cloning
To determine the transcription start points and the full length of the H19 transcripts, the primary myoblasts were collected for total RNA extraction by using RNAiso reagent (Takara, Japan, 9109). There were approximately 2 × 10⁶ cells for the experiment. Then, the 5′ and 3′ rapid amplification of cDNA ends (RACE) experiments were carried out. We used the Takara SMARTer RACE cDNA Amplification Kit (Clontech, United States, 634858) according to the manufacturer’s instructions, and the gene-specifc primers used for PCR were as follows:
GSP1 (ACTCGCTTGAGATGCTCTTTCCACCTG)
GSP2-1 (GGTCAATTTTGGTTTCAGGTCGTGGC)
GSP2-2 (CCAGGTGGAAAGAGCATCTCAAGCG)
The PCR products were separated on 1.5% agarose gels, and the bands were extracted and inserted into the pRACE vector. The clones were selected randomly to perform PCR amplification. Then, the positive clones were sent to the company for Sanger sequencing. Sequences were aligned with BLAST in the NCBI standard nucleotide BLAST.
Nuclear and Cytoplasmic RNA Fractionation
We collected PSCs in proliferative and differentiated periods, respectively; they were washed twice with cold PBS and centrifuged at 500 g for 3 min. The 0.2 mL lysis buffer [50 mM Tris-HCl pH 8.0, 140 mM NaCl, 1.5 mM MgCl2, 0.5% Octylphenoxy poly (ethyleneoxy) ethanol IGEPAL CA-630, 1 U/μL RNase inhibitor, 1 mM DTT] was used to resuspend the lipid precipitation, which was then placed on ice for 5 min and centrifuged at 500 g for 3 min at 4°C. The supernatant was transferred to a new 1.5-mL microcentrifuge tube without RNase and centrifuged at 14,000 r/min for 1 min. The supernatant was transferred to another microcentrifuge tube, 1 ml Trizol was added, and they were mixed, which is the cytoplasmic RNA. The nuclear RNA was mixed in the precipitation. The deposit was washed with 0.2 mL lysis buffer, and all nuclear and cytoplasmic RNA were extracted with 1 mL TRIzol.
Transfection of siRNAs
We used Lipofectamine 2000 (Invitrogen, Life Technologies, United States, Cat#11668019) to transfect siRNA or ASO specific for H19, SOX4, Drebrin 1 (DBN1), and MYOD. The siRNA sequences were as follows:
siH19-1
(CCUAUAGGCAGGGCAACAUTTdT; AUGUUGCCCUGCCUAUAGGTTdT)
siH19-2
(GAGCACACAUGGGUACCUUTTdT; AAGGUACCCAUGUGUGCUCTTdT)
siH19-3
(CCUCCUAGCUCUGACUCAATTdT; UUGAGUCAGAGCUAGGAGGTTdT)
SOX4 ASO (GTACTTGTAGTCGGGGTAGT)
DBN1 siRNA
(GGAGUUUGCCCAAUCGGAATTdT; UUCCGAUUGGGCAAACUCCTTdT)
MYOD siRNA
(GCUACGACGGCACCUAUUATTdT; AAUAGGUGCCGUCGUAGCTTdT)
Negative control (NC) siRNA
(UUCUCCGAACGUGUCACGUTTdT; ACGUGACACGUUCGGAGAATTdT).
The miR-140-5p mimic, inhibitor, mimic NC, and inhibitor NC were as follows:
miR-140-5p mimic
(AGUGGUUUUACCCUAUGGUAGdT; ACCAUAGGGUAAAACCACUUUdT)
miR-140-5p inhibitor (CUACCAUAGGGUAAAACCACU)
mimic NC and inhibitor NC (CAGUACUUUUGUGUAGUACAA)
The RNA oligo against porcine H19, miR-140-5p, DBN1, and MYOD were purchased from genepharma. The ASO against SOX4 were purchased from Sangon Biotech (Shanghai). The 50 nM RNA oligo or ASO specific to each gene (and NC siRNA) were transfected to PSCs in PM + medium and transferred to DM after 24 h. Then, the cells were harvested on DM 36 h.
Plasmid Construction and Cell Transfection
For the H19, SOX4, and DBN1 overexpression plasmids, full-length sequences were cloned into the pcDNA3.1 plasmid. The truncated H19 were obtained by PCR using H19-pcDNA3.1 plasmid as a template and then were cloned into pcDNA3.1. Full-length H19, H19-mutant, SOX4, and DBN1 sequences were amplified according to primers (Supplementary Table S2). For cell transfection, PSCs were transfected with 3 μg of the expression vectors in each well of a six-well plate. Then, the cells were harvested on DM 36 h.
Isolation of Total RNA and Performance of Quantitative Polymerase Chain Reaction (qPCR)
Total RNA was extracted using the RNAiso reagent (Takara, Japan, 9109) from the PSCs following the manufacturer’s instructions. The RNA samples were quantitated and subjected to quality inspection. cDNA synthesis for mRNA detection was carried out using the RevertAid First Strand cDNA Synthesis Kit (Thermo, China, Cat#k1622). Quantitative polymerase chain reaction (qPCR) for mRNA detection was carried out in the Roche LightCyler 480 system (Roche, Mannheinm, Germany) using SYBR Green (CWBIO, China, CW0957) according to the manufacturer’s instructions. The quantitative real-time polymerase chain reaction (qRT-PCR) data were analyzed using the 2–ΔΔCT method as previously described (Anders et al., 2015). The relative fold changes of mRNA expression were quantified by normalizing the cycle threshold (CT) value of the experimental gene to the mean CT value of the control 18s gene.
Western Blotting and Antibodies
The protein expression levels of the myogenin (MYOG) gene, myogenic differentiation (MYOD), and myosin heavy chain (MYHC), DBN1, SOX4 in PSCs were detected by performing immunoblotting. Transfected cells were lyzed in RIPA buffer with 1% PMSF and loaded protein onto a SDS-PAGE gel and transferred them onto a PVDF membrane, and non-specific binding was blocked with 5% non-fat milk in Tris-buffered saline with Tween 20 for 4 h. Then, they were incubated with 1:500 diluted polyclonal mouse MYOG (Abcam, United Kingdom, Cat#ab1835), 1:1000 diluted polyclonal rabbit MYOD (Abclonal, China, Cat#A0671), 1:3000 diluted polyclonal mouse MYHC antibody (Milipore, China, Cat#05-716), 1:1000 diluted polyclonal rabbit DBN1 (Abclonal, China, Cat#A6366), and 1:1000 diluted polyclonal rabbit SOX4 (Bioss, China, Cat#bs-11208R) at 4°C overnight, respectively. The blots were subsequently incubated with HRP conjugated secondary antibody (1:4000), including HRP-labeled goat antimouse IgG (Servicebio, China, Cat#GB23301) and HRP-labeled goat antirabbit IgG (Servicebio, China, Cat#GB23303). ECL substrates were used to visualize signals (Beyotime, China, Cat#P0018A). β-Tubulin (Servicebio, China, Cat#GB13017-2) was used as an endogenous protein for normalization. Image J software was used to conduct quantitative analysis of Western blotting results according to the gray value of the strip.
Immunofluorescent Analysis of Cultured Cells
Cultured SCs were fixed with ice-cold 4% paraformaldehyde (in PBS) for 15 min, rinsed with PBS, and permeabilized in 0.3% Triton X-100 (in PBS) for 10 min. Fixed and permeabilized cells were blocked with blocking solution [3% bovine serum albumin (BSA), 0.3% TritonX-100, 10% FBS complemented with PBS] and incubated with 1:1000 diluted polyclonal mouse MYHC (Milipore, China, Cat#05-716) antibodies overnight at 4°C. Then, washing cells with PBS, the cells were incubated with Alexa 594-labeled donkey antimouse IgG antibodies (Antgene, China, Cat#ANT029) for 1 h at room temperature. Last, the cells were stained with Hoechst 33342 (Sanofi-Aventis, Germany, C1022) for 10 min and washed with PBS twice. All images were acquired by a Leica SP8 confocal microscope and processed with Adobe Photoshop CS6 to adjust brightness and contrast for publication. Exposure, contrast, brightness, and other image parameters were the same in both the experimental and control groups. Immunofluorescence results were quantified by Image J software.
Library Construction and Sequencing
In total, 3 μg of RNA for each sample was used to construct sequencing libraries. The libraries were sequenced on an Illumina HiseqTM 2500 platform, and 100 bp paired-end reads were generated. Next, we use the HISAT2 (version 2.0.2) to get the qualified and clean reads mapped to the pig reference genome (Sus scrofa 11.1), and stringTie (version 1.2.2) was used to assemble the mapped reads with default parameters.
Identification of Differentially Expressed Genes (DEGs)
First, the expression level of each gene was calculated using the HTseq software (0.6.1) and normalized based on the reads per FPKM method (Mortazavi et al., 2008; Anders et al., 2015). Subsequently, differentially expressed genes (DEGs) were identified using the R packages DEGseq 2 (Wang et al., 2010).
Cluster Analysis and Functional Annotation of DEGs
Cluster analysis was conducted using the Pheatmap software in R package to identify genes with similar expression patterns, which often have similar functions. GO and KEGG pathway enrichment analyses were performed by DAVID analysis by running queries for each protein-coding gene against the DAVID database.
RNA Fluorescent in situ Hybridization (FISH)
Cells were briefly rinsed in PBS and fixed in 4% formaldehyde in PBS for 10 min at room temperature. Then, the cells were permeabilized in PBS containing 0.5% Triton X-100. The experiments were performed using a fluorescent in situ hybridization (FISH) Kit (Guangzhou RiboBio Co. Ltd., Guangzhou, China) according to the manufacturer’s instructions in the following steps. Briefly, the cells were incubated with the RNA probes in hybridization buffer overnight at 37°C. The cells were washed three times with different concentrations of SSC buffer, stained with 4′, 6-diamidino-2-phenylindole (DAPI) for 10 min at room temperature, and then rinsed in PBS and, finally, examined using a confocal laser-scanning microscope.
Luciferase Reporter Assay
Wild-type (WT) H19, mutated H19, WT SOX4, or mutated SOX4 sequence were inserted into pGL3-basic vector. The reconstructed plasmids were transfected into PSCs. PSCs were cultured in 24-well plates, the cells were harvested after 24 h of transfection, and luciferase assays were performed with the Dual-Luciferase Reporter Assay System (Promega, Madison, WI, United States).
Pull-Down Assay With Biotinylated miR-140-5p (Biotin-miR-140-5p)
A biotin pull-down assay was performed as previously described (Yu et al., 2017; Zhu et al., 2017). After 48 h of PSCs transfected with biotin-miR-140-5p or biotin-miR-140-5p-mut, the cells were washed with PBS, followed by incubation in a lysis (10 mM KCl, 1.5 mM MgCl2, 10 mM Tris-HCl at pH 7.5, 5 mM dithiothreitol) with RNase inhibitor (Thermo Fisher) and proteinase inhibitor cocktail (Roche) buffer for 30 min. The 500 μL NaCl (1 M) and 50 μl beads (Invitrogen) were added into the supernatant after it was centrifuged for 5 min at 12,000 g. The beads were blocked for 12 h in lysis buffer, including BSA, before use. Then the lysates were incubated with beads at 4°C for 4 h. After incubation, the beads were washed five times using washing buffer (5 mM Tris-HCl pH 7.5, 0.5 mM EDTA, 1 M NaCl). Trizol was used to extract RNA and evaluated by qPCR assay.
RNA Pull-Down Assay
RNA pull down was performed as previously described. In brief, full-length sense and antisense H19 were amplified by PCR and cloned using a pcDNA3.1 Vector. Biotin-labeled RNAs were generated by an in vitro transcription reaction with Biotin RNA Labeling Mix and T7 RNA polymerase (Roche Life Science) and then treated with Dnase I and EDTA. In total, 3 μg of biotinylated RNA was incubated with proteins extracted from PSCs and then the RNAs were targeted with streptavidin beads. Finally, the protein complexes associated with the beads were analyzed by mass spectrometry (MS) and western blot.
RNA Immunoprecipitation (RIP) Assay
For RNA immunoprecipitation (RIP), cells were lyzed with cell lysis buffer (Cell Signaling Technology) supplemented with PMSF (Genstar). RIP was performed using the Magna RIP RNA-Binding Protein Immunoprecipitation Kit (Millipore, Burlington, MA, United States) according to the manufacturer’s instructions. The antibody against DBN1 was used for RIP. The co-precipitated RNAs were detected by reverse-transcription polymerase chain reaction assay.
Colocalization of lncRNA and Protein
For colocalization analysis of H19 and DBN1, cells were first hybridized with anti-H19 probe. Then the cells were rinsed in PBS and incubated with 1:100 diluted polyclonal rabbit DBN1 antibody (Abclonal, China, Cat# A6366) at 4°C overnight. The next day, the cells were incubated in the specified secondary antibodies and counterstained with DAPI. Images were obtained with a confocal laser-scanning microscope.
Chromatin Immunoprecipitation (ChIP) Assays
Chromatin immunoprecipitation (ChIP) assay was performed using the ChIP Kit (Beyotime, P2078) according to the manufacturer’s instructions. Each ChIP reaction was performed using 107 cells and 10 μg of antibodies against MYOD (Abclonal, China, Cat#A0671). IgG was used as the negative control. Fold enrichment was quantified using qPCR.
Statistical Analysis
All results were presented as mean ± standard error of mean (SEM). Multigroup comparisons of the means were carried out by a one-way analysis of variance test with post hoc contrasts by the Student–Newman–Keuls test. The two-tailed Student’s t-test was performed for significance analysis by using SAS software. P < 0.05 indicated the significant difference.
Results
Characterization of H19 and Identification of Its Function in PSCs
We detected the expression pattern of H19 in different tissues using qRT-PCR to explore the function of H19 in porcine myogenesis. As shown in Figure 1A, H19 features a relatively high expression level in skeletal muscle tissues. The expression pattern of H19 in PSCs was observed at different proliferation and differentiation time points. H19 had a higher expression level in the differentiation period than in the proliferation period, and its expression level increased with differentiation time points (Figure 1B), thereby suggesting the possible role of H19 in PSC differentiation. We also detected the expression level of three marker genes in PSCs (Figure 1C and Supplementary Figure S1). The full-length cDNA sequence of H19 was identified by performing 5′ and 3′ RACE. H19 is a 2280-nucleotide transcript with a poly (A) tail (Figure 1D). The full-length sequence of H19 is shown in Supplementary Sequence S1. The conservation of H19 was analyzed in human, mouse, and pig (Supplementary Figure S2), and it showed that H19 was partially conservative. Furthermore, nuclei and cytosol RNA were partitioned from PSCs to detect the cellular location of H19 by qRT-PCR analysis. H19 transcript was located in nearly equal amounts in the cytoplasm and nucleus at the proliferation stage (myoblasts). However, when cells differentiate (myotubes), higher H19 expression was observed in the cytoplasm than in the nucleus (Figure 1E). Simultaneously, the results from FISH also showed that H19 was located in both the nucleus and cytoplasm of PSCs (Figure 1F and Supplementary Figure S3).
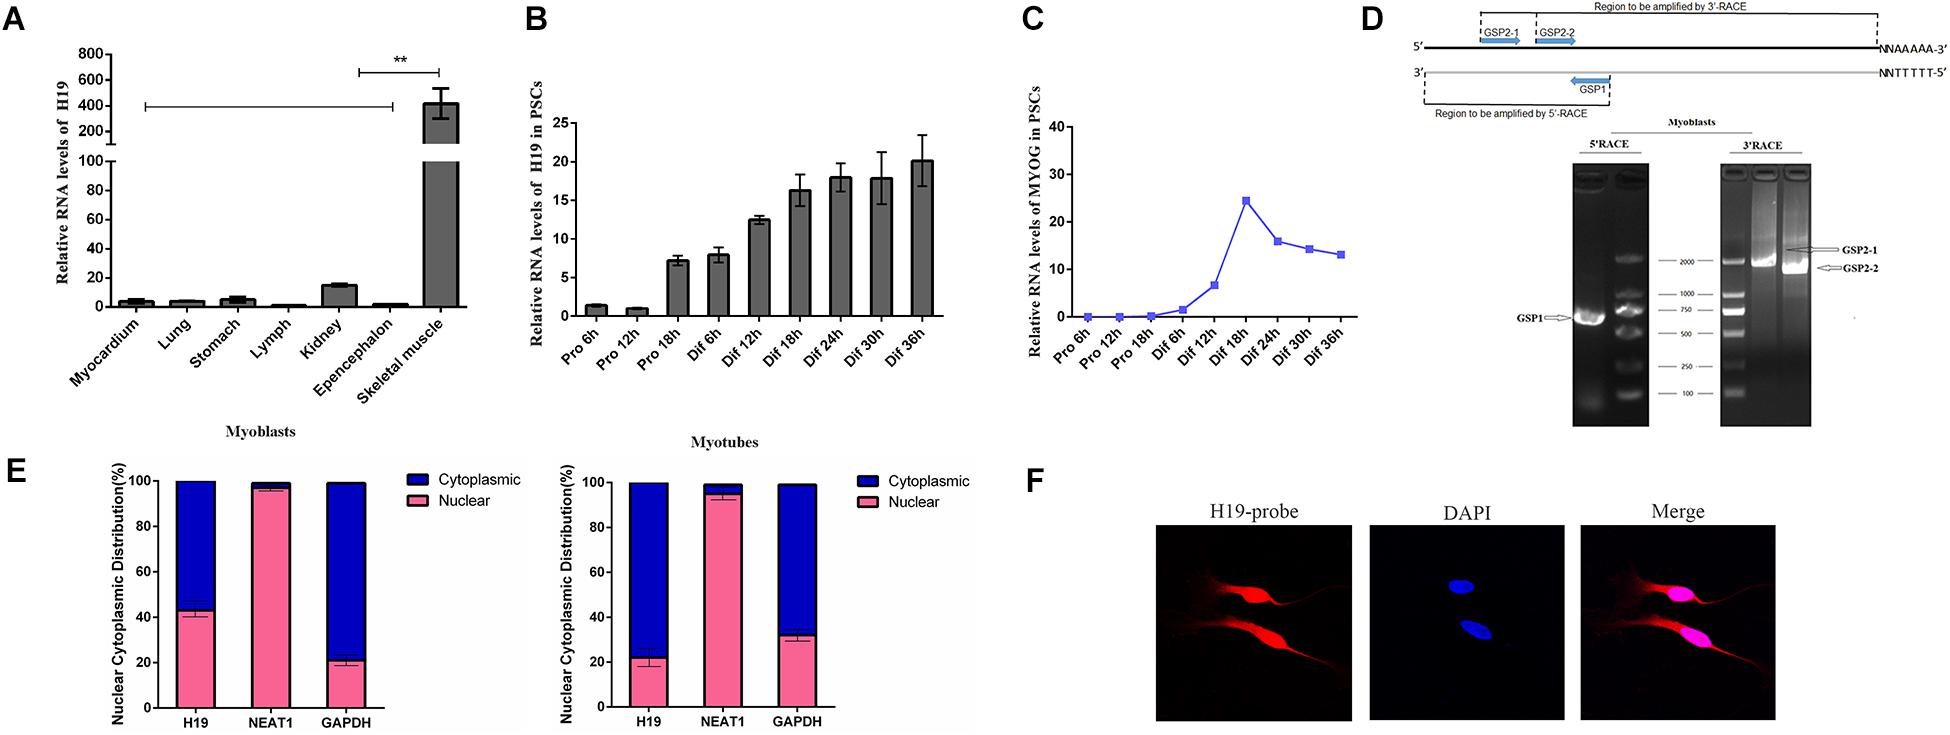
Figure 1. Expression pattern and characterization of H19. (A) Real-time PCR analysis of H19 expression in different tissues of Yorkshire. Mean values ± SEM, n = 3, **P < 0.01. (B) Real-time PCR analysis of H19 expression in PSCs during the period of proliferation and differentiation. There is a 6-h interval between each period. Mean values ± SEM, n = 3. (C) Real-time PCR analysis of MYOG, MYOD, and MYHC expression in PSCs during the period of proliferation and differentiation. There is a 6-h interval between each period. Mean values ± SEM, n = 3. (D) Agarose gelelectrophoresis showing the 5′ and 3′ RACE results of H19 for 2 days’ proliferation. Left, 5′RACE product of GSP1 (710 bp); right, 3′RACE product of GSP2-1 (1922 bp) and GSP2-2 (1597 bp). (E) RNA of PSCs was fractionated into nuclei and cytosol fractions. H19 subcellular distribution was calculated by qPCR assay data, the graphs showed the expression in myoblasts and myotubes, and NEAT1 and GAPDH were used as the nuclear control and cytoplasmic control, respectively. (F) Confocal FISH images showing localization of H19 in PSCs.
We knocked down H19 in PSCs to further determine the role of H19 in skeletal muscle cell differentiation. Three independent small interfering RNA (siRNA) specific to porcine H19 were designed and transfected in PSC cultured in growth and differentiation mediums after 12 h proliferation with NC siRNA as NC. The cells were harvested at 24 and 36 h after induced differentiation. siH19-3 had the highest knockdown efficiency as shown in Figure 2A. Hence, siH19-3 was used for subsequent experiments. Successful knockdown of H19 significantly inhibited PSC differentiation as proven by the reduced expression of MYOG, MYOD, and MYHC and the decreased number of positive myotubes (Figures 2B–D). H19 may promote PSC differentiation into myotubes.
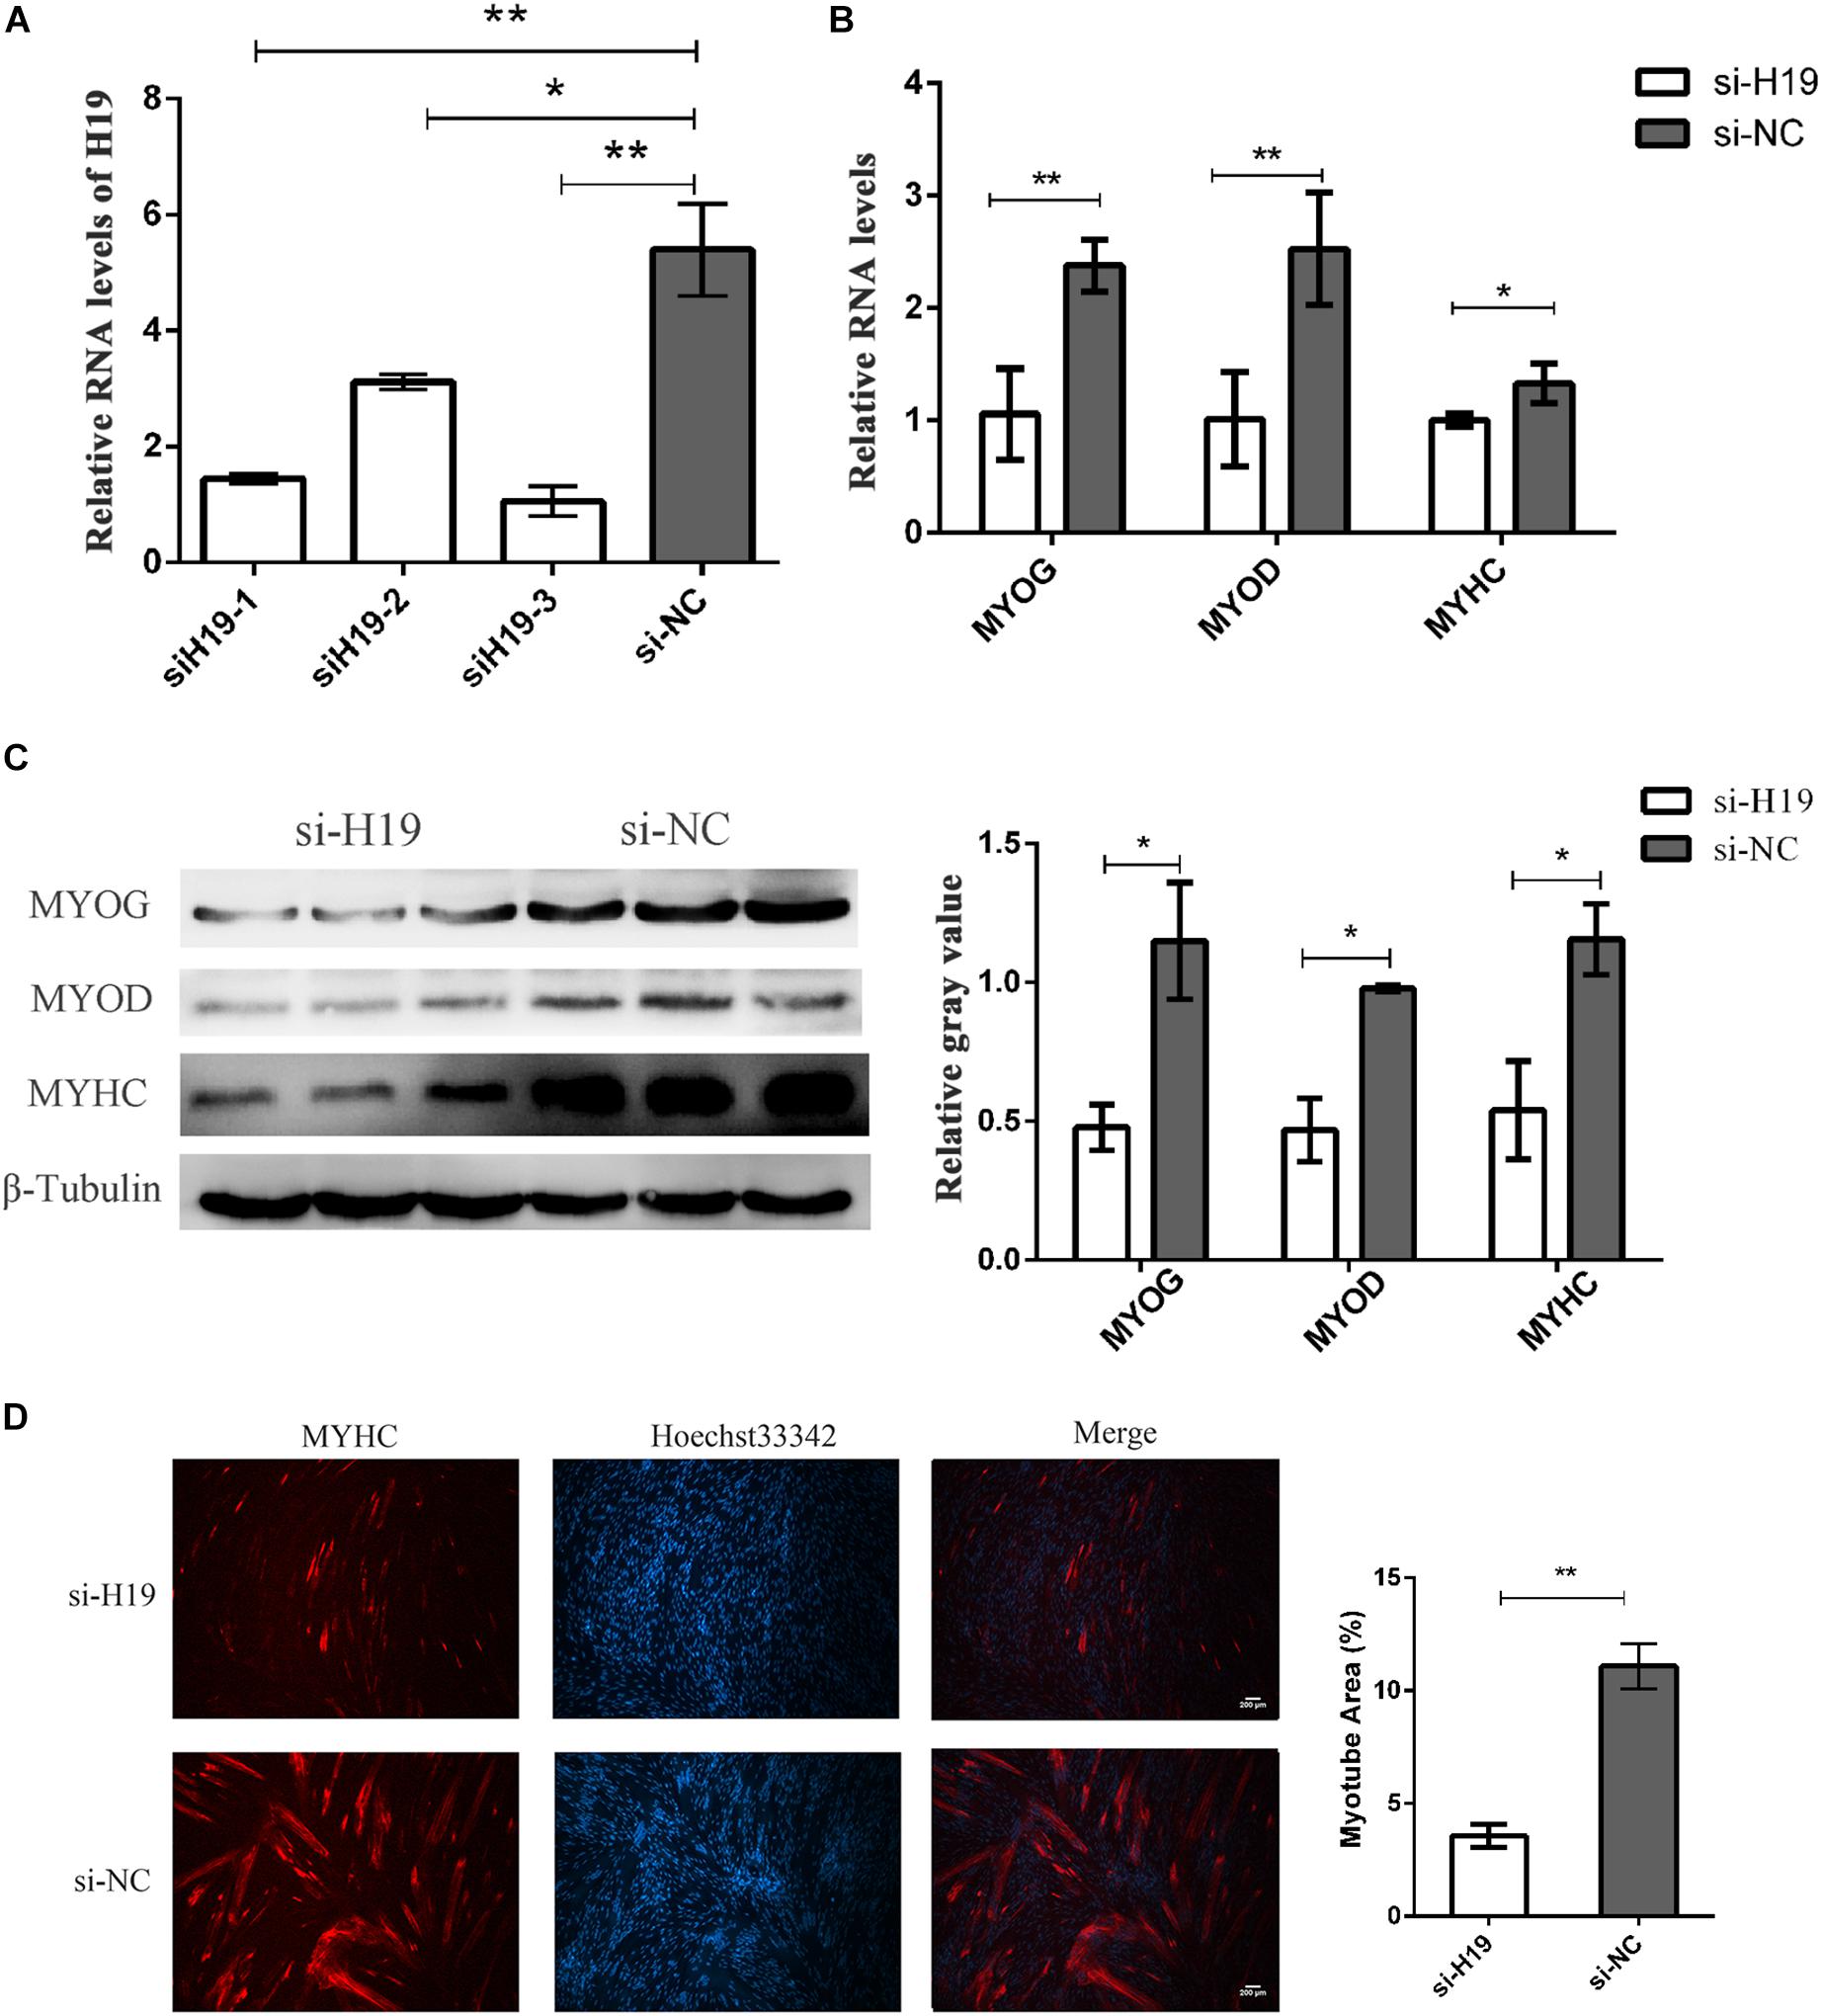
Figure 2. The knockdown of H19. (A) Screening assay of siRNA of H19 showed the third siRNA that have the highest interference efficiency. (B) Knockdown of H19 decreased the mRNA levels of MYOG, MYOD, and MYHC. (C) Knockdown of H19 decreased the levels of MYOG, MYOD, and MYHC protein. The gray level of WB was calculated by Image J software. Each experiment had three biological replicates. (D) Knockdown of H19 inhibited the differentiation of PSCs. PSCs transfected with either H19 siRNA or NC siRNAs were induced to differentiate. After differentiation for 24 h, cells were fixed and stained for MYHC, the marker of muscle differentiation. The fluorescence intensity and myotube area were calculated by Image J software. Each experiment had three biological replicates. Mean values ± SEM, n = 3. *p < 0.05, **p < 0.01.
Transcriptome Data Analysis After Knockdown of H19 in PSCs
We constructed 12 cDNA libraries (including si24h, NC24h, si36h, and NC36h groups; each group observation was repeated thrice) from two differentiation time points (24 and 36 h) after knockdown of H19 and sequenced them on an Illumina HiSeqTM platform to find the network pathways regulated by H19 and systematically identify transcriptome change after knockdown of H19. After sequencing, 11,419 DEGs were detected between different groups, including si24 versus NC24, si36 versus NC36, NC24 versus NC36, and si24 versus si36, which yielded 32, 2009, 6341, and 3037 differentially expressed mRNAs, respectively (Figure 3A). We performed hierarchical cluster analysis based on expression abundance to gain insights into the expression patterns of DEGs in the libraries. As shown in Figure 3B, si24-NC24 and si36-NC36 clustered into individual groups, in which the DEGs exhibited distinguishable expression patterns.
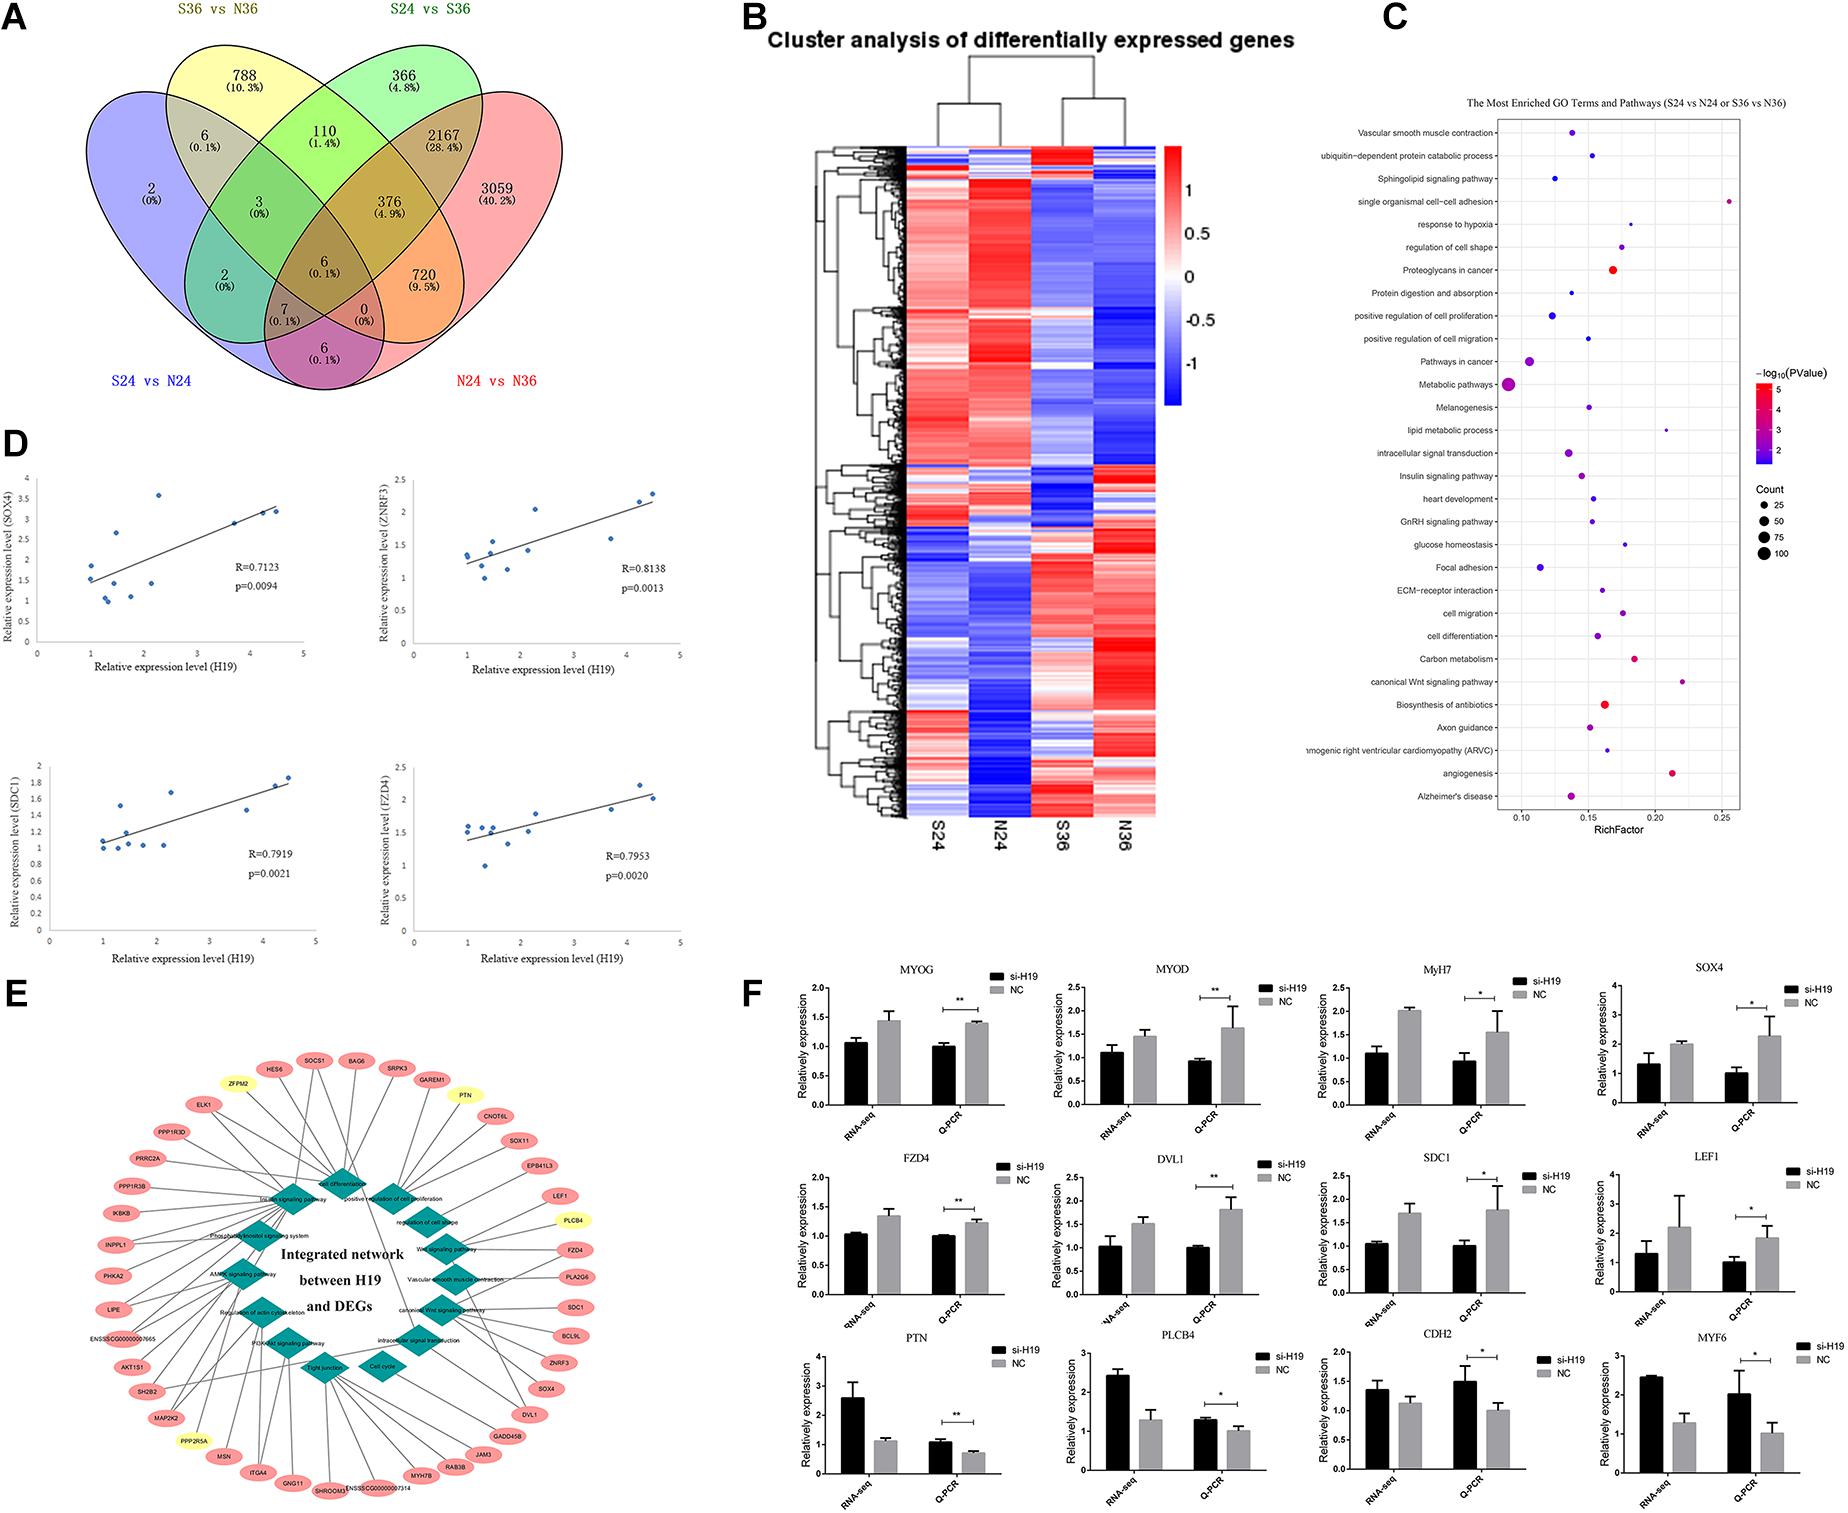
Figure 3. The analyses of DEGs. (A) Venn diagrams of the DEGs in different comparisons. (B) Hierarchical clustering dendrogram analyses were conducted with 7617 overlapped DEGs among four different comparative groups (S24 versus N24, S36 versus N36, N24 versus N36, S24 versus S36). Each column represents a sample, and each row represents a DEG. The colors correspond to a normalized expression value of each transcript (red: high relative expression; blue: low relative expression). (C) The most enriched top 30 GO terms and KEGG pathways. Columns from bottom to top represent P-values from small to large. (D) Linear regression of H19 and selected DEG expression. The R and P indicate the Pearson correlation coefficient and p value of each pair of H19 and DEGs in 12 samples (three for si24, three for NC24, three for si36, three for NC36). (E) Integrated network analysis of H19 and selected DEGs. Green rhombus represents different GO terms and pathways, similar processes are classified into one category, and 14 major categories exist. Pink and yellow ellipses represent positive and negative regulation between H19 and DEGs, respectively. (F) Verification of sequencing data by Q-PCR. Comparisons of relative expression levels for 12 DEGs. Comparisons of relative FPKM in the left; comparisons of relative expression levels in the right. Mean values ± SEM, n = 3. *p < 0.05, **p < 0.01.
We performed GO and KEGG pathway enrichment analyses and obtained 185 significantly enriched GO terms in the biological process and 140 KEGG pathways to elucidate further the functional roles of DEGs in skeletal muscle SC differentiation (Figure 3C and Supplementary Figure S4A). Among the GO terms and KEGG pathways, cell differentiation, positive regulation of cell proliferation, cell proliferation, insulin signaling pathway (Di Camillo et al., 2014), PI3K-Akt signaling pathway (Xiao et al., 2014; Yao et al., 2014; Li et al., 2018; Ueda-Wakagi et al., 2018), and Wnt signaling pathway (Otto et al., 2008; Rudnicki and Williams, 2015; Girardi and Le Grand, 2018) are related to skeletal muscle development, indicating that H19 may play a certain role in myogenesis.
The relationship between H19 and other DEGs was further investigated by analyzing the expression regulation of H19 on selected DEGs enriched in muscle-related pathways in four groups (si24 versus NC24, si36 versus NC36, NC24 versus NC36, si24 versus si36) according to the relative expression levels at p < 0.05 (Figure 3D and Supplementary Figure S4B). A total of 41 DEGs were selected, among which 37 exhibited a positive relationship with H19, and four presented negative relevance with H19. Among these 41 genes, the genes involved in the Wnt signaling pathway, such as Zinc and ring finger 3 (ZNRF3), SOX4, syndecan-1 (SDC1), and frizzled class receptor 4 (FZD4), exhibited a higher correlation coefficient with H19, thereby suggesting the possible interaction between H19 and Wnt signaling pathways. The integrated network is shown in Figure 3E. qRT-PCR was used to validate DEGs in si36 and NC36, and the qRT-PCR results were consistent with the sequencing data (Figure 3F). Therefore, Wnt signaling pathways were identified as the key factors responsible for the differentiation of PSCs.
SOX4 Is Required for PSC Differentiation
Among the genes in the Wnt signaling pathway, SOX4 has attracted our attention because of its involvement in cell fusion in C2C12 (Jang et al., 2013). In addition, the RNA and protein levels of SOX4 decreased with the knockdown of H19 (Figures 4A,B). This result is consistent with transcriptome sequencing results, indicating that SOX4 might be regulated by H19. Therefore, we chose SOX4 for further exploration. The expression pattern of SOX4 in PSCs showed that it was significantly upregulated during differentiation periods until differentiation for 24 h (Figure 4C), which also indicates that SOX4 might play a role in the differentiation of PSCs.
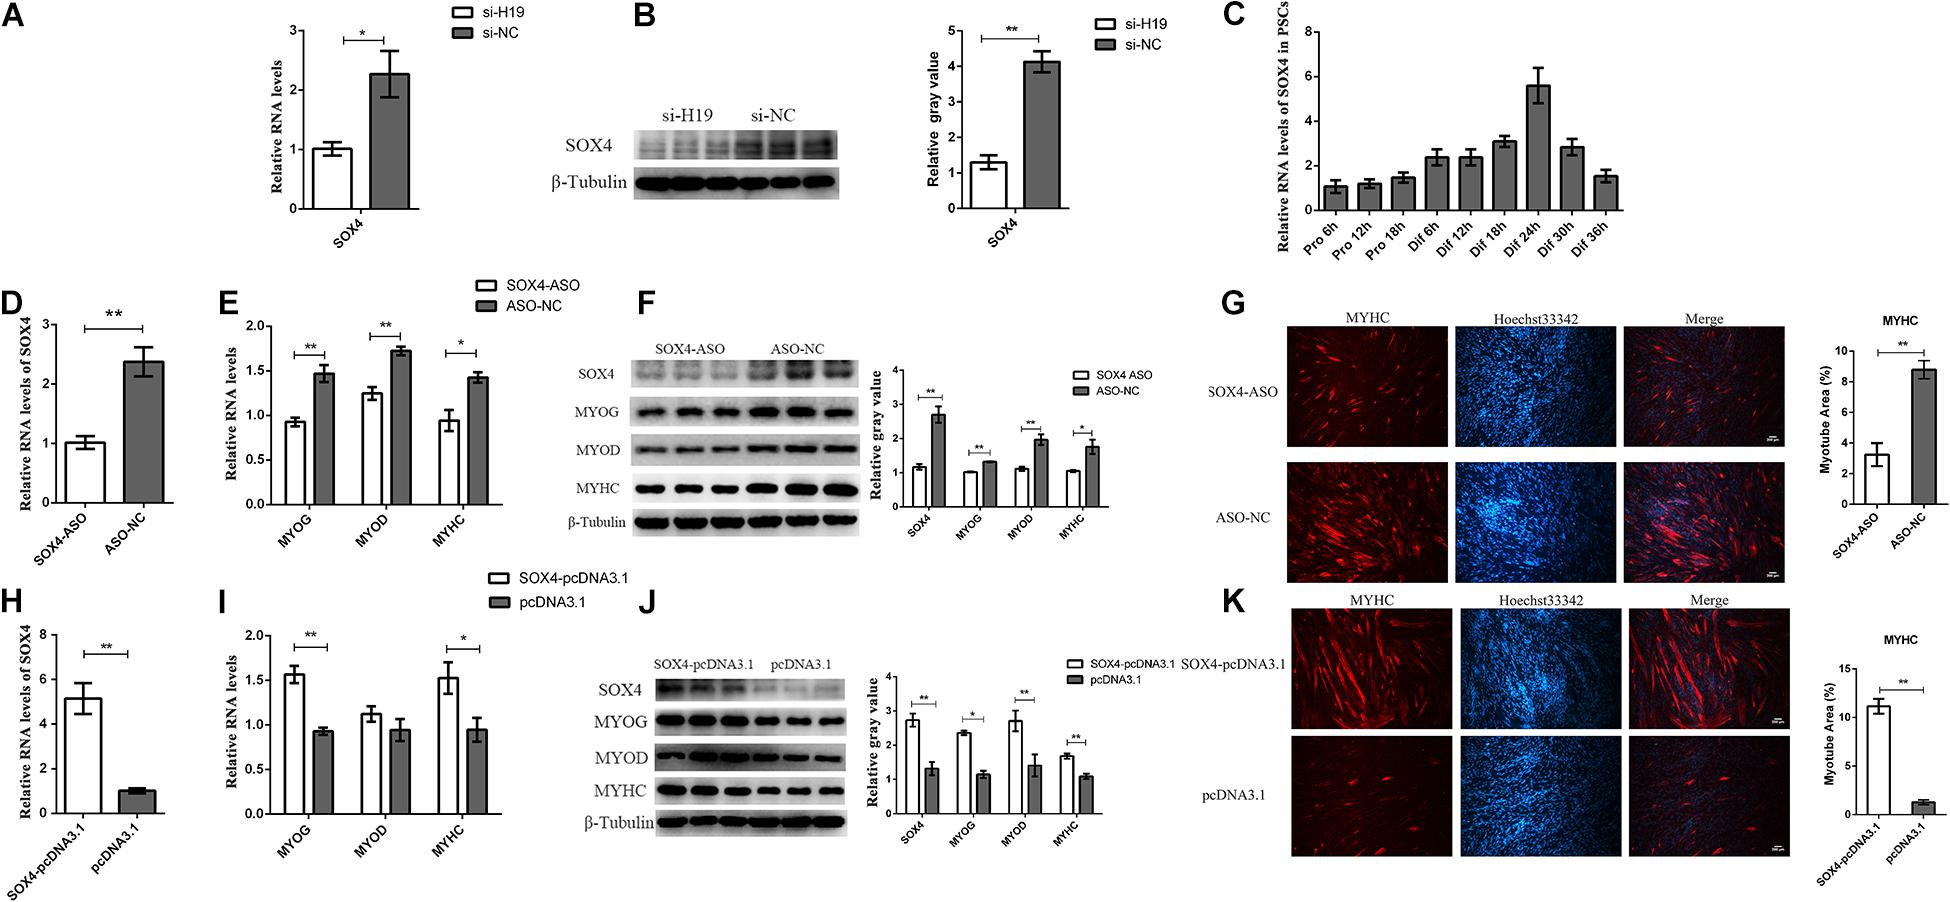
Figure 4. Functional research of the SOX4 gene. (A) Real-time PCR analysis of SOX4 after the knockdown of H19. (B) The protein level of SOX4 after the knockdown of H19. (C) Real-time PCR analysis of SOX4 expression in PSCs during the period of proliferation and differentiation. There is a 6-h interval between each period. (D) The efficiency of SOX4 ASO. (E) Interference of SOX4 decreased the mRNA levels of MYOG, MYOD, and MYHC. (F) Knockdown of SOX4 decreased the protein levels of MYOG, MYOD, and MYHC. The gray level of WB was calculated by Image J software. (G) Representative photographs of MYHC immunofluorescence staining in PSCs differentiated for 24 h showing that SOX4 knockdown significantly decreased the MYHC protein expression level. The myotube area was calculated by Image J software. Each experiment had three biological replicates. (H) Real-time PCR analysis of SOX4 expression in PSCs transfected with control vector or SOX4-pcDNA3.1 vector. (I) Overexpression of SOX4 increased the mRNA levels of MYOG and MYHC but did not affect MYOD expression. (J) Overexpression of SOX4 significantly promoted the protein levels of MYOG, MYOD, and MYHC. (K) Representative photographs of MYHC immunofluorescence staining in PSCs differentiated for 24 h showing that SOX4 overexpression significantly increased the MYHC protein expression level. (G) and (K) were two separate experiments, and the cell seeding densities were different. Mean values ± SEM, n = 3. *p < 0.05, **p < 0.01.
The role of SOX4 in cell differentiation was explored by designing and transfecting antisense oligonucleotides (ASO) into PSCs (Figure 4D). qPCR and Western blot results show that the expression levels of MYOG, MYOD, and MYHC genes decreased after SOX4 was transfected with ASO (Figures 4E–G). We overexpressed the SOX4 gene in PSCs and then induced their differentiation to confirm the knockdown results. As expected, SOX4 overexpression significantly increased the expression of MYOG and MYHC at the mRNA and protein levels, but MYOD had no significant changes in the mRNA level, only in the protein level (Figures 4H–K). Interestingly, H19 expression was not affected by SOX4, suggesting that SOX4 was regulated by H19 (Supplementary Figure S5A). Therefore, SOX4 is regulated by H19 and promotes the differentiation of PSCs.
H19 Regulated SOX4 as a Molecular Sponge of miR-140-5p
H19, which is widely distributed in the cytoplasm, affects the expression of SOX4. Therefore, we speculated that H19 might affect SOX4 as a molecular sponge. Bioinformatics analysis revealed that H19 had the putative recognition sequences for miR-140-5p, and SOX4 had the potential binding site with miR-140-5p in its 3′ untranslated region (UTR) (Figures 5A,B). miR-140-5p mimic and mutant miR-140-5p mimic were synthesized to validate whether H19 was indeed targeted by miR-140-5p. Luciferase reporters containing either a WT or mutant target site from H19 were also constructed. H19-PGL3/H19-mut-PGL3 vectors and miR-140-5p mimic/mutant were cotransfected into PSCs. The luciferase activity analysis revealed that miR-140-5p mimic effectively inhibited the H19-PGL3 vectors’ luciferase activity, but the inhibition disappeared when the binding site or the miR-140-5p mimic was mutated (Figure 5C). These results strongly point to the mechanism that H19 acts as a molecular decoy to abolish miR-140-5p repressing activity on its targets. In the following experiment, the WT SOX4 3′ and the mutant SOX4 3′ UTR binding sites were inserted into their respective luciferase reporter gene. Luciferase reporter assay revealed that miR-140-5p mimic, not mutant miR-140-5p mimic, could reduce the luciferase activity of SOX4 3′ UTR. However, the luciferase activity of the mutant SOX4 3′ UTR was not repressed by the miR-140-5p mimic (Figure 5D).
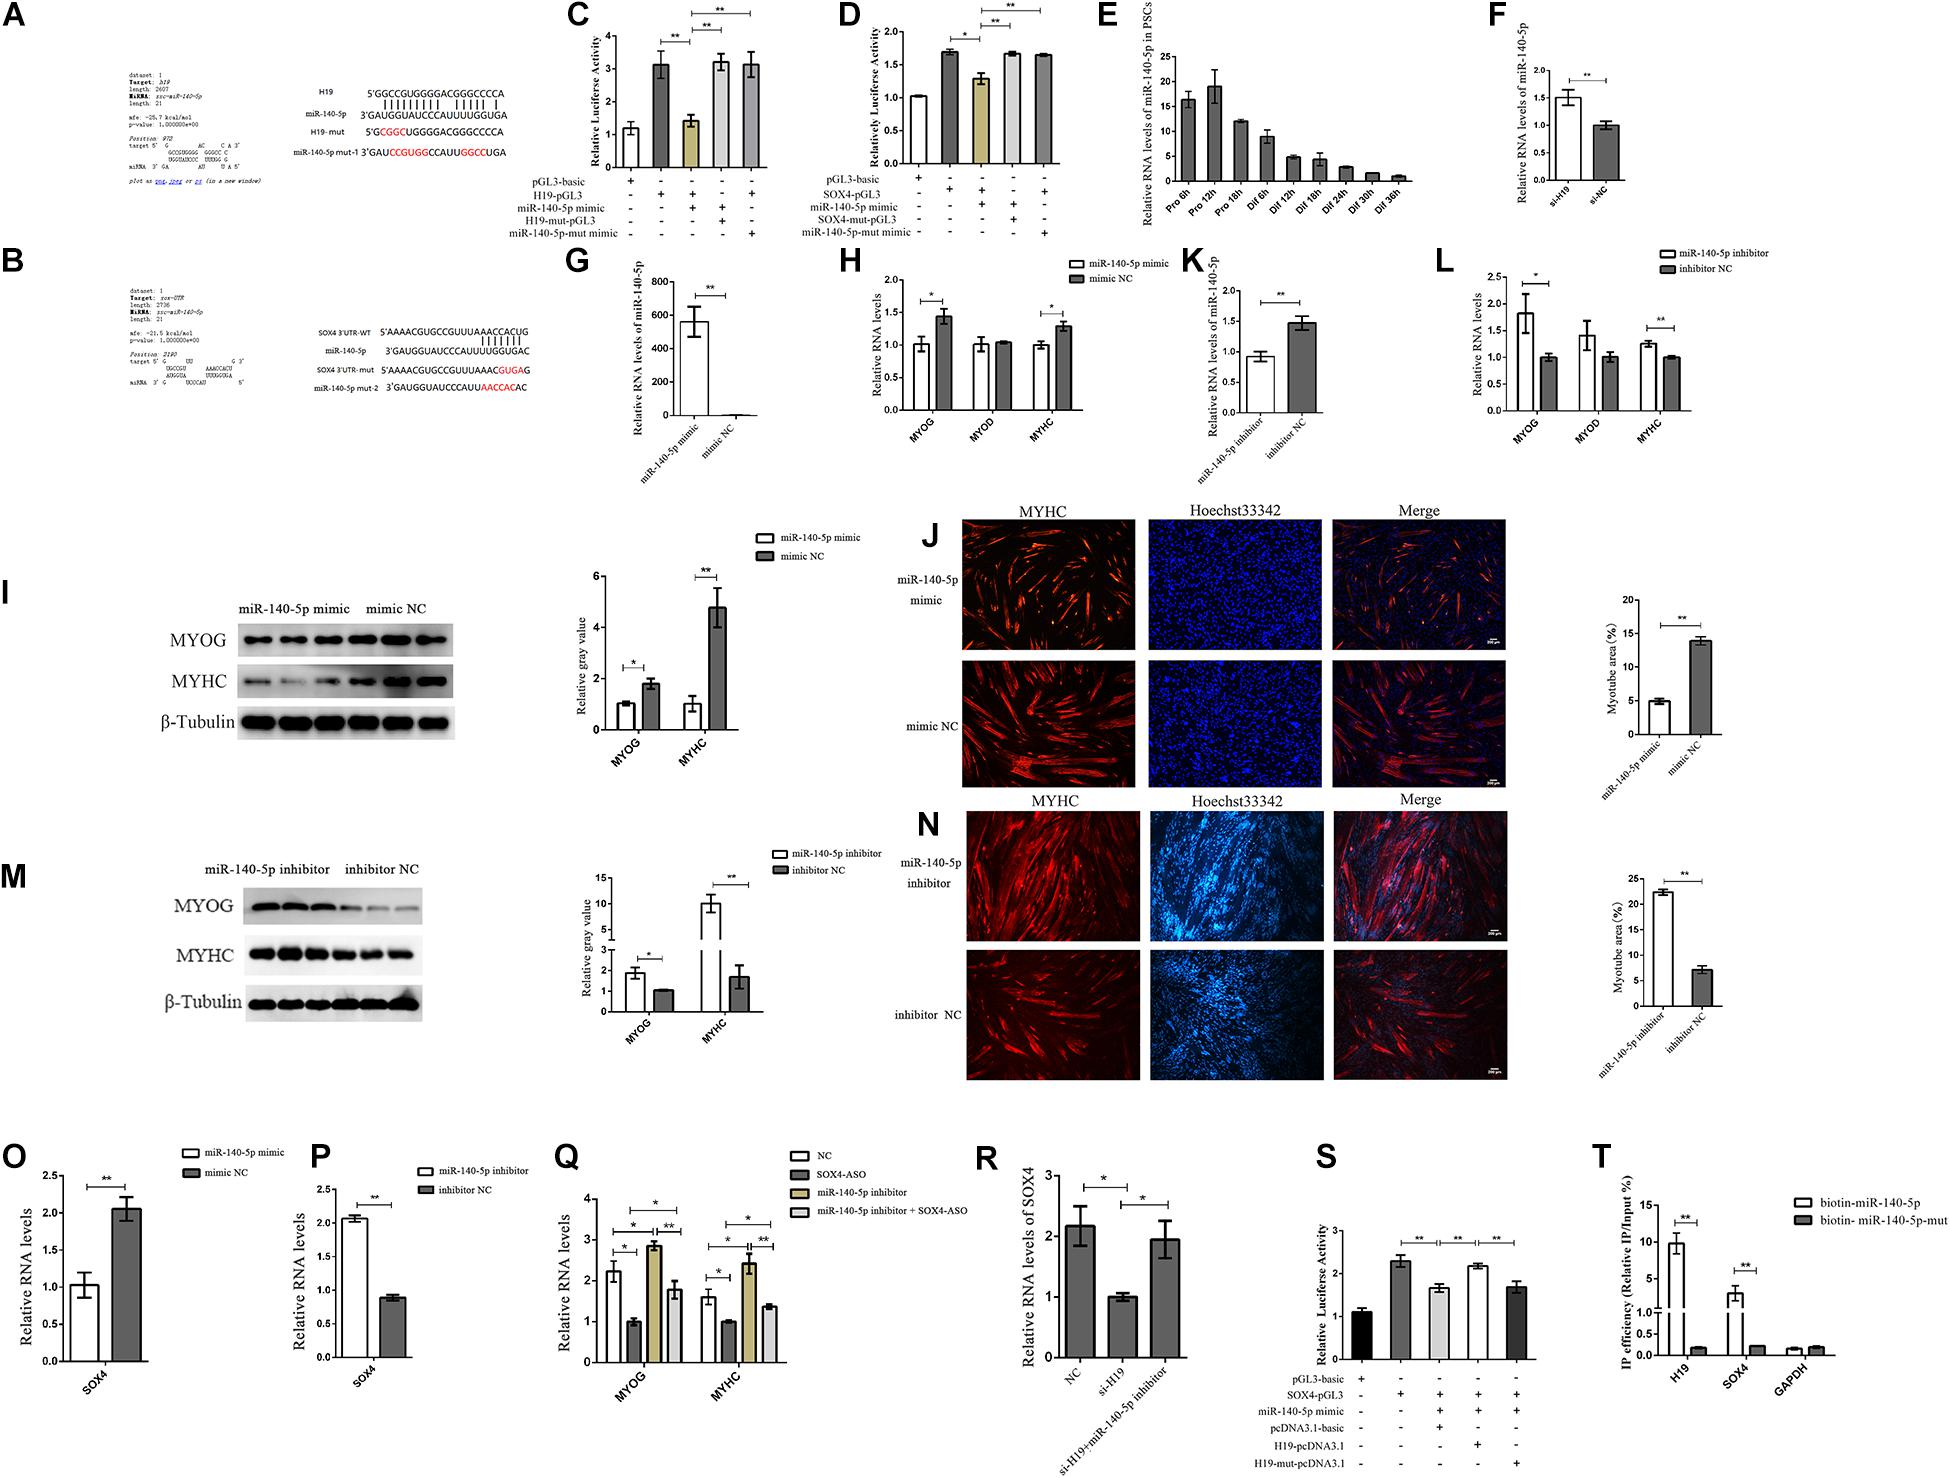
Figure 5. H19 regulated SOX4 as a molecular sponge of miR-140-5p. (A) Bioinformatics prediction of miR-140-5p as a target miRNA of H19 by RNAhybrid. (B) Bioinformatics predicted a miR-140-5p binding site in SOX4. (C) Luciferase reporter assay of H19-pGL3 and H19-mut-pGL3 in PSCs transfected with either miR-140-5p mimic or miR-140-5p-mut mimic. (D) Luciferase reporter assay of SOX4-pGL3 and SOX4-mut-pGL3 in PSCs transfected with either miR-140-5p mimic or miR-140-5p-mut mimic. (E) Real-time PCR analysis of miR-140-5p expression in PSCs during the period of proliferation and differentiation. There is a 6-h interval between each period. Mean values ± SEM, n = 3. (F) Real-time PCR analysis of miR-140-5p expression in PSCs transfected with H19 siRNA or negative control. (G–I) Overexpression of miR-140-5p inhibited the expression of MYOG and MYHC. (J) Representative photographs of MYHC immunofluorescence staining in PSCs differentiated for 24 h showing that miR-140-5p overexpression significantly decreased the MYHC expression level. (K–M) miR-140-5p inhibitor increased MYOG and MYHC level. (N) Representative photographs of MYHC immunofluorescence staining in PSCs differentiated for 24 h showing that miR-140-5p inhibitor significantly increased the MYHC expression level. (O) miR-140-5p overexpression decreased expression of the SOX4. (P) miR-140-5p inhibitor increased expression of the SOX4. (Q) Real-time PCR analysis of expression of MYOG and MYHC in PSCs after transfection with SOX4 ASO, miR-140-5p inhibitor, and a combination of the two. (R) Real-time PCR analysis of expression of SOX4 in PSCs after transfection with H19 siRNA or with H19 siRNA and miR-140-5p inhibitor. (S) Luciferase reporter assay of SOX4-pGL3 in PK cells transfected with miR-140-5p mimic, H19-pcDNA3.1, or H19-mut-pcDNA3.1. (T) Bintin-miR-140-5p pull-down was performed for PSCs transfected with biotin-miR-140-5p or mutated biotin-miR-140-5p, followed by real-time PCR to detect H19, SOX4 mRNA, and Gapdh mRNA levels. Mean values ± SEM, n = 3. The values are shown as means ± SD of three independent experiments.*P < 0.05. **P < 0.01.
Next, we explored the function of miR-140-5p. miR-140-5p was significantly downregulated during differentiation periods as shown by its expression pattern in PSCs (Figure 5E). We detected the expression level of miR-140-5p after the knockdown of H19 to understand the functional role of H19 in miR-140-5p regulation. H19 knockdown significantly upregulated the expression of miR-140-5p, but H19 was not regulated by miR-140-5p (Figure 5F and Supplementary Figure S5B). In addition, the miR-140-5p mimic and inhibitor were transfected into PSCs to explore the function of miR-140-5p. The miR-140-5p mimic significantly decreased the expressions of MYOG and MYHC at the mRNA and protein levels and decreased the number of positive myotube formation (Figures 5G–J). An opposite result was identified in PSCs containing miR-140-5p inhibitor (Figures 5K–N). However, no significant difference was observed due to the low expression of MYOD after PSC differentiation. In addition, the miR-140-5p mimic reduced the expression level of SOX4 (Figure 5O). Conversely, the miR-140-5p inhibitor increased SOX4 expression (Figure 5P). These results imply that miR-140-5p inhibits the differentiation of PSCs by regulating SOX4.
Further confirmations were conducted to better explore the relationship between the three genes. As shown in Figure 5Q, the increased expressions of MYOG and MYHC induced by the miR-140-5p inhibitor were abolished by SOX4 ASO. Simultaneously, the decreased SOX4 expression induced by H19 siRNA was rescued by miR-140-5p inhibitor (Figure 5R). Furthermore, the luciferase reporter assay shows that the luciferase activity of SOX4-pGL3 was increased upon the WT H19-pcDNA3.1 overexpression vector but not upon the miR-140-5p binding site mutated H19-mut-pcDNA3.1 vector (Figure 5S). The biotin-miR-140-5p pull-down assay also confirmed the interaction between miR-140-5p with H19 and SOX4 (Figure 5T). We concluded that H19 might inhibit PSC differentiation by competitively binding miR-140-5p with SOX4.
H19 Directly Interacts With DBN1
We performed an RNA pull-down assay with biotinylated H19 to identify the H19 interacting proteins, followed by MS. The MS result is shown in Supplementary Table S4. The proteins that specifically bind to H19 (including DBN1) are identified (Figure 6A). DBN1 expression is induced during differentiation of primary and C2C12 myoblasts in a p38 MAPK-dependent manner (Mancini et al., 2011). Therefore, we selected DBN1 as the target protein. In the following experiments, the association of H19 with DBN1 was validated by Western blot, and the results show that the target protein DBN1 is clearly detected in H19 pull-down protein samples but not in the samples associated with antisense H19 (Figure 6B). We performed RIP of DBN1 to validate this interaction between H19 and DBN1. PCR results revealed that DBN1 pulled down more H19 transcripts than IgG control in PSC cell lysates (Figure 6C). The results of H19 RNA FISH and DBN1 immunofluorescence staining also show that the spatial localization of H19 and DBN1 in PSCs is close (Figure 6D).
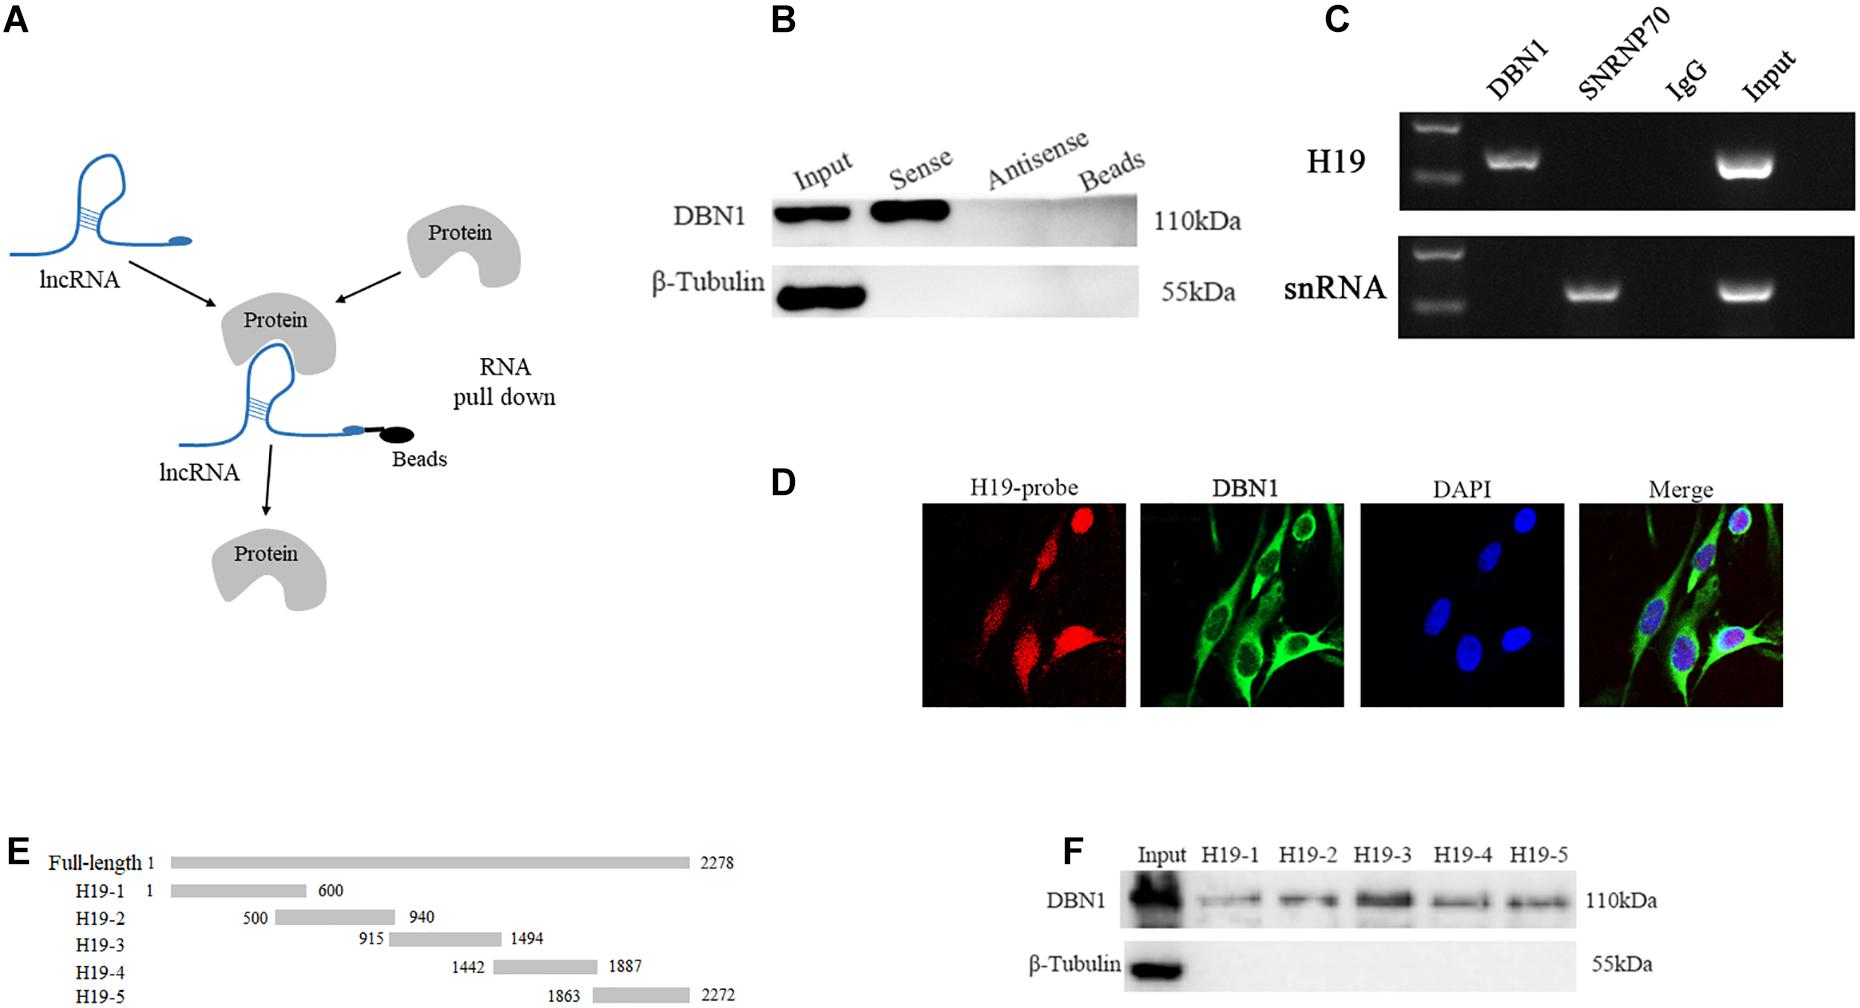
Figure 6. H19 interacts directly with DBN1. (A) A schematic representation of RNA pull-down assay. (B,C) Interaction between H19 and DBN1 as determined by RNA pull-down and RIP. (D) RNA FISH and immunofluorescence staining showed that H19 colocalized with DBN1 in PSCs cytoplasm. (E,F) The interaction of truncated H19 with DBN1 was determined by RNA pull-down.
A series of truncated mutants of H19 were generated, and their binding capacity with DBN1 was tested to further map the binding domain (Figure 6E). Interestingly, all of the truncated mutants were capable of pulling down DBN1, but the RNA probes containing 915–1494 nts of the H19 gene pulled down more DBN1 protein (Figure 6F). These findings show that H19 directly interacts with DBN1.
DBN1 Affects PSC Differentiation
The expression of DBN1 in PSCs was detected to examine the role of DBN1 in PSC differentiation. DBN1 possessed a higher expression level in the differentiation period than in the proliferation period (Figure 7A). Then, DBN1 was knocked down in PSCs by using siRNAs targeting DBN1, followed by induction of differentiation. qPCR and Western blot analyses revealed that DBN1 knockdown significantly reduced the expressions of MYOG, MYOD, and MYHC (Figures 7B–E), whereas the overexpression of DBN1 obtained the opposite results (Figures 7F–I), thereby indicating that DBN1 is also necessary for PSC differentiation. Simultaneously, the downregulated expression of H19 also decreased the expression of DBN1, but the expression of H19 was not changed when DBN1 was downregulated or upregulated (Figure 7J and Supplementary Figure S5C). MYOD is a transcription factor of H19 and can affect the expression of H19 (Borensztein et al., 2013), and DBN1 is a target gene of MYOD (de la Serna et al., 2005; Forcales et al., 2012); therefore, we speculated whether MYOD also affects the expression of DBN1 by performing ChIP-qPCR assays. The results show that MYOD could bind to the promoter of DBN1 and H19 (Figure 7K). Simultaneously, knocking down MYOD decreased the expression of DBN1 and H19 (Figures 7L–N). In summary, the knockdown of MYOD inhibited the expression of H19 and DBN1, whereas the knockdown of DBN1 or H19 might also inhibit the expression of MYOD. We speculate that a feedback loop among the three genes might affect the differentiation of PSCs.
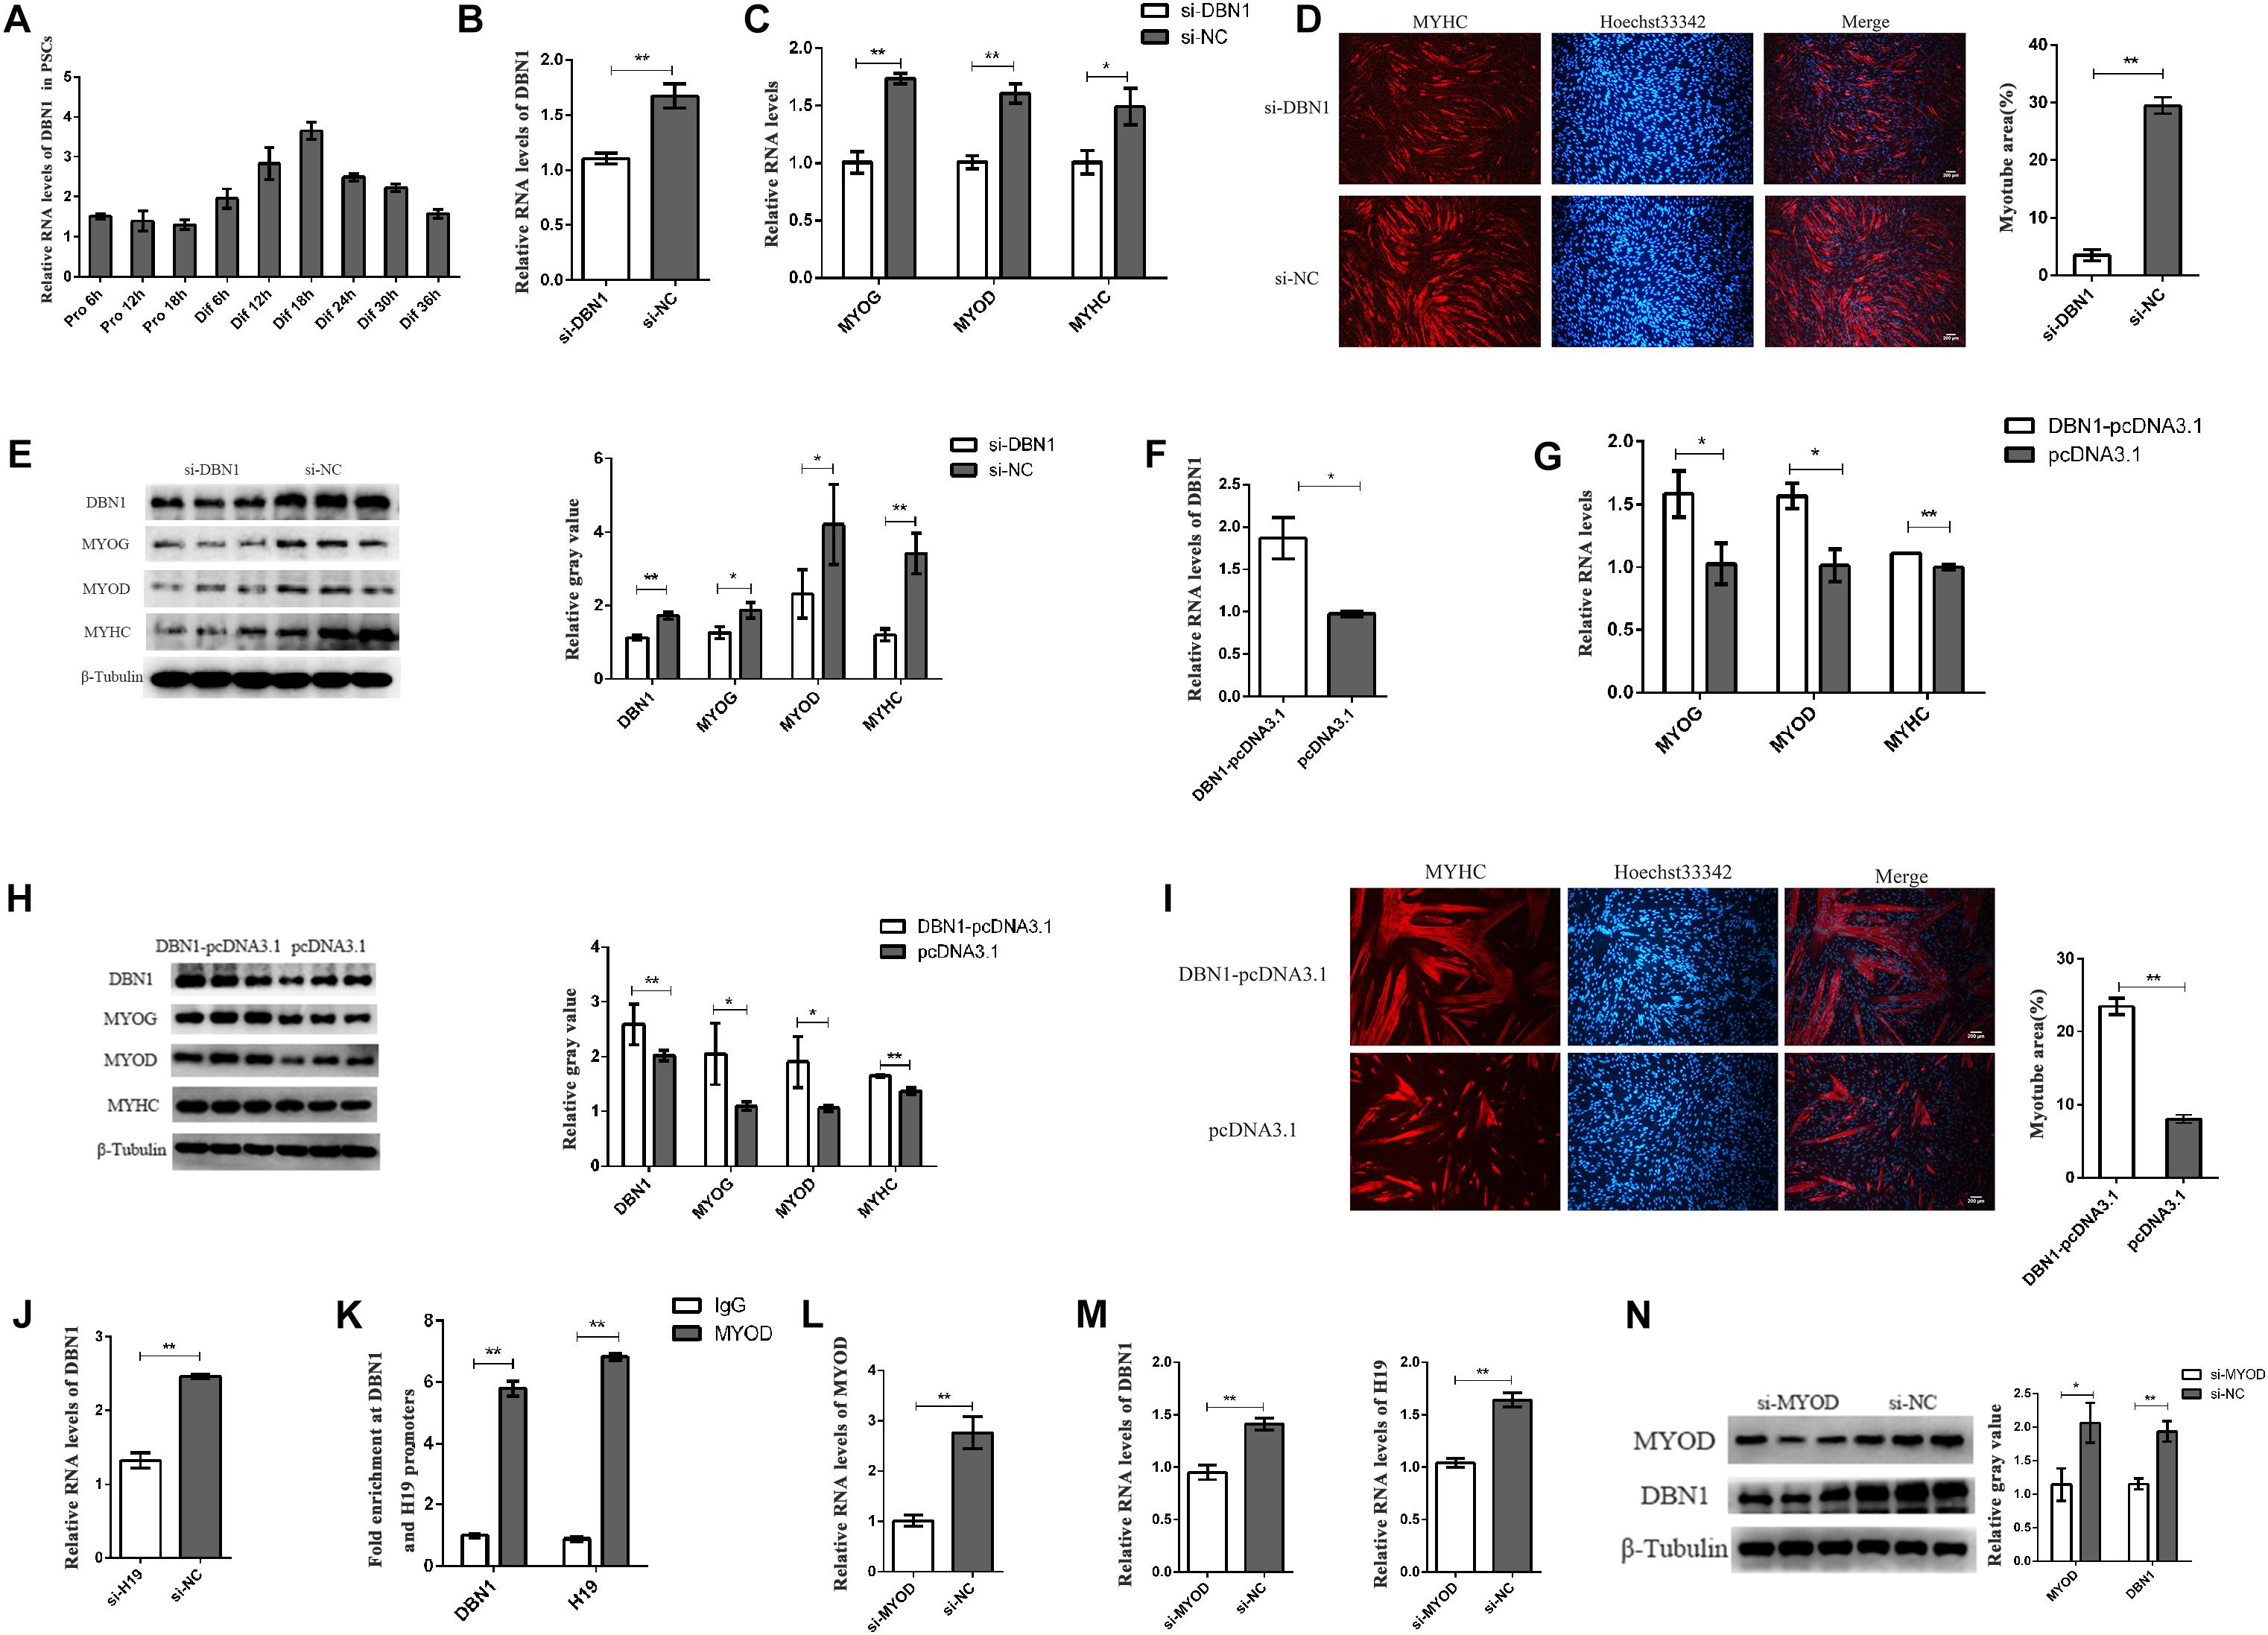
Figure 7. DBN1 affects the PSC differentiation. (A) Real-time PCR analysis of DBN1 expression in PSCs during the period of proliferation and differentiation. There is a 6-h interval between each period. SNRNP70 was used as positive control in RIP. Mean values ± SEM, n = 3. The values are shown as means ± SD of three independent experiments. (B–E) Knockdown of DBN1 inhibited the expression of MYOG, MYOD, and MYHC. (F–I) Overexpression of DBN1 promoted the expression of MYOG, MYOD, and MYHC. (J) Real-time PCR analysis of expression of DBN1 in PSCs after transfection with H19 siRNA. (K) ChIP-qPCR results revealed the enrichments of MYOD at the H19 and DBN1 promoters. (L,M) Knockdown of MYOD inhibited the expression of DBN1 and H19. (N) Knockdown of MYOD inhibited the protein level of DBN1. Mean values ± SEM, n = 3. The values are shown as means ± SD of three independent experiments. *P < 0.05, **P < 0.01.
Discussion
H19 is one of the best-known imprinted genes discovered from several genetic screens in the liver, myoblasts, and embryonic stem cells (Pachnis et al., 1984; Poirier et al., 1991). Few articles discuss H19 and muscle development, and most of these articles focus on mice and bovines. For example, H19 performs a critical trans-regulatory function in skeletal muscle differentiation and regeneration by encoded microRNAs in mice (Dey et al., 2014). Xu et al. (2017) also demonstrate that H19 can promote the differentiation of bovine skeletal muscle SCs by suppressing Sirt1/FoxO1. However, limited research has been conducted on PSC differentiation in pigs.
Myogenesis in pigs is a complex process that includes SC proliferation, differentiation, fusion, and specific muscle formation (He et al., 2017). This process requires precise regulation of genes with H19 being one of the most important associated genes (Qin et al., 2017). We explored the function of H19 in PSC differentiation by detecting first the expression pattern of H19 in different tissues and different differentiation time points of PSCs. Then, we collected H19 knockdown cells at various differentiation time points and determined the function of H19 in regulating the differentiation of PSCs by high-throughput RNA-seq technology. H19 knockdown suppressed the differentiation of PSCs in skeletal muscle development by suppressing three myogenic markers in RNA and protein levels.
In this study, a number of protein-coding genes were differentially expressed in PSCs at different time points of differentiation, especially in si36 versus NC36 and NC24 versus NC36. The identified DEGs are associated with normal physiological cell processes, such as metabolic pathways, endocytosis, and translation as well as muscle development pathways, including cell differentiation, positive regulation of cell proliferation, and Wnt signaling pathway. Many DEGs, such as MSTN, TMEM8C, MYF6, and SOX4, reportedly regulate myogenesis and were enriched in important pathways (Abmayr and Pavlath, 2012; Jang et al., 2013; Li et al., 2014; Retamales et al., 2015; Zhang et al., 2015; Millay et al., 2016). We also found that FOXO1 was a DEG after H19 knockdown. This indicates that H19 might have a similar regulatory mechanism in pig and cattle, which deserves further investigation.
In recent years, many researchers have described lncRNAs containing miRNA binding sites that function as molecular sponges of miRNA, thereby modulating the derepression of miRNA targets and imposing an additional level of post-transcriptional regulation (Ebert and Sharp, 2010; Karreth and Pandolfi, 2013; Su et al., 2016). Among the abovementioned myogenesis-related genes, SOX4 affects PSC differentiation and has a potential binding site for miR-140-5p, thus attracting our attention. miR-140-5p bound to the SOX4 3′-UTR region and affected its expression. We believed that miR-140-5p binding to SOX4 3′-UTR with incomplete complementarity inhibited protein synthesis but not mRNA degradation. The effect of miR-140-5p on SOX4 mRNA level might be an indirect effect due to the influence of miR-140-5p on the differentiation process. miR-140-5p binds to SOX4 3′-UTR and inhibits the translation of SOX4, thereby inhibiting its protein expression. The effects of miR-140-5p on SOX4 mRNA and protein levels might be realized through different mechanisms. miR-140-5p also has a potential binding site for H19 as observed in bioinformatics analyses. Subsequent experimental results also show that H19 acted mechanistically as a ceRNA to downregulate miR-140-5p and thereby upregulate the expression level of SOX4. Overexpression of miR-140-5p inhibits the differentiation of PSCs, whereas inhibition of miR-140-5p promotes the differentiation of PSCs. We conducted rescue experiments to verify the interaction of the three genes. The results of all these studies are consistent with our hypotheses that H19 promotes the differentiation of PSCs by taking up miR-140-5p from SOX4. This is the first study to reveal miR-140-5p’s role in myogenesis.
Many lncRNAs perform their functions through their interaction with proteins (Huarte et al., 2010). For instance, lncRNA lrm regulates the expression of myogenic genes by directly binding to MEF2D, which, in turn, promotes the assembly of MyoD/MEF2D on the regulatory elements of target genes (Sui et al., 2019). In addition, EPIC1 RNA promotes cell-cycle progression by interacting with MYC and enhancing its binding to target genes (Wang et al., 2018). Here, we focused our attention on DBN1 because of its ability to promote myoblast differentiation (Mancini et al., 2011). We found by pull-down and RIP experiments that H19 directly binds with DBN1 and promotes PSC differentiation synergistically. Moreover, all of the truncated mutants were capable of pulling down DBN1, but the RNA probes containing 915–1494 nts of H19 gene pulled down more DBN1 protein, thereby suggesting that H19 may be wrapped around the DBN1. MYOD is the main regulator during muscle differentiation (Endo, 2015; Zhang et al., 2018). DBN1 as a target gene of MYOD like H19 is also regulated by MYOD and further regulates the expression of MYOD (de la Serna et al., 2005; Borensztein et al., 2013), which further indicates the importance of DBN1 in PSC differentiation. Considering the important roles of H19 and DBN1, future efforts will be devoted to the detailed analysis of other diverse functional mechanisms through which H19 and DBN1 regulate PSC differentiation.
In reviewing the results of this study, some potential limitations should be considered. First, we only explored the function of H19 from the aspect of knocking down H19. We have constructed an H19 overexpression vector (H19-pcDNA3.1). However, due to the high expression of H19 (much higher than MYOG, MYOD, and MYHC) in PSCs, H19-pcDNA3.1 could not increase the expression of H19, and PSC differentiation-related experiments were not conducted. We transfected the H19 overexpression vector into PK15 cell lines and found that the overexpression effect was significant, thereby proving that the vector was successfully constructed (Supplementary Figure S5D). Hence, H19 overexpression-related analysis experiments of luciferase activity were supplemented in PK15 cell lines. Second, our study revealed two cell differentiation pathways regulated by H19: one is to function as molecular sponges to inhibit miR-140-5p’s function and the other is to perform its function through their interaction with DBN1 proteins. However, the mechanisms of H19 binding with DBN1 to regulate PSC differentiation have not been thoroughly studied. All these limitations deserve further investigation in the future.
We present a molecular model to elucidate H19’s role in regulating PSC differentiation through two different pathways (Figure 8). This study is the first to identify and report H19-knockdown-mediated DEGs in porcine myogenesis and the first to uncover the mechanisms of H19 in PSC differentiation that may provide some molecular basis for porcine myogenesis.
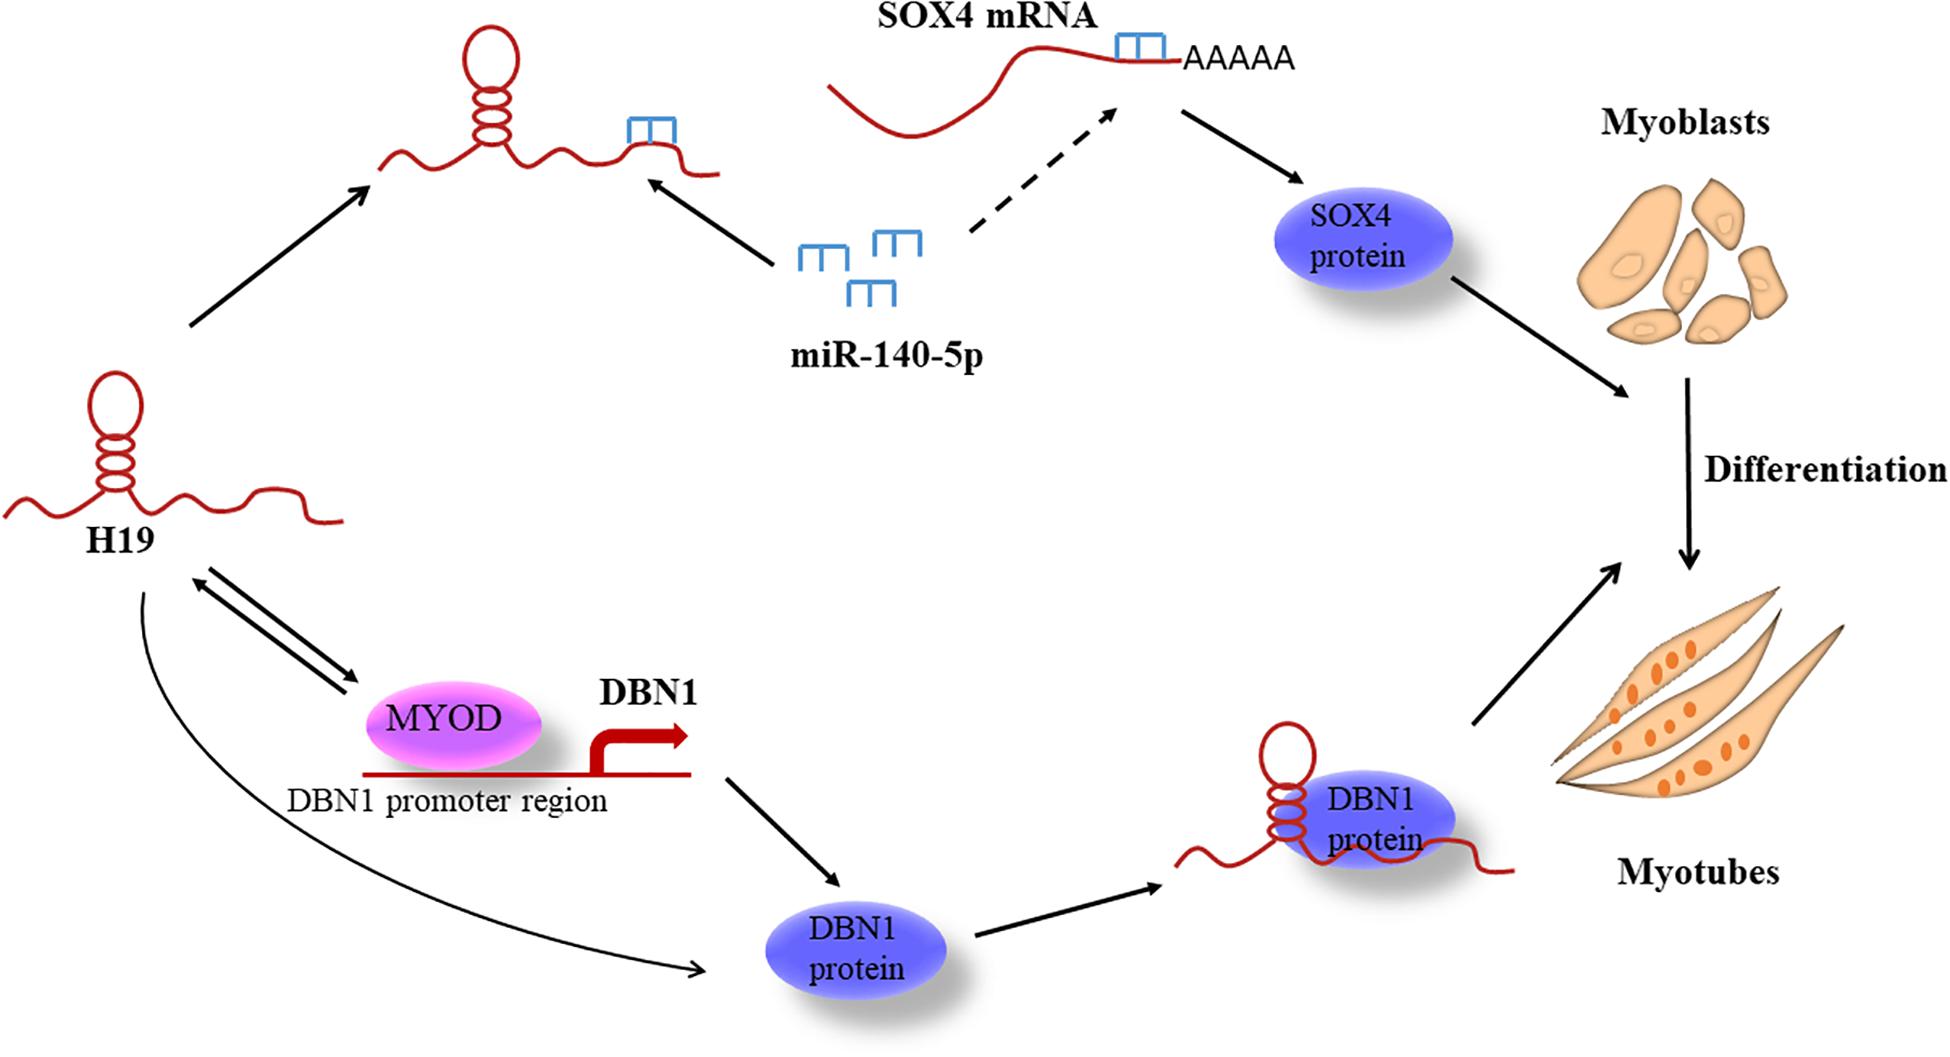
Figure 8. Model for H19-regulating PSC differentiation.
Data Availability Statement
The RNA-seq was submitted to GEO. The accession number is GSE141648.
Ethics Statement
All experimental protocols were approved by the Ethics Committee of Huazhong Agricultural University, Wuhan City, Hubei Province, China.
Author Contributions
CL conceived and designed the experiments and explained the data. JL, TS, GS, and WL analyzed the main content of the data with the help of CL, CF, and CZ. JL and TS performed the experiment with the help of LC and GS. JL wrote the manuscript with the help of CL. All authors contributed to the article and approved the submitted version.
Funding
This work was supported by the National Natural Science Foundation of China (NSFC, 31872322), the Fundamental Research Funds for the Central Universities (2662017PY030), National high technology research and development plan (863, 2011AA100302), National Natural Science Foundation of China (NSFC, 31601859), and China Postdoctoral Science Foundation Funded Project (2016M592344).
Conflict of Interest
The authors declare that the research was conducted in the absence of any commercial or financial relationships that could be construed as a potential conflict of interest.
Supplementary Material
The Supplementary Material for this article can be found online at: https://www.frontiersin.org/articles/10.3389/fcell.2020.518724/full#supplementary-material
References
Abmayr, S. M., and Pavlath, G. K. (2012). Myoblast fusion: lessons from flies and mice. Development 139, 641–656. doi: 10.1242/dev.068353
Anders, S., Pyl, P. T., and Huber, W. (2015). HTSeq–a Python framework to work with high-throughput sequencing data. Bioinformatics 31, 166–169. doi: 10.1093/bioinformatics/btu638
Borensztein, M., Monnier, P., Court, F., Louault, Y., Ripoche, M. A., Tiret, L., et al. (2013). Myod and H19-Igf2 locus interactions are required for diaphragm formation in the mouse. Development 140, 1231–1239. doi: 10.1242/dev.084665
de la Serna, I. L., Ohkawa, Y., Berkes, C. A., Bergstrom, D. A., Dacwag, C. S., Tapscott, S. J., et al. (2005). MyoD targets chromatin remodeling complexes to the myogenin locus prior to forming a stable DNA-bound complex. Mol. Cell. Biol. 25, 3997–4009. doi: 10.1128/MCB.25.10.3997-4009.2005
Dey, B. K., Pfeifer, K., and Dutta, A. (2014). The H19 long noncoding RNA gives rise to microRNAs miR-675-3p and miR-675-5p to promote skeletal muscle differentiation and regeneration. Genes Dev. 28, 491–501. doi: 10.1101/gad.234419.113
Di Camillo, B., Eduati, F., Nair, S. K., Avogaro, A., and Toffolo, G. M. (2014). Leucine modulates dynamic phosphorylation events in insulin signaling pathway and enhances insulin-dependent glycogen synthesis in human skeletal muscle cells. BMC Cell Biol. 15:9. doi: 10.1186/1471-2121-15-9
Ding, S., Wang, F., Liu, Y., Li, S., Zhou, G., and Hu, P. (2017). Characterization and isolation of highly purified porcine satellite cells. Cell Death Discov. 3:17003. doi: 10.1038/cddiscovery.2017.3
Ebert, M. S., and Sharp, P. A. (2010). Emerging roles for natural microRNA sponges. Curr. Biol. 20, R858–R861. doi: 10.1016/j.cub.2010.08.052
Endo, T. (2015). Molecular mechanisms of skeletal muscle development, regeneration, and osteogenic conversion. Bone 80, 2–13. doi: 10.1016/j.bone.2015.02.028
Forcales, S. V., Albini, S., Giordani, L., Malecova, B., Cignolo, L., Chernov, A., et al. (2012). Signal-dependent incorporation of MyoD-BAF60c into Brg1-based SWI/SNF chromatin-remodelling complex. EMBO J. 31, 301–316. doi: 10.1038/emboj.2011.391
Giovarelli, M., Bucci, G., Ramos, A., Bordo, D., Wilusz, C. J., Chen, C. Y., et al. (2014). H19 long noncoding RNA controls the mRNA decay promoting function of KSRP. Proc. Natl. Acad. Sci. U.S.A. 111, E5023–E5028. doi: 10.1073/pnas.1415098111
Girardi, F., and Le Grand, F. (2018). Wnt signaling in skeletal muscle development and regeneration. Prog. Mol. Biol. Transl. Sci. 153, 157–179. doi: 10.1016/bs.pmbts.2017.11.026
He, J., Wang, F., Zhang, P., Li, W., Wang, J., Li, J., et al. (2017). miR-491 inhibits skeletal muscle differentiation through targeting myomaker. Arch. Biochem. Biophys. 62, 30–38. doi: 10.1016/j.abb.2017.05.020
Huarte, M., Guttman, M., Feldser, D., Garber, M., Koziol, M. J., Kenzelmann-Broz, D., et al. (2010). A large intergenic noncoding RNA induced by p53 mediates global gene repression in the p53 response. Cell 142, 409–419. doi: 10.1016/j.cell.2010.06.040
Jang, S. M., Kim, J. W., Kim, D., Kim, C. H., An, J. H., Choi, K. H., et al. (2013). Sox4-mediated caldesmon expression facilitates differentiation of skeletal myoblasts. J. Cell Sci. 126, 5178–5188. doi: 10.1242/jcs.131581
Jin, J. J., Lv, W., Xia, P., Xu, Z. Y., Zheng, A. D., Wang, X. J., et al. (2018). Long noncoding RNA SYISL regulates myogenesis by interacting with polycomb repressive complex 2. Proc. Natl. Acad. Sci. U.S.A. 115, E9802–E9811. doi: 10.1073/pnas.1801471115
Karreth, F. A., and Pandolfi, P. P. (2013). ceRNA cross-talk in cancer: when ce-bling rivalries go awry. Cancer Discov. 3, 1113–1121. doi: 10.1158/2159-8290.CD-13-0202
Li, H., Zhu, C., Tao, Z., Xu, W., Song, W., Hu, Y., et al. (2014). MyoD and Myf6 gene expression patterns in skeletal muscle during embryonic and posthatch development in the domestic duck (Anas platyrhynchos domestica). J. Anim. Breed Genet. 131, 194–201. doi: 10.1111/jbg.12057
Li, X., Zhu, Y., Zhang, H., Ma, G., Wu, G., Xiang, A., et al. (2018). MicroRNA-106a-5p inhibited C2C12 myogenesis via targeting PIK3R1 and modulating the PI3K/AKT signaling. Genes 9:333. doi: 10.3390/genes9070333
Li, Z., Cai, B., Abdalla, B. A., Zhu, X., Zheng, M., Han, P., et al. (2019). LncIRS1 controls muscle atrophy via sponging miR-15 family to activate IGF1-PI3K/AKT pathway. J. Cachexia Sarcopenia Muscle 10, 391–410. doi: 10.1002/jcsm.12374
Li, Z., Ouyang, H., Zheng, M., Cai, B., Han, P., Abdalla, B. A., et al. (2016). Integrated analysis of long non-coding RNAs (LncRNAs) and mRNA expression profiles reveals the potential role of LncRNAs in skeletal muscle development of the chicken. Front. Physiol. 7:687. doi: 10.3389/fphys.2016.00687
Liang, T., Zhou, B., Shi, L., Wang, H., Chu, Q., Xu, F., et al. (2018). lncRNA AK017368 promotes proliferation and suppresses differentiation of myoblasts in skeletal muscle development by attenuating the function of miR-30c. FASEB J. 32, 377–389. doi: 10.1096/fj.201700560rr
Liu, Y., Li, G., and Zhang, J. F. (2017). The role of long non-coding RNA H19 in musculoskeletal system: a new player in an old game. Exp. Cell Res. 360, 61–65. doi: 10.1016/j.yexcr.2017.09.007
Mancini, A., Sirabella, D., Zhang, W., Yamazaki, H., Shirao, T., and Krauss, R. S. (2011). Regulation of myotube formation by the actin-binding factor drebrin. Skelet Muscle 1:36. doi: 10.1186/2044-5040-1-36
Millay, D. P., Gamage, D. G., Quinn, M. E., Min, Y. L., Mitani, Y., Bassel-Duby, R., et al. (2016). Structure-function analysis of myomaker domains required for myoblast fusion. Proc. Natl. Acad. Sci. U.S.A. 113, 2116–2121. doi: 10.1073/pnas.1600101113
Mortazavi, A., Williams, B. A., McCue, K., Schaeffer, L., and Wold, B. (2008). Mapping and quantifying mammalian transcriptomes by RNA-Seq. Nat. Methods 5, 621–628. doi: 10.1038/nmeth.1226
Otto, A., Schmidt, C., Luke, G., Allen, S., Valasek, P., Muntoni, F., et al. (2008). Canonical Wnt signalling induces satellite-cell proliferation during adult skeletal muscle regeneration. J. Cell Sci. 121, 2939–2950. doi: 10.1242/jcs.026534
Pachnis, V., Belayew, A., and Tilghman, S. M. (1984). Locus unlinked to alpha-fetoprotein under the control of the murine raf and Rif genes. Proc. Natl. Acad. Sci. U.S.A. 81, 5523–5527. doi: 10.1073/pnas.81.17.5523
Poirier, F., Chan, C. T., Timmons, P. M., Robertson, E. J., Evans, M. J., and Rigby, P. W. (1991). The murine H19 gene is activated during embryonic stem cell differentiation in vitro and at the time of implantation in the developing embryo. Development 113, 1105–1114.
Qin, C. Y., Cai, H., Qing, H. R., Li, L., and Zhang, H. P. (2017). Recent advances on the role of long non-coding RNA H19 in regulating mammalian muscle growth and development. Yi Chuan 39, 1150–1157.
Relaix, F., and Zammit, P. S. (2012). Satellite cells are essential for skeletal muscle regeneration: the cell on the edge returns centre stage. Development 139, 2845–2856. doi: 10.1242/dev.069088
Retamales, A., Zuloaga, R., Valenzuela, C. A., Gallardo-Escarate, C., Molina, A., and Valdes, J. A. (2015). Insulin-like growth factor-1 suppresses the Myostatin signaling pathway during myogenic differentiation. Biochem. Biophys. Res. Commun. 464, 596–602. doi: 10.1016/j.bbrc.2015.07.018
Rudnicki, M. A., and Williams, B. O. (2015). Wnt signaling in bone and muscle. Bone 80, 60–66. doi: 10.1016/j.bone.2015.02.009
Su, Z., Zhi, X., Zhang, Q., Yang, L., Xu, H., and Xu, Z. (2016). LncRNA H19 functions as a competing endogenous RNA to regulate AQP3 expression by sponging miR-874 in the intestinal barrier. FEBS Lett. 590, 1354–1364. doi: 10.1002/1873-3468.12171
Sui, Y., Han, Y., Zhao, X., Li, D., and Li, G. (2019). Long non-coding RNA Irm enhances myogenic differentiation by interacting with MEF2D. Cell Death Dis. 10:181. doi: 10.1038/s41419-019-1399-2
Sun, X., Li, M., Sun, Y., Cai, H., Lan, X., Huang, Y., et al. (2016). The developmental transcriptome sequencing of bovine skeletal muscle reveals a long noncoding RNA, lncMD, promotes muscle differentiation by sponging miR-125b. Biochim. Biophys. Acta 1863, 2835–2845. doi: 10.1016/j.bbamcr.2016.08.014
Ueda-Wakagi, M., Hayashibara, K., Nagano, T., Ikeda, M., Yuan, S., Ueda, S., et al. (2018). Epigallocatechin gallate induces GLUT4 translocation in skeletal muscle through both PI3K- and AMPK-dependent pathways. Food Funct. 9, 4223–4233. doi: 10.1039/C8FO00807H
Wang, L., Feng, Z., Wang, X., Wang, X., and Zhang, X. (2010). DEGseq: an R package for identifying differentially expressed genes from RNA-seq data. Bioinformatics 26, 136–138. doi: 10.1093/bioinformatics/btp612
Wang, Y. X., and Rudnicki, M. A. (2011). Satellite cells, the engines of muscle repair. Nat. Rev. Mol. Cell Biol. 13, 127–133. doi: 10.1038/nrm3265
Wang, Z., Yang, B., Zhang, M., Guo, W., Wu, Z., Wang, Y., et al. (2018). lncRNA epigenetic landscape analysis identifies EPIC1 as an oncogenic lncRNA that interacts with MYC and promotes cell-cycle progression in cancer. Cancer Cell 33, 706.e9–720.e9. doi: 10.1016/j.ccell.2018.03.006
Xiao, N., Qi, X. Y., Tang, L. N., Tan, L. L., Chen, Y. Q., and Zhao, H. M. (2014). VEGF promotes cardiac stem cells differentiation into vascular endothelial cells via the PI3K/Akt signaling pathway. Artif. Cells Nanomed. Biotechnol. 42, 400–405. doi: 10.3109/21691401.2013.837473
Xu, X., Ji, S., Li, W., Yi, B., Li, H., Zhang, H., et al. (2017). LncRNA H19 promotes the differentiation of bovine skeletal muscle satellite cells by suppressing Sirt1/FoxO1. Cell Mol. Biol. Lett. 22:10. doi: 10.1186/s11658-017-0040-6
Yao, H., Han, X., and Han, X. (2014). The cardioprotection of the insulin-mediated PI3K/Akt/mTOR signaling pathway. Am. J. Cardiovasc. Drugs 14, 433–442. doi: 10.1007/s40256-014-0089-9
Yu, F., Jiang, Z., Chen, B., Dong, P., and Zheng, J. (2017). NEAT1 accelerates the progression of liver fibrosis via regulation of microRNA-122 and Kruppel-like factor 6. J. Mol. Med. 95, 1191–1202. doi: 10.1007/s00109-017-1586-5
Zammit, P. S. (2017). Function of the myogenic regulatory factors Myf5, MyoD, Myogenin and MRF4 in skeletal muscle, satellite cells and regenerative myogenesis. Semin. Cell Dev. Biol. 72, 19–32. doi: 10.1016/j.semcdb.2017.11.011
Zhang, F., Deng, B., Wen, J., Chen, K., Liu, W., Ye, S., et al. (2015). PPARgamma and MyoD are differentially regulated by myostatin in adipose-derived stem cells and muscle satellite cells. Biochem. Biophys. Res. Commun. 458, 375–380. doi: 10.1016/j.bbrc.2015.01.120
Zhang, Z. K., Li, J., Guan, D., Liang, C., Zhuo, Z., Liu, J., et al. (2018). Long noncoding RNA lncMUMA reverses established skeletal muscle atrophy following mechanical unloading. Mol. Ther. 26, 2669–2680.
Keywords: H19, porcine satellite cells, differentiation, miR-140-5p, SOX4, DBN1
Citation: Li J, Su T, Zou C, Luo W, Shi G, Chen L, Fang C and Li C (2020) Long Non-coding RNA H19 Regulates Porcine Satellite Cell Differentiation Through miR-140-5p/SOX4 and DBN1. Front. Cell Dev. Biol. 8:518724. doi: 10.3389/fcell.2020.518724
Received: 09 December 2019; Accepted: 29 September 2020;
Published: 25 November 2020.
Edited by:
Louis Lefebvre, University of British Columbia, CanadaReviewed by:
Miguel Branco, Queen Mary University of London, United KingdomYongzhen Huang, Northwest A&F University, China
Xiangbin Ding, Tianjin Agricultural University, China
Copyright © 2020 Li, Su, Zou, Luo, Shi, Chen, Fang and Li. This is an open-access article distributed under the terms of the Creative Commons Attribution License (CC BY). The use, distribution or reproduction in other forums is permitted, provided the original author(s) and the copyright owner(s) are credited and that the original publication in this journal is cited, in accordance with accepted academic practice. No use, distribution or reproduction is permitted which does not comply with these terms.
*Correspondence: Changchun Li, lichangchun@mail.hzau.edu.cn
†These authors have contributed equally to this work