 Katia Cheaito1†
 Hisham F. Bahmad1†‡
 Hiba Jalloul1
 Ola Hadadeh1Hiba Msheik1
 Albert El-Hajj2
 Deborah Mukherji3
 Mohamed Al-Sayegh4*
 Wassim Abou-Kheir1*
- 1Department of Anatomy, Cell Biology and Physiological Sciences, Faculty of Medicine, American University of Beirut, Beirut, Lebanon
- 2Division of Urology, Department of Surgery, American University of Beirut Medical Center, Beirut, Lebanon
- 3Division of Hematology-Oncology, Department of Internal Medicine, American University of Beirut Medical Center, Beirut, Lebanon
- 4Biology Division, New York University Abu Dhabi, Abu Dhabi, United Arab Emirates
Prostate cancer (PCa) is the second leading cause of cancer-related mortality and morbidity among males worldwide. Deciphering the biological mechanisms and molecular pathways involved in PCa pathogenesis and progression has been hindered by numerous technical limitations mainly attributed to the limited number of cell lines available, which do not recapitulate the diverse phenotypes of clinical disease. Indeed, PCa has proven problematic to establish as cell lines in culture due to its heterogeneity which remains a challenge, despite the various in vitro and in vivo model systems available. Growth factors have been shown to play a central role in the complex regulation of cell proliferation among hormone sensitive tumors, such as PCa. Here, we report the isolation and characterization of novel patient-derived prostate epithelial (which we named as AUB-PrC) cells from organoids culture system. We also assessed the role of epidermal growth factor (EGF) in culturing those cells. We profiled the AUB-PrC cells isolated from unaffected and tumor patient samples via depicting their molecular and epithelial lineage features through immunofluorescence staining and quantitative real-time PCR (qRT-PCR), as well as through functional assays and transcriptomic profiling through RNA sequencing. In addition, by optimizing a previously established prostate organoids culture system, we were able to grow human prostate epithelial cells using growth medium and EGF only. With these data collected, we were able to gain insight at the molecular architecture of novel human AUB-PrC cells, which might pave the way for deciphering the mechanisms that lead to PCa development and progression, and ultimately improving prognostic abilities and treatments.
Introduction
Prostate cancer (PCa) is the most commonly diagnosed cancer and second leading cause of cancer-related deaths among males worldwide, with an estimated annual incidence of 191,930 in the United States in 2020, and estimated deaths of 33,330 per year (Siegel et al., 2020). PCa usually contains multifocal lesions (with varying genetic alterations) and is heterogenous at the molecular, cellular and architectural levels (Zhang et al., 2016), which makes obtaining a homogenous material for molecular analysis difficult (Abate-Shen and Shen, 2000; Bahmad et al., 2020b; Daouk et al., 2020). The heterogeneity of this tumor also renders choosing the best therapy for each patient (castration therapy, surgery, radiotherapy, or chemotherapy) very challenging (Karantanos et al., 2013; Zhang et al., 2016).
Understanding the molecular pathways involved in PCa has been hindered by numerous technical limitations. These mainly relate to the limited number of PCa cell lines available, which do not recapitulate the diverse phenotypes of clinical disease (Ziaee et al., 2015). Nonetheless, the need for representative in vitro and in vivo models that recapitulate different stages of PCa (Daoud et al., 2016; Daouk et al., 2020; Bahmad et al., 2020b), especially castration-resistant prostate cancer (CRPC), has led to numerous attempts to establish cell lines from human prostate carcinomas (Van Bokhoven et al., 2003). Prostate carcinomas, however, have been the most challenging to establish continuous cell lines from Cunningham and You (2015) and Huang et al. (2016). Approximately 30 reported human prostate cell lines have been described and used for research purposes from 1970 to the present (Van Bokhoven et al., 2003). Due to contamination of putative prostate cell lines, those cells turned out to be derivatives of previously established prostate carcinoma cell lines such as DU145 and PC-3 (Chen, 1993; MacLeod et al., 1999; Pan et al., 2001; Van Bokhoven et al., 2001, 2003). It is thus important to select prostate cell lines that accurately depict its molecular features in order to address research questions appropriately, preferably generated from primary human tissue, bearing in mind that generating a “new primary” PCa cell line is very challenging (Sobel and Sadar, 2005).
A novel promising technology has been recently developed to study tissue homeostasis through a three-dimensional (3D) organoid culture system (Koo et al., 2011). These organoids that mimic the structures of tissues in vivo, can grow “indefinitely” in culture and remain phenotypically and genetically stable (Sato et al., 2009; Schwank et al., 2013a,b; Drost et al., 2016). It is believed that they stem from single multipotent stem cells or progenitors capable of differentiation and self-organization to form structures morphologically and functionally resembling the corresponding in vivo organ (Bartucci et al., 2016; Bahmad et al., 2020a). Currently, organoids are being established from a variety of organs, including the colon, stomach, and prostate among others (Barker et al., 2010; Eiraku et al., 2011; Jung et al., 2011; Sato et al., 2011; Antonica et al., 2012; Huch et al., 2013; Koehler et al., 2013; Lancaster et al., 2013; Stange et al., 2013; Sachs and Clevers, 2014; Taguchi et al., 2014; Takasato et al., 2014; Agarwal et al., 2015; Drost et al., 2016). Karthaus et al. adapted this culture method to PCa and described an R-spondin1-based 3D culture method through which normal human and murine prostate epithelial cells can be cultured indefinitely without genetic manipulation, in an in vitro 3D system that models prostate glandular structure (Karthaus et al., 2014).
Herein, we employed the 3D organoid culture system to generate patient-derived prostate epithelial (American University of Beirut-Prostate Cells; AUB-PrC) cells in vitro in an attempt to establish new cells without any genetic manipulation. Since EGFR ligands (such as EGF) and other growth factors have been shown to mediate epithelial cell repair of bronchial cells (Barrow et al., 1993; Burgel and Nadel, 2004), breast cancer (Fitzpatrick et al., 1984; Kim et al., 2012), and PCa cells (Peehl et al., 1996; Festuccia et al., 2005), we hypothesized that EGF might have a role in prostate epithelial cell growth in culture as well. This is supported by the notion that human recombinant EGF is known to be essential for the growth of PCa cells cultured in keratinocyte growth media (Bahmad et al., 2018). We characterized the novel generated primary AUB-PrC cells for molecular and epithelial lineage features through immunofluorescence (IF) staining and quantitative real-time PCR (qRT-PCR), as well as through functional assays and transcriptomic profiling through RNA sequencing.
Materials and Methods
Patients Selection
Samples from different stages of human prostate adenocarcinomas were obtained from consented treatment-naïve patients undergoing radical prostatectomy at the American University of Beirut Medical Center (AUBMC). Appropriate Institutional Review Board (IRB) approval was obtained. After getting written informed consents from the patients, primary tissue samples collected were used only if this doesn’t compromise the diagnosis or staging. A sample was taken from each patient from the area most likely to be involved with cancer (from the core of the cancerous lesion) and a sample from the unaffected area (far from the tumor site) according to the urologist’s and pathologist’s recommendation.
A total of seven treatment-naïve patients with PCa diagnosis were enrolled in our study and tested for PSA level at the time of operation. Prostate tissue specimens were collected, weighed, and characterized then assigned a Gleason score, International Society of Urological Pathology (ISUP) grade group, and TNM cancer staging by a pathologist at AUBMC. Among the seven patients included, there was no cancer invasion to nearby lymph nodes and the cancer had not metastasized to other parts of the body (Supplementary Table S1).
Collection, Dissection, and Processing of Patient Prostate Tissue Specimens
The collected fresh prostate tissues (ranging from 3 to 5 mm in size) were directly put in a 50 mL conical tube containing “human prostate growth medium” right after the surgery, sent to the research laboratory, and kept at 4°C until processing (within 6 h to maximize the reliability of organoids generation). Using sterile scalpel blades, prostate tissue fragments were minced into approximately 0.1–0.5 mm diameter pieces and washed with “human prostate growth medium” to get rid of cellular debris. Part of minced fragments were used for organoids culturing and the remaining fragments were used for RNA extraction and sequencing.
Prostate tissue fragments designated “unaffected” (U) and “tumor” (T) and minced using sterile scalpel blades were kept overnight in a humidified incubator containing 5% CO2 at 37°C with 5 mL of 5 mg/mL collagenase type II (GibcoTM; cat #17101-015) in Advanced DMEM-F12 medium (adDMEM/F12) (GibcoTM; cat #12634-010) with ROCK inhibitor (Y-27632) (Santa Cruz; cat #sc-281642A) to digest the tissue. The next day, cells were washed with adDMEM/F12, then centrifuged at 200 g for 5 min at 4°C. The pellet was resuspended in 1 mL TrypLETM (ThermoFisher; cat #12605-010) with Y-27632 and digested for approximately 15 min at 37°C. The pellet was then washed once with adDMEM/F12 and centrifuged at 200 g for 5 min at 4°C. Digested tissue was placed in ice-cold MatrigelTM (Corning Life Sciences; cat #354230) and pipetted up and down several times to mix. Around 20,000 cells in a 40 μL drop of 90% MatrigelTM were plated into the middle of one well of a 24-wells culture plate which was placed upside down in the 37°C incubator for 15 min to allow the MatrigelTM to solidify. Then, 500 μL of pre-warmed (37°C) human prostate growth medium plus Y-27632 was added gently into each well. Media was replenished every 3 days using human prostate growth medium plus Y-27632. ROCK inhibitor (Y-27632) was added fresh to the culture medium on the same day medium is changed for the first week after plating only.
Human Prostate Growth Medium Components
“Human prostate growth medium” was prepared using adDMEM/F12 supplemented with 1% Penicillin/Streptomycin (v/v) (Biowest; cat #L0022-100), 0.2% Gentamicin/Amphotericin B (v/v) (Thermo Fisher; cat #R01510), 0.2% plasmocin prophylactic (v/v) (Invivogen; cat #ant-mpp), 10 mM HEPES (GibcoTM; cat #15630-056) and 2 mM GlutaMAX (GibcoTM; cat #35050-061). For organoids culturing, organoid medium components specified in Supplementary Table S2 were added (Cheaito et al., under review).
Culturing of Patient-Derived Prostate Epithelial (AUB-PrC) Cells
After passaging the organoids, leftover two-dimensional (2D) cells were detached using TrypLETM and then transferred to T25 plates previously coated with 1% collagen-I. Cells were supplemented with “human prostate growth medium” plus ROCK inhibitor (Y-27632) and incubated at 37°C in a CO2 incubator. These patient-derived 2D cells were split at a ratio of 1:2 every 3–4 days where 50% of cells were frozen down in FBS + 10% DMSO (v/v) and stored in liquid nitrogen, and 50% were maintained in culture using same conditions and medium.
American University of Beirut-Prostate Cells (AUB-PrC) cells from patients (unaffected and tumor parts) were named as follows:
• AUB-PrC-U#: Patient # unaffected prostate epithelial cells
• AUB-PrC-T#: Patient # tumor prostate epithelial cells
(# designates the patient number from 1 to 7)
Cells were frozen in fetal bovine serum (FBS) (Sigma-Aldrich; cat #F9665) + 10% dimethyl sulfoxide (DMSO) (Scharlau; cat #SU01571000) as P0 cells to serve as a stock of patient’s derived cells for later use. All cells were kept as a stock in liquid nitrogen.
Immunofluorescence (IF) Analysis of Cells
Indirect immunofluorescence analysis was used to characterize prostate epithelial lineage markers, including CK8 and CK5. Cells were grown on collagen-I coated coverslips. Adherent cells were then fixed using 4% PFA (v/v) in PBS for 20 min, then permeabilized with 0.5% Triton X-100 (v/v) in PBS for 20 min. Non-specific sites were blocked by incubation in blocking buffer [0.1% BSA (v/v), 0.2% Triton X-100 (v/v), 0.05% Tween-20 (v/v) and 10% NGS (v/v] in PBS) for 1 h [bovine serum albumin (BSA) (v/v) (Amresco; cat #0332-100G), normal goat serum (NGS) (v/v) (ThermoFisher; cat #16210064), Tween-20 (Sigma-Aldrich; cat #P1379), and Triton X-100 (v/v) (Sigma-Aldrich; cat #T9284)]. Cells were then incubated overnight with specific primary antibodies at 4°C. After washing with PBS containing 0.1% Tween-20 (v/v), cells were incubated with the corresponding secondary antibodies, then washed gently and mounted with anti-fade reagent Fluoro-gel II with DAPI (Electron Microscopy Sciences; cat #17985-51). Immunofluorescence images were captured using the Carl Zeiss Axio Observer.Z1 with 40 × oil reflector and confocal microscopic analyses was performed using Zeiss LSM710 laser scanning confocal microscope, both utilizing the Carl Zeiss ZEN 2013 image software.
The following antibodies were used: mouse monoclonal anti-CK8 (1/200 dilution; BioLegend; cat #MMS-162P), rabbit polyclonal anti-CK5 (1/200 dilution; BioLegend; cat #PRB-160P), rabbit polyclonal anti-CK14 (1/200 dilution; BioLegend; cat #PRB-155P), rabbit polyclonal anti-Vim (1/50 dilution; Santa Cruz Biotechnology; cat #sc-5565) Alexa 568 goat anti-mouse IgG (ThermoFisher; cat #A-11004), and Alexa 488 goat anti-rabbit IgG (ThermoFisher; cat # A-11034). All secondary Alexa Fluor antibodies were used at 1/200 dilution. Fluoro-gel II with DAPI (Electron Microscopy Sciences, PA) was used for mounting.
Total RNA Extraction and Purification
Total RNA was extracted from corresponding samples using both TriZol (ThermoFisher; cat #15596026) and RNAeasy Mini Kit (Qiagen; cat #74104) according to manufacturer’s protocols with modifications. Patient tissues, organoids, and organoid-derived AUB-PrC cells were washed once with 1 mL of PBS prior to the addition of 1 mL of TriZol reagent, which were used to isolated total RNA (upper aqueous phase) after the addition of 0.2 mL of Chloroform followed by centrifugation at 12,000 rpm for 15 min at 4°C. Isolated RNA phase were mixed with 70% ethanol with equal volumes followed by purification of RNA using RNAeasy Mini spin column (Qiagen) according to the manufacturer’s protocol. Concentrations and integrity (RNA integrity number—RIN) of isolated RNA were determined using ThermoScientificTM NanoDrop 2000TM and Agilent BioAnalyzer 2100TM, respectively.
Quantitative Real-Time Polymerase Chain Reaction (qRT-PCR) of Cells
For cDNA preparation, the Quantitect Reverse Transcription Kit (Qiagen; cat #205311) was utilized. cDNA was diluted in a 1:10 volume ratio of DEPC. mRNA expression of normal and tumor samples were analyzed by RT-PCR (Bio-rad CFXTM Manager Software; cat #1845000) using the ΔCt method and the SYBR green system. All reactions were performed using 2X SYBR Green master mixes each containing 2 μL template cDNA, 0.5 μL of each primer mix (forward and reverse), 5 μL buffer containing SYBR Green (Applied Biosystems; cat #A46111) and 2.5 μL of RNase free water (Primers used are listed in Supplementary Table S3).
The PCR reaction consisted of a DNA denaturation step at 95°C for 5 min, followed by 40 cycles (denaturation at 95°C for 10 s), then annealing at the appropriate temperature of 60°C for each primer for 30 s, and finally an extension step at 72°C for 10 min. For each experiment, reactions were performed in duplicates and expression of individual genes was normalized to the house keeping gene GAPDH. Gene expression was calculated through the following equation: ΔCt = Ct (target) − Ct (GAPDH). The amount of endogenous target gene relative to a calibrator (GAPDH) became 2–Δ Ct.
RNA Sequencing of AUB-PrC Cells vs. Their Corresponding Tissue Counterparts
RNA-Seq Library Preparation and Sequencing
RNA samples from two patients (patients 4 and 5) with total concentrations of > 0.5 ng/μl and RIN > 8 were used for library preparation. RNA Sequencing (RNA-Seq) libraries were prepared using Illumina#x00AE; TruSeq Stranded mRNA prep kit (Illumina; cat #RS-122-2101) accordingly with the manufacturers LS protocol. Samples were barcoded, multiplexed and sequenced (100 bp pair-end) using the Illumina® Hi-Seq 2500 platform at New York University Abu Dhabi (NYUAD) Genomic Core facility (Abu Dhabi, U.A.E.).
Transcriptome Data Computational Analysis (Subject to Change)
DESeq2 computational pipeline was used to estimate the raw count reads aligned to the reference genome (Love et al., 2014). Computing methods were run on a Linux based command system on NYUAD High Performance Computing (HPC) server platform Dalma. Correlation (i.e., Principle Component Analysis—PCA) analysis were generated by RNA-Seq START (Shiny Transcriptome Analysis Resource Tool) application, via the New York University Abu Dhabi Center of Genomic and Systems Biology (NYUAD-CGSB) Bioinformatics Online Analysis and Visualization Portal1 (Nelson et al., 2017). The data discussed in this paper have been deposited in NCBI’s Gene Expression Omnibus (Edgar et al., 2002) and are accessible through GEO Series accession number GSE1489372.
Gene Array Data Analysis
Differentially expressed gene (DEG) features (3,383 and 4,250 significantly differentially expressed transcripts between the AUB-PrC cells and their corresponding tissues in the unaffected and tumor samples, respectively) were subjected to Gene Ontology (GO) term and gene set enrichment analyses using GSEA, Cytoscape, and EnrichmentMap bioinformatics tools (Reimand et al., 2019). The database of pathway gene sets used for pathway enrichment analysis was downloaded from http://baderlab.org/GeneSets and it includes eight data sources: MSigDB (C2 collection) (Subramanian et al., 2005), NCI (Schaefer et al., 2009), Institute of Bioinformatics (IOB), NetPath (Kandasamy et al., 2010), HumanCyc (Romero et al., 2005), Reactome (Croft et al., 2011), GO (Ashburner et al., 2000), MSigDB (C3 collection; Specialty GMTs mirs, transcription factors) (Subramanian et al., 2005), and Panther (Mi et al., 2005; Supplementary Table S4).
MTT Cell Growth Assay
MTT ([3-(4, 5-dimethylthiazol-2-yl)-2, 5-diphenyltetrazolium bromide]) (Sigma-Aldrich; cat #M5655-1G) cell growth assay was used, according to the manufacturer’s instructions (Mosmann, 1983; Riss et al., 2004; Van Meerloo et al., 2011), to measure the in vitro cell proliferation and growth of the unaffected and tumor patient-derived AUB-PrC cells under the three different culturing conditions:
• Condition control “All Factors” was prepared as described in Supplementary Table S2
• Condition “All Factors – EGF” included all other components except EGF
• Condition “EGF alone” included adDMEM/F12 medium + EGF only (10 ng/mL)
AUB-PrC cells were derived from tissue samples of 3 different patients (Patients 5, 6, and 7), including the unaffected and the tumor sample for each. Cells were seeded at a density of 4 × 10³ cells/well in 100 μL in triplicates in 96-well culture plates and incubated overnight at 37°C in a humidified incubator containing 5% CO2, before being exposed to the different culturing conditions for 72 h. Media was changed at 24 and 48 h. The reduced MTT optical density (OD) was measured by the microplate ELISA reader (Multiscan EX) at a wavelength of 595 nm. The percentage of cell viability was presented as percentage growth using the OD ratio of cells relative to condition “All Factors.” The average percentage cell viability in each condition was derived from the mean of triplicate wells of three independent experiments.
Cell Viability (Trypan Blue Exclusion Method)
Unaffected and tumor AUB-PrC cells from three patients were seeded, in triplicates, in 12-well plates at a density of 5 × 10⁴ cells per well. Cells were then cultured under the three different culturing conditions used in the MTT assay for up to 72 h. Viable cells were collected and counted using trypan blue dye (Sigma-Aldrich; cat #T8154-100ML) exclusion method after 72 h (Strober, 2001). Cell viability was expressed as percentage growth relative to condition “All Factors.” The data are derived from the mean of triplicates wells.
Statistical Analyses
Statistical analysis was performed using GraphPad Prism 7 software. Student’s t-test was used to analyze gene expression. To determine statistical significance of differences in in vitro cell proliferation and viability of the unaffected and tumor patient-derived AUB-PrC cells between the three culturing conditions related to EGF, two-way ANOVA test was performed followed by multiple comparisons using Bonferroni post hoc analysis. All P < 0.05 were considered significant.
Results
Isolation of Patient-Derived Prostate Epithelial (AUB-PrC) Cells From 3D Organoids
Starting from the prostate organoids protocol and using the same culture medium (Cheaito et al., under review), AUB-PrC two-dimensional (2D) cell lines (unaffected and tumor) were successfully generated. After the 1st week of organoids culture (Figure 1A), cells started invading the three-dimensional (3D) MatrigelTM droplet and proliferating in 2D cultures on the bottom of the plates (Figure 1B). Collagen-I allowed the spreading of cells and maintained their healthy morphology when propagated for continuous passages reaching more than 28 passages with successful repeated freeze-thaw cycles (Figure 1C).
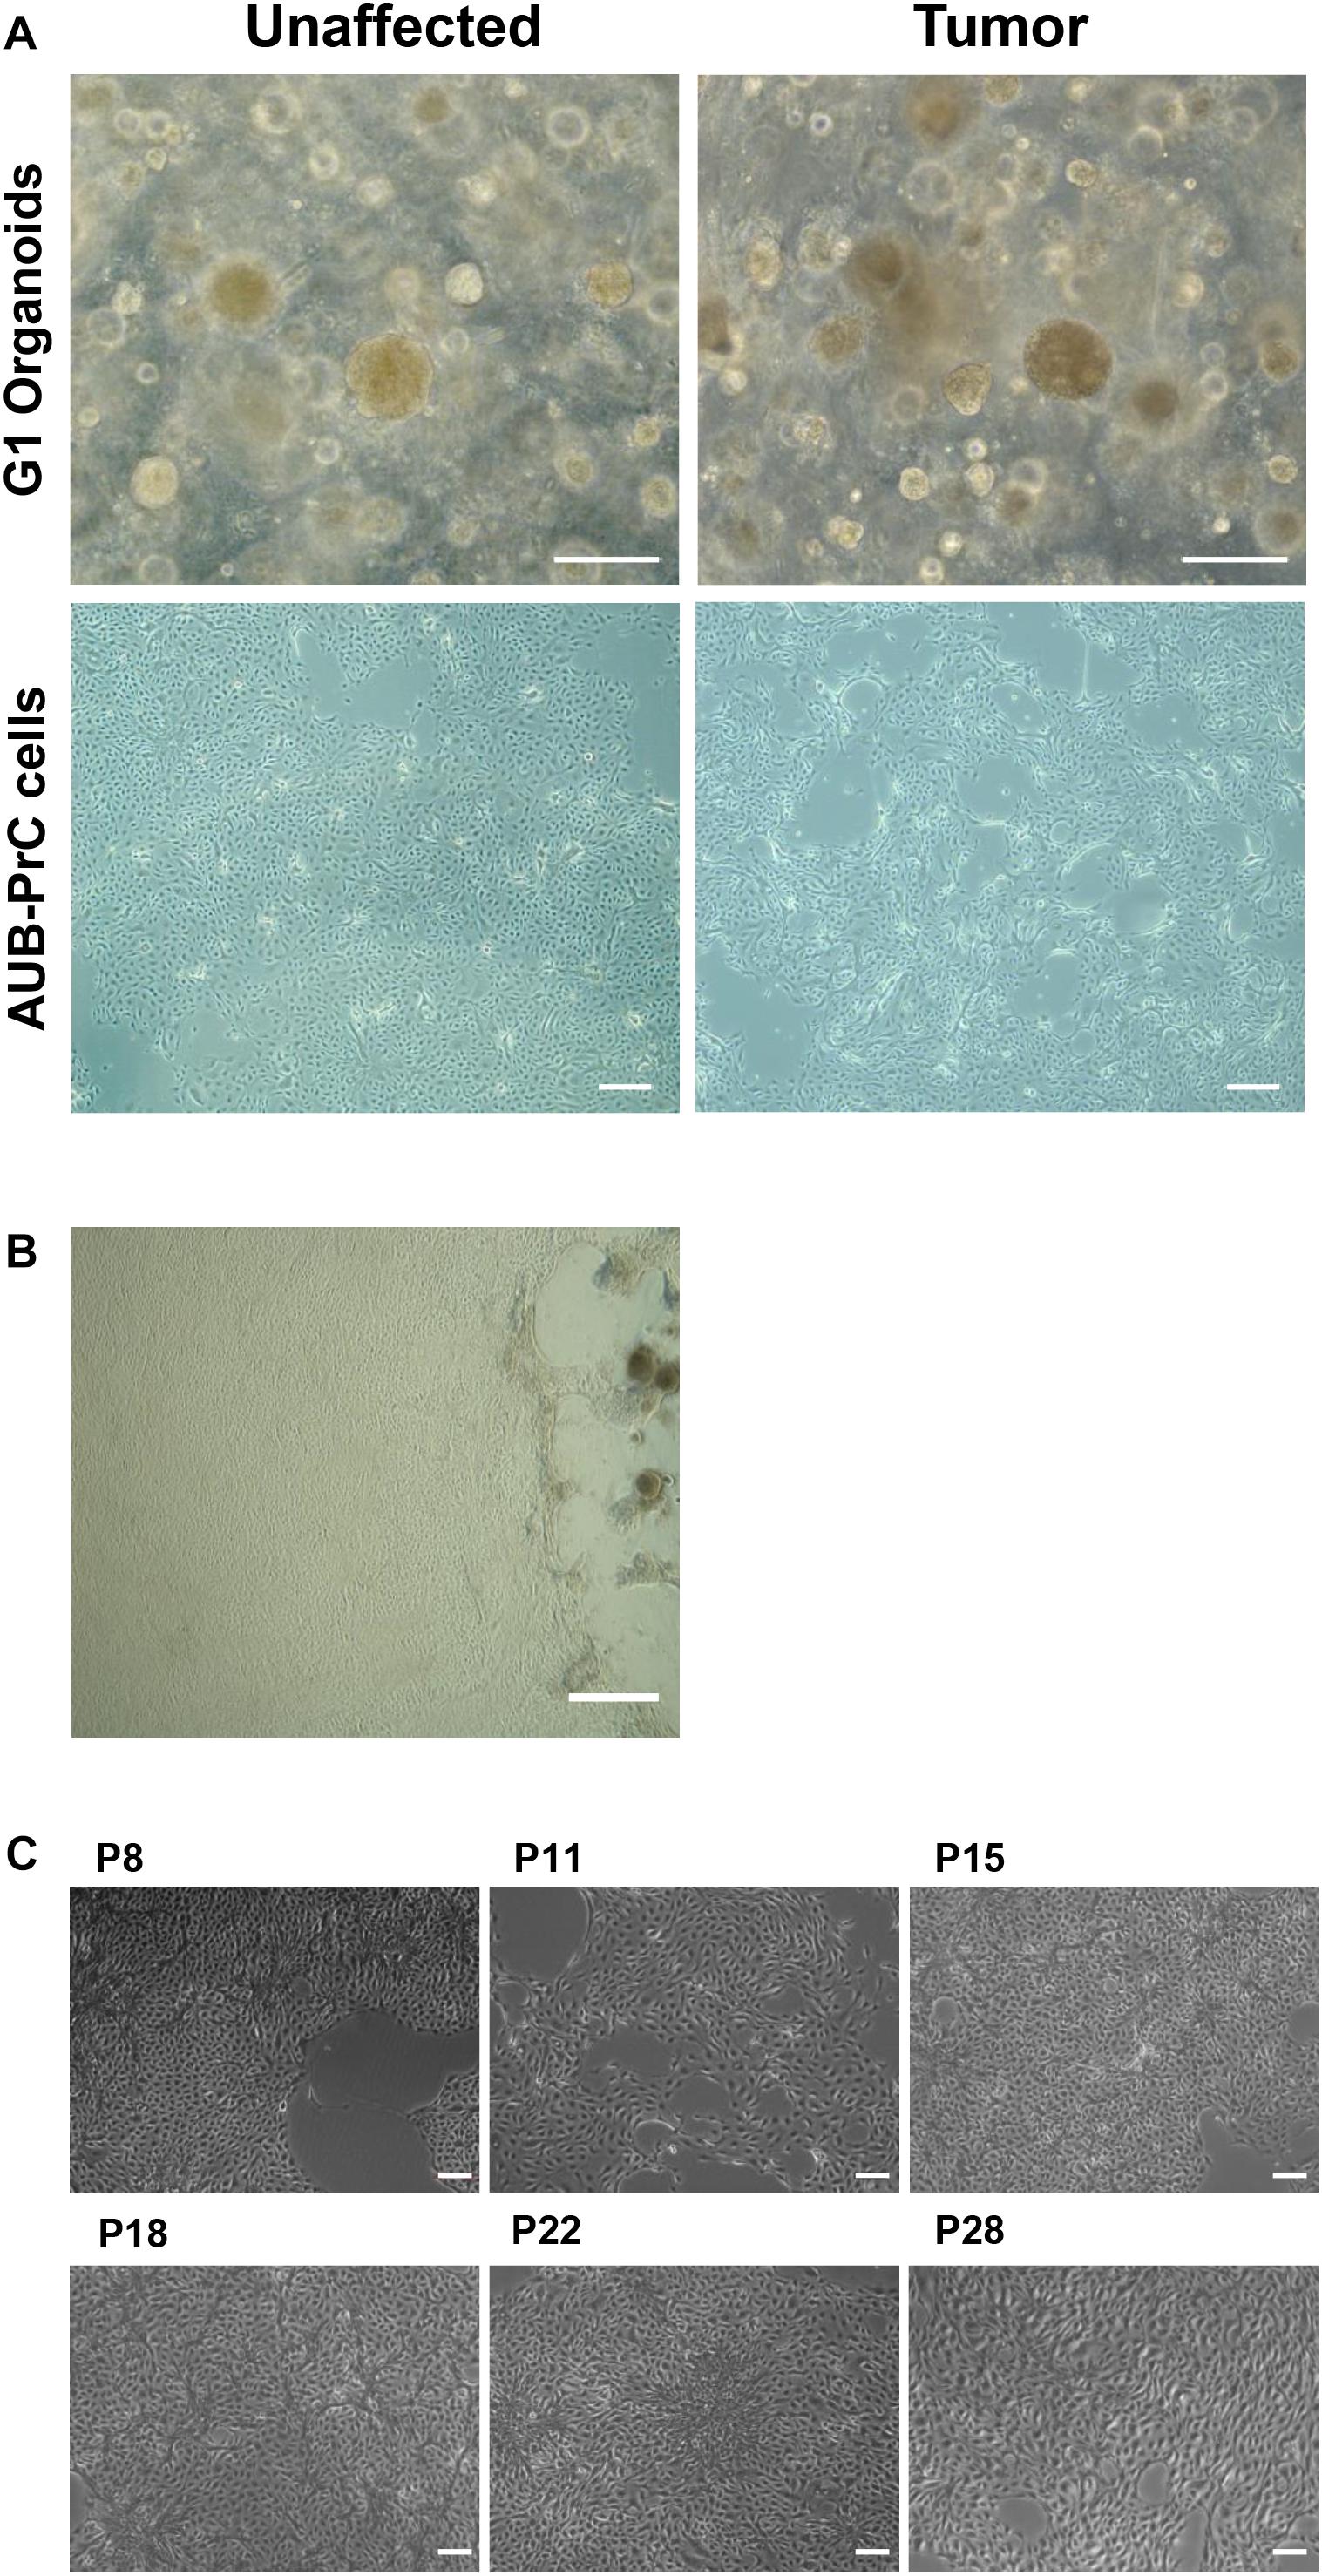
Figure 1. Isolation of patient-derived AUB-PrC cells using organoids culture conditions. Representative bright-field images showing established prostate organoids (generation 1, G1) from unaffected and tumor prostate patient samples {patient 2 with Grade Group 3 [Gleason Score 7(4 + 3)]; patient characteristics in Supplementary Table S1} grown in culture (Scale bar = 200 μm) (A), and AUB-PrC cells established and grown on 1% collagen type-I coated plates (Scale bar = 200 μm) (B) maintaining their healthy morphology when propagated for continuous passages (passages P8, P11, P15, P18, P22, and P28 are shown) reaching more than 28 passages with successful repeated freeze-thaw cycles (Scale bar = 100 μm) (C).
Immunofluorescence Characterization of AUB-PrC Cells for Prostate Epithelial Lineage Markers
Using immunofluorescence, we characterized AUB-PrC cells derived from three treatment-naïve patients for prostate epithelial lineage markers. AUB-PrC cells displayed key characteristics of epithelial cells, showing that when such cells are further apart from each other, they form extensions that fill the gaps in vitro. We also demonstrated that tumor AUB-PrC cells display elongated epithelial cell features compared to their unaffected counterparts (Figure 2A and Supplementary Figure S1). Those key characteristics of epithelial cells show that when such cells are further apart from each other, they tend to form extensions to fill the gaps in vitro. Morphological differences were further depicted in immunofluorescent staining of AUB-PrC cells using lineage epithelial cell markers, including CK8 (luminal epithelial cell marker) and CK5 (basal epithelial cell marker). Both unaffected and tumor AUB-PrC cells showed evidence of CK8 + and CK5 + expression (Figure 2B and Supplementary Figure S2A) with no difference in expression noticed between unaffected and tumor cells. Since PCa cells are more prone to lose their epithelial phenotype in favor of a more mesenchymal phenotype, which is a trigger for aggressiveness and metastasis (Cheaito et al., 2019), we employed immunofluorescent staining of tumor AUB-PrC cells using CK8 (luminal epithelial cell marker) and vimentin (VIM; mesenchymal cell marker), showing evidence of VIM + expression (Supplementary Figure S2B).
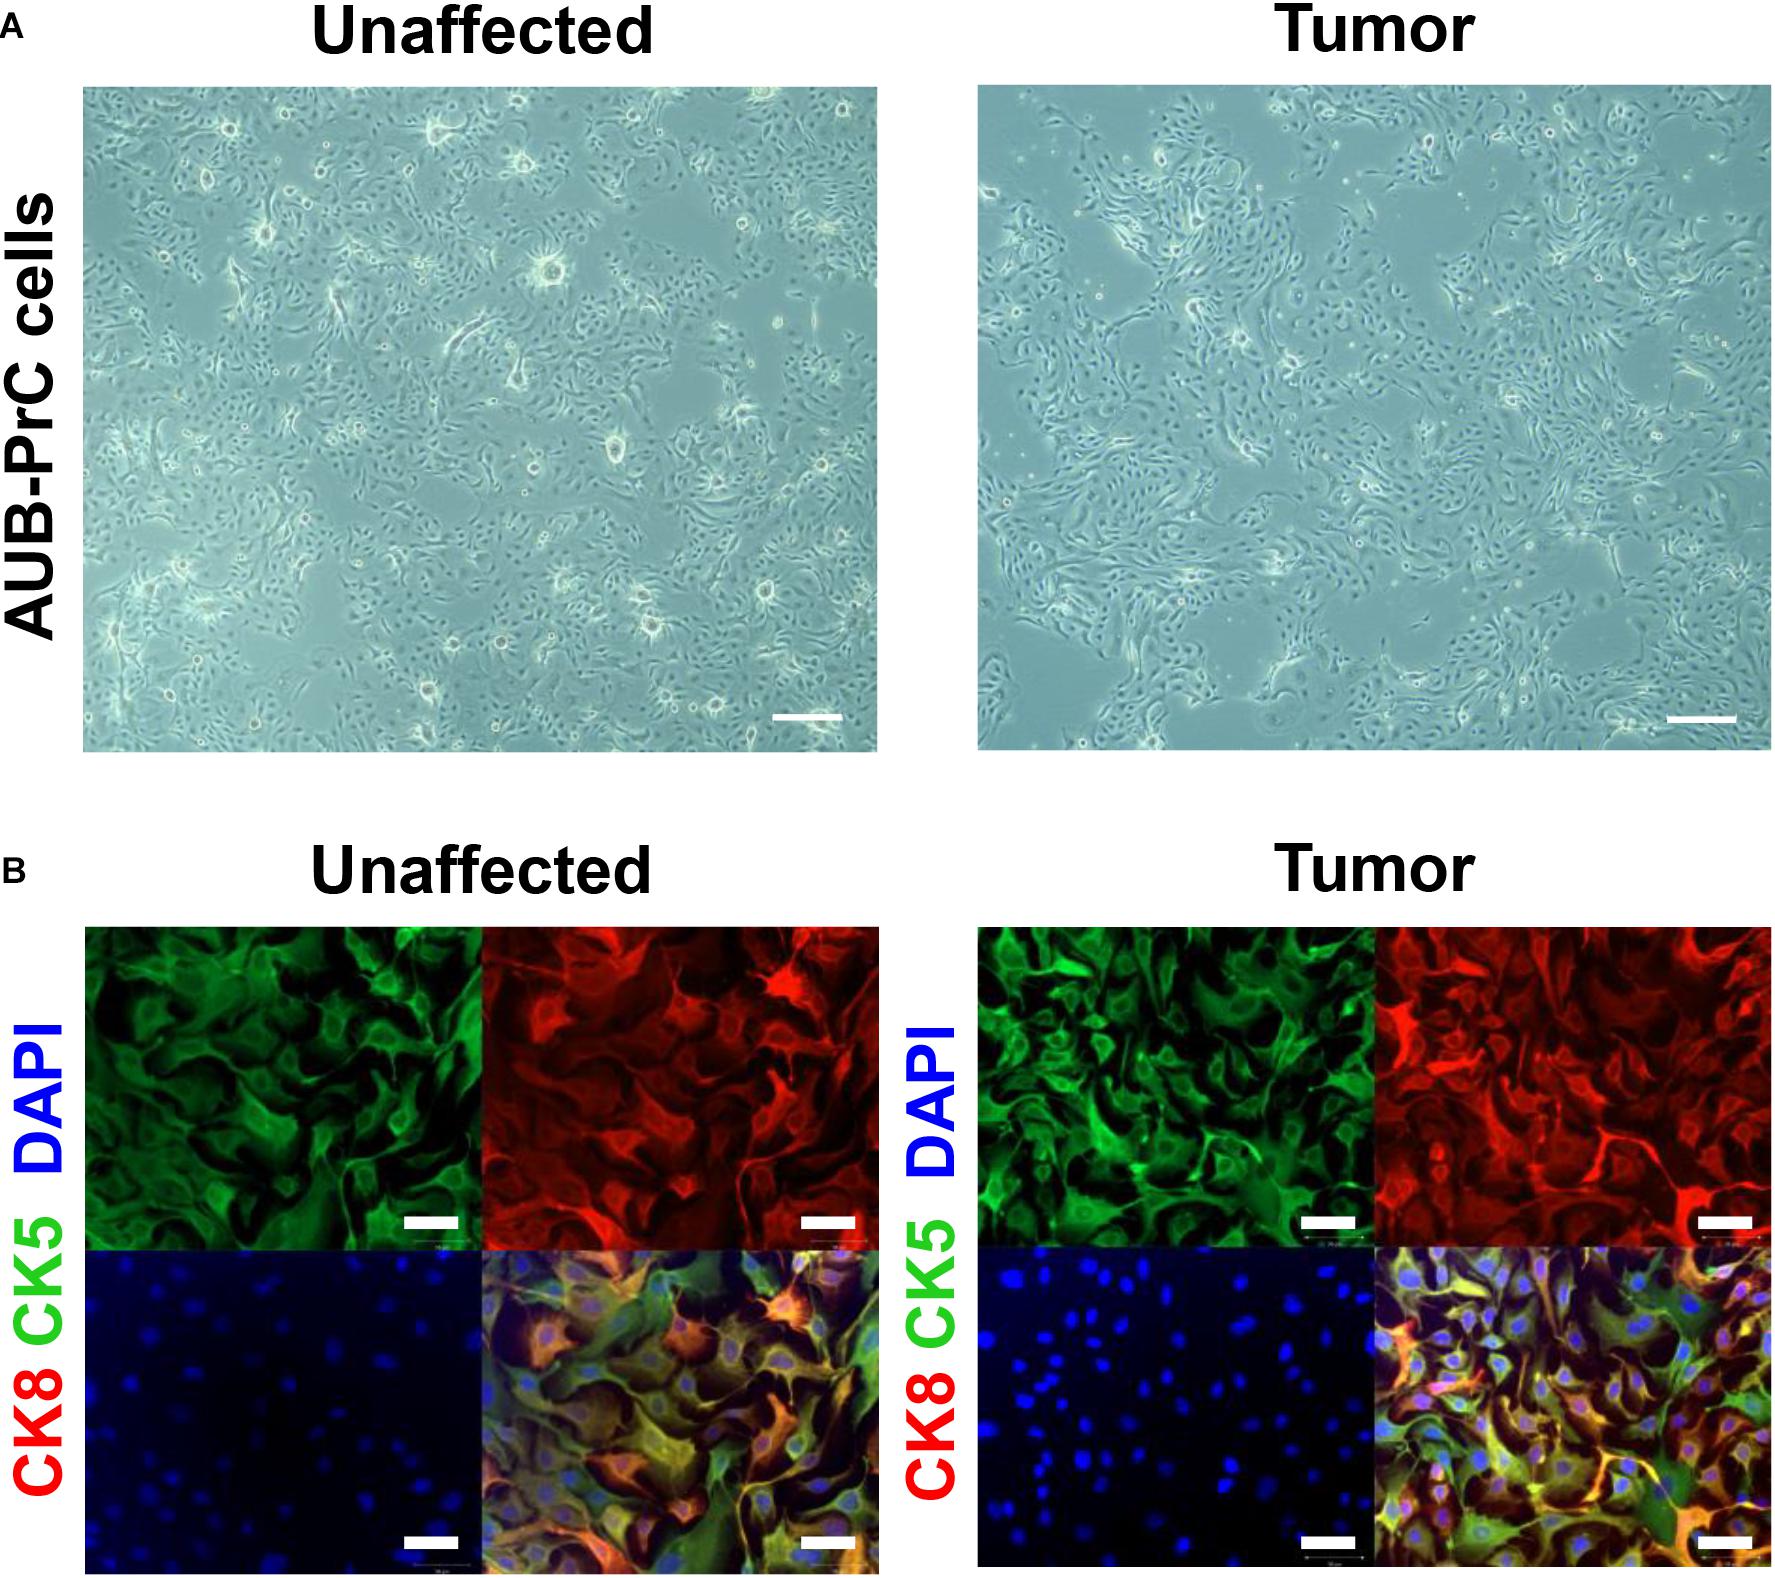
Figure 2. Morphologic and immunofluorescent epithelial lineage characterization of AUB-PrC cells. (A) Representative bright-field images of AUB-PrC cells from unaffected and tumor prostate patient samples {patient 1 with Grade Group 5 [Gleason Score 9(5 + 4)]; patient characteristics in Supplementary Table S1}, displaying key characteristics of epithelial cells and showing that when cells are far apart from each other, they form extensions that fill the gaps in vitro. Scale bar = 200 μm. (B) Representative immunofluorescence images of AUB-PrC cells from unaffected and tumor prostate patient samples {patient 3 with Grade Group 2 [Gleason Score 7(3 + 4)]; patient characteristics in Supplementary Table S1} stained for the lineage epithelial cell markers, CK8 (luminal epithelial cell marker) and CK5 (basal epithelial cell marker), and the nuclear counterstain DAPI illustrating CK8 + /CK5 + intermediate character. Scale bars = 50 μm.
Expression of Prostate Epithelial Lineage Genes in AUB-PrC Cells
Next, we sought to characterize the novel patient-derived cell lines with respect to specific primers relative to GAPDH, for experimental value n = 1, done in technical duplicates, using quantitative reverse transcription-PCR (qRT-PCR) analysis. We assessed mRNA expression levels of several genes including epithelial cell markers (CDH1 and CDH2), prostate luminal epithelial markers (CK8 and CK18), basal epithelial markers (NKX3.1 and P63), and other markers known to be aberrated in the prostate or maintain stemness (AR and CD44, respectively).
In our study, patient 1 showed significantly increased expression level of E-cadherin (CDH1) and decreased levels of N-cadherin (CDH2) (Figures 3A,B). Although patient 1 has high ISUP group 5, this does not exclude the possibility that the cancer cells still retain cell adhesion epithelial phenotype. This is consistent with the epithelial behavior of those cells which when grown apart from each other in culture tend to form extensions and fill the gaps in vitro, as mentioned previously. Also, we found significantly increased expression of the luminal epithelial cell markers (CK8 and CK18) in patient 2 AUB-PrC cells (Figures 3C,D). Besides, a pathway known to be central to prostate cells proliferation and survival (Song et al., 2009) was found to be dysregulated in the AUB-PrC cells from all three patients, depicting upregulation of NKX3.1 among those patients and down-regulation of AR in patient 2 AUB-PrC cells (Figures 3E,F). Stem cell markers, such as P63 (basal stem cell marker) and CD44 were found to be upregulated in AUB-PrC cells from patients 1 and 2 (Figures 3G,H). Notably, stem cell-expressing population of AUB-PrC cells may be responsible for the regenerative potential that allows these patient cells to be maintained in culture for many passages, especially cells derived from tumor samples. It is noteworthy mentioning that since patients might have different genetic backgrounds, it is expected to have them convey different gene expression profiles.
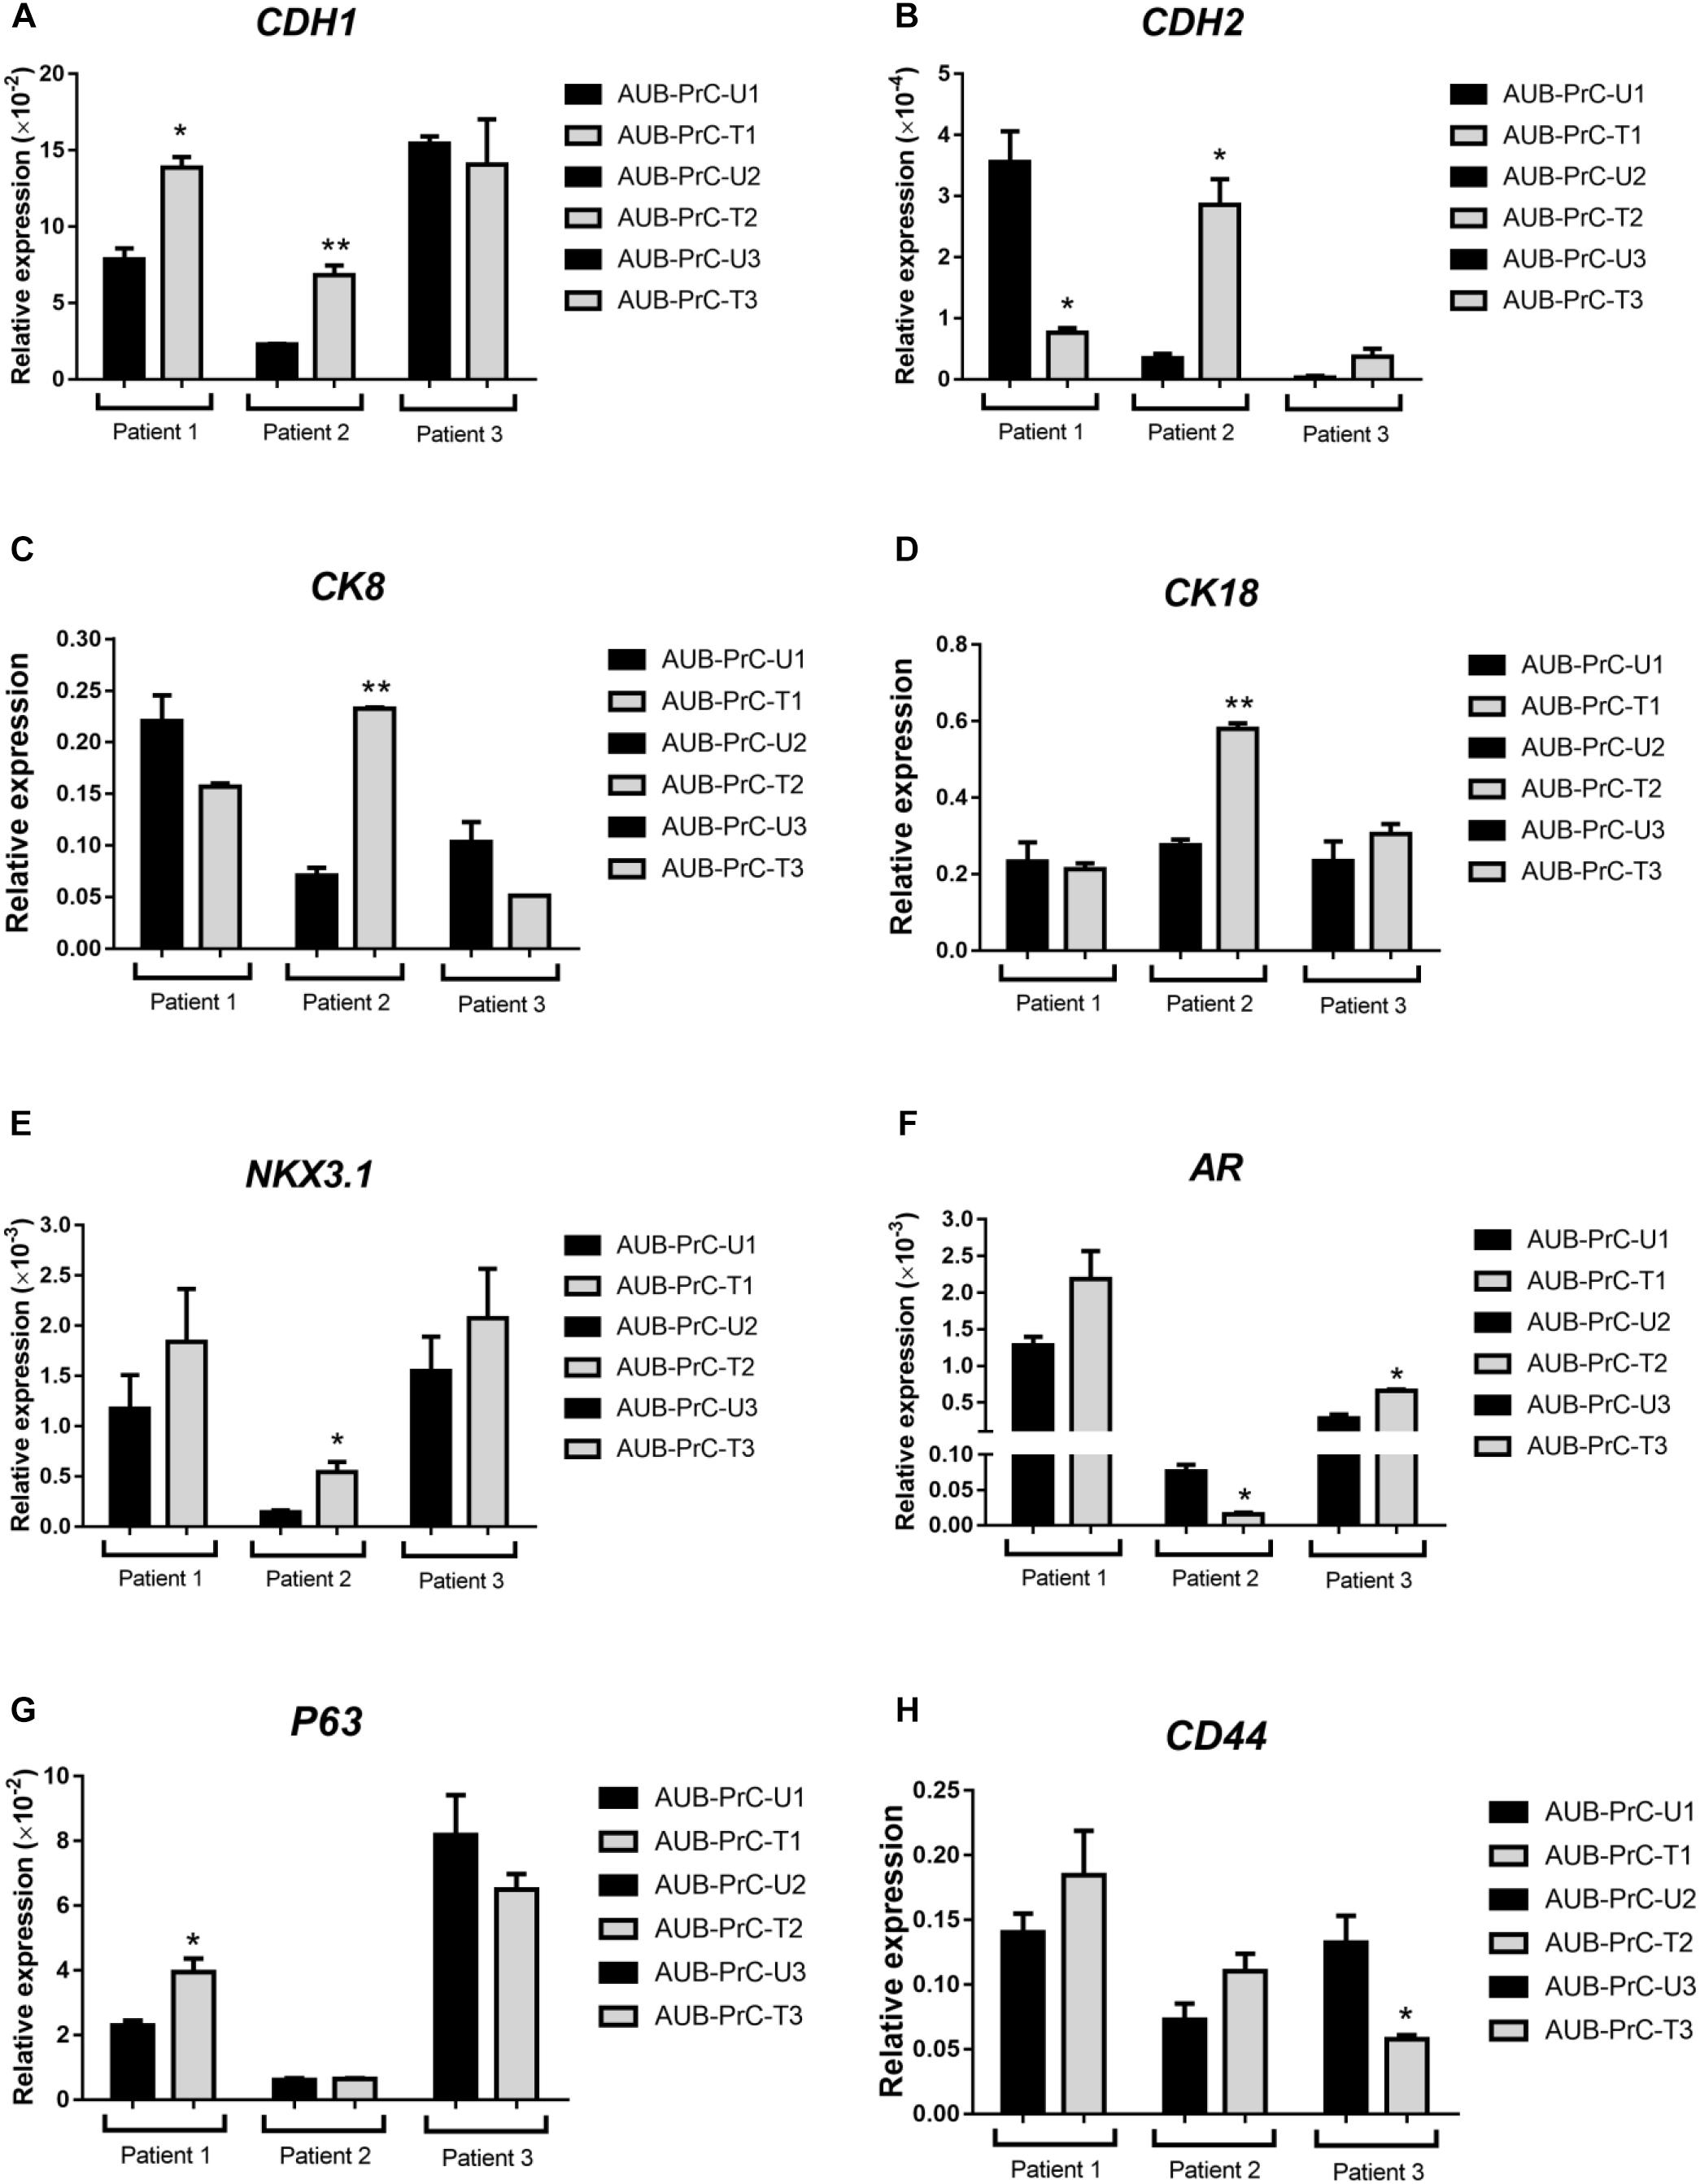
Figure 3. Expression of different prostate epithelial lineage and stem cell markers determined using qRT-PCR analysis. qRT-PCR expression analysis depicted aberrations in epithelial cell markers (A: CDH1 and B: CDH2), prostate luminal epithelial markers (C: CK8 and D: CK18), basal epithelial cell marker (E: NKX3.1), stem cell markers (G: P63 basal stem cell marker and H: CD44), and other markers know to aberrated in PCa (F: AR). For each patient {patient 1 with Grade Group 5 [Gleason Score 9(5 + 4)]; patient 2 with Grade Group 3 [Gleason Score 7(4 + 3)]; patient 3 with Grade Group 2 [Gleason Score 7(3 + 4)]; patients characteristics in Supplementary Table S1}, reactions were performed in biological duplicates and expressions of individual genes was normalized to the house keeping gene GAPDH. Data were plotted relative to the unaffected cells (AUB-PrC-U) for each patient. Relative expression value are presented as means + SD (two technical replicates) (*P <0.05; **P <0.01; by Student’s t-test).
Whole-Transcriptome Sequence Analysis of AUB-PrC Cells vs. Their Corresponding Tissues
We then sought to study transcriptomic features that signify AUB-PrC cells vs. their corresponding tissues in unaffected and tumor samples. We performed paired-end (100 base pair) RNA-sequencing using the Hi-Seq 2500 Illumina platform to delineate DEG features between patient-derived AUB-PrC cells and their corresponding tissue counterparts (two biological replicates – with technical duplicate for each – in each group).
Based on statistical significance using p-adj < 0.05 cut-off, we identified 3,383 and 4,250 transcripts that were significantly differentially expressed between the AUB-PrC cells vs. their corresponding tissue counterparts in each of the unaffected and tumor samples, respectively (722 up-regulated and 2,661 down-regulated in unaffected samples and 1,092 up-regulated and 3,158 down-regulated in tumor samples; Supplementary Tables S5, S6). The volcano plots in Figures 4A,B represent an overview of DEGs with a threshold set at p-adj < 0.05. The DEG expression heatmaps for unaffected and tumor samples are presented in Figures 4C,D, and interestingly the venn diagram identified DEG that are uniquely expressed in the Unaffected samples (543) vs. the tumor samples (1410) (Figure 4E and Supplementary Table S7).
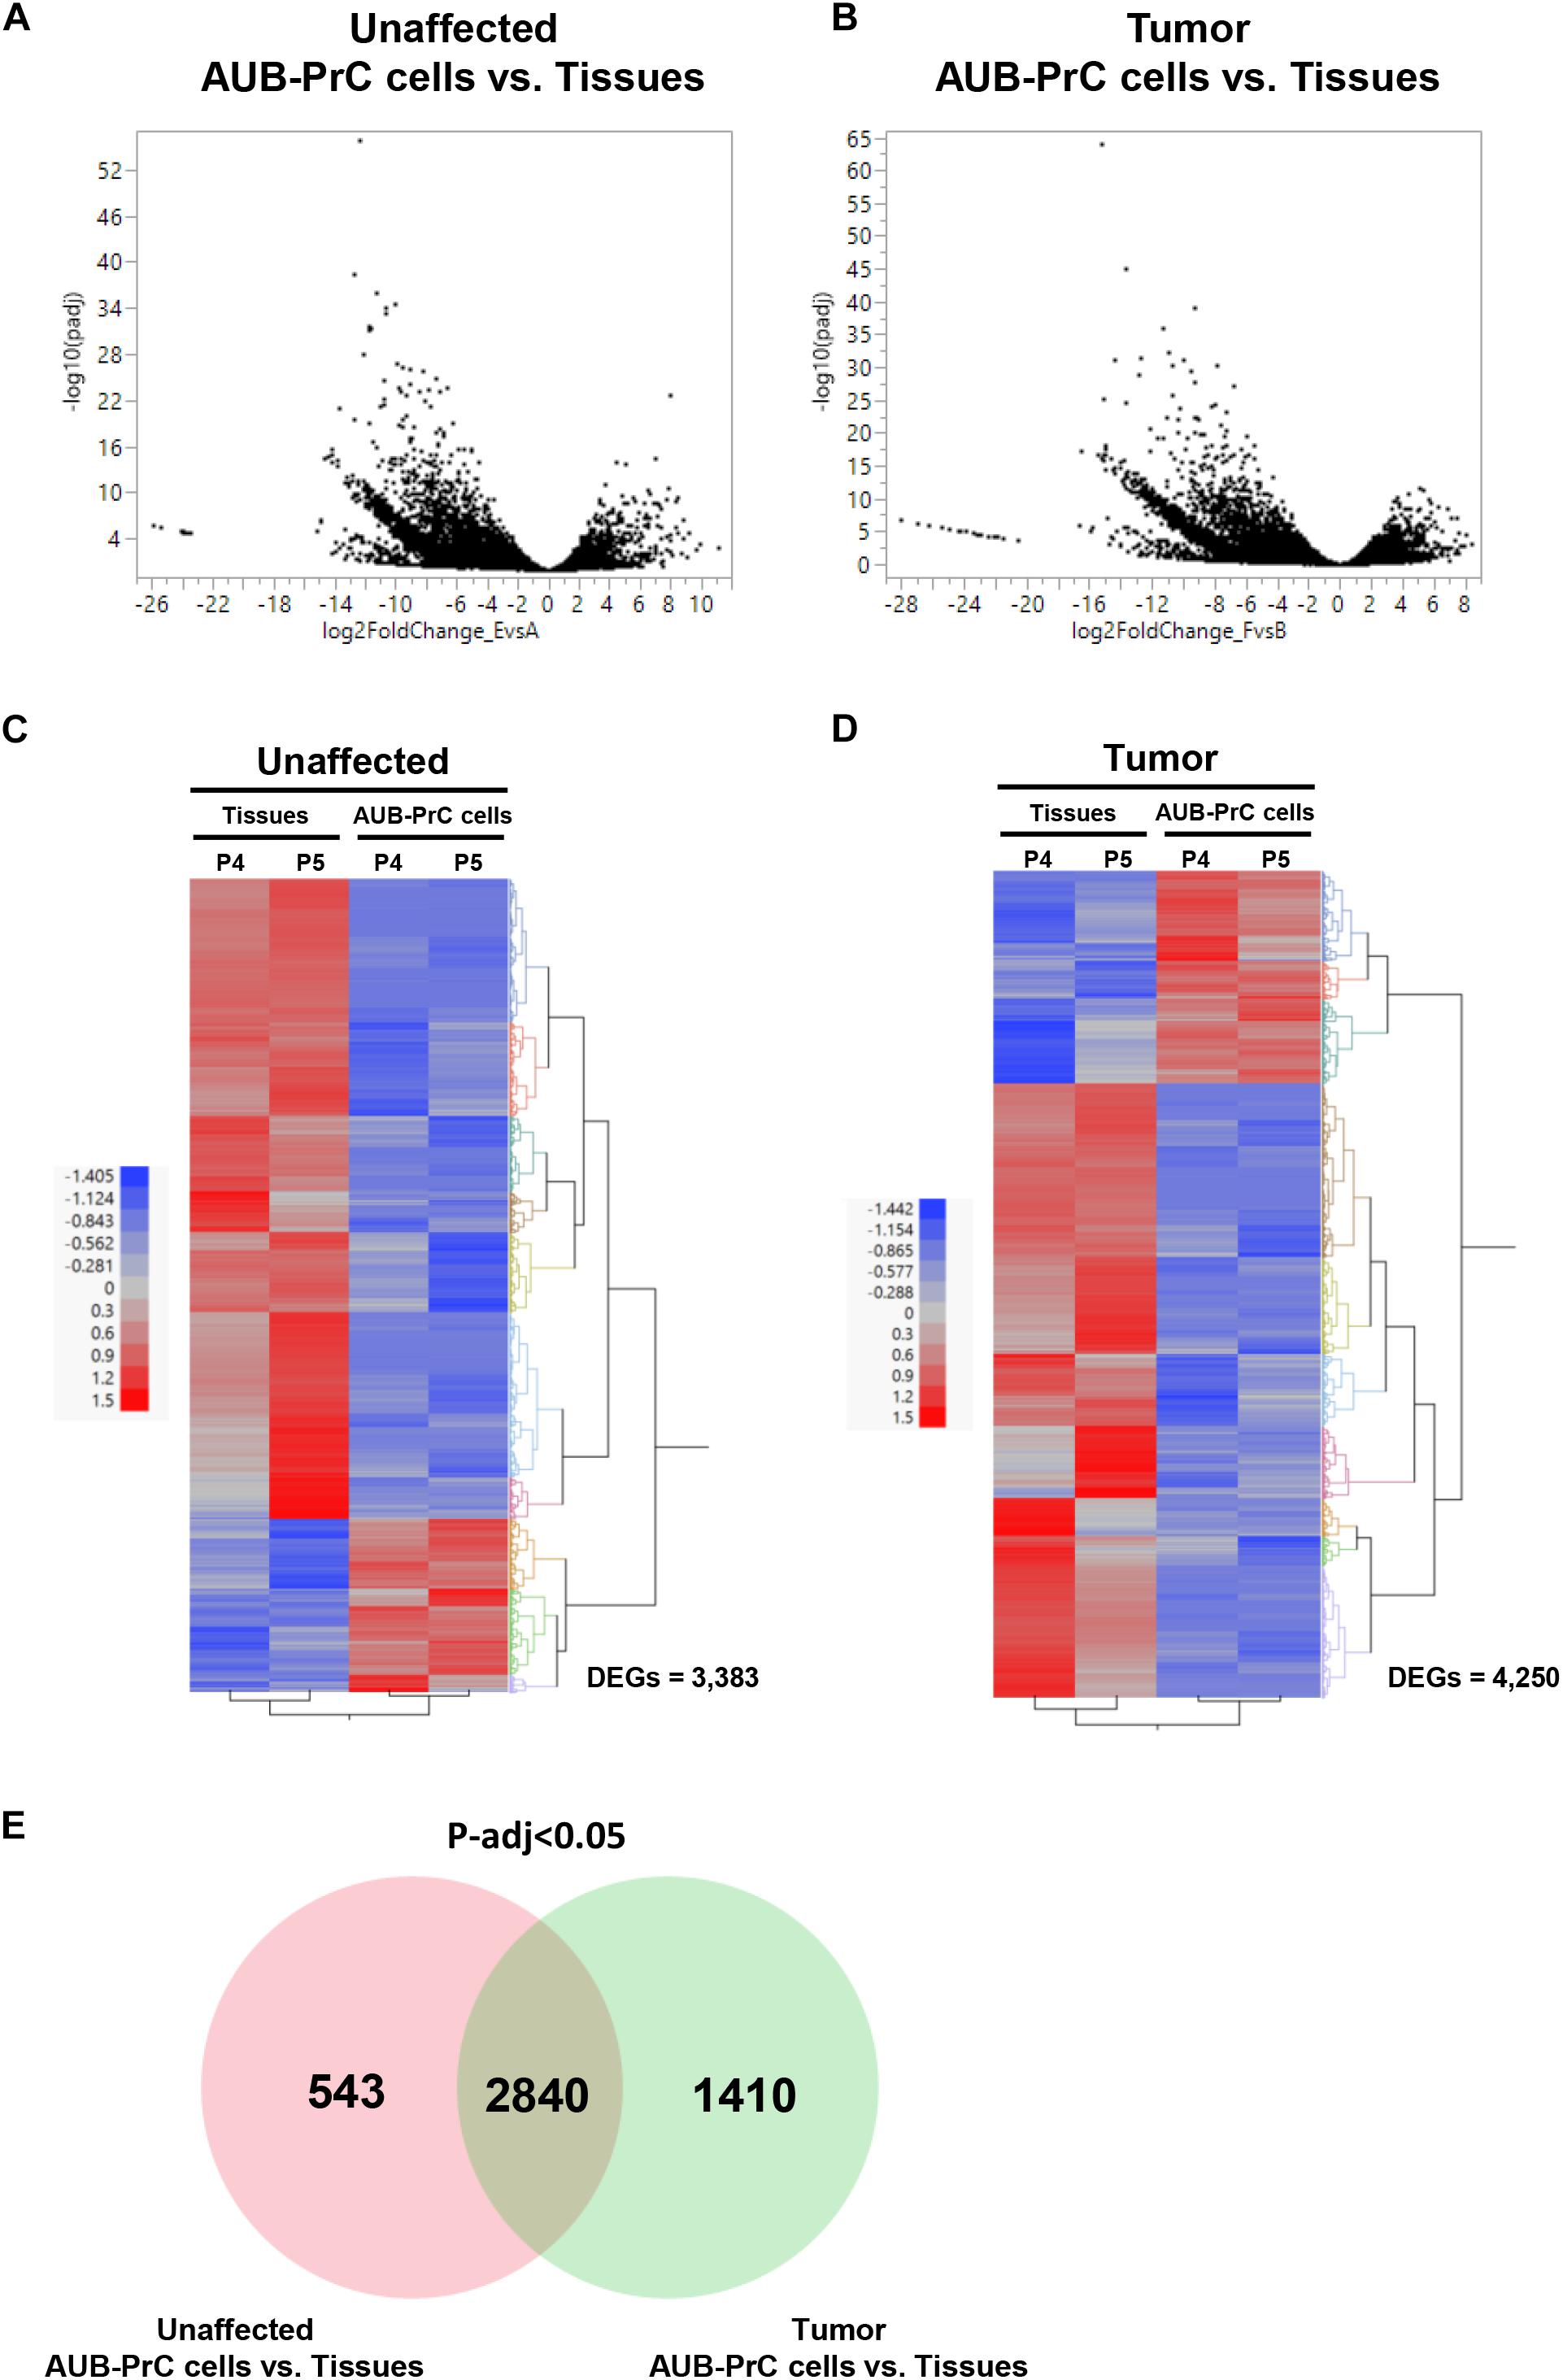
Figure 4. RNA-sequencing of patient-derived AUB-PrC cells relative to their corresponding tissues in unaffected and tumor samples. RNA-Seq was performed using the Hi-Seq 2500 Illumina platform to delineate the differentially expressed genes (DEG) as described in “Materials and Methods” section. Volcano plots (A,B) and Venn diagram (E) demonstrating an overview of the DEGs. The threshold was set at p-adjusted < 0.05. Differentially expressed transcripts (n = 3,383 and 4,250 in unaffected and tumor samples) between AUB-PrC cells and tissue counterparts {two biological replicates and two technical duplicates in each group; patient 4 with Grade Group 1 [Gleason Score 6(3 + 3)] and patient 5 with Grade Group 3 [Gleason Score 7(4 + 3)]; patients characteristics in Supplementary Table S1} were identified using statistical criteria detailed in “Materials and Methods” section. (C,D) Heatmaps and the hierarchical cluster analyses of the differentially expressed genes for unaffected (C) and tumor (D) samples. Red represents the upregulated genes and blue represents the downregulated genes.
GO Term Analysis Venn Diagram
Gene Ontology (GO) analysis of the DEGs lists [unique genes in unaffected AUB-PrC cells vs. tissue [543 DEGs], unique genes in tumor AUB-PrC cells vs. tissue (1410 DEGs), and common genes between unaffected and tumor (2840 DEGs)] isolated based on the venn diagram were further analyzed via DAVID platform (Huang Da et al., 2009). Focusing solely on biological processes with a cutoff of p < 0.05, several terms were identified. In the unaffected AUB-PrC cells vs. tissue, there were 41 terms (Supplementary Table S8) showing top five significant enrichments of GO:0043065∼positive regulation of apoptotic process (16 genes), GO:0001755∼neural crest cell migration (6 genes), GO:0045746∼negative regulation of Notch signaling pathway (5 genes), GO:2000379∼positive regulation of reactive oxygen species metabolic process (5 genes), and GO:0090074∼negative regulation of protein homodimerization activity (3 genes) (Figure 5—top panel). In the tumor AUB-PrC cells vs. tissue, there were 58 term (Supplementary Table S9) showing top 5 significant enrichments GO:0006887∼exocytosis (14 genes), GO:0045909∼positive regulation of vasodilation (8 genes), GO:0051090∼regulation of sequence-specific DNA binding transcription factor activity (7 genes), GO:0001525∼angiogenesis (25 genes), and GO:0019233∼sensory perception of pain (10 genes) (Figure 5—middle panel). Whereas common genes shared between both DEGs list consisted of 414 terms (Supplementary Table S10) that included top 5 significant enrichments of GO:0007155∼cell adhesion (158 genes), GO:0030198∼extracellular matrix organization (83 genes), GO:0007165∼signal transduction (249 genes), GO:0006954∼inflammatory response (109 genes), and GO:0006955∼immune response (109 genes) (Figure 5—lower panel).
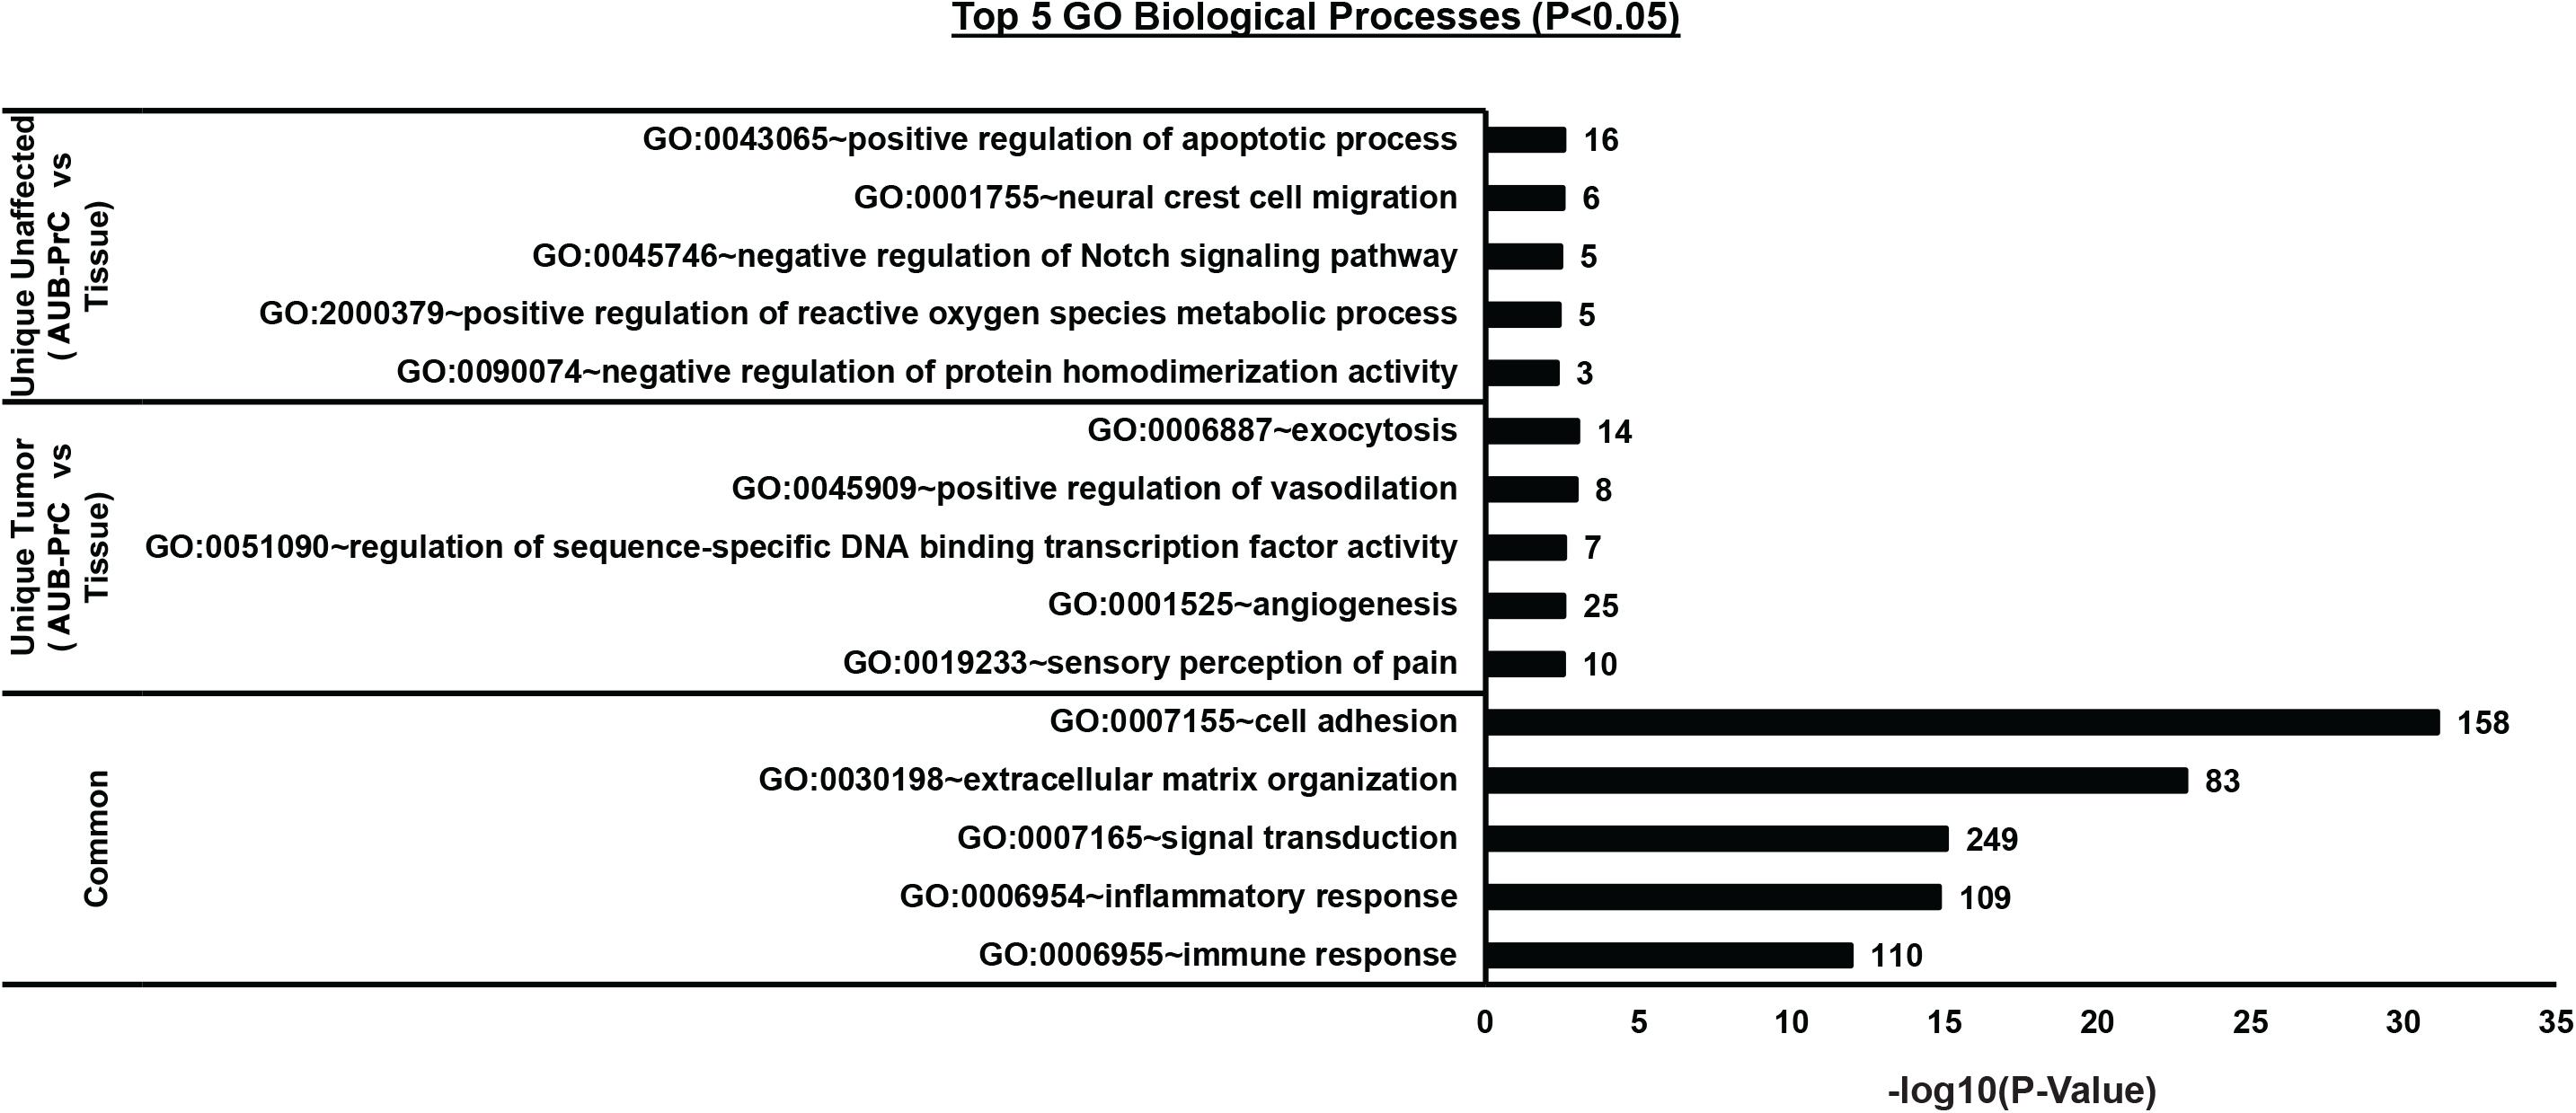
Figure 5. Biological processes Gene Ontology (GO) analysis of the DEGs lists between AUB-PrC cells vs. tissue in unaffected and tumor samples. [Unique genes in unaffected AUB-PrC cells vs. tissue (543 DEGs), unique genes in tumor AUB-PrC cells vs. tissue (1410 DEGs), and common genes between unaffected and tumor (2840 DEGs)] were isolated based on the Venn diagram and further analyzed via DAVID platform (Huang Da et al., 2009) to identify the top 5 GO biological processes.
AUB-PrC Cells Demonstrate Upregulation of Prostate Epithelial Lineage mRNA Expression
DEGs genes that characterize prostate basal, luminal, and intermediate epithelia (Wang et al., 2001) along with other genes known to be aberrated in prostate tissue and cancer and growth factors genes were found to be dysregulated in AUB-PrC cells vs. tissues in unaffected and tumor samples (Table 1).
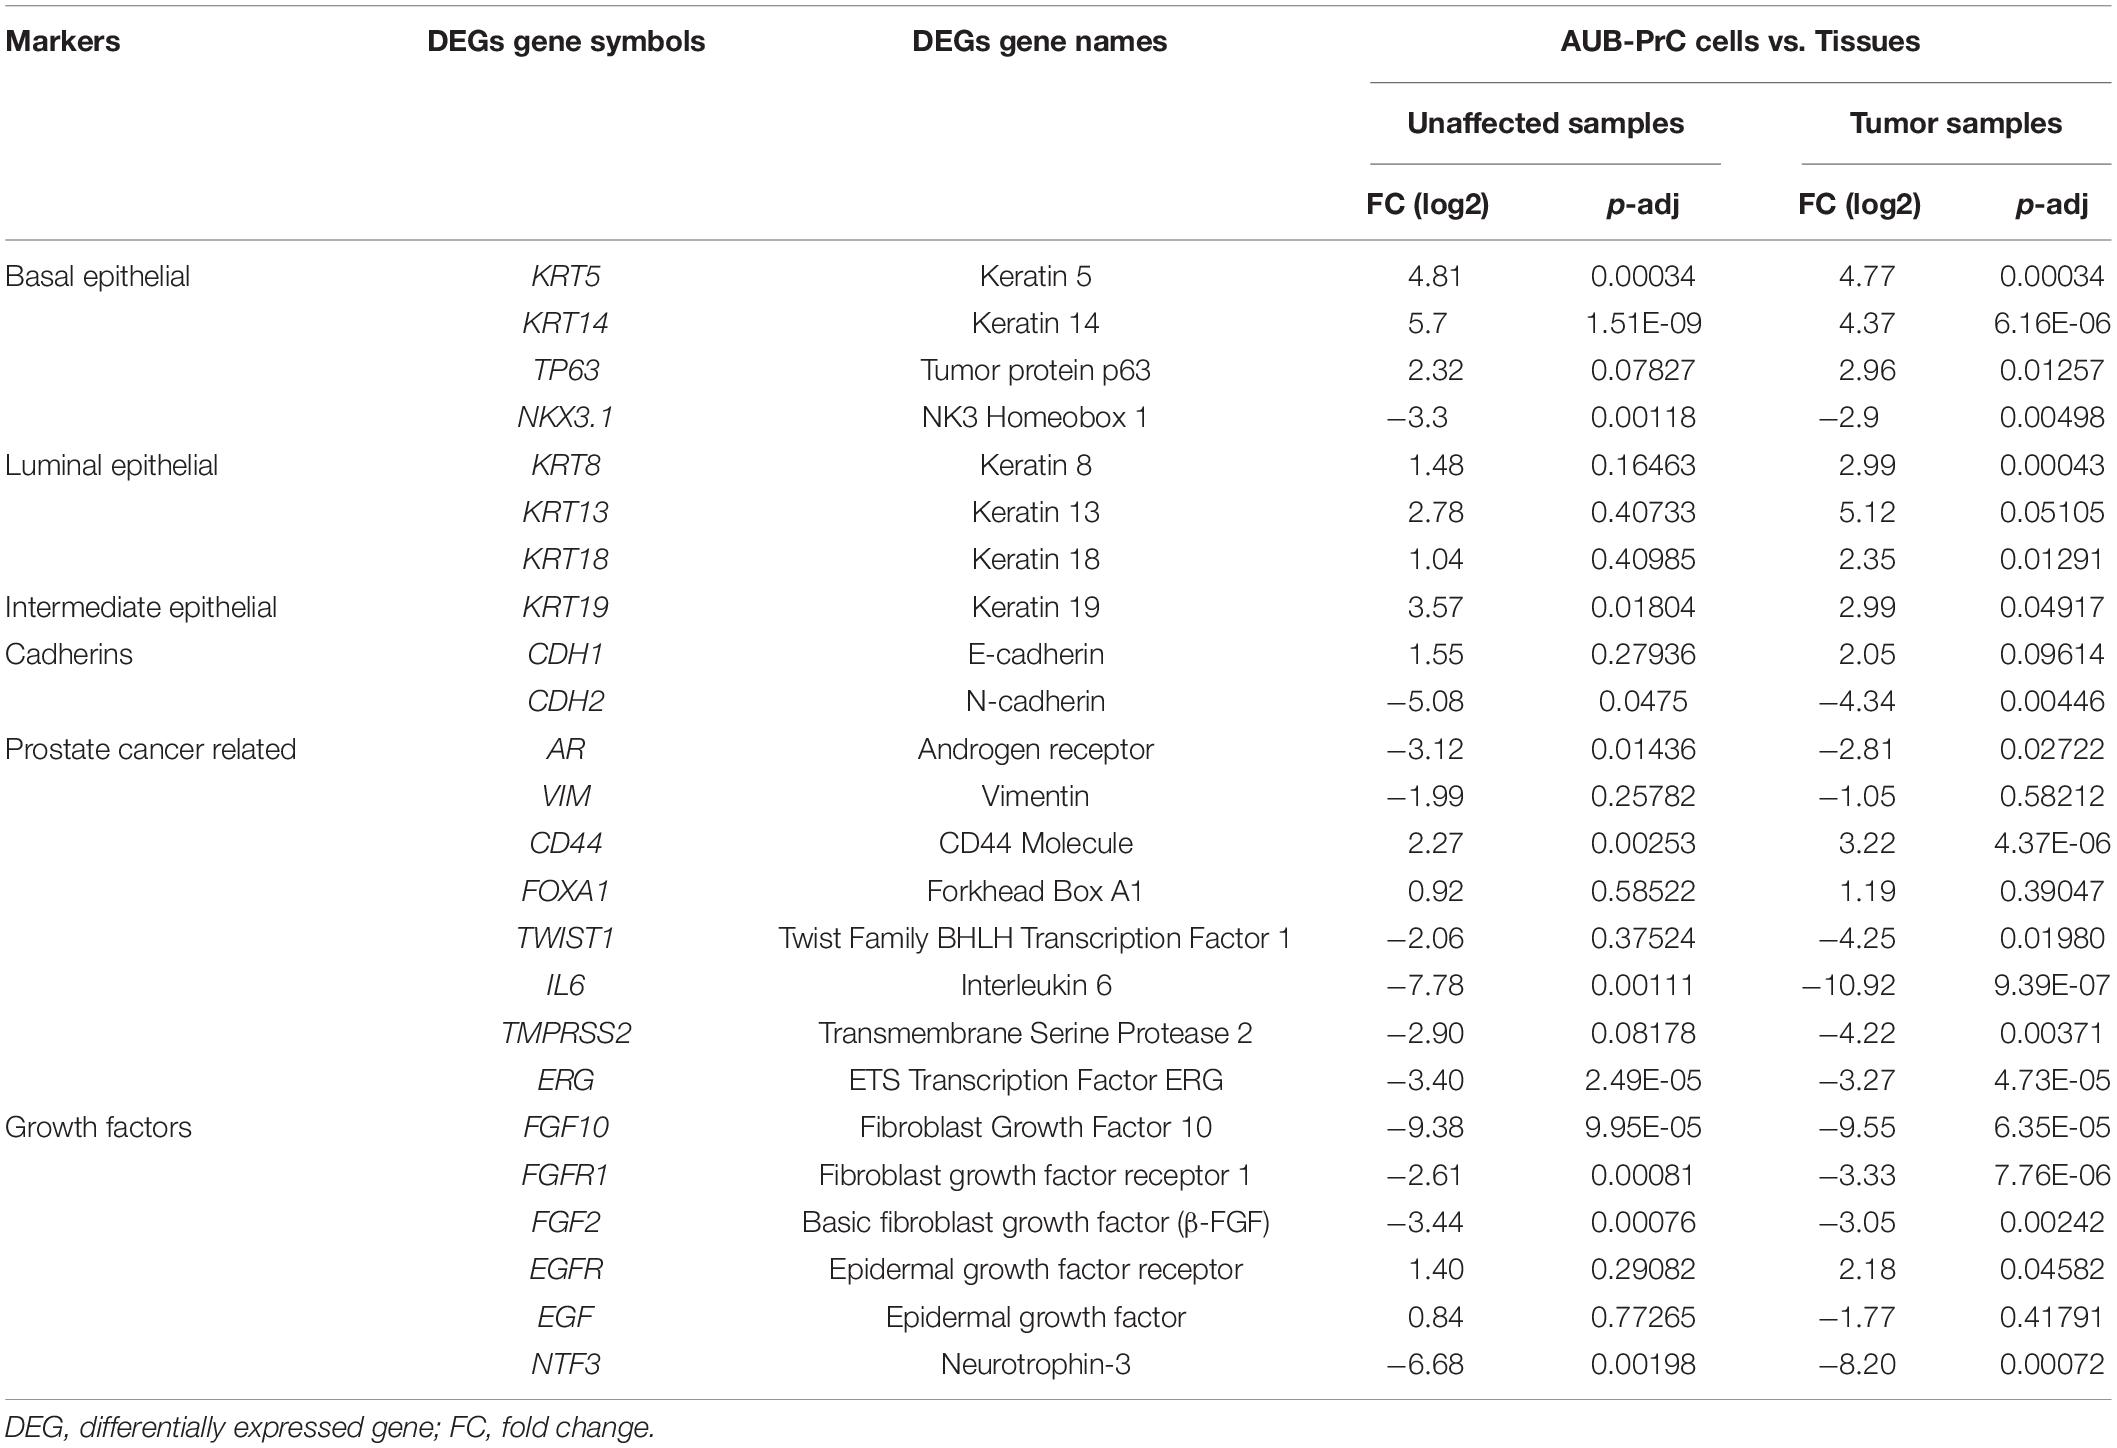
Table 1. List of DEGs genes commonly representing prostate lineage markers and other markers related to prostate diseases along with their expression levels in AUB-PrC cells relative to their corresponding tissue counterparts in unaffected and tumor samples.
Next, we pursued to confirm some of the gene features that were identified by the RNA-Seq analysis to be differentially expressed in AUB-PrC cells relative to their corresponding tissue counterparts. RNA-Seq analysis had revealed the upregulation of the prostate luminal epithelial lineage marker CK8 and basal stem cell marker P63 in AUB-PrC cells compared to their tissue counterparts (Table 1). It also showed the downregulation of other genes, such as AR, VIM, and TWIST1 in those cells. Consistent with the RNA-Seq results, quantitative real-time PCR analysis of AUB-PrC cells from patient 5 and its tissue counterparts (three technical replicates each) showed upregulation of CK8 and P63 genes in AUB-PrC cells compared to their tissue counterparts (Supplementary Figure S3A, upper panels) and downregulation of AR, VIM, and TWIST1 (Supplementary Figure S3A, lower panels). Molecular characterization was also performed on AUB-PrC cells and tissue sections from patients 4 and 5 on which RNA-Seq analysis was done. Immunofluorescent staining showed evidence of high CK8 + and CK5 + expression among cells and their counterpart tissues, with low expression of VIM+ (Supplementary Figure S3B). Results are consistent with the RNA-Seq results showing upregulation of CK8 and CK5 genes and downregulation of VIM (Table 1).
GSEA Identifies Enrichment of Growth Factor and Epithelial Lineage-Related Signaling Pathways in AUB-PrC Cells Relative to Their Tissue Counterparts
We sought to build enrichment maps to evaluate DEGs and their related pathways in our datasets (Figure 6 and Supplementary Tables S11, S12) using Cytoscape 3.7.2 software (EnrichmentMap tool). Using gene set enrichment analysis (GSEA), we identified significantly altered pathways in AUB-PrC cells relative to their corresponding tissue counterparts (Supplementary Tables S13, S14). Results indicated significant differences (FDR < 0.01, NOM p < 0.05) in the enrichment of the gene sets database (Human_GOBP_AllPathways_no_GO_iea_April_01_2020_ symbol.gmt; Supplementary Table S4). We selected the 20 most significantly enriched signaling pathways, based on normalized enrichment score (NES) (Supplementary Figures S4, S5). Results indicated the unaffected data set was enriched for cell cycle pathways, E2F signaling, TP53 transcriptional regulation, Rb signaling, mitosis, and epithelial differentiation pathways while the treated data set was enriched for cell cycle pathways, PLK1 signaling, DNA irradiation damage and cellular response via ATR, and epithelial differentiation pathways. Other pathways that are found to be enriched in AUB-PrC cells and are of specific interest in prostate diseases include cell adhesion molecules (CAMs), cholesterol biosynthesis and metabolism pathways, ErbB-2 signaling, c-Myc pathway, and other cancer pathways which can be further explored in future work to look for novel potential therapeutic targets for PCa.
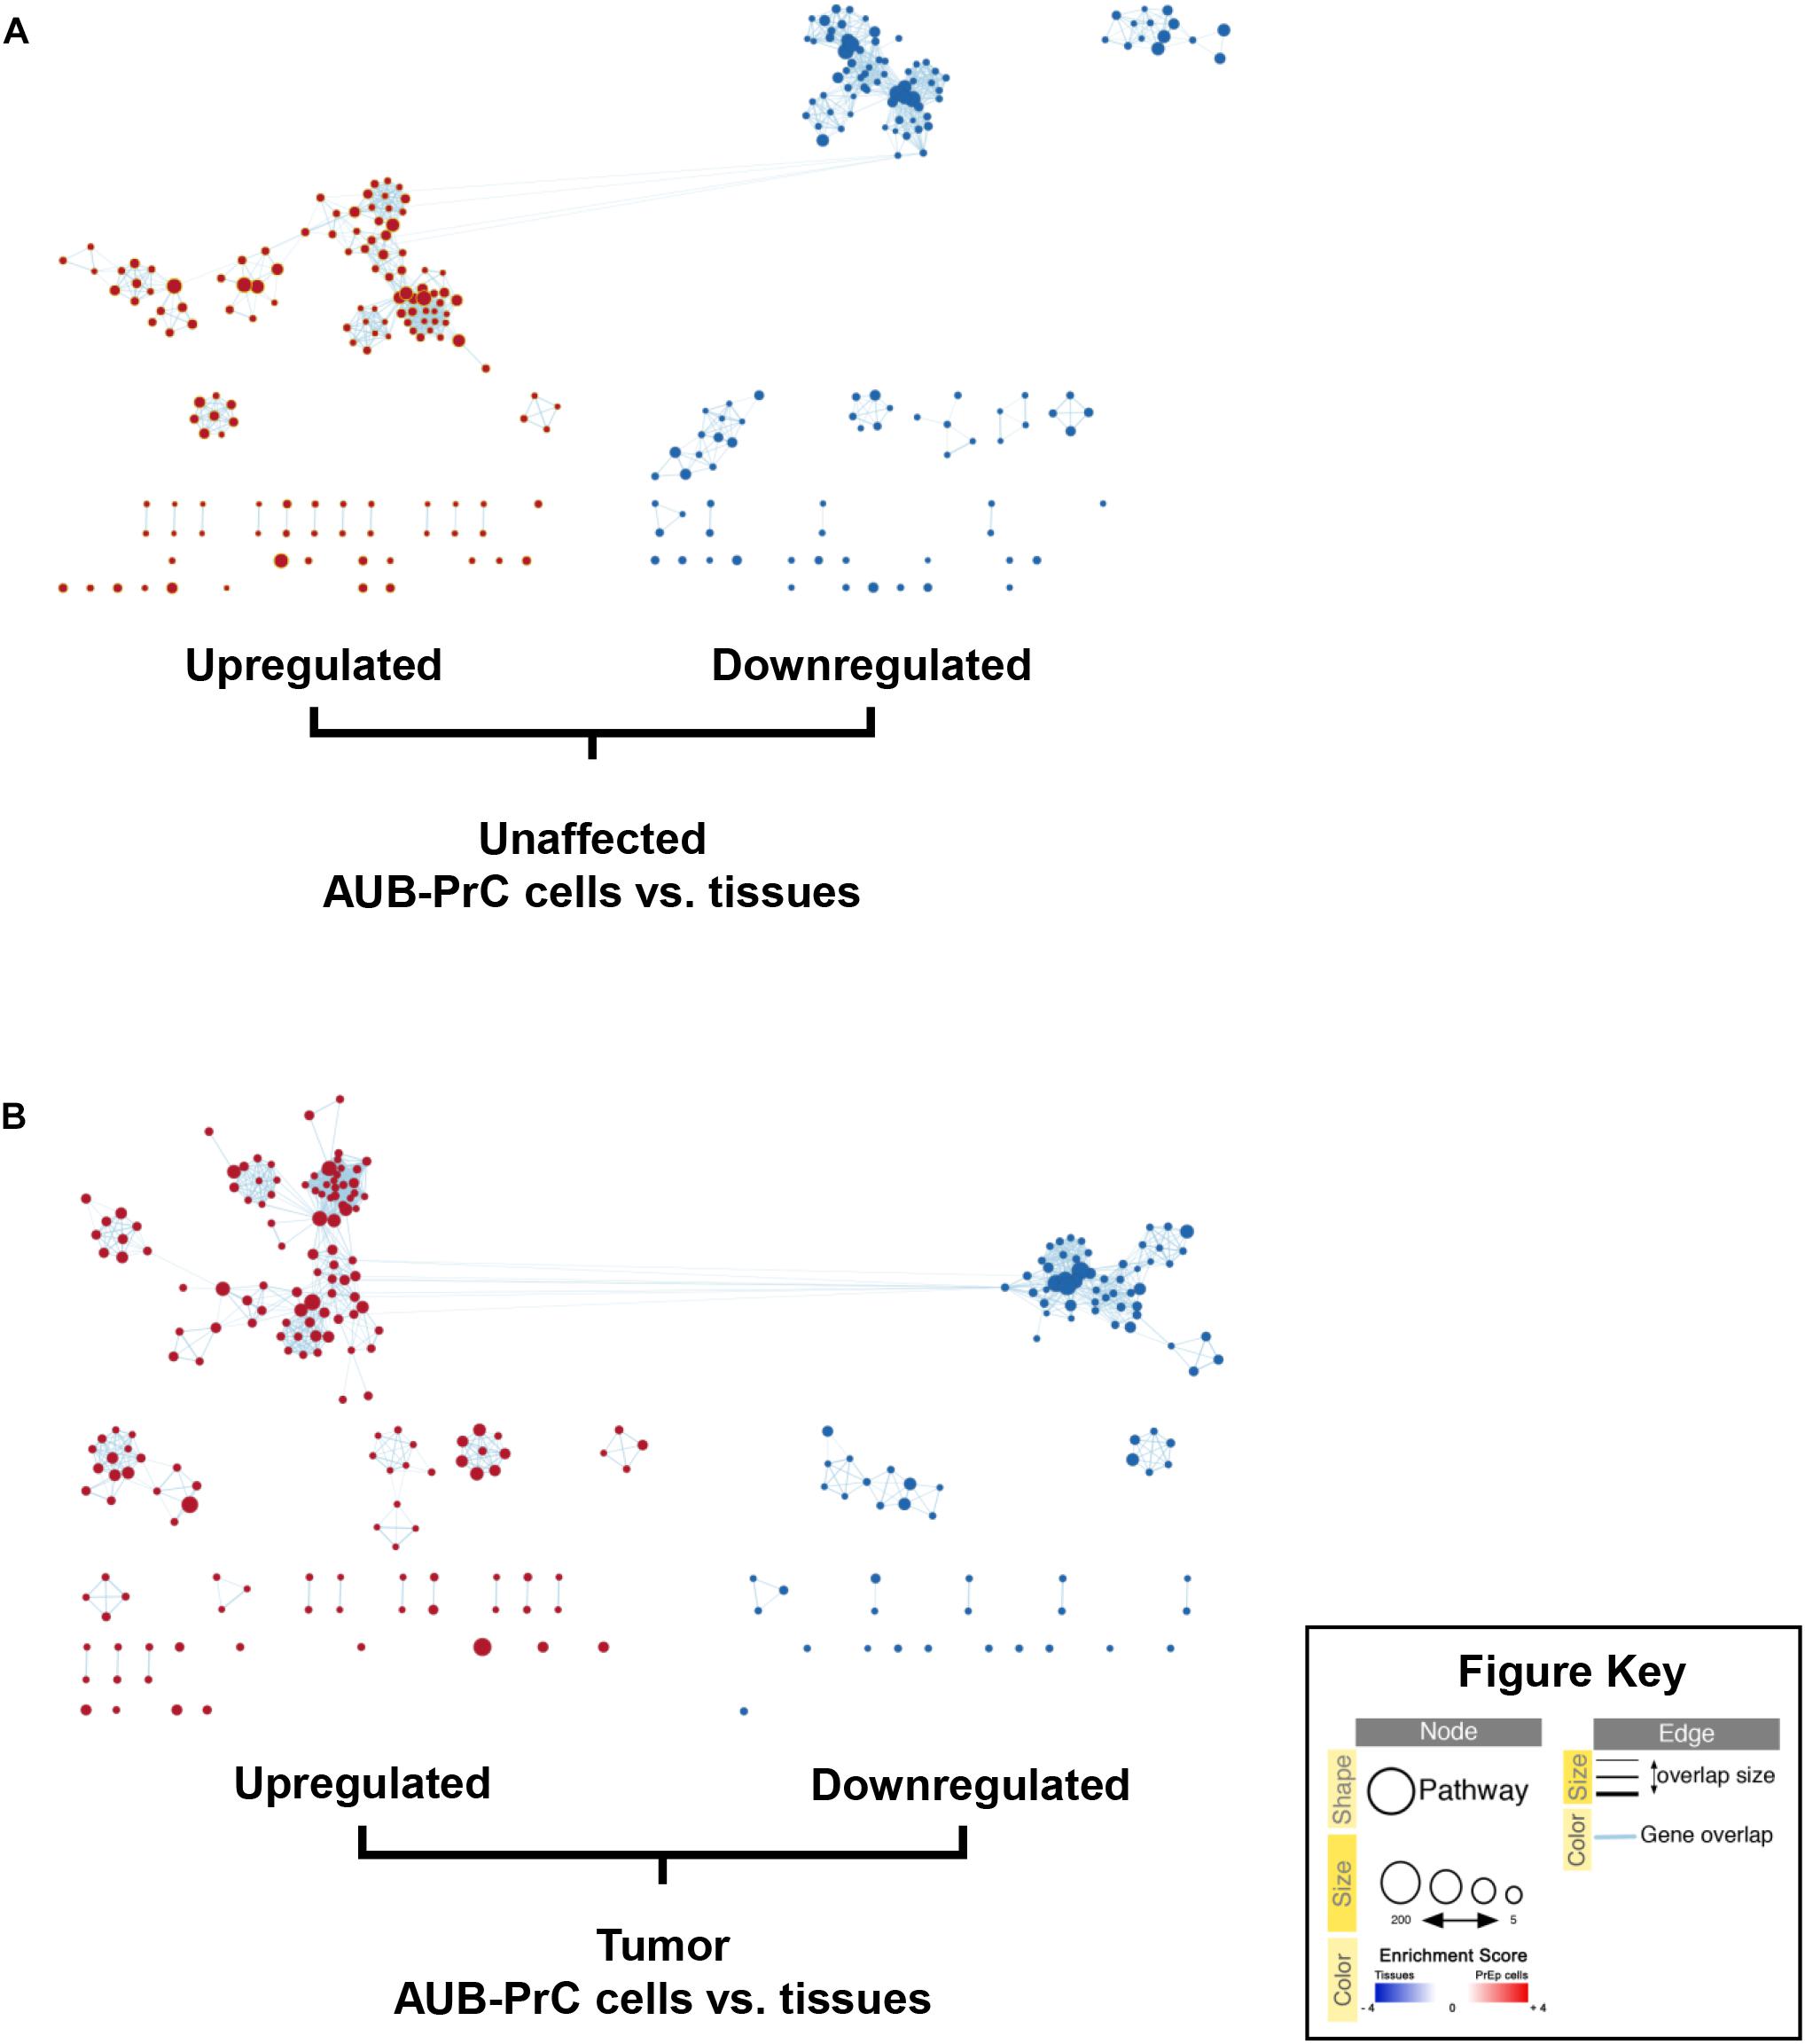
Figure 6. Enrichment maps of pathways enriched in upregulated genes (red) and downregulated genes (blue) in AUB-PrC cells vs. tissues. Enrichment maps of pathways among prostate unaffected (A) and tumor (B) samples were built using EnrichmentMap analysis on Cytoscape 3.7.2 software. Each node (circle) represents a distinct pathway (red representing upregulated pathways and blue representing downregulated pathways), and edges (lines) represent the number of genes overlapping between two pathways, determined using the similarity coefficient.
EGF Is Essential to Grow Patient-Derived AUB-PrC Cells in Culture
Based on an observation made during the organoids’ optimization experiment (Cheaito et al., under review), we noticed that EGF withdrawal from the medium affected the ability to derive AUB-PrC cells negatively (data not shown). So, we further investigated the importance of EGF for the growth of AUB-PrC cells by growing them under 3 conditions; condition 1 includes prostate organoids growth medium (as described in Supplementary Table S2), condition 2 includes prostate organoids growth medium without EGF, and condition 3 includes adDMEM/F12 with EGF only (10 ng/mL) (Figure 7A). AUB-PrC cells derived from tissue samples from 3 different patients (Patients 5, 6, and 7), including the unaffected and the tumor sample, were seeded under the three different conditions. MTT and Trypan Blue assays were performed showing, a significant reduction in cell viability and cell proliferation when EGF was removed from the medium, while EGF alone demonstrated the ability to maintain the growth of AUB-PrC cells. Indeed, there was no significant difference in both cell proliferation and cell viability between condition 1 and condition 3 for all three patients’ derived AUB-PrC cells (Figures 7B,C). To further confirm that condition 3 “EGF alone” can support the growth of both luminal and epithelial cells, AUB-PrC cells growing under 3 conditions described above were immunostained with luminal marker CK8 and basal marker CK14. The results obtained showed similar morphologies and expression patterns of luminal and basal markers in both condition 1 and condition 3, which confirms that EGF alone can substitute the cocktail of 12 components included in condition 1.
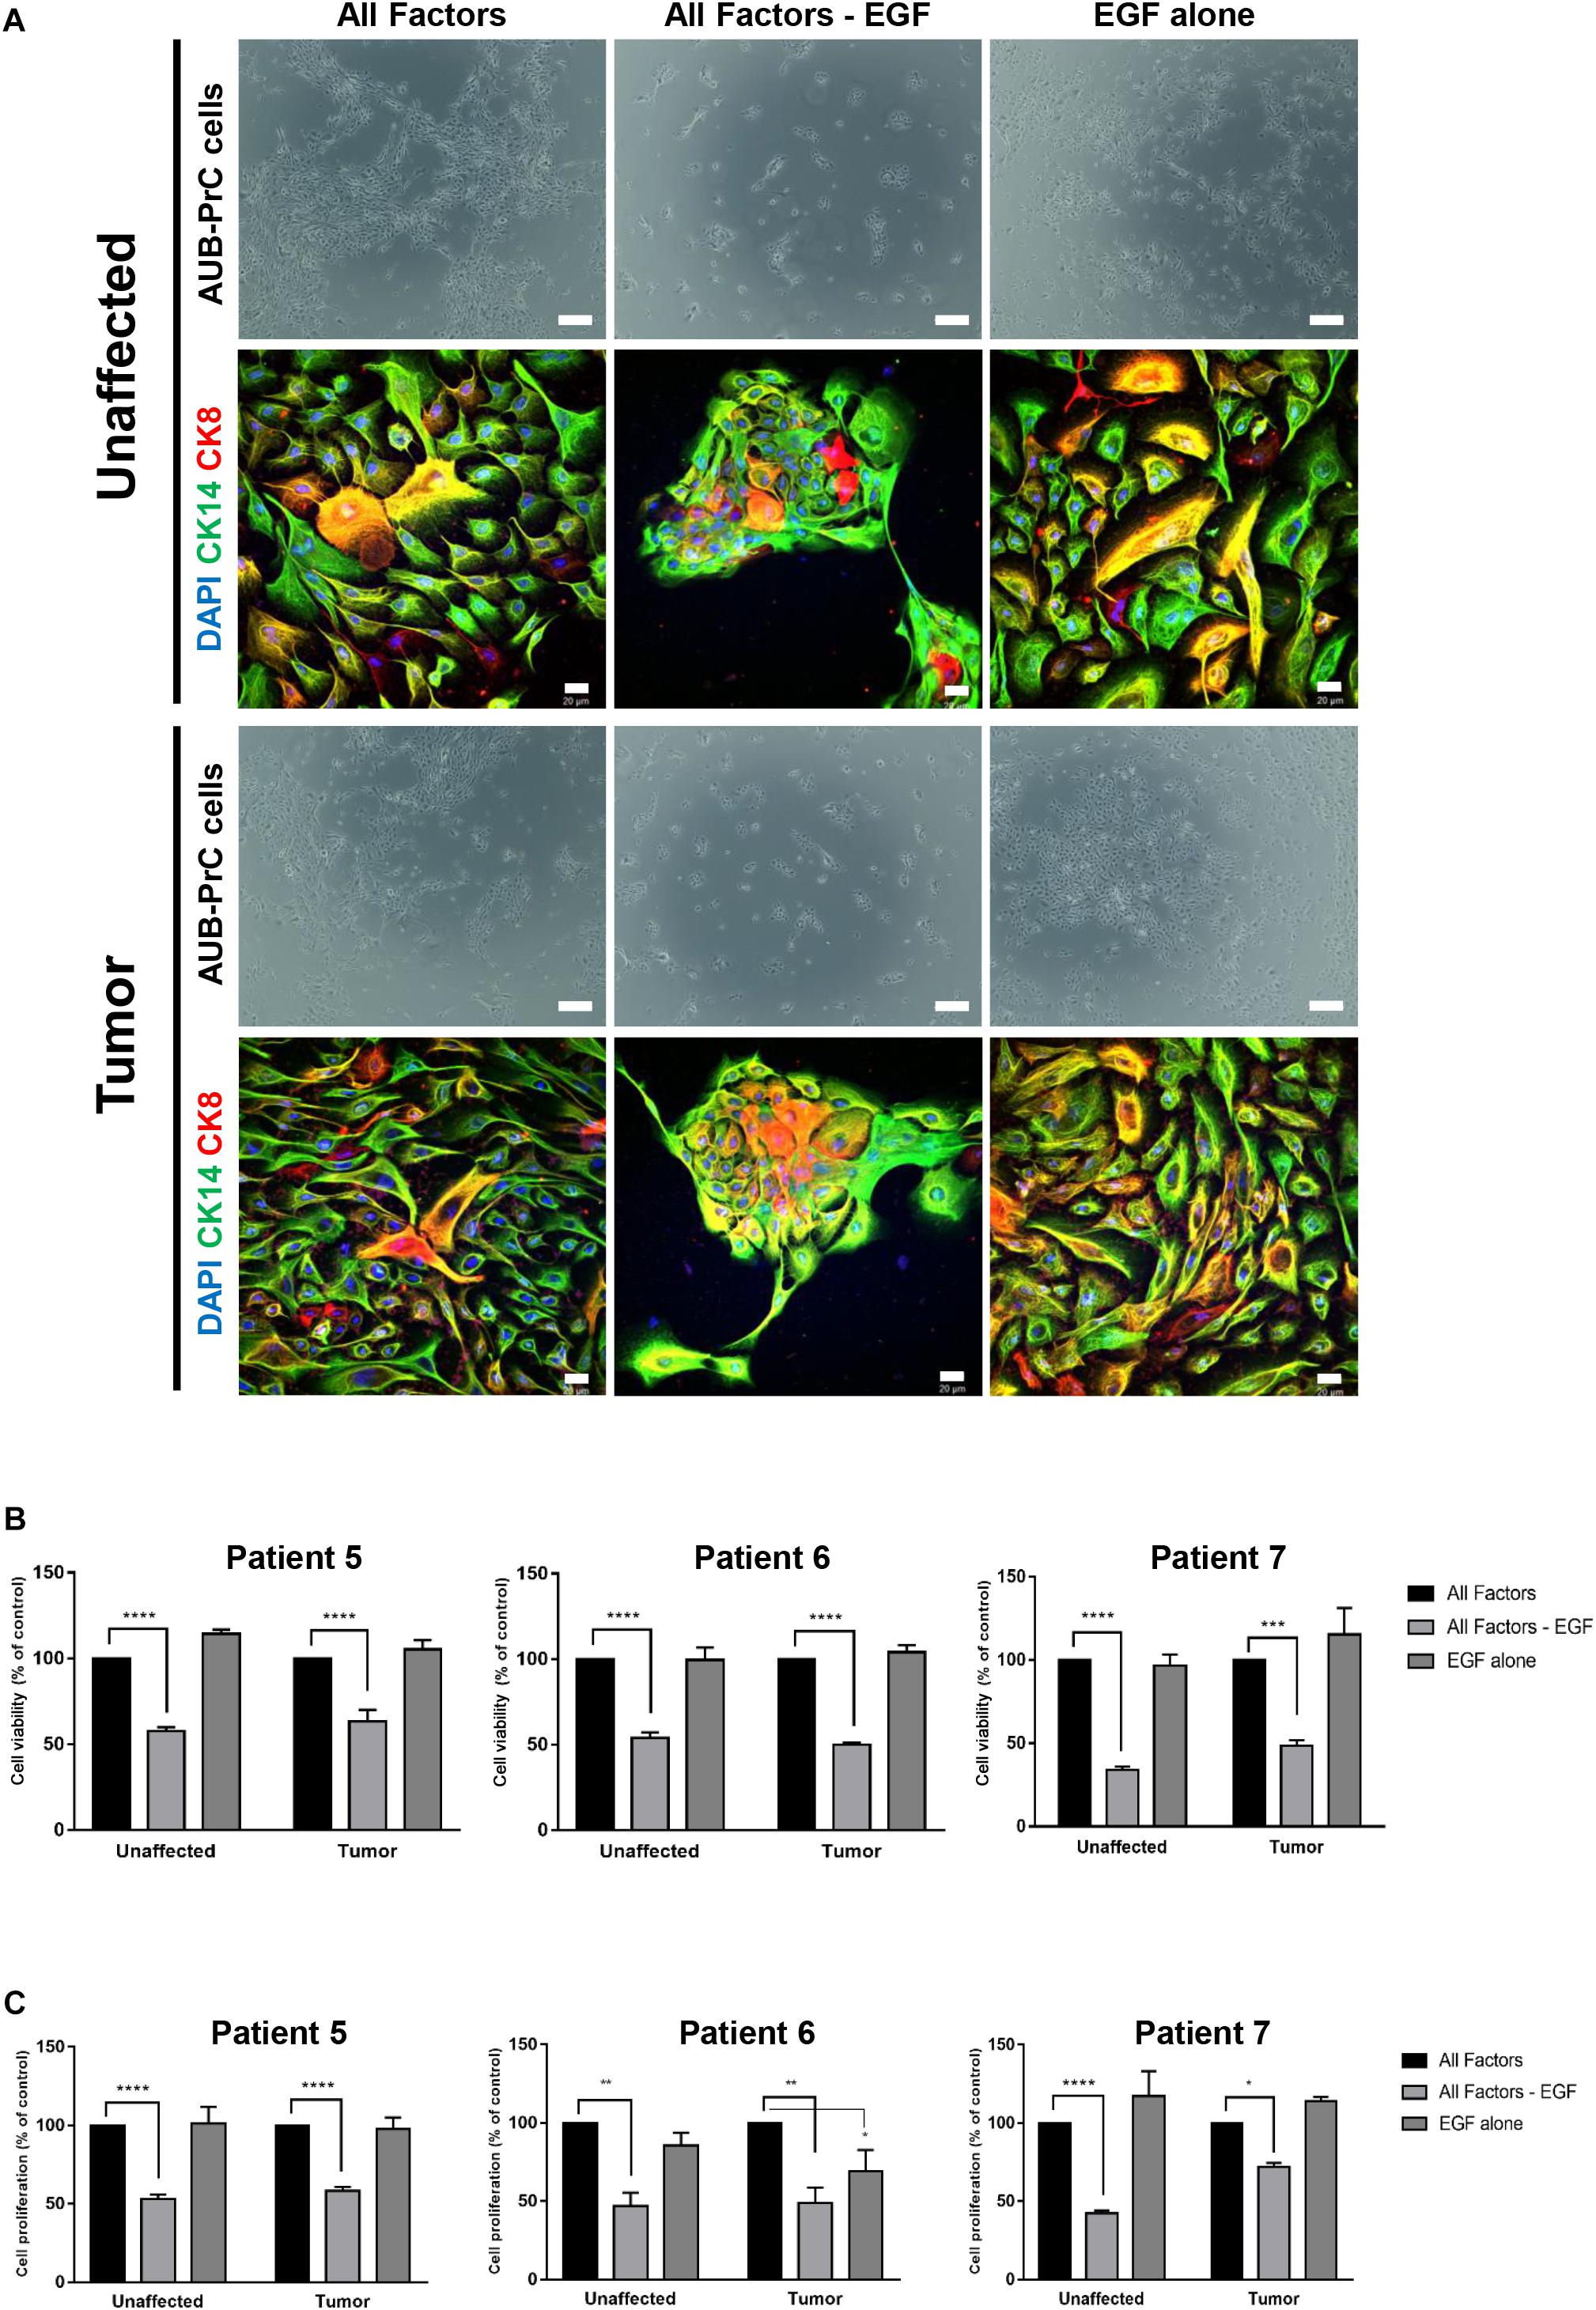
Figure 7. EGF is essential to grow patient-derived AUB-PrC cells in culture. (A) Representative bright-field images of AUB-PrC cells established from unaffected and tumor organoids {patient 7 with Grade Group 3 [Gleason Score 7(4 + 3)]; patient characteristics in Supplementary Table S1} and grown under different conditions; condition 1 “All factors” with prostate organoids growth medium, condition 2 “All factors -EGF” with prostate organoids growth medium without EGF, and condition 3 “EGF alone” with adDMEM/F12 with EGF only (10 ng/mL). Scale bar = 200 μm. Representative Immunofluorescent images of AUB-PrC cells {patient 7 with Grade Group 3 [Gleason Score 7(4 + 3)]; patient characteristics in Supplementary Table S1} grown under different conditions as described previously are stained with the prostate lineage epithelial markers CK8 and CK14. The nuclei were stained with anti-fade reagent Fluorogel II with DAPI. The images were acquired using the Zeiss LSM 710 laser scanning confocal microscope (Zeiss), and images were processed using the Carl Zeiss ZEN 2013 image software. Scale bar = 20 μm. (B) Cell viability was determined using the trypan blue exclusion assay. (C) Cell proliferation was determined in triplicates using the MTT cell proliferation assay {patient 5 with Grade Group 3 [Gleason Score 7(4 + 3)]; patient 6 with Grade Group 2 [Gleason Score 7(3 + 4)]; patient 7 with Grade Group 3 [Gleason Score 7(4 + 3)]; patients characteristics in Supplementary Table S1}. Data represent an average of triplicate measurements and are reported as mean ± SEM. (Two-way ANOVA; *P < 0.05, **P < 0.01, ***P < 0.001, ****P < 0.0001; different conditions compared to condition 1 “All Factors,” Bonferroni’s multiple comparisons test).
Discussion
Epithelial organ remodeling (such as PCa, breast cancer, and colon cancer) is a major contributing factor to worldwide morbidity and mortality. It is difficult to translate basic epithelial research into clinical therapy due to the lack of relevant preclinical models (Hynds and Giangreco, 2013). The challenges of PCa research include inter- and intra-patient heterogeneity and the scarcity of appropriate in vitro and in vivo models that depict the vast molecular aberrations that occur in PCa (Van Bokhoven et al., 2003; Tsai et al., 2018). In this context, many genetic aberrations in PCa are poorly studied, and their effects on therapeutic response are not known (Vela and Chen, 2015). Despite its prevalence, PCa has proven very difficult to propagate in vitro and is highly underrepresented with very few cell lines available among the thousands of cancer cell lines in public repositories (Gao et al., 2014).
The heterogeneous nature of PCa has made it difficult to understand the factors involved in the onset and progression of the disease (Shen and Abate-Shen, 2010). In the last few years several efforts have been made to delineate the complex genomic landscape of PCa (Baca and Garraway, 2012). Moreover, considering that PCa is fairly indolent, the development of treatment approaches that delay its onset or progression is likely to have a significant impact on outcome. Indeed, the scarcity of human PCa cell lines has always hindered our understanding of the disease etiology and progression, and therefore the need for novel cell lines representing the heterogeneity of the disease is of eminent importance. Along those lines and starting from organoids, we aimed at generating novel patient-derived cell lines representing unaffected and tumor prostate tissues.
Starting from the organoids protocol and using the same culture medium (Cheaito et al., under review), human prostate two-dimensional (2D) cell lines (unaffected and tumor) – which we named as AUB-PrC cells – were successfully generated. After the first week of organoids culture, 2D cells started invading the three-dimensional (3D) MatrigelTM droplet and proliferating on the bottom of the culture plates. These cells were successfully derived whenever organoids were established; nonetheless, their maintenance in culture was very challenging. Consequently, to maintain them in culture, we attempted to optimize the culture conditions by using different matrices. Interestingly, collagen-I allowed the spreading of cells and maintained their healthy morphology when propagated for continuous passages reaching more than 28 passages. The favored adhesion of PCa cells to collagen-I represents a possible explanation for these results. Indeed, the most frequent site of human PCa metastasis is the bone and collagen-I represents the most abundant protein within the skeleton (Buckwalter et al., 1996). In addition, it has been previously demonstrated that collagen-I induces the attachment and proliferation of PCa cells (Kiefer and Farach-Carson, 2001).
We sought to characterize the novel patient-derived AUB-PrC cells using immunofluorescence (IF), qRT-PCR, and RNA-Seq analyses (Table 2). AUB-PrC cells depicted a distinctive epithelial cell morphology expressing CK8 and CK5 prostate epithelial lineage markers. Yet, PCa cells are more prone to lose their epithelial phenotype in favor of a more mesenchymal phenotype, which is a trigger for aggressiveness and metastasization. Indeed, our results showed that tumor AUB-PrC cells demonstrate some vimentin (mesenchymal cell marker) expression as well which further validate our point (Supplementary Figure S2). qRT-PCR results indicated a trend in mRNA expression levels of several genes involved in prostate lineage differentiation and other genes known to aberrated in PCa.
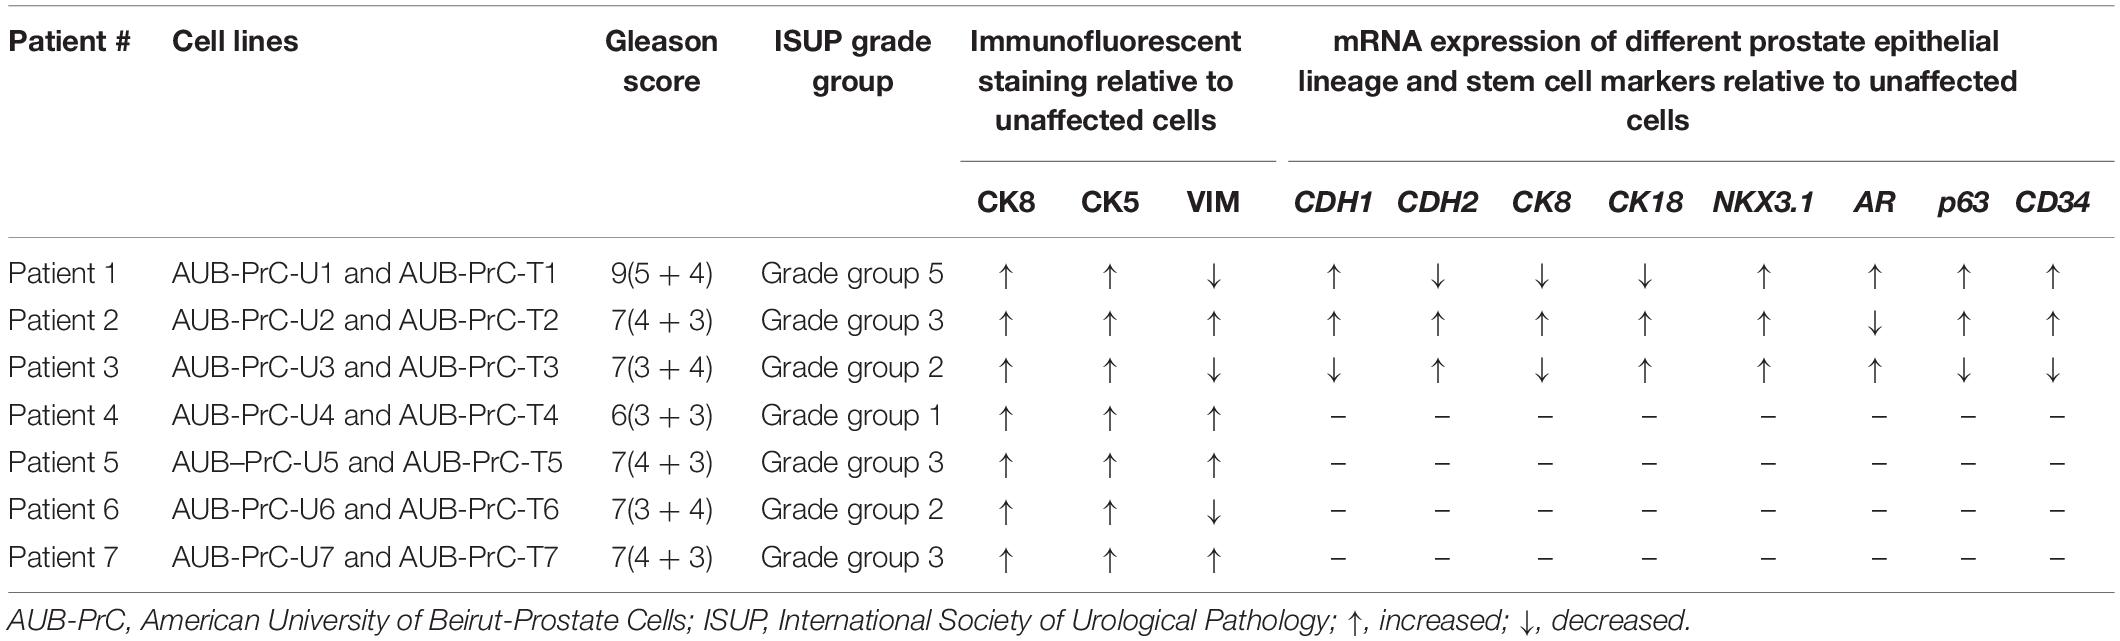
Table 2. Table summarizing major characteristics of patients and AUB-PrC cell lines generated.
We also studied the transcriptomic features and delineated the DEGs that signify AUB-PrC cells vs. their corresponding tissues in unaffected and tumor samples, followed by gene set enrichment analysis (GSEA), demonstrating upregulation of epithelial differentiation pathways and gene features. Herein, we showed that the AUB-PrC cells that have been isolated from patient-derived organoids cultures are of prostate epithelial lineage based on expression of different markers including CK5, CK8, AR, and Nkx3.1, and hence they represent the tissue of origin. Nevertheless, we expected to see variations in the transcriptomic analysis between the cells and their corresponding tissues because we are comparing cells grown in vitro in 2D vs. primary cells or tissues. In other words, we are comparing epithelial cells that are growing under selective pressure in vitro to those that are nascent non-manipulated tissues that contain intact microenvironment with all its components.
Among the DEGs identified by RNA-sequencing were upregulated ones that include keratins (KRT5, KRT8, KRT13, KRT14, KRT18, and KRT19), TP63, CDH1, EGFR, CD44, and FOXA1, and other downregulated genes such as NKX3.1, TWIST1, IL6, TMPRSS2, ERG, AR, CDH2, and growth factor genes (FGF10, FGF2, FGFR1, EGF, and NTF3). We sought to validate some of those genes using qRT-PCR and IF analyses and results were indeed consistent with the RNA-Seq data. Interestingly, the observed mRNA expression patterns recapitulate the architecture of prostate tissues where luminal secretory cell layers express prominent levels of CK8 and CK18, underlying basal cell layers express CK5, CK14 and TP63, and intermediate epithelial cells express KRT19 (Wang et al., 2001; Van Leenders and Schalken, 2003; Peehl, 2005; Cheaito et al., 2019). KRT13, which was upregulated in AUB-PrC cells, has been also proposed to be a marker of stem/progenitor-like cell state. In PCa, this gene has been shown to be enriched in benign stem-like cells displaying androgen-resistance and was identified in tumors that have the potential to metastasize to the bone (Liu et al., 2016). Likewise, TWIST1 which plays a role in PCa bone metastasis, was downregulated in AUB-PrC cells in our study (Gajula et al., 2013; Chang et al., 2015).
Intercellular adhesion is a key factor in epithelial tissue morphogenesis and maintenance, and disruption of this adhesion is an important factor in cancer (Balzer and Konstantopoulos, 2012). Cadherins are a family of calcium-dependent cell– CAMs with well-established roles in cell–cell recognition, intercellular junction organization and cell differentiation. The role of cadherins, particularly the epithelial (E)-cadherin, has been studied in detail in relation to metastatic potential and prognosis in carcinoma. In our study, RNA-seq revealed upregulation of epithelial CDH1 and downregulation of mesenchymal CDH2, verifying the epithelial nature of AUB-PrC cells (Tomita et al., 2000).
One of the initiating events in prostate tumorigenesis is downregulation of the homeobox gene NKX3.1. It is described as the “gatekeeper” for PCa initiation (Barbieri et al., 2013), and was found to be downregulated in AUB-PrC cells in our study. Chromosomal rearrangements involving the ETS family of transcription factors, such as TMPRSS2-ERG fusions, are mostly detected after initiation and not as an initial event, thus they are commonly associated with PCa progression (Tomlins et al., 2005; Shen and Abate-Shen, 2010). In our human AUB-PrC cells, those genes were found to be downregulated. Along the line, AUB-PrC cells demonstrated downregulation of growth factor genes including FGF10, FGF2, FGFR1, EGF, and NTF3, all of which are essential for development and progression of PCa (Polnaszek et al., 2003; Memarzadeh et al., 2007; Corn et al., 2013; Yang et al., 2013; Mandel et al., 2018).
In this same context, and although EGF was designated as an essential component for establishing and maintaining prostate organoids in culture (Karthaus et al., 2014), we were interested in studying its effect on the in vitro culturing and growth of AUB-PrC cells. In brief, we investigated the importance of EGF by growing AUB-PrC cells in three different conditions: prostate organoids growth medium (will all 12 factors), prostate organoids growth medium without EGF, and adDMEM/F12 media with EGF only. Remarkably, our results demonstrated enhanced growth and maintenance of those cells in the presence of EGF alone, while a significant reduction in cell viability and proliferation was noticed when EGF was removed from the medium. These data are consistent with the substantial role of EGF in stimulating cell motility and migration of epithelial cells from various tumors, including PCa (Lu and Kang, 2010; Montanari et al., 2017). Further, we stained the cells grown under the three conditions with prostate luminal epithelial marker CK8 and basal epithelial marker CK14, and found similar cell morphologies and expression patterns in conditions 1 (complete organoids media) and 3 (EGF alone), confirming that EGF by itself is sufficient to substitute the cocktail of 12 components included in condition 1.
Lastly, it is important to emphasize that it is very crucial to establish new cell line models of cancers especially when some of those are scarce as in the case of PCa. Cancer cell lines are considered powerful tools for studying the mechanisms of tumorigenesis especially if the cancer harbors heterogeneity features such as in PCa. Those cancer cell lines are considered fundamental pre-clinical models to assess the efficacy of anti-cancer therapeutics. The available cell lines in PCa do not really recapitulate the huge heterogeneity of the disease and data inferred from small number of cell lines cannot be really generalized as a representative of the pathophysiology of that disease. The major PCa cell lines used are of Caucasian origin (LnCap, DU145, PC3, and VcaP) and hence might not genetically represent the different world populations. Our novel cell lines represent a novel cohort of Middle Eastern patients. Importantly, those novel cell lines are derived from treatment-naïve patients and therefore the cancer cells are considered primitive in terms of treatment response. This can shed more light on the etiology of the disease as it will not be masked by different therapeutic modalities.
Limitations
Our work has several limitations. First, we acknowledge that the sample size might be small, but since we are dealing with patient tissues, it is indeed difficult to obtain large number of prostate tissues to work on just after the surgery. Second, some experiments were not performed on all the seven patients included, and this is due to the fact that obtaining tissue samples from patients is challenging including the small size of the certain samples that we receive and the small number of cells we get. Third, although samples were taken from each patient from the area most likely to be involved with cancer (from the core of the cancerous lesion) and from the unaffected area (far from the tumor site) based on an assessment made by the urologist and pathologist, no definite conclusion can be made to whether the unaffected sample is not genetically modified or might contain niche of cancerous cells. Forth, since PCa starts as an adenocarcinoma (epithelial origin), we tend to refer to the cell lines as epithelial PCa cell lines. However, PCa cells are more prone to lose their epithelial phenotype in favor of a more mesenchymal phenotype, which is a trigger for aggressiveness and metastasization. Herein, our results showed that tumor AUB-PrC cells demonstrate some vimentin (mesenchymal cell marker) expression as well. Fifth, we acknowledge that it is crucial to assess the AUB-PrC cell lines’ ability to engraft in animal models to provide information also about its potential employment in vivo, which can be employed in future studies. In addition, 3D culture experiments using Matrigel or Collagen Type I can be performed also to try and distinguish between malignant and non-malignant cells. Also, validating some of the significantly DEGs at a protein level using western blotting is interesting to be addressed in future studies assessing molecular aberration and signaling underlying our newly developed AUB-PrC cell lines. Sixth, our RNA seq results revealed that growth factors are among the DEGs identified in AUB-PrC cells vs. tissues, including FGF10, FGF2, FGFR1, and NTF3, all of which are essential for development and progression of PCa. For the scope of this paper, we have only worked on EGF. Nevertheless, it would be very interesting to assess the roles of the other growth factors. Lastly, and as all those newly derived cells are considered biological replicates from unique patients and therefore represent different cell models, it becomes crucial to subject them to targeted sequencing or whole genome sequencing to fully characterize the genomic landscape of each cell line/patient.
Conclusion
The derivation of novel models to express the diverse array of aberrations seen in PCa is essential in detecting specific stages of the disease, classifying PCa based on specific molecular alterations, and selecting the most appropriate therapy for each patient. In this manuscript, we were able to generate and characterize different cell models representing different PCa patients from Middle-Eastern background and having a common feature of being treatment-naïve. We successfully demonstrated the importance of growth factors in modeling of prostate diseases by showing that the newly isolated prostate cells are capable of growing in culture in the presence of EGF alone. Yet, it is of utmost importance to further analyze the differential transcriptomic features between tumor and unaffected samples to better understand PCa at a subcellular level. Our findings provide a prospect to better understand prostate diseases, especially PCa, and pave the way for deciphering the mechanisms that lead to PCa development and progression, and ultimately improving prognostic abilities and treatments.
Data Availability Statement
The datasets presented in this study can be found in online repositories. The names of the repository/repositories and accession number(s) can be found in the article/Supplementary Material.
Ethics Statement
The studies involving human participants were reviewed and approved by Institutional Review Board (IRB) of the American University of Beirut. The patients/participants provided their written informed consent to participate in this study.
Author Contributions
KC: investigation, methodology, writing- original draft preparation, writing- reviewing and editing, visualization, validation. HB: resources, software, formal analysis, investigation, methodology, data curation, writing- original draft preparation, writing- reviewing and editing, visualization, validation. HJ, OH, and HM: investigation, methodology, writing- reviewing and editing, validation. AE-H and DM: investigation, writing- reviewing and editing, visualization, validation. MA-S: project administration, supervision, software, formal analysis, methodology, data curation, writing- original draft preparation, writing- reviewing and editing, visualization, validation. WA-K: conceptualization, project administration, supervision, writing- original draft preparation, writing- reviewing and editing, validation, visualization, funding acquisition. All authors contributed to the article and approved the submitted version.
Funding
This research was supported by funding from the Medical Practice Plan (MPP) at the American University of Beirut Faculty of Medicine (AUB-FM) (to WA-K) and funding from New York University Abu Dhabi (NYUAD) Center for Genomics and Systems Biology (to MA-S). The funders had no role in study design, data collection, and analysis, decision to publish, or preparation of the manuscript.
Conflict of Interest
The authors declare that the research was conducted in the absence of any commercial or financial relationships that could be construed as a potential conflict of interest.
Acknowledgments
We want to thank all members of the Abou-Kheir’s and Al-Sayegh’s Laboratories for their support. In addition, we would like to thank all members of the core facilities in the DTS Building for their help and support.
Supplementary Material
The Supplementary Material for this article can be found online at: https://www.frontiersin.org/articles/10.3389/fcell.2020.571677/full#supplementary-material
Supplementary Figure 1 | Morphologic analysis of AUB-PrC cells from patients 2 and 3. Representative bright-field images of AUB-PrC-U2 and AUB-PrC-T2 cells (A) and AUB-PrC-U3 and AUB-PrC-T3 cells (B), displaying key characteristics of epithelial cells {patient 2 with Grade Group 3 [Gleason Score 7(4 +3)]; patient 3 with Grade Group 1 [Gleason Score 7(3 +4)]; patients characteristics in Supplementary Table S1}. Scale bar 200 μm.
Supplementary Figure 2 | Immunofluorescent epithelial lineage characterization of AUB-PrC cells for CK8/CK5 and CK8/VIM (B). Representative immunofluorescence images of AUB-PrC cells from unaffected and tumor prostate patient samples {patient 1 with Grade Group 5 [Gleason Score 9(5 +4)]; patient 2 with Grade Group 3 [Gleason Score 7(4 +3)]; patient 3 with Grade Group 2 [Gleason Score 7(3 +4)]; patient 4 with Grade Group 1 [Gleason Score 6(3 +3)]; patient 6 with Grade Group 2 [Gleason Score 7(3 +4)]; patient characteristics in Supplementary Table S1} stained for the lineage epithelial cell markers, CK8 (luminal epithelial cell marker), CK5 (basal epithelial cell marker), and VIM (mesenchymal cell marker), and the nuclear counterstain DAPI illustrating CK8 +/CK5 (A) and CK8+/VIM (B) characters. Scale bars 20 μm.
Supplementary Figure 3 | Validation of dysregulated gene expression in AUB-PrC cells relative to their tissue counterparts. (A) Upregulation of CK8 and P63 and downregulation of AR, VIM, and TWIST1 in AUB-PrC cells compared to tissues [patient 5 with Grade Group 3 [Gleason Score 7(4 +3)]; patient characteristics in Supplementary Table S1} was validated by qRT-PCR and analyzed using the 2–Δ Ct method by normalization to GAPDH. Reactions were performed in technical triplicates and expression of individual genes was normalized to the house keeping gene GAPDH. Data were plotted relative to the tissue counterparts. Relative expression values are presented as means + SD (three technical replicates) (∗P <0.05; ∗∗P <0.01; by Student’s t-test). (B) Representative Immunofluorescent images of AUB-PrC cells {patient 4 with Grade Group 1 [Gleason Score 6(3 +3)] and patient 5 with Grade Group 3 [Gleason Score 7(4 +3)]; patients characteristics in Supplementary Table S1} stained with the prostate lineage epithelial markers CK8, CK5, and VIM. The nuclei were stained with anti-fade reagent Fluorogel II with DAPI. The images were acquired using the Zeiss LSM 710 laser scanning confocal microscope (Zeiss), and images were processed using the Carl Zeiss ZEN 2013 image software. Scale bar 200μm.
Supplementary Figure 4 | Gene set enrichment analysis (GSEA) of the top 20 signaling pathways activated in AUB-PrC cells relative to their tissue counterparts among the unaffected samples. Comparison of data sets indicated unaffected AUB-PrC cells had enrichment of cell cycle pathways, E2F signaling, TP53 transcriptional regulation, Rb signaling, mitosis, and epithelial differentiation pathways.
Supplementary Figure 5 | Gene set enrichment analysis (GSEA) of the top 20 signaling pathways activated in AUB-PrC cells relative to their tissue counterparts among the tumor samples. Comparison of data sets indicated tumor AUB-PrC cells had enrichment of cell cycle pathways, PLK1 signaling, DNA irradiation damage and cellular response via ATR, and epithelial differentiation pathways.
Supplementary Table 1 | Patients’ clinical characteristics.
Supplementary Table 2 | Overview of specific components and their respective concentrations added to prepare human prostate organoids culture medium. Adopted and modified from Drost et al. (2016).
Supplementary Table 3 | Primer sequences and annealing temperatures for select human genes.
Supplementary Table 4 | Gene set database used for pathway enrichment analysis (Human_GOBP_AllPathways_no_GO_iea_April_01_2020_symbol.gmt; downloaded from http://baderlab.org/GeneSets).
Supplementary Table 5 | List of all differentially expressed genes (DEGs) between AUB-PrC cells and their tissue counterparts in unaffected samples.
Supplementary Table 6 | List of all differentially expressed genes (DEGs) between AUB-PrC cells and their tissue counterparts in tumor samples.
Supplementary Table 7 | List of all differentially expressed genes (DEGs) between AUB-PrC cells and their tissue counterparts that are unique to unaffected samples (543), unique to tumor samples (1410), and common between the two (2840).
Supplementary Table 8 | List of biological processes identified that are unique to the unaffected AUB-PrC cells vs. tissue. There were 41 terms showing top five significant enrichments of GO:0043065~positive regulation of apoptotic process (16 genes), GO:0001755~neural crest cell migration (6 genes), GO:0045746~negative regulation of Notch signaling pathway (5 genes), GO:2000379~positive regulation of reactive oxygen species metabolic process (5 genes), and GO:0090074~negative regulation of protein homodimerization activity (3 genes).
Supplementary Table 9 | List of biological processes identified that are unique to the tumor AUB-PrC cells vs. tissue. There were 58 terms showing top five significant enrichments of GO:0006887~exocytosis (14 genes), GO:0045909~positive regulation of vasodilation (8 genes), GO:0051090~regulation of sequence-specific DNA binding transcription factor activity (7 genes), GO:0001525~angiogenesis (25 genes), and GO:0019233~sensory perception of pain (10 genes).
Supplementary Table 10 | List of biological processes identified that are common between unaffected and tumor AUB-PrC cells vs. tissue. There were 414 terms showing top five significant enrichments of GO:0007155~cell adhesion (158 genes), GO:0030198~extracellular matrix organization (83 genes), GO:0007165~signal transduction (249 genes), GO:0006954~inflammatory response (109 genes), and GO:0006955~immune response (109 genes).
Supplementary Table 11 | Gene set annotations of the enrichment map presented in Figure 6A corresponding to the unaffected AUB-PrC cells vs. tissues identified using Cytoscape 3.7.2 software (EnrichmentMap tool).
Supplementary Table 12 | Gene set annotations of the enrichment map presented in Figure 6A corresponding to the tumor AUB-PrC cells vs. tissues identified using Cytoscape 3.7.2 software (EnrichmentMap tool).
Supplementary Table 13 | Signaling pathways that are activated in unaffected AUB-PrC cells vs. tissues identified using gene set enrichment analysis (GSEA).
Supplementary Table 14 | Signaling pathways that are activated in tumor AUB-PrC cells vs. tissues identified using gene set enrichment analysis (GSEA).
Footnotes
References
Abate-Shen, C., and Shen, M. M. (2000). Molecular genetics of prostate cancer. Genes Dev. 14, 2410–2434. doi: 10.1101/gad.819500
Agarwal, S., Hynes, P. G., Tillman, H. S., Lake, R., Abou-Kheir, W. G., Fang, L., et al. (2015). Identification of different classes of luminal progenitor cells within prostate tumors. Cell Rep. 13, 2147–2158. doi: 10.1016/j.celrep.2015.10.077
Antonica, F., Kasprzyk, D. F., Opitz, R., Iacovino, M., Liao, X. H., Dumitrescu, A. M., et al. (2012). Generation of functional thyroid from embryonic stem cells. Nature 491, 66–71. doi: 10.1038/nature11525
Ashburner, M., Ball, C. A., Blake, J. A., Botstein, D., Butler, H., Cherry, J. M., et al. (2000). Gene ontology: tool for the unification of biology. The gene ontology consortium. Nat. Genet 25, 25–29. doi: 10.1038/75556
Baca, S. C., and Garraway, L. A. (2012). The genomic landscape of prostate cancer. Front. Endocrinol. 3:69–69. doi: 10.3389/fendo.2012.00069
Bahmad, H. F., Cheaito, K., Chalhoub, R. M., Hadadeh, O., Monzer, A., Ballout, F., et al. (2018). Sphere-formation assay: three-dimensional in vitro culturing of prostate cancer stem/progenitor sphere-forming cells. Front. Oncol. 8:347–347. doi: 10.3389/fonc.2018.00347
Bahmad, H. F., Elajami, M. K., Daouk, R., Jalloul, H., Darwish, B., Chalhoub, R. M., et al. (2020a). Stem cells: in sickness and in health. Curr. Stem Cell Res. Ther. doi: 10.2174/1574888x15999200831160710
Bahmad, H. F., Peng, W., Zhu, R., Ballout, F., Monzer, A., Elajami, M. K., et al. (2020b). Protein expression analysis of an in vitro murine model of prostate cancer progression: towards identification of high-potential therapeutic targets. J. Pers. Med. 10:83. doi: 10.3390/jpm10030083
Balzer, E. M., and Konstantopoulos, K. (2012). Intercellular adhesion: mechanisms for growth and metastasis of epithelial cancers. Wiley Interdisc. Rev. Syst. Biol. Med. 4, 171–181. doi: 10.1002/wsbm.160
Barbieri, C. E., Bangma, C. H., Bjartell, A., Catto, J. W., Culig, Z., Grönberg, H., et al. (2013). The mutational landscape of prostate cancer. Eur. Urol. 64, 567–576. doi: 10.1016/j.eururo.2013.05.029
Barker, N., Huch, M., Kujala, P., van de Wetering, M., Snippert, H. J., van Es, J. H., et al. (2010). Lgr5(+ve) stem cells drive self-renewal in the stomach and build long-lived gastric units in vitro. Cell Stem Cell 6, 25–36. doi: 10.1016/j.stem.2009.11.013
Barrow, R. E., Wang, C. Z., Evans, M. J., and Herndon, D. N. (1993). Growth factors accelerate epithelial repair in sheep trachea. Lung 171, 335–344. doi: 10.1007/bf00165699
Bartucci, M., Ferrari, A. C., Kim, I. Y., Ploss, A., Yarmush, M., and Sabaawy, H. E. (2016). Personalized medicine approaches in prostate cancer employing patient derived 3D organoids and humanized mice. Front. Cell Dev. Biol. 4:64. doi: 10.3389/fcell.2016.00064
Buckwalter, J. A., Glimcher, M. J., Cooper, R. R., and Recker, R. (1996). Bone biology. I: structure, blood supply, cells, matrix, and mineralization. Instr. Course Lect. 45, 371–386.
Burgel, P. R., and Nadel, J. A. (2004). Roles of epidermal growth factor receptor activation in epithelial cell repair and mucin production in airway epithelium. Thorax 59, 992–996. doi: 10.1136/thx.2003.018879
Chang, Y. S., Chen, W. Y., Yin, J. J., Sheppard-Tillman, H., Huang, J., and Liu, Y. N. (2015). EGF receptor promotes prostate cancer bone metastasis by downregulating miR-1 and activating TWIST1. Cancer Res. 75, 3077–3086. doi: 10.1158/0008-5472.can-14-3380
Cheaito, K. A., Bahmad, H. F., Hadadeh, O., Saleh, E., Dagher, C., Hammoud, M. S., et al. (2019). EMT markers in locally-advanced prostate cancer: predicting recurrence? Front. Oncol. 9:131. doi: 10.3389/fonc.2019.00131
Chen, T. R. (1993). Chromosome identity of human prostate cancer cell lines. PC-3 and PPC-1. Cytogenet Cell Genet. 62, 183–184. doi: 10.1159/000133468
Corn, P. G., Wang, F., McKeehan, W. L., and Navone, N. (2013). Targeting fibroblast growth factor pathways in prostate cancer. Clin. Cancer Res. 19, 5856–5866. doi: 10.1158/1078-0432.CCR-13-1550
Croft, D., O’Kelly, G., Wu, G., Haw, R., Gillespie, M., Matthews, L., et al. (2011). Reactome: a database of reactions, pathways and biological processes. Nucleic Acids Res. 39, D691–D697. doi: 10.1093/nar/gkq1018
Cunningham, D., and You, Z. (2015). In vitro and in vivo model systems used in prostate cancer research. J. Biol. Methods 2:e17. doi: 10.14440/jbm.2015.63
Daoud, G., Monzer, A., Bahmad, H., Chamaa, F., Hamdar, L., Mouhieddine, T. H., et al. (2016). Primary versus castration-resistant prostate cancer: modeling through novel murine prostate cancer cell lines. Oncotarget 7, 28961–28975. doi: 10.18632/oncotarget.8436
Daouk, R., Bahmad, H. F., Saleh, E., Monzer, A., Ballout, F., Kadara, H., et al. (2020). Genome-wide gene expression analysis of a murine model of prostate cancer progression: deciphering the roles of IL-6 and p38 MAPK as potential therapeutic targets. PLoS One 15:e0237442. doi: 10.1371/journal.pone.0237442
Drost, J., Karthaus, W. R., Gao, D., Driehuis, E., Sawyers, C. L., Chen, Y., et al. (2016). Organoid culture systems for prostate epithelial tissue and prostate cancer tissue. Nat. Protoc. 11, 347–358. doi: 10.1038/nprot.2016.006
Edgar, R., Domrachev, M., and Lash, A. E. (2002). Gene expression omnibus: NCBI gene expression and hybridization array data repository. Nucleic Acids Res. 30, 207–210. doi: 10.1093/nar/30.1.207
Eiraku, M., Takata, N., Ishibashi, H., Kawada, M., Sakakura, E., Okuda, S., et al. (2011). Self-organizing optic-cup morphogenesis in three-dimensional culture. Nature 472, 51–56. doi: 10.1038/nature09941
Festuccia, C., Angelucci, A., Gravina, G. L., Biordi, L., Millimaggi, D., Muzi, P., et al. (2005). Epidermal growth factor modulates prostate cancer cell invasiveness regulating urokinase-type plasminogen activator activity. EGF-receptor inhibition may prevent tumor cell dissemination. Thromb Haemost 93, 964–975. doi: 10.1160/th04-09-0637
Fitzpatrick, S. L., LaChance, M. P., and Schultz, G. S. (1984). Characterization of epidermal growth factor receptor and action on human breast cancer cells in culture. Cancer Res. 44, 3442–3447.
Gajula, R. P., Chettiar, S. T., Williams, R. D., Thiyagarajan, S., Kato, Y., Aziz, K., et al. (2013). The twist box domain is required for Twist1-induced prostate cancer metastasis. Mol. Cancer Res. 11, 1387–1400. doi: 10.1158/1541-7786.mcr-13-0218-t
Gao, D., Vela, I., Sboner, A., Iaquinta, P. J., Karthaus, W. R., Gopalan, A., et al. (2014). Organoid cultures derived from patients with advanced prostate cancer. Cell 159, 176–187. doi: 10.1016/j.cell.2014.08.016
Huang Da, W., Sherman, B. T., and Lempicki, R. A. (2009). Bioinformatics enrichment tools: paths toward the comprehensive functional analysis of large gene lists. Nucleic Acids Res. 37, 1–13. doi: 10.1093/nar/gkn923
Huang, Y., Cheng, C., Zhang, C., Zhang, Y., Chen, M., Strand, D. W., et al. (2016). Advances in prostate cancer research models: from transgenic mice to tumor xenografting models. Asian J. Urol. 3, 64–74. doi: 10.1016/j.ajur.2016.02.004
Huch, M., Dorrell, C., Boj, S. F., van Es, J. H., Li, V. S., van de Wetering, M., et al. (2013). In vitro expansion of single Lgr5+ liver stem cells induced by Wnt-driven regeneration. Nature 494, 247–250. doi: 10.1038/nature11826
Hynds, R. E., and Giangreco, A. (2013). Concise review: the relevance of human stem cell-derived organoid models for epithelial translational medicine. Stem Cells 31, 417–422. doi: 10.1002/stem.1290
Jung, P., Sato, T., Merlos-Suarez, A., Barriga, F. M., Iglesias, M., Rossell, D., et al. (2011). Isolation and in vitro expansion of human colonic stem cells. Nat. Med. 17, 1225–1227. doi: 10.1038/nm.2470
Kandasamy, K., Mohan, S. S., Raju, R., Keerthikumar, S., Kumar, G. S., Venugopal, A. K., et al. (2010). NetPath: a public resource of curated signal transduction pathways. Genome Biol. 11:R3. doi: 10.1186/gb-2010-11-1-r3
Karantanos, T., Corn, P. G., and Thompson, T. C. (2013). Prostate cancer progression after androgen deprivation therapy: mechanisms of castrate resistance and novel therapeutic approaches. Oncogene 32, 5501–5511. doi: 10.1038/onc.2013.206
Karthaus, W. R., Iaquinta, P. J., Drost, J., Gracanin, A., van Boxtel, R., Wongvipat, J., et al. (2014). Identification of multipotent luminal progenitor cells in human prostate organoid cultures. Cell 159, 163–175. doi: 10.1016/j.cell.2014.08.017
Kiefer, J. A., and Farach-Carson, M. C. (2001). Type I collagen-mediated proliferation of PC3 prostate carcinoma cell line: implications for enhanced growth in the bone microenvironment. Matrix Biol. 20, 429–437. doi: 10.1016/s0945-053x(01)00159-7
Kim, J., Jung, J., Lee, S. J., Lee, J. S., and Park, M. J. (2012). Cancer stem-like cells persist in established cell lines through autocrine activation of EGFR signaling. Oncol. Lett. 3, 607–612. doi: 10.3892/ol.2011.531
Koehler, K. R., Mikosz, A. M., Molosh, A. I., Patel, D., and Hashino, E. (2013). Generation of inner ear sensory epithelia from pluripotent stem cells in 3D culture. Nature 500, 217–221. doi: 10.1038/nature12298
Koo, B. K., Stange, D. E., Sato, T., Karthaus, W., Farin, H. F., Huch, M., et al. (2011). Controlled gene expression in primary Lgr5 organoid cultures. Nat. Methods 9, 81–83. doi: 10.1038/nmeth.1802
Lancaster, M. A., Renner, M., Martin, C. A., Wenzel, D., Bicknell, L. S., Hurles, M. E., et al. (2013). Cerebral organoids model human brain development and microcephaly. Nature 501, 373–379. doi: 10.1038/nature12517
Liu, S., Cadaneanu, R. M., Zhang, B., Huo, L., Lai, K., Li, X., et al. (2016). Keratin 13 is enriched in prostate tubule-initiating cells and may identify primary prostate tumors that metastasize to the bone. PLoS One 11:e0163232. doi: 10.1371/journal.pone.0163232
Love, M. I., Huber, W., and Anders, S. (2014). Moderated estimation of fold change and dispersion for RNA-seq data with DESeq2. Genome Biol. 15:550. doi: 10.1186/s13059-014-0550-8
Lu, X., and Kang, Y. (2010). Epidermal growth factor signalling and bone metastasis. Br. J. Cancer 102, 457–461. doi: 10.1038/sj.bjc.6605490
MacLeod, R. A., Dirks, W. G., Matsuo, Y., Kaufmann, M., Milch, H., and Drexler, H. G. (1999). Widespread intraspecies cross-contamination of human tumor cell lines arising at source. Int. J. Cancer 83, 555–563. doi: 10.1002/(sici)1097-0215(19991112)83:4<555::aid-ijc19<3.0.co;2-2
Mandel, A., Larsson, P., Sarwar, M., Semenas, J., Syed Khaja, A. S., and Persson, J. L. (2018). The interplay between AR, EGF receptor and MMP-9 signaling pathways in invasive prostate cancer. Mol. Med. 24:34. doi: 10.1186/s10020-018-0035-4
Memarzadeh, S., Xin, L., Mulholland, D. J., Mansukhani, A., Wu, H., Teitell, M. A., et al. (2007). Enhanced paracrine FGF10 expression promotes formation of multifocal prostate adenocarcinoma and an increase in epithelial androgen receptor. Cancer Cell 12, 572–585. doi: 10.1016/j.ccr.2007.11.002
Mi, H., Lazareva-Ulitsky, B., Loo, R., Kejariwal, A., Vandergriff, J., Rabkin, S., et al. (2005). The PANTHER database of protein families, subfamilies, functions and pathways. Nucleic Acids Res. 33, D284–D288. doi: 10.1093/nar/gki078
Montanari, M., Rossetti, S., Cavaliere, C., D’Aniello, C., Malzone, M. G., Vanacore, D., et al. (2017). Epithelial-mesenchymal transition in prostate cancer: an overview. Oncotarget 8, 35376–35389. doi: 10.18632/oncotarget.15686
Mosmann, T. (1983). Rapid colorimetric assay for cellular growth and survival: application to proliferation and cytotoxicity assays. J. Immunol. Methods 65, 55–63. doi: 10.1016/0022-1759(83)90303-4
Nelson, J. W., Sklenar, J., Barnes, A. P., and Minnier, J. (2017). The START App: a web-based RNAseq analysis and visualization resource. Bioinformatics 33, 447–449. doi: 10.1093/bioinformatics/btw624
Pan, Y., Lui, W. O., Nupponen, N., Larsson, C., Isola, J., Visakorpi, T., et al. (2001). 5q11, 8p11, and 10q22 are recurrent chromosomal breakpoints in prostate cancer cell lines. Genes Chromosomes Cancer 30, 187–195. doi: 10.1002/1098-2264(2000)9999:9999<::aid-gcc1075>3.0.co;2-h
Peehl, D. M. (2005). Primary cell cultures as models of prostate cancer development. Endocr. Relat. Cancer 12, 19–47. doi: 10.1677/erc.1.00795
Peehl, D. M., Wong, S. T., and Rubin, J. S. (1996). KGF and EGF differentially regulate the phenotype of prostatic epithelial cells. Growth Regulat. 6, 22–31.
Polnaszek, N., Kwabi-Addo, B., Peterson, L. E., Ozen, M., Greenberg, N. M., Ortega, S., et al. (2003). Fibroblast growth factor 2 promotes tumor progression in an autochthonous mouse model of prostate cancer. Cancer Res. 63, 5754–5760.
Reimand, J., Isserlin, R., Voisin, V., Kucera, M., Tannus-Lopes, C., Rostamianfar, A., et al. (2019). Pathway enrichment analysis and visualization of omics data using g:profiler GSEA, cytoscape and enrichmentmap. Nat. Protoc. 14, 482–517. doi: 10.1038/s41596-018-0103-9
Riss, T. L., Moravec, R. A., Niles, A. L., Duellman, S., Benink, H. A., Worzella, T. J., et al. (2004). “Cell viability assays,” in Assay Guidance Manual, eds G. S. Sittampalam, N. P. Coussens, K. Brimacombe, A. Grossman, M. Arkin, D. Auld, et al. (Bethesda, MD: Eli Lilly & Company and the National Center for Advancing Translational Sciences).
Romero, P., Wagg, J., Green, M. L., Kaiser, D., Krummenacker, M., and Karp, P. D. (2005). Computational prediction of human metabolic pathways from the complete human genome. Genome Biol. 6:R2. doi: 10.1186/gb-2004-6-1-r2
Sachs, N., and Clevers, H. (2014). Organoid cultures for the analysis of cancer phenotypes. Curr. Opin. Genet. Dev. 24, 68–73. doi: 10.1016/j.gde.2013.11.012
Sato, T., Stange, D. E., Ferrante, M., Vries, R. G., Van Es, J. H., Van den Brink, S., et al. (2011). Long-term expansion of epithelial organoids from human colon, adenoma, adenocarcinoma, and Barrett’s epithelium. Gastroenterology 141, 1762–1772. doi: 10.1053/j.gastro.2011.07.050
Sato, T., Vries, R. G., Snippert, H. J., van de Wetering, M., Barker, N., Stange, D. E., et al. (2009). Single Lgr5 stem cells build crypt-villus structures in vitro without a mesenchymal niche. Nature 459, 262–265. doi: 10.1038/nature07935
Schaefer, C. F., Anthony, K., Krupa, S., Buchoff, J., Day, M., Hannay, T., et al. (2009). PID: the pathway interaction database. Nucleic Acids Res. 37, D674–D679. doi: 10.1093/nar/gkn653
Schwank, G., Andersson-Rolf, A., Koo, B. K., Sasaki, N., and Clevers, H. (2013a). Generation of BAC transgenic epithelial organoids. PLoS One 8:e76871. doi: 10.1371/journal.pone.0076871
Schwank, G., Koo, B. K., Sasselli, V., Dekkers, J. F., Heo, I., Demircan, T., et al. (2013b). Functional repair of CFTR by CRISPR/Cas9 in intestinal stem cell organoids of cystic fibrosis patients. Cell Stem Cell 13, 653–658. doi: 10.1016/j.stem.2013.11.002
Shen, M. M., and Abate-Shen, C. (2010). Molecular genetics of prostate cancer: new prospects for old challenges. Genes Dev. 24, 1967–2000. doi: 10.1101/gad.1965810
Siegel, R. L., Miller, K. D., and Jemal, A. (2020). Cancer statistics, 2020. CA Cancer J. Clin. 70, 7–30. doi: 10.3322/caac.21590
Sobel, R. E., and Sadar, M. D. (2005). Cell lines used in prostate cancer research: a compendium of old and new lines–part 1. J. Urol. 173, 342–359. doi: 10.1097/01.ju.0000141580.30910.57
Song, H., Zhang, B., Watson, M. A., Humphrey, P. A., Lim, H., and Milbrandt, J. (2009). Loss of Nkx3.1 leads to the activation of discrete downstream target genes during prostate tumorigenesis. Oncogene 28, 3307–3319. doi: 10.1038/onc.2009.181
Stange, D. E., Koo, B. K., Huch, M., Sibbel, G., Basak, O., Lyubimova, A., et al. (2013). Differentiated Troy+ chief cells act as reserve stem cells to generate all lineages of the stomach epithelium. Cell 155, 357–368. doi: 10.1016/j.cell.2013.09.008
Strober, W. (2001). Trypan blue exclusion test of cell viability. Curr. Protoc. Immunol. Appendix 3 Appendix 3B. doi: 10.1002/0471142735.ima03bs21
Subramanian, A., Tamayo, P., Mootha, V. K., Mukherjee, S., Ebert, B. L., Gillette, M. A., et al. (2005). Gene set enrichment analysis: a knowledge-based approach for interpreting genome-wide expression profiles. Proc. Natl. Acad. Sci. U.S.A. 102, 15545–15550. doi: 10.1073/pnas.0506580102
Taguchi, A., Kaku, Y., Ohmori, T., Sharmin, S., Ogawa, M., Sasaki, H., et al. (2014). Redefining the in vivo origin of metanephric nephron progenitors enables generation of complex kidney structures from pluripotent stem cells. Cell Stem Cell 14, 53–67. doi: 10.1016/j.stem.2013.11.010
Takasato, M., Er, P. X., Becroft, M., Vanslambrouck, J. M., Stanley, E. G., Elefanty, A. G., et al. (2014). Directing human embryonic stem cell differentiation towards a renal lineage generates a self-organizing kidney. Nat. Cell Biol. 16, 118–126. doi: 10.1038/ncb2894
Tomita, K., Van Bokhoven, A., Van Leenders, G. J. L. H., Ruijter, E. T. G., Jansen, C. F. J., Bussemakers, M. J. G., et al. (2000). Cadherin switching in human prostate cancer progression. Cancer Res. 60, 3650–3654.
Tomlins, S. A., Rhodes, D. R., Perner, S., Dhanasekaran, S. M., Mehra, R., Sun, X. W., et al. (2005). Recurrent fusion of TMPRSS2 and ETS transcription factor genes in prostate cancer. Science 310, 644–648. doi: 10.1126/science.1117679
Tsai, Y. C., Chen, W. Y., Abou-Kheir, W., Zeng, T., Yin, J. J., Bahmad, H., et al. (2018). Androgen deprivation therapy-induced epithelial-mesenchymal transition of prostate cancer through downregulating SPDEF and activating CCL2. Biochim. Biophys. Acta Mol. Basis Dis. 1864(5 Pt A), 1717–1727. doi: 10.1016/j.bbadis.2018.02.016
Van Bokhoven, A., Varella-Garcia, M., Korch, C., Hessels, D., and Miller, G. J. (2001). Widely used prostate carcinoma cell lines share common origins. Prostate 47, 36–51. doi: 10.1002/pros.1045
Van Bokhoven, A., Varella-Garcia, M., Korch, C., Johannes, W. U., Smith, E. E., Miller, H. L., et al. (2003). Molecular characterization of human prostate carcinoma cell lines. Prostate 57, 205–225. doi: 10.1002/pros.10290
Van Leenders, G. J., and Schalken, J. A. (2003). Epithelial cell differentiation in the human prostate epithelium: implications for the pathogenesis and therapy of prostate cancer. Crit. Rev. Oncol. Hematol. 46(Suppl.), S3–S10. doi: 10.1016/s1040-8428(03)00059-3
Van Meerloo, J., Kaspers, G. J., and Cloos, J. (2011). Cell sensitivity assays: the MTT assay. Methods Mol. Biol. 731, 237–245. doi: 10.1007/978-1-61779-080-5_20
Vela, I., and Chen, Y. (2015). Prostate cancer organoids: a potential new tool for testing drug sensitivity. Exp. Rev. Anticancer Therapy 15, 261–263. doi: 10.1586/14737140.2015.1003046
Wang, Y., Hayward, S., Cao, M., Thayer, K., and Cunha, G. (2001). Cell differentiation lineage in the prostate. Differentiation 68, 270–279. doi: 10.1046/j.1432-0436.2001.680414.x
Yang, F., Zhang, Y., Ressler, S. J., Ittmann, M. M., Ayala, G. E., Dang, T. D., et al. (2013). FGFR1 is essential for prostate cancer progression and metastasis. Cancer Res. 73, 3716–3724. doi: 10.1158/0008-5472.can-12-3274
Zhang, K., Zhou, S., Wang, L., Wang, J., Zou, Q., Zhao, W., et al. (2016). Current stem cell biomarkers and their functional mechanisms in prostate cancer. Int. J. Mol. Sci. 17:1163. doi: 10.3390/ijms17071163
Keywords: prostate epithelial cells, prostate cancer, organoids, lineage markers, RNA-seq, EGF
Citation: Cheaito K, Bahmad HF, Jalloul H, Hadadeh O, Msheik H, El-Hajj A, Mukherji D, Al-Sayegh M and Abou-Kheir W (2020) Epidermal Growth Factor Is Essential for the Maintenance of Novel Prostate Epithelial Cells Isolated From Patient-Derived Organoids. Front. Cell Dev. Biol. 8:571677. doi: 10.3389/fcell.2020.571677
Received: 11 June 2020; Accepted: 12 October 2020;
Published: 29 October 2020.
Edited by:
Marzia Di Donato, University of Campania Luigi Vanvitelli, ItalyReviewed by:
Rihan El Bezawy, Istituto Nazionale dei Tumori (IRCCS), ItalyAlexandre Bruni-Cardoso, University of São Paulo, Brazil
Copyright © 2020 Cheaito, Bahmad, Jalloul, Hadadeh, Msheik, El-Hajj, Mukherji, Al-Sayegh and Abou-Kheir. This is an open-access article distributed under the terms of the Creative Commons Attribution License (CC BY). The use, distribution or reproduction in other forums is permitted, provided the original author(s) and the copyright owner(s) are credited and that the original publication in this journal is cited, in accordance with accepted academic practice. No use, distribution or reproduction is permitted which does not comply with these terms.
*Correspondence: Mohamed Al-Sayegh, bWEzODAzQG55dS5lZHU=; Wassim Abou-Kheir, d2ExMkBhdWIuZWR1Lmxi
†These authors have contributed equally to this work and share first authorship
‡Present address: Hisham F. Bahmad, Arkadi M. Rywlin M.D. Department of Pathology and Laboratory Medicine, Mount Sinai Medical Center, Miami Beach, FL, United States