CFD modelling of a wave-mixed bioreactor with complex geometry and two degrees of freedom motion
 Stefan Seidel
 Rüdiger W. Maschke
 Matthias Kraume2
 - 1Institute of Chemistry and Biotechnology, School of Life Sciences and Facility Management, ZHAW Zurich University of Applied Sciences, Wädenswil, Switzerland
- 2Chair of Chemical and Process Engineering, Technische Universität Berlin, Berlin, Germany
Optimizing bioprocesses requires an in-depth understanding, from a bioengineering perspective, of the cultivation systems used. A bioengineering characterization is typically performed via experimental or numerical methods, which are particularly well-established for stirred bioreactors. For unstirred, non-rigid systems such as wave-mixed bioreactors, numerical methods prove to be problematic, as often only simplified geometries and motions can be assumed. In this work, a general approach for the numerical characterization of non-stirred cultivation systems is demonstrated using the CELL-tainer bioreactor with two degree of freedom motion as an example. In a first step, the motion is recorded via motion capturing, and a 3D model of the culture bag geometry is generated via 3D-scanning. Subsequently, the bioreactor is characterized with respect to mixing time, and oxygen transfer rate, as well as specific power input and temporal Kolmogorov length scale distribution. The results demonstrate that the CELL-tainer with two degrees of freedom outperforms classic wave-mixed bioreactors in terms of oxygen transport. In addition, it was shown that in the cell culture version of the CELL-tainer, the critical Kolmogorov length is not surpassed in any simulation.
1 Introduction
Single-use bioreactors, which have either a rigid or flexible plastic cultivation container, are now well established in the upstream processing of biotechnological production processes. They are available from the mL range up to a maximum working volume of 6 m3 (Müller et al., 2021), and are used in research and development as well as for manufacturing of commercial products. When properly selected and handled, single-use bioreactors allow for safer, faster, and more flexible productions than their reusable counterparts (Jossen et al., 2017). However, single-use bioreactors still have limitations, such as the risk of leakages, the potential contribution of leachables and extractables to the final product, and limited instrumentation with single-use sensors (Jossen et al., 2019). Nevertheless, the advantages currently outweigh the disadvantages when using single-use bioreactors.
It is worth mentioning that stirred, orbitally shaken, and wave-mixed single-use bioreactors are most commonly used. The upscalable bioreactor system that has been on the market for the longest is the wave-mixed bioreactor with one degree of freedom (DOF) motion (rotation along the Y-axis). It was launched in 1998 as the WAVE bioreactor 20 (Singh, 1999). The core component of wave-mixed bioreactors with 1 DOF is a rocker with a bag holder on which a pillow-like culture bag is fixed. The culture bag contains the culture medium and cells. As a result of the rotating motion of the rocker, a wave is induced in the culture bag (Werner et al., 2010). In addition, bubble-free surface aeration takes place. Since the foam generated during cultivation is permanently incorporated into the culture medium, there is usually no need to add an antifoam agent in these wave-mixed bioreactors. In wave-mixed bioreactors with 1 DOF, the specific power input (P/V) and thus the hydrodynamic stress acting on the cells can be regulated by adjusting the rocking rate, the rocking angle and the working volume (Eibl et al., 2009a). Oxygen transfer is increased more effectively by increasing the rocking rate and the rocking angle than by increasing the aeration rate. Studies presented in the literature on the bioengineering characterization of wave-mixed bioreactors with 1 DOF and a maximum working volume of up to 500 L have contributed to their extensive use (Eibl and Eibl, 2006; Eibl et al., 2009a,b; Kalmbach et al., 2011; Löffelholz et al., 2013b; Marsh et al., 2017; Bai et al., 2019a,b; Svay et al., 2020; Bartczak et al., 2022). In addition, these bioreactors (e.g., HyPerforma Rocker Bioreactor, ReadyToProcess Wave Bioreactor, Biostat RM Bioreactor) are universally used. They allow for the cultivation of mammalian suspension cells (Kaiser et al., 2015), insect suspension cells (Eibl et al., 2013), plant suspension cell and tissue cultures such as cells, hairy roots, adventitious roots and embryogenic cultures (Palazón et al., 2003; Eibl and Eibl, 2009; Lehmann et al., 2014) and microorganisms (Mikola et al., 2007). It is generally agreed, however, that the primary application of wave-mixed bioreactors with 1 DOF is inoculum production in commercial monoclonal antibody productions. In such cases, the preferred production organisms are transfected Chinese hamster ovary (CHO) cells, but this can cause a wave-mixed bioreactor with 1 DOF to reach its operational limits. This may occur, in production processes where high gas-liquid oxygen mass transfer is needed. This is also the case with fast-growing plant suspension cultures, whose growth is accompanied by strong polysaccharide formation and thus an increase in the viscosity of the culture broth (Eibl et al., 2009b). Similarly, processes where fungi, yeasts or bacteria are grown can exceed the operational limits of wave-mixed bioreactors with 1 DOF. Conversely, in all these cases the wave-mixed CELL-tainer can be advantageous with regard to cell growth and/or product expression.
The CELL-tainer is a bioreactor which is available in the versions Discovery (working volume 0.1 L–3.5 L), Utility (0.15 L–20 L) and Custom_Pro (10 L–200 L), whereby only the Utility version will be discussed here. The system, available in a version for mammalian cell cultures as well as for microorganisms, perfoms a 2 DOF motion (Section 2.1). This allows for higher power input and oxygen transfer compared to the previously described wave-mixed bioreactors with 1 DOF (Oosterhuis et al., 2013). Another feature of the CELL-tainer Utility is its compartmentalization by means of the implemented expansion channels. As a consequence of this and its ability to be operated from 150 mL to 20 L working volume, the CELL-tainer can easily be scaled up linearly. This type of bioreactor has already been used successfully to cultivate plant suspension cells (Gubser et al., 2021), fungal cultures (Kurt et al., 2018), microorganisms (Junne et al., 2013) and mammalian cells (Oosterhuis et al., 2011). It has even demonstrated convincing results in the expansion of bovine satellite cells on microcarriers as the first step in in vitro meat production (Höing et al., 2021). While studies on the experimental determination of key bioprocess parameters (e.g., mixing time ΘM,95, volumetric oxygen mass transfer coefficient kLa, specific power input P/V and hydrodynamic stress) for the CELL-tainer are available (Section 2.4), only one numerical approach for their determination currently exists (Ahmed, 2019). This approach, however, assumes a highly simplified geometry of the culture bag. Therefore, this work focuses on a more accurate geometry approach for CELL-tainer’s cultivation bag using motion capturing (Section 2.1), molding, 3D-scanning of the complex geometry (Section 2.2), computational fluid dynamic (CFD) simulations, and the subsequent verification of the CFD results (Section 2.3).
2 Materials and methods
2.1 Motion capturing
The movement of the CELL-tainer (Utility version, Celltainer Biotech BV, Winterswikj, NL) has 2 DOF, with translation along the X-axis and rotation along the Y-axis (Figure 1) (van der Heiden et al., 2006; Awrejcewicz, 2012). To utilize the complex motion of the CELL-tainer for CFD simulations, an optical motion capture method with passive markers was performed (Gutemberg, 2005). First, a full frame digital single-lens reflex camera (Nikon D750 equipped with a Nikon AF Nikkor 50 mm f/1.8D objective, Nikon Corporation, Tokyo, JP) was calibrated to eliminate radial and tangential distortions (Beauchemin and Bajcsy, 2001). This was done with Python 3.10 and was carried out according to the OpenCV 4.5.4 user guide (OpenCV, 2015; van Rossum, 2022). 15 images of a ten by seven checkerboard were analyzed. Furthermore, the pixel length conversion factor was determined for the locked camera. Subsequently, eight green, dot-shaped, 10 mm markers were placed on the frame of the CELL-tainer (Figure 1). The movement was then recorded for ten periods per setting at a frame rate of 60 fps. The rotation and translation of the markers were evaluated frame by frame using Python 3.10. For this purpose, each frame was converted into a binary image based on its green hue, and then the eight circles were detected using Hough transformation (Hough, 1962; Kimme et al., 1975; OpenCV, 2015). For the rigid transformation, the Kabsch algorithm was applied (Kabsch, 1976, 1993), which minimizes the root mean squared deviation of the rotation matrix R and the translation vector
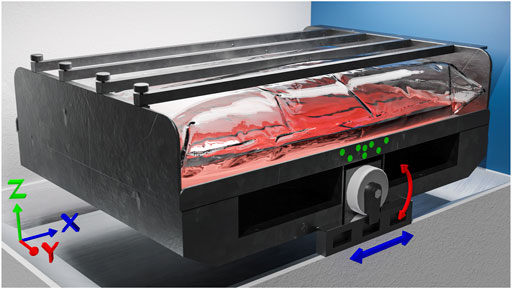
FIGURE 1. Computer generated image (CGI) of the CELL-tainer. The Cartesian coordinate system chosen for the CFD simulations and the movement of the CELL-tainer are illustrated. The movement of the CELL-tainer consists of the translation in X-direction (blue) and the rotation around the Y-axis (red). In addition, the marker positions for the motion capturing method described in Section 2.1 are drawn in green. An animated version including a CFD simulation can be found in the Supplementary Video S1.
The measured values were then smoothed for further use by means of a Savitzky-Golay filter (Savitzky and Golay, 1964), using a window size of eleven data points and a third-degree polynomial. After being evaluated, the data was exported to the SixDegreeOfFreedom format of OpenFOAM (version 9, The OpenFOAM Foundation Ltd, London, United Kingdom).
2.2 Modeling complex geometry
By claming the bag in the holding device, an irregularly shaped bag is created, regardless of whether the expansion channels are used or not. However, since these indentations and buckles could result in an increase in turbulence and better mixing (comparable to the baffles in shake flasks), and since at the same time, they increase the risk of sedimentation at low rocking rates, a 3D geometry, which is as accurate as possible, was needed. In the first step, the bag was clamped in the holding device and gradually filled with leveling compound (Fliesst and Fertig schnell, Lugato GmbH and Co. KG, Barsbüttel, DE). Leveling compound (instead of other typical modeling materials such as gypsum) was selected so that the indentations and buckles in the bag could be replicated as accurately as possible (aided by the lower viscosity of the leveling compound compared to gypsum), while also producing a smooth surface. To accelerate drying, the bag was placed in the CELL-tainer after adding each layer, and both gassing and tempering (1.0 L min−1 and 310.15 K) were turned on. After the bag was completely filled and dried, the bag material was removed, as the reflection of this can reduce the quality when scanning, and the added volume of the plastic layer would have to be subtracted afterwards. The finished model was scanned with a handheld device (EinScan Pro, Shining 3D Tech. Co. Ltd., Hangzhou, CN) and saved as computer aided design (CAD) geometry using the associated software (EXScanPro, Shining 3D Tech. Co. Ltd., Hangzhou, CN). The CAD geometry generated still contained minor inaccuracies on the surface, which were cleaned up by smoothing functions in Blender (version 3.0.7, Stichting Blender Foundation, Amsterdam, NL). For the generation of the mesh, the snappyHexMesh function of the OpenFOAM software was used.
2.3 CFD simulation
OpenFOAM was used for the finite volume method CFD simulations. To model the two-phase system, the volume of fluid (VOF) approach was used, which, according to Seidel et al. (2021), is recommended for continuous two-phase bioreactors (Eqs 2–6). The Navier–Stokes equations correspond to Eq. 2 (conservation of mass) and Eq. 3 (conservation of momentum).
The OpenFOAM solver interFOAM was employed for this purpose, and the PIMPLE algorithm was selected for the pressure-velocity coupling (Holzmann, 2019). The mesh motion was realized via the arbitrary mesh interface, whereby the data from the motion capturing was implemented with the sixDoFMotion function. The motion was interpolated using the spherical linear interpolation (SLERP) algorithm (Shoemake, 1985). Only the movement of the tray was taken into account for the simulation. The bag geometry was kept constant. In reality, the bag would move slightly through the liquid motion even though it is clamped. This effect was neglected because the bag is fixed from four sides (Figure 1). The first 10 s of the simulation were used for the start-up movement of the CELL-tainer. The amplitude of the rotational and translational motion was increased linearly to the final values during this time. The transient simulation was carried out with an adaptive time step, so that a maximum Courant-Friedrichs-Lewy-number (CFL-number) of 0.9 prevailed (Courant et al., 1986). The monotonic difference scheme of van Leer (1974) was generally used, which is of second-order accuracy. An interfacial compression was performed for the phase boundary, which was realized using the piecewise linear interface calculation (PLIC) algorithm (Youngs, 1982). The PLIC algorithm allows a more sophisticated and accurate reconstruction of the surface compared to the standard simple linear interface calculation method (Kawano, 2016; Bureš et al., 2021). For the gradient schemes, the Gauss linear method was generally used. For turbulent simulations, the Reynolds-Averaged-Navier-Stokes approach was used, with Menter’s (1993) k-ω-SST model. To model the surface tension force, the continuum surface force model was used, which takes into account the mean curvature of the interface κ (Brackbill et al., 1992).
To determine the mixing time ΘM,95, a virtual tracer Tm was added to the system, which was analogous to the experimental investigations. The tracer volume was chosen in such a way that it corresponded to the volume of sodium thiosulfate solution used in the decolorization method, which is the recommended method of the DECHEMA expert group for single-use technology (Bauer et al., 2020). For the solution, a convection-diffusion equation without a source or sink term was used (Eq. 7). A diffusion coefficient D of 1⋅10−9 mm2 s−1 was used for all simulations (Rard, 2021). Turbulent diffusivity is not taken into account in the solvers implemented in OpenFOAM. Even though this leads to an additional error, it was not the aim of this research to write an own solver for this purpose.
The simulations were performed with a temperature T of 310.15 K, which corresponds to a density of 993.37 kg m−3 for water (ρwater) and 1.138 kg m−3 for air (ρair). The kinematic viscosity is equivalent to 0.6959⋅10−6 m2 s−1 for water (νwater) and 16.64⋅10−6 m s−2 for air (νair). A surface tension σ of 71.968⋅10−3 N m−1 and a gravitational acceleration
All simulations were run in parallel on a high-performance computing system, as described in Seidel and Eibl (2021), using up to 32 physical cores. Paraview (version 5.10.0) (Ahrens et al., 2005) and Python 3.10 were used for post-processing. In order to make statistically reliable statements about the investigated process parameters and to describe them via a response surface model (RSM), a design of experiment (DoE) was performed for each geometry. The software Modde 13 from Sartorius AG (Göttingen, DE) was used for this purpose. The factors investigated were the rocking rate (5 rpm–25 rpm), the rocking angle (4.80°–16.48°) and the working volume (0.15 L–3.0 L and 3.0 L–20.0 L). The central composite design of Box and Wilson (1951) was used for the study, using the “face-centered” design (CCF). By using formula N = 2k + 2k + cp with k as the number of factors and cp as the number of center points, 15 simulations per geometry were obtained (since no variation in results is expected when simulating at the center point, cp = 1) (Ranade and Thiagarajan, 2017). The CCF design allows data to be fitted to a complete quadratic model and is widely used both in the general literature as well as in the field of CFD (Wang et al., 2018; Betancour et al., 2021; Kaur et al., 2022; Murillo et al., 2022).
2.4 Validation and comparison
Two approaches were taken to evaluate the numerically obtained data. First, bioengineering data and simulations for wave-mixed bioreactors with 1 DOF (rotation along the Y-axis) were considered. Subsequently, existing bioengineering data for the CELL-tainer were evaluated.
Several articles, posters, and conference proceedings deal with bioengineering aspects of the CELL-tainer, but no sufficient characterization exists. Panckow et al. (2018, 2019a, 2019b) investigated the shear stress inside the CELL-tainer by means of droplet analysis. Gómez-Ríos et al. (2019) have compared the shear stress and its impact on Streptomyces clavuligerus of stirred tank reactors with the CELL-tainer. In addition, articles related to the kLa value have been published by Junne et al. (2013), Junne et al. (2016), Oosterhuis et al. (2011), Oosterhuis (2014), Westbrook et al. (2014), and Gómez-Ríos et al. (2019). The mixing time in the CELL-tainer has also been described by Junne et al. (2013), Thomassen et al. (2012), Thomassen (2014) and Westbrook et al. (2014). For her PhD-thesis, Thomassen (2014) performed an experimental, DoE-based investigation of the mixing time, which will be used for the verification in this study. Ahmed (2019) performed numerical investigations regarding fluid flow, mixing time, microcarrier sedimentation, power input, and shear stress. Nevertheless, the oversimplified geometry used may not be sufficient for reliable predictions (Ahmed, 2019).
3 Results and discussion
3.1 CELL-tainer motion
The movement of the CELL-tainer was examined for rocking rates from 5 rpm–25 rpm, in steps of 5 rpm, for all eight possible angle settings. Figure 2 shows an example of the movement over a rotation and translation period (3 s) for the standard setting of 8.2° and 20 rpm. In this figure, the rotation is shown in red and the translation is indicated in blue. Both of these parameters were determined according to Section 2.1. The circle detection via Hough transformation is shown in brown. The rotation and translation obtained by the evaluation are shown as temporal progression and as phase space in Figure 3 (exemplary representation also for 8.2° and 20 rpm). Using all 40 of the analyzed videos, a system of equations was created which describes the time-dependent translation and rotation of the CELL-tainer on the basis of the set angle α and the set rocking rate nsp (Eqs 8, 9). Comparing the standard angle, it is given as 8.5° in the Operation and Installation Manual v2.1 (Cell-Tainer Biotech, 2018), Oosterhuis et al. (2011) specifies in their work an angle of 8°, and Ahmed (2019) an angle of 8.22° (Precision of the data in each case was transferred from the authors). In this study, an angle of 8.20° was found. Furthermore, the angular change which occurs as a result of one change of the screw position was measured as 1.69° in this study, whereas the Operation and Installation Manual (version 2.1) (Cell-Tainer Biotech, 2018) indicates approx. 1.7° and Ahmed (2019) reports 1.67°. Ahmed (2019) changed the translation by exactly 20 mm per screw position. In this work, slightly higher values (1.5% up – 4.8%) were measured. Due to the systematic deviation, a device-specific difference can be assumed.
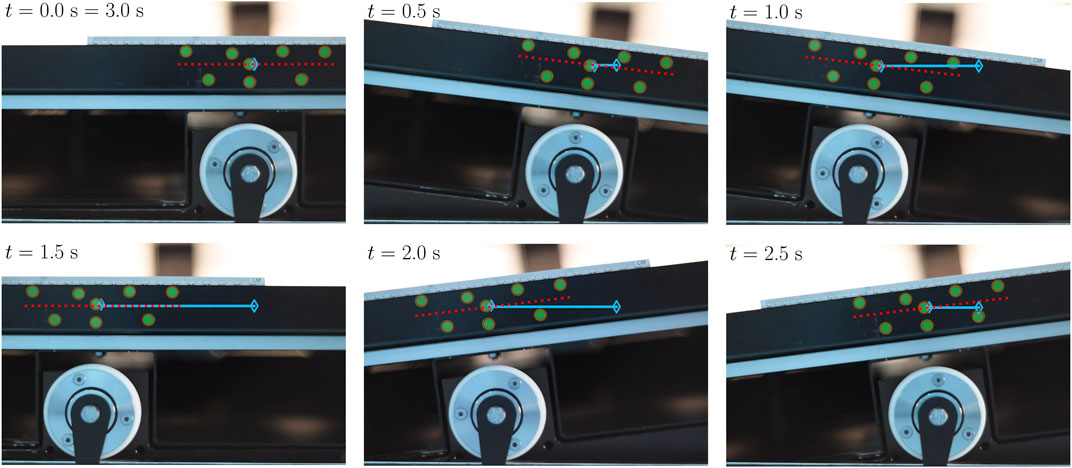
FIGURE 2. The time series shows the CELL-tainer movement over one period (3 s) in six images at a rocking rate of 20 rpm and a set angle of 8.2°. In brown, the respective circle detections via the Hough transformation are shown (detection of the green markers). The red line shows the calculated rotation, and the blue line indicates the relative translation to t = 0, whereby the empty diamond marks the initial position.
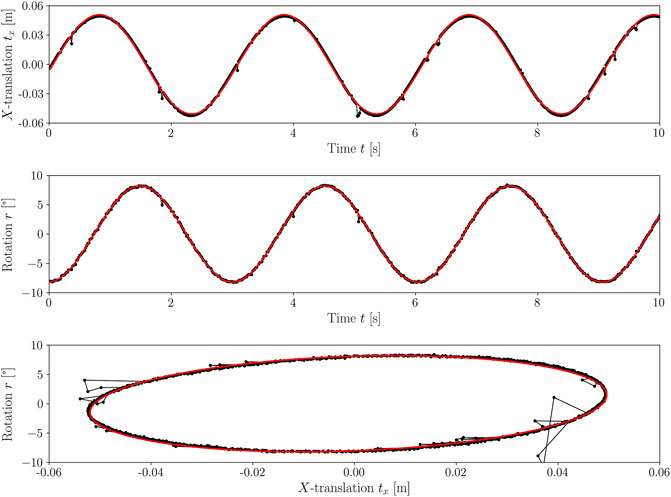
FIGURE 3. The figure shows the movement of the CELL-tainer for a setting of 8.2° and a rocking rate of 20 rpm. The rotation and translation measured by the motion capturing method are shown in black and the filtered and fitted function are shown in red. In the upper part of the sub-figure, the translation of the CELL-tainer is shown, and in the middle the rotation, each for a period of 10 s. The corresponding phase space is shown below.
3.2 Mesh generation and study
Before the computational mesh could be created, a physical rigid model of the CELL-tainer bag had to be created, which was then digitized using a 3D scanner. Figures 4, 5 show the results of the CELL-tainer model generation. In comparison to the bottom of the bioreactor, the surface was not smooth on the top due to minimal air inclusions. Due to the resolution of the 3D scanner, these also appeared in the digital model. In the digital model, however, the air inclusions could be corrected without issue in a post-processing step. The digital model was then used to create the computational mesh. In each case, four different unstructured meshes (M1–M4) with different amounts of cells were created using SnappyHexMesh.
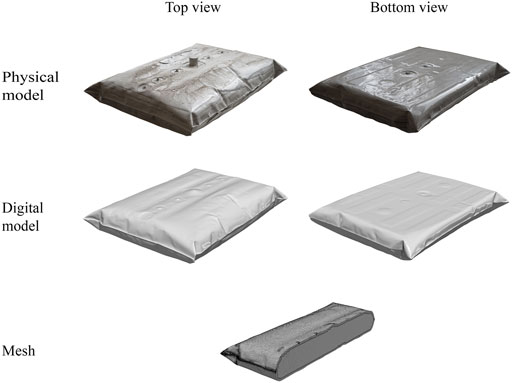
FIGURE 4. From top to bottom, the figure shows the workflow of creating the computational mesh for the CFD simulations for the standard configuration of the CELL-tainer bioreactor. First, the CELL-tainer bag was clamped and filled using leveling compound, resulting in the physical model. It can be seen that on the top of the model, due to air bubble inclusions, it was not possible to achieve as smooth of a surface as in the rest of the model. Second, with the help of the 3D scanner, a digital model was created, which was post-processed with Blender. The digital model was finally used to create the mesh using SnappyHexMesh, with only a half section of the mesh shown here. This allows for the visualization of the wall layers.
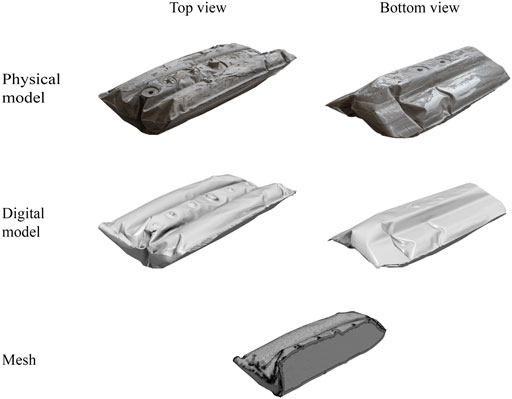
FIGURE 5. Analogous to the workflow shown in Figure 4, the mesh for the CELL-tainer was also created with expansion channels. Here, too, a physical model was first created, which served as a template for the digital model. In this case, the air pockets on the top side were more extreme than in the standard model. However, this was easily fixed in post-processing with Blender. A half section of the mesh is also shown here to visualize the wall layers.
The mesh study was used to determine the discretization error. This is a numerical error which always occurs in CFD and corresponds to the difference between the solution of the partial differential equation (PDE) and that of the discrete approximated PDE (Jasak, 1996; Seidel et al., 2021). The goal was to achieve the smallest possible discretization error while still ensuring an economical computation time. The solution change thereby should lie in the asymptotic range. For this purpose, both a qualitative investigation of the velocity profiles as well as a quantitative investigation which involved calculating the grid convergence index (GCI) by applying the Richardson extrapolation were performed, which is recommended by the OECD Nuclear Energy Agency (2015) and is considered to be the best practice for CFD (Richardson, 1911; Roache, 1994; Cosner et al., 2004). Here, only the mesh study of the standard CELL-tainer configuration will be discussed in more detail. The quantitative mesh analysis of the CELL-tainer with the expansion channels is summarized in Table 1. Figure 6 shows a summary of the results from the qualitative mesh analysis. Figure 6A illustrates the four computational meshes, one below the other, with the cell number increasing from top to bottom. The standard setting at 8.2° was used for the mesh study. 11.5 L of fluid was moved at 10 rpm. Figure 6 shows the CELL-tainer upon reaching 8.2° (and a translation of 10.79 mm). The velocity vectors
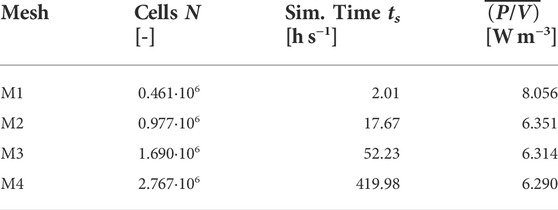
TABLE 1. Overview of the investigated meshes for the standard CELL-tainer design.
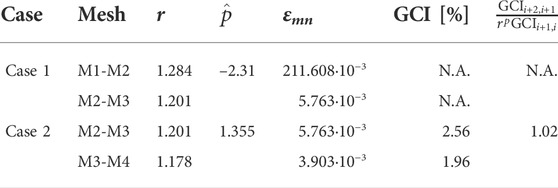
TABLE 2. Overview of GCI analysis for the standard CELL-tainer design.
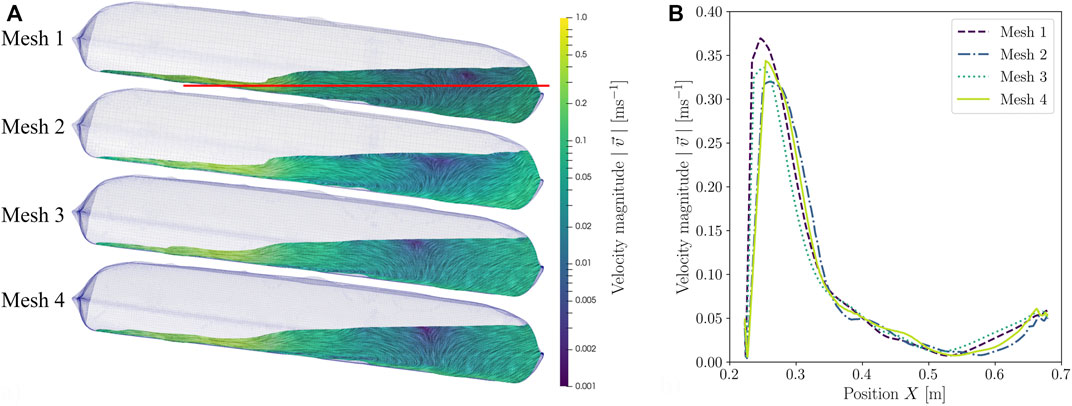
FIGURE 6. Comparison of (A) the fluid flow of CFD simulations with different meshes and (B) the resulting fluid velocities plotted over the red line in (A).
3.3 CFD simulations
3.3.1 Velocity profiles
The velocity profile of the fluid is discussed here, using the standard configuration of the CELL-tainer, with the same phenomena observed in the configuration with expansion channels. Figure 7 shows the mean velocity magnitudes for different operating parameters. If the rocking rate and rocking angle are kept constant, the velocity magnitude oscillations are stronger for low volumes (3.0 L) than for higher volumes (11.5 L and 20.0 L). This phenomenon is due to the force acting on the bioreactor, as this is proportional to the mass, and at constant density, to the volume. As the volume increases, the mean velocity magnitude changes from a pure sine function to an oscillation, resembling a sum of sine functions with different frequencies. Evaluating the results of the simulations visually, it becomes evident that this phenomenon is caused by the breaking of the resulting wave (a video of the phenomenon can be found in the Supplementary Video S1). The simulations also show that as the rocking angle increases, the mean velocity magnitude increases. For example, mean velocity magnitude increases from 0.12 m s−1 at 4.8° to 0.22 m s−1 at 11.52° and 0.29 m s−1 at 16.48°, each at 11.5 L working volume and a rocking rate of 15 rpm. Zhan et al. (2019) makes the same observations in his investigations in the 10 L wave-mixed culture bag (1 DOF motion) and with 4 L working volume, although in this case, a rocking angle of only 4° – 7° was investigated. Due to the different rocking angles, there is also a slight phase shift of the velocity peaks. As a consequence of a higher rocking rate, the oscillation frequency of the mean velocity magnitude increases. In addition, the average velocity magnitude also increases from 0.08 m s−1 at a rocking rate of 5 rpm to 0.39 m s−1 at 25 rpm (0.21 m s−1 at 15 rpm). Werner et al. (2016) describes a similar behavior in their CFD investigations of the 20 L wave-mixed culture bag (10 L working volume, 1 DOF motion). In this case, the mean velocity amount at a rocking angle of 8° increased from 0.08 m s−1 at 16 rpm to 0.24 m s−1 at 30 rpm. Zhan et al. (2019), on the other hand, observed the opposite in their 2D simulations. In their simulations, the mean velocity magnitude decreased, although no explanation for this phenomenon could be described.
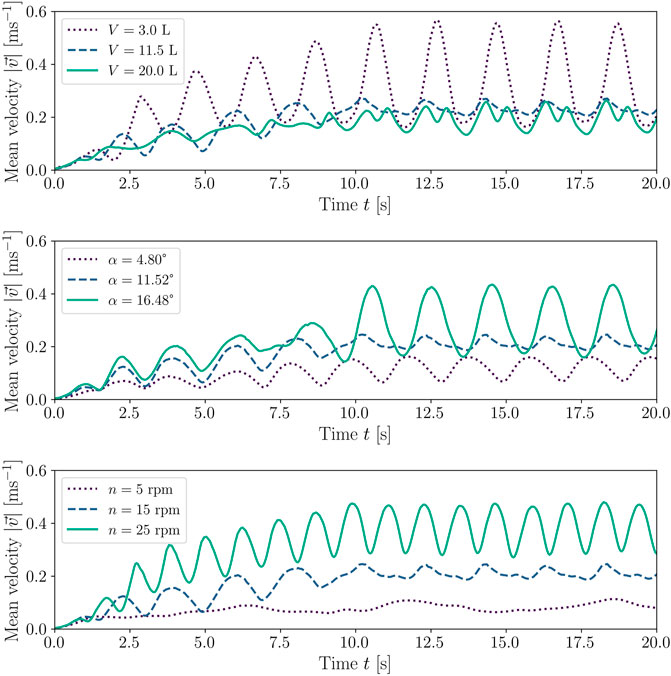
FIGURE 7. Comparison of the mean velocity magnitudes with different operating conditions. The standard configuration of the CELL-tainer was used for the representation. The upper figure shows three CFD simulations with different volumes, where the rocking rate was kept constant at 15 rpm and the rocking angle was kept constant at 11.52°. In the middle figure, the effect of different rocking angles was investigated at constant working volume (11.5 L) and rocking rate (15 rpm). In the lower figure, three different rocking rates at a rocking angle of 11.52° and 11.5 L were investigated.
3.3.2 Power input P/V, energy dissipation rate ɛ and Kolmogorov length scale λk
The specific power input P/V is a key parameter for the bioengineering characterization of bioreactors (Werner et al., 2014). The specific power input serves as an important scale-up criterion and describes the power dissipated in the bioreactor in relation to the working volume. In stirred bioreactors and 1 DOF wave-mixed bioreactors, the power input can be determined via the torque, among other methods (Löffelholz et al., 2013a, 2011; Schirmer et al., 2018). Because of the 2 DOF of the CELL-tainer, the specific power input was determined via the local energy dissipation rate ɛ, Eq. 13 (Kysela et al., 2017). The energy dissipation rate ɛ can be calculated using the k-ω-SST turbulence model via the product of turbulent kinetic energy k, specific dissipation rate ω and the model parameter β* = 0.09, Eq. 14 (Menter, 1993).
However, several authors have claimed that the specific power input is underestimated when the energy dissipation rate is used for the calculation (Ng and Yianneskis, 2000; Hortsch and Weuster-Botz, 2009; Liangchao et al., 2018; Liangchao et al., 2019). Thus, Liangchao et al. (2018) determined up to 50% lower power inputs compared to the determination via torque (experimental and CFD). In contrast to stirred systems, where the power input can be assumed to be constant, the power input oscillates in 1 DOF wave-mixed bioreactors (Bai et al., 2019a; Svay et al., 2020). The same phenomenon was observed in the CELL-tainer bioreactor. Figure 8 shows how the Kolmogorov length scale changes periodically over time, which can be explained by the change in the energy dissipation rate and thus the power input.
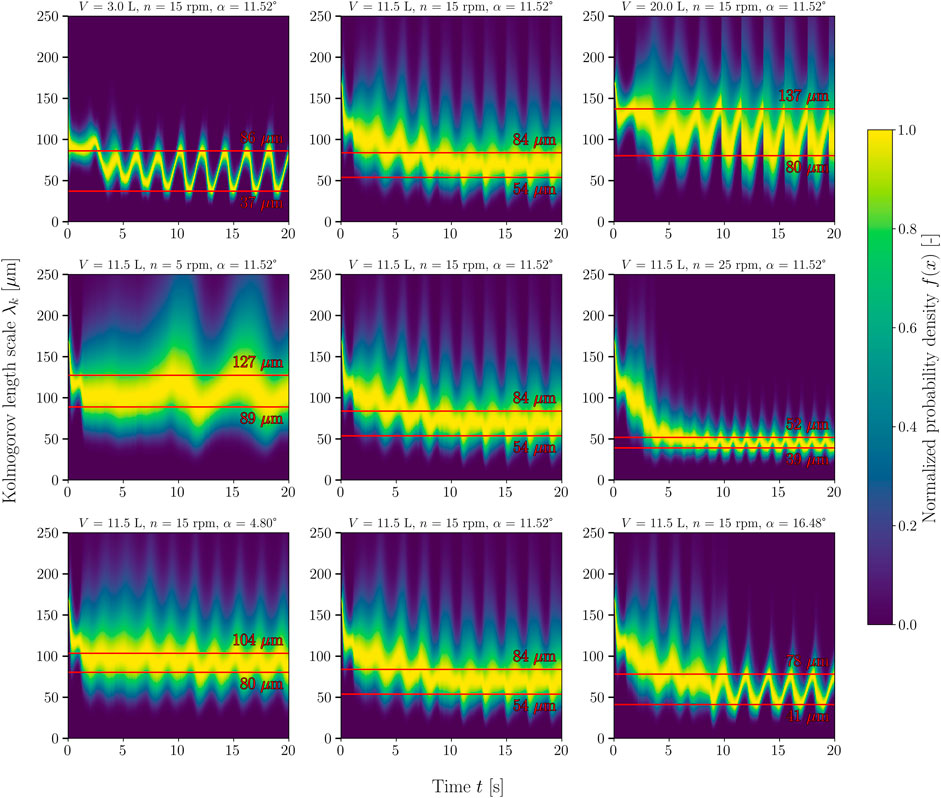
FIGURE 8. Temporal change of the relative probability density function of the Kolmogorov lengths. The respective process parameters are shown as the titles of the individual density maps. In the top row, volume increases from left to right. In the middle row, the rocking rate and, in the bottom row, the rocking angle increase from left to right. In each case, the start-up process described in Section 2.3 can be seen in the first 10 s. The lines marked in red indicate the minimum and maximum mean Kolmogorov lengths (the first 10 s were not taken into account). The frequency density function was normalized so that the maximum frequency density for each time step equals 1.
For the following evaluation, the time-averaged specific power input was used. The maximum value of the mean specific power input over time is 1.5 – 4.5 times higher than the time-averaged mean specific power input. Using the DoE approach, an RSM was generated by multilinear regression for the two CELL-tainer configurations. The contour plots are shown in Figure 9 and correspond to Eq. 15. For the regression, only model terms that have a statistically significant influence on the average power input were used (αs = 0.05). The specific power input increases with an increasing rocking angle, rocking rate, and decreasing working volume and varies from 9.3 W m−3 – 336.7 W m−3 in the standard configuration (33 W m−3 – 677 W m−3 in the configuration with expansion channels). The standard configuration of the cell culture CELL-tainer version thus covers the full range of typical averaged power inputs from 10 W m−3 – 250 W m−3 for mammalian cell cultures and is comparable to 1 DOF wave-mixed bioreactors (Eibl and Eibl, 2009; Platas Barradas et al., 2012; Nienow et al., 2013a; Jossen et al., 2017). Bai et al. (2019a) described the same dependence for 1 DOF wave-mixed bioreactors, using a digital multimeter to measure the DC current at a constant 24 V DC voltage to determine the power input. Since their investigation involved a rocking rate of up to 40 rpm, specific power inputs of up to 720 W m−3 were measured. The ratio of maximum to average specific power input (3 L working volume) was 1.1 – 6.0, which is comparable to the results in CELL-tainer. Using the calorimetric method, Jones et al. (2017) determined similar power inputs for the Wave bioreactor with 2 L working volume (64 W m−3 – 633 W m−3), where measurements were also made up to a rocking rate of 40 rpm. Eibl et al. (2009a) modeled the power input using a static model and described the specific power input for the BioWave (today Biostat RM 25/50 Sartorius AG, Göttingen, DE) to have a range from 8 W m−3 to 561 W m−3 (0.2 L – 1 L working volume, 6 rpm – 30 rpm and 7° – 10°). Werner et al. (2016) have calculated the average power inputs of 49 W m−3 – 551 W m−3 for V = 2 L and 14.1 W m−3 – 290.6 W m−3 for 10 L working volume through CFD investigations. Werner et al. (2016) and Svay et al. (2020) used different numbers of mesh cells for a 20 L wave-mixed bioreactor with 1 DOF. Svay et al. (2020) used 0.8⋅106 cells, in this study 0.977⋅106 cells were used for the 20 L CELL-tainer. Werner et al. (2016) used the most cells with 1.92⋅106, whereby only an optical evaluation of the mesh study was carried out. Panckow et al. (2019) also carried out CFD investigations (no statement was made about the mesh size) to determine the power input in the CELL-tainer and obtained comparable values. Panckow et al. (2019) predicted a specific power input of 54.8 W m−3 (V = 10 L, n = 20 rpm, α = 4.9°) and the RSM developed here predicts a specific power input of 54.1 W m−3 (the power input of Panckow et al. (2019) was taken from Figure 4 of his publication. For this purpose 100 data points of the temporal representation of the power input were digitized and integrated with the trapezoidal rule and divided by the time span). If the microbial version of the CELL-tainer was to be investigated, significantly higher specific power inputs would be determined, since the rocking rate in that version ranges up to 45 rpm.
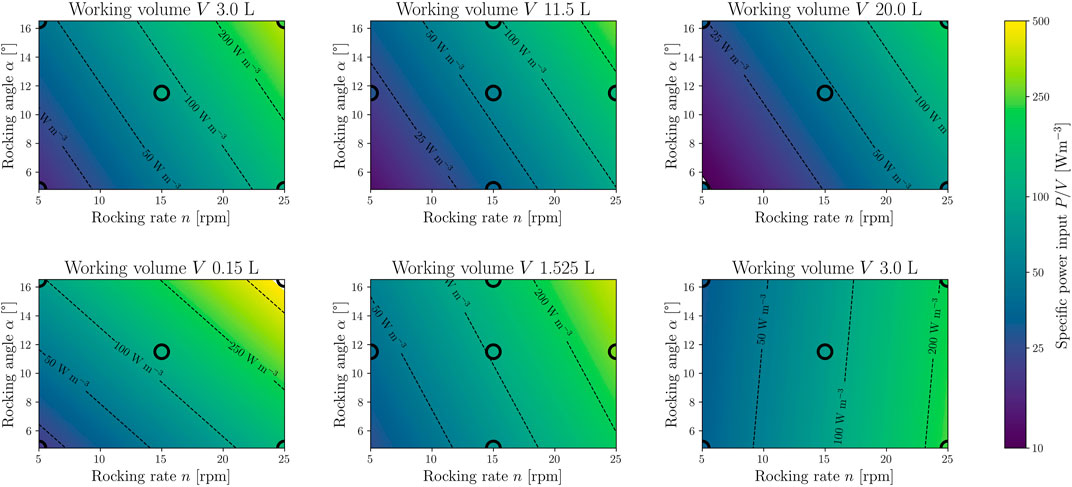
FIGURE 9. Response surface model (RSM) for the time-averaged specific power input. The top row shows the model for the standard CELL-tainer configuration (N = 15, DF = 11, R2 = 0.83, RMSE = 0.89 W m−3) with three different working volumes (3.0 L, 11.5 L and 20.0 L). The lower row shows the RSM (N = 15, DF = 10, R2 = 0.90, RMSE = 2.05 W m−3) for the configuration with expansion channels (0.15 L, 1.525 L and 3.0 L). The black circles mark process parameter settings on which CFD simulations were performed to create the model, and the filling color corresponds to the exact value of the CFD simulation.
Not only the ratio of maximum to time-averaged specific power input can be investigated, but also the ratio of maximum to averaged energy dissipation rate at a specific time. In the literature, this ratio is called hydrodynamic heterogeneity Φ and provides an indication of how homogeneously the power input is distributed in the system (Zhang et al., 2009; Liu et al., 2016). Thus, the hydrodynamic heterogeneity in stirred bioreactors is high, as the power is only introduced locally by the stirrer under unaerated conditions, and can reach up to Φ ≈ 100 depending on the stirrer (Kieran et al., 2000). Orbitally shaken systems, which are systems with homogeneous power input, are in the range of Φ ≈ 1 – 18 (Büchs and Zoels, 2001; Liu et al., 2016). As expected, wave-mixed systems lie in between. Svay et al. (2020) posit that the highest energy dissipation values occur at the gas/liquid interface. In their investigations, the same behavior was observed, and hydrodynamic heterogeneities of Φ = 8.8 – 32 were determined.
The Kolmogorov length scale λk can be derived directly from the turbulent energy dissipation rate ɛ and, according to Kolmogorov’s microscale theory, corresponds to the smallest vortex of the vortex cascade at which the turbulent kinetic energy dissipates into thermal energy (Nienow, 2021). The Kolmogorov length scale can be calculated for each mesh cell (Eq. 16). From this, a frequency distribution can be determined which is weighted by the mesh cell size, and its probability density function (PDF) can be derived. The PDF is typically log-normal distributed. This representation of hydrodynamic stress is often used for steady-state CFD simulations of stirred bioreactors. Kaiser et al. (2011b) and Jossen (2020) used this representation to represent the shear gradient distribution and Loubière (2018) and Berry et al. (2016) for the presentation of the Kolmogorov length distribution. As with the specific power input, it cannot be assumed that the PDF is constant over time. The change in PDF over time is depicted on the density maps with a temporal resolution of 0.04 s, showing three different volumes, rocking rates and rocking angles (Figure 8). For cell cultures, critical Kolmogorov length scales are lengths smaller than the cell diameter, which for example is approximately 18 µm for CHO cells (Nienow, 2006; Nienow et al., 2013b; Maschke et al., 2022). In this study, it was shown that no process parameter setting results in critical Kolmogorov lengths for mammalian cell cultures. The lower the working volume and the higher the rocking rate, the narrower the PDF of the Kolmogorov lengths gets.
3.3.3 Volumetric oxygen mass transfer coefficient kLa
Oxygen supply is of crucial importance for many cell cultures. If the volumetric oxygen mass transfer coefficient kLa in a system and the specific oxygen uptake rate
As there is no forced aeration via a sparger, lower kLa-values are expected, which are comparable to 1 DOF wave-mixed bioreactors. The determined time-averaged kLa-values were used to create an RSM, with one model for each of the two CELL-tainer configurations. The RSMs are shown in Figure 10 and correspond to Eq. 18. As already described in Section 3.3.2, only model terms that have a statistically significant influence on the kLa-value were considered (αs = 0.05). In the investigated design region, kLa-values are predicted from 24 h−1 – 192.8 h−1 (23 h−1 – 495 h−1 with expansion channels). The smaller the working volume, the higher the specific surface area and thus the kLa-value. Likewise, higher rocking rates and rocking angles lead to higher kLa-values. Similar dependencies of the kLa-value on the process parameters were found by various authors for 1 DOF wave-mixed bioreactors. Svay et al. (2020) and Mikola et al. (2007) showed that the kLa-values in the 1 DOF wave-mixed bioreactor increase with higher rocking rate and rocking angle (no statements were made about the working volume). In addition to these influences, Bai et al. (2019a) and Werner et al. (2013) (orbitally shaken bag) were also able to show that the kLa-value increases with decreasing volume.
It was confirmed in the present study, as stated by Zijlstra and Oosterhuis (2010), that the kLa-value for the standard configuration of the cell culture version ranges up to 200 h−1 (192.8 h−1 modelled). However, higher kLa-values, such as those described by Junne et al. (2013) (kLa ≥450 h−1) and Oosterhuis and van der Heiden (2010) (kLa ≥700 h−1), could not be achieved with the cell culture version of the CELL-tainer, as the rocking rate was limited to 25 rpm.
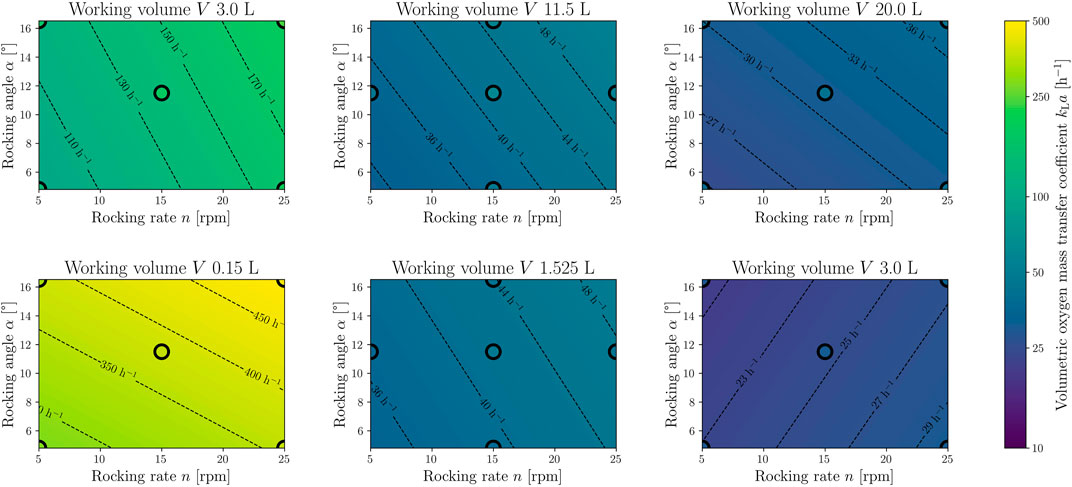
FIGURE 10. Response surface model (RSM) for the time-averaged volumetric oxygen mass transfer coefficient. The top row shows the model for the standard CELL-tainer configuration (N = 15, DF = 9, R2 = 0.99, RMSE = 1.77 h−1) with three different working volumes (3.0 L, 11.5 L and 20.0 L). The lower row shows the RSM (N = 15, DF = 9, R2 = 0.99, RMSE = 1.94 h−1) for the configuration with expansion channels (0.15 L, 1.525 L and 3.0 L). The black circles mark process parameter settings on which CFD simulations were performed to create the model, and the filling color corresponds to the exact value of the CFD simulation.
Using the RSM and extrapolating beyond the model limits indicates a kLa-value of 225 h−1 at 30 rpm, 12° and 2.5 L, which corresponds to the findings from Westbrook et al. (2014) with (204.0 ± 21.5) h−1. Gómez-Ríos et al. (2019) does not specify the rocking angle used in his work, but if the standard angle of 8.2° was used, then the simulated kLa-values from the present study match his findings. Using the RSM, a kLa-value of 85.4 h−1 can be predicted and Gómez-Ríos et al. (2019) predicted a kLa-value of (73.25 ± 7.40) h−1 with the same settings (12 rpm, 8.2° and 5 L). In a similar investigation, Demay et al. (2011) presented a kLa measurement of 82 h−1 (20 rpm, 16.48° and 7 L) which also verifies the results of the RSM, with a predicted a kLa-value of 85 h−1.
The kLa-value in stirred reactors is often described by the equation of van’t Riet (1979) as a function of the specific power input and the superficial gas velocity (Yawalkar et al., 2008; Pan et al., 2018; Kreitmayer et al., 2022). Such a relationship has not yet been described for wave-mixed bioreactors. However, it is possible to describe the kLa-value in the two CELL-tainer configurations using a modified van’t Riet equation (Eq. 19). Instead of the superficial gas velocity, the relative working volume Vr (based on the total volume of 26.25 L for the standard configuration and 14.15 L with expansion channels) and thus the aerated headspace is taken into account. The equations derived here describe the kLa-value with a relative error of 7.7% (respectively 6.7% with expansion channels) compared to the directly simulated kLa-value. Compared to the description via the RSM, the deviations are slightly higher (4.2% in the standard version and with expansion channels), but the kLa-value can be described via physical properties.
The determination of the specific surface area a should be accurate due to the PLIC algorithm. However, the choice of the kL-model significantly influences the kLa-value (Seidel and Eibl, 2021). The kLa-value is generally lower (1 h−1–20 h−1) in 1 DOF wave-mixed bioreactors than in the CELL-tainer, which in combination with the low-stress movement (Section 3.3.2) makes it excellently suited for the cultivation of mammalian cells (Singh, 1999; Mikola et al., 2007; Eibl et al., 2009a). Even ultra-high cell densities around 200⋅106 cells mL−1 could be achievable (Müller et al., 2022).
3.3.4 Mixing time
The mixing time is crucial to the bioengineering description of the system, as poor mixing of the system could lead to zones of limited growth and production. The mixing time was determined analogous to the DECHEMA expert group recommendation for mixing time determination in single-use bioreactors (Bauer et al., 2020). Instead of the 4 mL L−1 thiosulfate, 4 mL L−1 tracer was used, which was added in each case in the same bioreactor position (maximum deflection in the X-direction and 0° rotation) and in each case as a cube below the liquid surface (Figure 11). To determine the mixing time, the widely used ΘM,95 was used, which describes the time to reach 95% homogeneity M in each cell (Eq. 20) (Kaiser et al., 2011a; Bach et al., 2017; Ebrahimi et al., 2019; Martinetz et al., 2021).
The volume-rendered results of the simulations in Figure 11 show how the tracer concentration changes over time. It is evident that rapid mixing occurs in the rocking direction. Werner et al. (2016) were previously able to describe this for 1 DOF wave-mixed systems. Werner et al. (2016) also described poorer mixing orthogonal to the rocking direction, which is also visible here. The determined mixing times were used to create the RSM (Eq. 21 and Figure 12). The mixing times ΘM,95 range from 11.8 s to 112.4 s (4.6 s and 22.4 s with expansion channels).
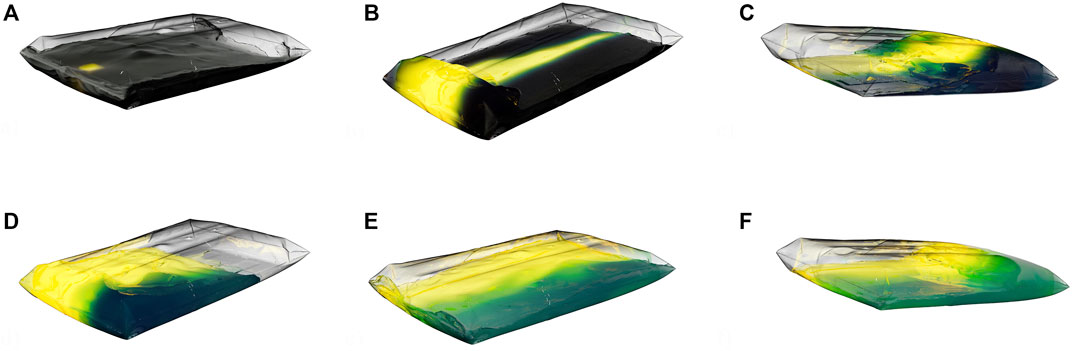
FIGURE 11. The volume-rendered CGI show the concentration change of the tracer over time. The simulation at 11.5 L, 25 rpm and 16.48° is shown. (A) The tracer (yellow) was added at t = 0 s (after the start-up phase and 10 complete revolutions). Images (B) (t = 1.5 s) and (C) (t = 3 s) show rapid mixing in the rocking direction. Images (D–F) (t = 4.5 s, t = 6 s, t = 7.5 s) show the slower mixing in the orthogonal direction. The Viridis color map was used for representation.
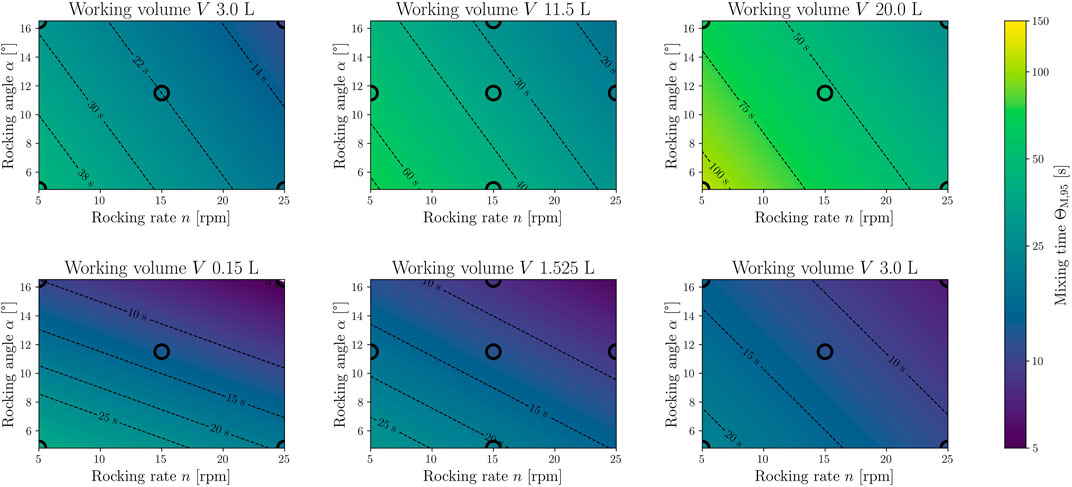
FIGURE 12. Response surface model (RSM) for the global mixing time ΘM,95. The top row shows the model for the standard CELL-tainer configuration (N = 15, DF = 9, R2 = 0.88, RMSE = 1.45 s) with three different working volumes (3.0 L, 11.5 L and 20.0 L). The lower row shows the RSM (N = 15, DF = 9, R2 = 0.89, RMSE = 1.18 s) for the configuration with expansion channels (0.15 L, 1.525 L and 3.0 L). The black circles mark process parameter settings on which CFD simulations were performed to create the model, and the filling color corresponds to the exact value of the CFD simulation.
If the results are compared with experimental investigations from Panckow et al. (2019), it becomes apparent that there are very strong similarities between experimental findings and simulations for different volumes and rocking angles at moderate and high rocking rates. The deviation is therefore in the range of between 0.85% (experiment: 18.4 s, CFD: 18.25 s at 5 L, 25 rpm and 8.2°) and 24.6% (experiment: 46.5 s, CFD: 37.3 s at 5 L, 12.5 rpm and 4.8°), which is comparable to other CFD investigations in stirred bioreactors. Most of the mixing times investigated by Kaiser (2014), which were determined with CFD, differed between 0% and 14.7% from the experimental investigations. However, there were also individual deviations of up to 42% (Kaiser, 2014). It is however evident that the deviation between experiment and CFD increases with decreasing rocking rate, whereby the results of the simulations underestimate the mixing times. For example, at 5 rpm (8.2° and 5 L) the deviation rises to above 50%. Bujalski et al. (2002) was able to show that the addition point has a significant influence on the mixing time. Since, compared to the experiments, the tracer is already completely in the liquid at the time of addition and is not added at the surface, the mixing time could be underestimated in the simulations. This effect could have been extremely negative, especially with very slow mixing. In addition, it is not known where in the CELL-tainer and at which rotational position the tracer was added. The method chosen for the experimental determination of the mixing time also influences the result (Nienow, 1997).
Junne et al. (2013) also determined the mixing time experimentally using pH measurements. The rocking angle used was not specified. These mixing times are shorter than those found in experiments from Panckow et al. (2019), which would suggest that the maximum angle of 16.48° was used rather than 4.8° and 8.2°. This would also be consistent with the simulations in this study. The RSM predicts a mixing time of 12.99 s and Junne et al. (2013) recorded a time of 12.54 s at 5 L, 25 rpm and probably 16.48° (or extrapolated 13.43 s at 35 rpm, 15 L and 16.48° compared to the measured 13.18 s). Junne et al. (2013) did not investigate low rocking rates, but it can be assumed that at such speeds the CFD simulations would also deviate more from the experiments and underestimate the mixing time. Thomassen et al. (2012) predict through their DoE that the vertical displacement squared is a statistically significant model term for modelling the mixing time. This is analogous to the rocking angle used here (see Figure 3). In the simulations carried out here, this model term had no statistically significant influence on the mixing time. Thomassen et al. (2012) also use the rather unconventional ΘM,85 criterion, which makes comparison difficult. Nevertheless, the trend remains that the mixing times at very low rocking rates are underestimated by simulations.
When mixing time is represented as a function of the specific power input, it can be seen that the mixing time for classical 1 DOF wave-mixed bioreactors is longer than for the CELL-tainer for the same specific power input (Figure 13). When the mixing time of the CELL-tainer is compared to those of stirred bioreactors, it can be seen that the mixing time for both CELL-tainer configurations are longer than for stirred cell culture bioreactors with similar working volumes. Löffelholz et al. (2013b) investigated larger systems than the CELL-tainer, where there is an overlap in the mixing time function, although in general it can also be assumed that the mixing time is longer in the CELL-tainer than in stirred bioreactors with the same specific power input.
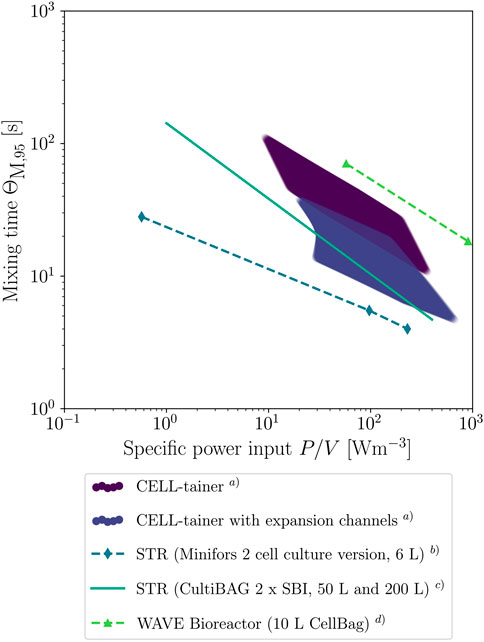
FIGURE 13. Mixing time as a function of the specific power input for different systems. a) Values were derived from RSM Eqs 15, 21 for all combinations of rocking rate, working volume and rocking angle. b) Measured values of Maschke and Eibl (2019). c) Regression of various measurements with two segment blade impeller (SBI) of Löffelholz et al. (2013b). d) Measurements of Jones et al. (2017) for a rocking angle of 10°.
4 Conclusion
In this work, methods were developed that allow for a complete bioengineering characterization of bioreactors with complex motion and shape to be carried out using numerical methods only. For this purpose, the CELL-tainer bioreactor was characterized in the cell culture version and compared with experiments described in the literature. Using a digital single-lens reflex camera and the written algorithm, the exact 2 DOF profile of the CELL-tainer was recorded and digitized. The geometry was replicated both with and without expansion channels with the help of leveling compound, and the digitized using a 3D scanner. This method allows for the complex geometry of a non-rigid bioreactor to be exactly reproduced on a computer (ignoring the potential deformation of the bioreactor due to the liquid motion). Together with the recorded motion, an accurate CFD model was created. Using the VOF approach, the mean power input, the temporal Kolmogorov length scale distribution, the mean volumetric oxygen mass transfer coefficient and the mixing time were determined. With the help of the created RSMs, the entire operating range of the CELL-tainer (cell culture version) can be described. The characterization can now be used to optimize bioprocesses in the CELL-tainer bioreactor. It could be demonstrated that for mammalian cell cultures no process parameter configuration and at no time, the critical Kolmogorov length scale was understepped. Furthermore, it was shown that the CELL-tainer is superior to 1 DOF wave-mixed bioreactors in terms of oxygen transfer. The procedure described here for motion capture and geometry acquisition can easily be used to characterize other systems using CFD as well.
Data availability statement
The raw data supporting the conclusions of this article will be made available by the authors, without undue reservation.
Author contributions
SS: Conceptualization, Methodology, Software, Validation, Formal analysis, Investigation, Writing—Original Draft, Visualization; RM: Writing—Original Draft, Validation, Data Curation, Resources; MK: Writing—Review and Editing; DE: Writing—Review and Editing; RE: Writing—Review and Editing.
Funding
Open access funding provided by Zurich University of Applied Sciences (ZHAW).
Acknowledgments
We would like to thank Lia Rossi for assisting in mold casting, Jason Parry for English proofreading and Tutku Kurt for support with the CELL-tainer operation.
Conflict of interest
The authors declare that the research was conducted in the absence of any commercial or financial relationships that could be construed as a potential conflict of interest.
Publisher’s note
All claims expressed in this article are solely those of the authors and do not necessarily represent those of their affiliated organizations, or those of the publisher, the editors and the reviewers. Any product that may be evaluated in this article, or claim that may be made by its manufacturer, is not guaranteed or endorsed by the publisher.
Supplementary material
The Supplementary Material for this article can be found online at: https://www.frontiersin.org/articles/10.3389/fceng.2022.1021416/full#supplementary-material
Abbreviations
CAD, Computer aided design; CCF, Central composite design; CFD, Computational fluid dynamics; CFL, Courant-Friedrichs-Lewy; CGI, Computer generated image; CHO, Chinese hamster ovary; DoE, Design of experiment; DOF, Degree of freedom; GCI, Grid convergence index
PDE, Partial differential equation; PDF, Probability density function; PLIC, piecewise linear interface compression; RSM, Response surface model; SLERP, Spherical linear interpolation; VOF, Volume of fluid.
References
Ahmed, H. (2019). Characterisation of the flow field in a rocking single-use bioreactor using computational fluid dynamics. Berlin: Technische Universität Berlin Master Thesis.
Ahrens, J., Geveci, B., and Law, C. (2005). “ParaView: An end-user tool for large-data visualization,” in Visualization handbook (Burlington: Elsevier), 717–731. doi:10.1016/B978-012387582-2/50038-1
Awrejcewicz, J. (2012). “Kinematics of a rigid body and composite motion of a point,” in Classical mechanics, kinematics and statics (New York: Springer), 263. doi:10.1007/978-1-4614-3791-8_5
Bach, C., Yang, J., Larsson, H., Stocks, S. M., Gernaey, K. V., Albaek, M. O., et al. (2017). Evaluation of mixing and mass transfer in a stirred pilot scale bioreactor utilizing CFD. Chem. Eng. Sci. 171, 19–26. doi:10.1016/j.ces.2017.05.001
Bai, Y., Moo-Young, M., and Anderson, W. A. (2019b). A mechanistic model for gas–liquid mass transfer prediction in a rocking disposable bioreactor. Biotechnol. Bioeng. 116, 1986–1998. doi:10.1002/bit.27000
Bai, Y., Moo-Young, M., and Anderson, W. A. (2019a). Characterization of power input and its impact on mass transfer in a rocking disposable bioreactor. Chem. Eng. Sci. 209, 115183. doi:10.1016/j.ces.2019.115183
Baker, N., Kelly, G., and O’Sullivan, P. D. (2020). A grid convergence index study of mesh style effect on the accuracy of the numerical results for an indoor airflow profile. Int. J. Vent. 19, 300–314. doi:10.1080/14733315.2019.1667558
Bartczak, M., Wierzchowski, K., and Pilarek, M. (2022). Mixing performance in a litre-scale rocking disposable bioreactor: DoE-based investigation of mixing time dependence on operational parameters. Chem. Eng. J. 431, 133288. doi:10.1016/j.cej.2021.133288
Bauer, I., Dreher, T., Eibl, D., Glöckler, R., Husemann, U., John, G. T., et al. (2020). Recommendations for process engineering characterisation of single-use bioreactors and mixing systems by using experimental methods (DECHEMA, Gesellschaft für Chemische Technik und Biotechnologie e.V.). Frankfurt am Main: DECHEMA Gesellschaft für Chemische Technikund Biotechnologie e.V.. second edn.
Beauchemin, S. S., and Bajcsy, R. (2001). “Modelling and removing radial and tangential distortions in spherical lenses,” in Multi-image analysis. Editors G. Reinhard Klette, and T. H. Gimel’farb (Berlin, Heidelberg: Springer), 1–21. doi:10.1007/3-540-45134-X_1
Berry, J., Liovic, P., Šutalo, I., Stewart, R., Glattauer, V., and Meagher, L. (2016). Characterisation of stresses on microcarriers in a stirred bioreactor. Appl. Math. Model. 40, 6787–6804. doi:10.1016/j.apm.2016.02.025
Betancour, J., Velasquez, L., Jaramillo, L., Chica, E., and Rubio-Clemente, A. (2021). Application of a central composite face-centered design in the optimization of an Archimedean hydrokinetic turbine. Renew. Energy Power Qual. J. 19, 418–422. doi:10.24084/repqj19.308
Box, G. E. P., and Wilson, K. B. (1951). On the experimental attainment of optimum conditions. J. R. Stat. Soc. Ser. B Methodol. 13, 1–38. doi:10.1111/j.2517-6161.1951.tb00067.x
Brackbill, J., Kothe, D., and Zemach, C. (1992). A continuum method for modeling surface tension. J. Comput. Phys. 100, 335–354. doi:10.1016/0021-9991(92)90240-Y
Büchs, J., and Zoels, B. (2001). Evaluation of maximum to specific power consumption ratio in shaking bioreactors. J. Chem. Eng. Jpn. 34, 647–653. doi:10.1252/jcej.34.647
Bujalski, J., Jaworski, Z., Bujalski, W., and Nienow, A. (2002). The influence of the addition position of a tracer on CFD simulated mixing times in a vessel agitated by a rushton turbine. Chem. Eng. Res. Des. 80, 824–831. doi:10.1205/026387602321143354
Bureš, L., Sato, Y., and Pautz, A. (2021). Piecewise linear interface-capturing volume-of-fluid method in axisymmetric cylindrical coordinates. J. Comput. Phys. 436, 110291. doi:10.1016/j.jcp.2021.110291
Cabral, B., and Leedom, L. C. (1993). “Imaging vector fields using line integral convolution,” in Proceedings of the 20th annual conference on Computer graphics and interactive techniques - siggraph ’93 (New York, New York, USA: ACM Press), 263–270. doi:10.1145/166117.166151
Cell-Tainer Biotech, B. V. (2018). Operation & installation manual V2. Winterswijk: Celltainer Biotech BV, 1.
Cosner, R., Oberkampf, W., Rahaim, C., and Shih, T. (2004). “AIAA committee on standards for computational fluid dynamics - status and plans,” in 42nd AIAA aerospace Sciences meeting and exhibit (Reston, Virigina: American Institute of Aeronautics and Astronautics). doi:10.2514/6.2004-654
Courant, R., Friedrichs, K., and Lewy, H. (1986). Über die partiellen differenzengleichungen der mathematischen Physik. Math. Ann. 53, 53–95. doi:10.1007/978-1-4612-5385-3_7
Demay, S., Exbrayat, G., Chaudet, N., Roze, D., Jourdat, C., and Guillaume, J.-M. (2011). Single-use bioreactors for bacterial fermentation : Evaluation of different technologies for cultures of aerobic and anaerobic strains from 3L to 200L scale (sanofi pasteur). Marcy l’Etoile: sanofi pasteur.
Ebrahimi, T., Villegas, C., and Ein-Mozaffari, C. (2019). Application of CFD to analyze the hydrodynamic behaviour of a bioreactor with a double impeller. Processes 7, 694. doi:10.3390/pr7100694
Eibl, D., and Eibl, R. (2009). “Bioreactors for mammalian cells: General overview,” in Cell and tissue reaction engineering. Editors R. Eibl, D. Eibl, R. Pörtner, G. Catapano, and P. Czermak (Berlin, Heidelberg: Springer). 55–82. doi:10.1007/978-3-540-68182-3_3
Eibl, R., and Eibl, D. (2006). “Design and use of the wave bioreactor for plant cell culture,” in Plant tissue culture engineering (Berlin, Heidelberg: Springer), 203–227. doi:10.1007/1-4020-3694-9_12
Eibl, R., Steiger, N., Wellnitz, S., Vicente, T., John, C., and Eibl, D. (2013). Fast Single-Use VLP Vaccine Productions Based on Insect Cells and the Baculovirus Expression Vector System: Influenza as Case Study, 99–125. doi:10.1007/10_2013_186
Eibl, R., Werner, S., and Eibl, D. (2009a). Bag Bioreactor Based on Wave-Induced Motion: Characteristics and Applications. Berlin: Springer, 55–87. doi:10.1007/10_2008_15
Eibl, R., Werner, S., and Eibl, D. (2009b). Disposable bioreactors for plant liquid cultures at Litre-scale. Eng. Life Sci. 9, 156–164. doi:10.1002/elsc.200800102
Garcia-Ochoa, F., and Gomez, E. (2009). Bioreactor scale-up and oxygen transfer rate in microbial processes: An overview. Biotechnol. Adv. 27, 153–176. doi:10.1016/j.biotechadv.2008.10.006
Gómez-Ríos, D., Junne, S., Neubauer, P., Ochoa, S., Ríos-Estepa, R., and Ramírez-Malule, H. (2019). Characterization of the metabolic response of Streptomyces clavuligerus to shear stress in stirred tanks and single-use 2D rocking motion bioreactors for clavulanic acid production. Antibiotics 8, 168. doi:10.3390/antibiotics8040168
Gubser, G., Vollenweider, S., Eibl, D., and Eibl, R. (2021). Food ingredients and food made with plant cell and tissue cultures: State-of-the art and future trends. Eng. Life Sci. 21, 87–98. doi:10.1002/elsc.202000077
Gutemberg, G.-F. B. (2005). Optical motion capture: Theory and implementation. J. Theor. Appl. Inf. 12, 61.
Höing, T., Kurt, T., and Moutsatsou, P. (2021). “Cultured meat production in a rocking bioreactor,” in 6th BioProScale symp Berlin.
Holzmann, T. (2019). Mathematics, numerics, Derivations and OpenFOAM® (holzmann CFDBad Wörishofen. doi:10.13140/RG.2.2.27193.36960
Hortsch, R., and Weuster-Botz, D. (2009). Power consumption and maximum energy dissipation in a milliliter-scale bioreactor. Biotechnol. Prog. 26, 595–599. doi:10.1002/btpr.338
Hough, P. V. C. (1962). Method and means for recognizing complex patterns. Ann Arbor: U.S. Department of Energy Office of Scientific and Technical Information. US3069654A.
Jasak, H. (1996). Error analysis and estimation for the finite volume method with applications to fluid flows. London: Ph.D. thesis, Imperial College of Science, Technology and Medicine.
Jiang, L., Diao, M., Sun, H., and Ren, Y. (2018). Numerical modeling of flow over a rectangular broad-crested weir with a sloped upstream face. Water 10, 1663. doi:10.3390/w10111663
Jones, S. M., Louw, T. M., and Harrison, S. T. (2017). Energy consumption due to mixing and mass transfer in a wave photobioreactor. Algal Res. 24, 317–324. doi:10.1016/j.algal.2017.03.001
Jossen, V. (2020). Bioengineering aspects of microcarrier-based hMSC expansions in different single-use bioreactors. Berlin: Ph.D. thesisTechnische Universität. doi:10.14279/depositonce-9775
Jossen, V., Eibl, R., and Eibl, D. (2019). “Single-use bioreactors – an overview,” in Single-use technology in biopharmaceutical manufacture (Hoboken: John Wiley & Sons), 37. doi:10.1002/9781119477891.ch4
Jossen, V., Eibl, R., Pörtner, R., Kraume, M., and Eibl, D. (2017). “Stirred bioreactors,” in Current developments in biotechnology and bioengineering (Amsterdam: Elsevier), 179–215. doi:10.1016/B978-0-444-63663-8.00007-0
Junne, S., Marbà-Ardébol, A. M., and Neubauer, P. (2016). New application fields for single-use bioreactors. BioSpektrum 22, 96–99. doi:10.1007/s12268-016-0660-9
Junne, S., Solymosi, T., Oosterhuis, N., and Neubauer, P. (2013). Cultivation of cells and microorganisms in wave-mixed disposable bag bioreactors at different scales. Chem. Ing. Tech. 85, 57–66. doi:10.1002/cite.201200149
Kabsch, W. (1976). A solution for the best rotation to relate two sets of vectors. Acta Cryst. Sect. A 32, 922–923. doi:10.1107/S0567739476001873
Kabsch, W. (1993). Automatic processing of rotation diffraction data from crystals of initially unknown symmetry and cell constants. J. Appl. Crystallogr. 26, 795–800. doi:10.1107/S0021889893005588
Kaiser, S. C. (2014). Characterization and optimization of single-use bioreactors and biopharmaceutical production processes using Computational Fluid Dynamics. Ph.D. thesis, Technischen Universität Berlin. doi:10.14279/depositonce-4313
Kaiser, S. C., Eibl, R., and Eibl, D. (2011a). Engineering characteristics of a single-use stirred bioreactor at bench-scale: The Mobius CellReady 3L bioreactor as a case study. Eng. Life Sci. 11, 359–368. doi:10.1002/elsc.201000171
Kaiser, S. C., Kraume, M., Eibl, D., and Eibl, R. (2015). “Single-use bioreactors for animal and human cells,” in Animal cell culture cell engineering. Editor M. Al-Rubeai (Cham: Springer), 9. 445–500. doi:10.1007/978-3-319-10320-4_14
Kaiser, S. C., Löffelholz, C., Werner, S., and Eibl, D. (2011b). “CFD for characterizing standard and single-use stirred cell culture bioreactors,” in Computational fluid dynamics technologies and applications. Editors I. V. Minin, O. V. Minin, and IntechOpen. doi:10.5772/23496
Kalmbach, A., Bordás, R., Öncül, A. A., Thévenin, D., Genzel, Y., and Reichl, U. (2011). Experimental characterization of flow conditions in 2- and 20-l bioreactors with wave-induced motion. Biotechnol. Prog. 27, 402–409. doi:10.1002/btpr.516
Kaur, G. J., Orsat, V., and Singh, A. (2022). Application of central composite face centered design for the optimization of multiple-pass ultrasonication with mechanical homogenization (MPUMH) for carrot puree processing. Innovative Food Sci. Emerg. Technol. 76, 102944. doi:10.1016/j.ifset.2022.102944
Kawano, A. (2016). A simple volume-of-fluid reconstruction method for three-dimensional two-phase flows. Comput. Fluids 134-135, 130–145. doi:10.1016/j.compfluid.2016.05.014
Kieran, P. M., Malone, D. M., and MacLoughlin, P. F. (2000). Effects of hydrodynamic and interfacial forces on plant cell suspension systems. Berlin: Springer, 139–177. doi:10.1007/3-540-47865-5_5
Kimme, C., Ballard, D., and Sklansky, J. (1975). Finding circles by an array of accumulators. Commun. ACM 18, 120–122. doi:10.1145/360666.360677
Kreitmayer, D., Gopireddy, S. R., Matsuura, T., Aki, Y., Katayama, Y., Kakihara, H., et al. (2022). “Numerical and experimental characterization of the single-use bioreactor XcellerexTM XDR-200. 108237, 177. doi:10.1016/j.bej.2021.108237Biochem. Eng. J.
Kurt, T., Marbà-Ardébol, A. M., Turan, Z., Neubauer, P., Junne, S., and Meyer, V. (2018). Rocking Aspergillus: Morphology-controlled cultivation of Aspergillus niger in a wave-mixed bioreactor for the production of secondary metabolites. Microb. Cell. Fact. 17, 128–129. doi:10.1186/s12934-018-0975-y
Kysela, B., Konfrst, J., Chara, Z., Sulc, R., and Jasikova, D. (2017). “Evaluation of the turbulent kinetic dissipation rate in an agitated vessel, EPJ Web Conf. 143, 02062. doi:10.1051/epjconf/201714302062
Lehmann, N., Dittler, I., Lämsä, M., Ritala, A., Rischer, H., Eibl, D., et al. (2014). “Disposable bioreactors for cultivation of plant cell cultures,” in Production of biomass and bioactive compounds using bioreactor technology (Dordrecht: Springer), 17–46. doi:10.1007/978-94-017-9223-3_2
Liangchao, L., Ning, C., Kefeng, X., and Beiping, X. (2018). A comparative CFD study on gas-liquid dispersion in A stirred tank with low and high gas loadings. Int. J. Chem. React. Eng. 16. doi:10.1515/ijcre-2017-0147
Liangchao, L., Ning, C., Kefeng, X., and Beiping, X. (2019). CFD study on the flow field and power characteristics in a rushton turbine stirred tank in laminar regime. Int. J. Chem. React. Eng. 17, 215. doi:10.1515/ijcre-2018-0215
Liu, H.-l., Liu, M.-m., Bai, Y., and Dong, L. (2015). Effects of mesh style and grid convergence on numerical simulation accuracy of centrifugal pump. J. Cent. South Univ. 22, 368–376. doi:10.1007/s11771-015-2531-9
Liu, Y., Wang, Z.-J., Xia, J.-y., Haringa, C., Liu, Y.-p., Chu, J., et al. (2016). Application of Euler-Lagrange CFD for quantitative evaluating the effect of shear force on Carthamus tinctorius L. cell in a stirred tank bioreactor. Biochem. Eng. J. 114, 209–217. doi:10.1016/j.bej.2016.07.006
Löffelholz, C., Husemann, U., Greller, G., Meusel, W., Kauling, J., Ay, P., et al. (2013a). Bioengineering parameters for single-use bioreactors: Overview and evaluation of suitable methods. Chem. Ing. Tech. 85, 40–56. doi:10.1002/cite.201200125
Löffelholz, C., Kaiser, S. C., Kraume, M., Eibl, R., and Eibl, D. (2013b). “Dynamic single-use bioreactors used in modern liter- and m3- scale biotechnological processes: Engineering characteristics and scaling up,” in Disposable bioreactors II. Editors D. Eibl, and R. Eibl (Berlin, Heidelberg: Springer), 1–44. doi:10.1007/10_2013_187
Löffelholz, C., Kaiser, S. C., Werner, S., and Eibl, D. (2011). “CFD as a tool to characterize single-use bioreactors,” in Single-use technology in biopharmaceutical manufacture (Hoboken: John Wiley & Sons), 263–279. doi:10.1002/9780470909997.ch22
Loubière, C. (2018). Characterization and impact of the hydrodynamics on the performance of umbilicalcord derived stem cells culture in stirred tank bioreactors. Lorraine: Ph.D. thesis, Université de Lorraine.
Marsh, D. T. J., Lye, G. J., Micheletti, M., Odeleye, A. O. O., Ducci, A., and Osborne, M. D. (2017). Fluid dynamic characterization of a laboratory scale rocked bag bioreactor. AIChE J. 63, 4177–4187. doi:10.1002/aic.15734
Martinetz, M. C., Kaiser, F., Kellner, M., Schlosser, D., Lange, A., Brueckner-Pichler, M., et al. (2021). Hybrid approach for mixing time characterization and scale-up in geometrical nonsimilar stirred vessels equipped with eccentric multi-impeller systems—an industrial perspective. Processes 9, 880. doi:10.3390/pr9050880
Maschke, R. W., and Eibl, D. (2019). Process transfer of CHO cultivations using the Minifors 2 as an example. Bottmingen: Infors AG.
Maschke, R. W., Seidel, S., Bley, T., Eibl, R., and Eibl, D. (2022). “Determination of culture design spaces in shaken disposable cultivation systems for CHO suspension cell cultures, Biochem. Eng. J. 177, 108224. doi:10.1016/j.bej.2021.108224
Meana-Fernández, A., Fernández Oro, J. M., Argüelles Díaz, K. M., Galdo-Vega, M., and Velarde-Suárez, S. (2019). Application of Richardson extrapolation method to the CFD simulation of vertical-axis wind turbines and analysis of the flow field. Eng. Appl. Comput. Fluid Mech. 13, 359–376. doi:10.1080/19942060.2019.1596160
Menter, F. (1993). “Zonal two equation k-ω turbulence models for aerodynamic flows,” in 23rd Fluid Dynamics, Plasmadynamics, and Lasers Conference (Reston, Virigina: American Institute of Aeronautics and Astronautics). doi:10.2514/6.1993-2906
Mikola, M., Seto, J., and Amanullah, A. (2007). Evaluation of a novel Wave Bioreactor® cellbag for aerobic yeast cultivation. Bioprocess Biosyst. Eng. 30, 231–241. doi:10.1007/s00449-007-0119-y
Müller, J., Ott, V., Eibl, D., and Eibl, R. (2022). Seed train intensification using an ultra-high cell density cell banking process. Processes 10, 911. doi:10.3390/pr10050911
Müller, J., Teale, M., Steiner, S., Junne, S., Neubauer, P., Eibl, D., et al. (2021). Intensified and continuous mAb production with single-use systems. Cham: Springer, 401–429. doi:10.1007/978-3-030-79871-0_13
Murillo, W. O., Arcila, I. D. P., and Palacio-Fernández, J. A. (2022). Geometric optimization of jet pump used in vacuum distillation applications under different operating conditions using genetic-algorithm methods. J. Appl. Comput. Mech. 8, 3228. doi:10.22055/JACM.2021.38411.3228
Ng, K., and Yianneskis, M. (2000). Observations on the distribution of energy dissipation in stirred vessels. Chem. Eng. Res. Des. 78, 334–341. doi:10.1205/026387600527446
Nienow, A. W. (1997). On impeller circulation and mixing effectiveness in the turbulent flow regime. Chem. Eng. Sci. 52, 2557–2565. doi:10.1016/S0009-2509(97)00072-9
Nienow, A. W. (2006). Reactor engineering in large scale Animal cell culture. Cytotechnology 50, 9–33. doi:10.1007/s10616-006-9005-8
Nienow, A. W., Rielly, C. D., Brosnan, K., Bargh, N., Lee, K., Coopman, K., et al. (2013a). The physical characterisation of a microscale parallel bioreactor platform with an industrial CHO cell line expressing an IgG4. Biochem. Eng. J. 76, 25–36. doi:10.1016/j.bej.2013.04.011
Nienow, A. W., Scott, W. H., Hewitt, C. J., Thomas, C. R., Lewis, G., Amanullah, A., et al. (2013b). Scale-down studies for assessing the impact of different stress parameters on growth and product quality during animal cell culture. Chem. Eng. Res. Des. 91, 2265–2274. doi:10.1016/j.cherd.2013.04.002
Nienow, A. W. (2021). The impact of fluid dynamic stress in stirred bioreactors – the scale of the biological entity: A personal view. Chem. Ing. Tech. 93, 17–30. doi:10.1002/cite.202000176
OECD Nuclear Energy Agency (2015). Best practice guidelines for the use of CFD in nuclear reactor safety applications – revision. Paris: OECD Nuclear Energy Agency.
Oosterhuis, N. M., Hudson, T., D’Avino, A., Zijlstra, G. M., and Amanullah, A. (2011). Disposable bioreactors. second edn, 2. Pergamon: Elsevier. doi:10.1016/B978-0-08-088504-9.00098-2
Oosterhuis, N. M., Neubauer, P., and Junne, S. (2013). Single-use bioreactors for microbial cultivation. Pharm. Bioprocess. 1, 167–177. doi:10.4155/pbp.13.19
Oosterhuis, N. M. (2014). “Perfusion process design in a 2D rocking single-use bioreactor,” in Continuous processing in pharmaceutical manufacturing (Weinheim: John Wiley & Sons), 155. doi:10.1002/9783527673681.ch07
Oosterhuis, N. M., and van der Heiden, P. (2010). “Mass transfer in the CELL-tainer® disposable bioreactor,” in Cells and culture (Dordrecht: Springer), 371–373. doi:10.1007/978-90-481-3419-9_64
OpenCV, (2015). Open Source Computer Vision Library 4.5.4 Available at: https://docs.opencv.org.
Palazón, J., Mallol, A., Eibl, R., Lettenbauer, C., Cusidó, R. M., and Piñol, M. T. (2003). Growth and ginsenoside production in hairy root cultures of panax ginseng using a novel bioreactor. Planta Med. 69, 344–349. doi:10.1055/s-2003-38873
Pan, A., Xie, M., Xia, J., Chu, J., and Zhuang, Y. (2018). Gas-liquid mass transfer studies: The influence of single- and double-impeller configurations in stirred tanks. Korean J. Chem. Eng. 35, 61–72. doi:10.1007/s11814-017-0266-z
Panckow, R. P., Bliatsiou, C., Böhm, L., Muthig, M., Maaß, S., and Kraume, M. (2019a). “Comparison between a rocking and a stirred bioreactor concerning particle stress in a liquid-liquid model system ECCE12,” in The 12th European congress of chemical engineering. Florence: European Congress of Chemical Engineering
Panckow, R. P., Bliatsiou, C., Böhm, L., and Kraume, M. (2018). “Understanding of shear stress in cell systems by droplet size analysis in a rocking single-use bioreactor with in situ imaging methods,” in GPE –6th international congress on green process engineering (toulouse). Toulouse: GPE -6th international congress on green process engineering.
Panckow, R. P., Kraume, M., and Muthig, M. (2019b). “Vergleich der Partikelbeanspruchungen und Mischcharakteristika zwischen einem wellendurchmischten Single-Use Bioreaktor und einem gerührten Fermenter,” in JT ProcessNet-FG Mischvorgänge, Trocknungstechnik und Wärme- und Stoffübertragung (Essen). Essen: ProcessNet.
Pappalardo, F., Moscatello, A., Ledda, G., Uggenti, A. C., Gerboni, R., Carpignano, A., et al. (2021). Quantification of uncertainty in CFD simulation of accidental gas release for O & G quantitative risk assessment. Energies 14, 8117. doi:10.3390/en14238117
Platas Barradas, O., Jandt, U., Minh Phan, L. D., Villanueva, M. E., Schaletzky, M., Rath, A., et al. (2012). Evaluation of criteria for bioreactor comparison and operation standardization for mammalian cell culture. Eng. Life Sci. 12, 518–528. doi:10.1002/elsc.201100163
Ramírez, L. A., Pérez, E. L., García Díaz, C., Camacho Luengas, D. A., Ratkovich, N., and Reyes, L. H. (2020). CFD and experimental characterization of a bioreactor: Analysis via power curve, flow patterns and kLa. Processes 8, 878. doi:10.3390/pr8070878
Ranade, S. S., and Thiagarajan, P. (2017). Selection of a design for response surface. IOP Conf. Ser. Mat. Sci. Eng. 263, 022043. doi:10.1088/1757-899X/263/2/022043
Rard, J. A. (2021). Mutual diffusion coefficients of aqueous Na2SO4 at C = 0.02989 mol·dm–3 and 298.15 K by using Rayleigh interferometry with free diffusion boundary conditions: Experimental test of the effect of the C3/2 concentration dependence of refractive index at low concentration. J. Solut. Chem. 50, 886–893. doi:10.1007/s10953-021-01092-5
Richardson, L. F. (1911). The approximate arithmetical solution by finite differences of physical problems involving differential equations, with an application to the stresses in a masonry dam. Philosophical Trans. R. Soc. A Math. Phys. Eng. Sci. 210, 307–357. doi:10.1098/rsta.1911.0009
Roache, P. J. (1994). Perspective: A method for uniform reporting of grid refinement studies. J. Fluids Eng. 116, 405–413. doi:10.1115/1.2910291
Roache, P. J. (1998). Verification and validation in computational science and engineering. Albuquerque: Hermosa Publishers.
Savitzky, A., and Golay, M. J. E. (1964). Smoothing and differentiation of data by simplified least squares procedures. Anal. Chem. 36, 1627–1639. doi:10.1021/ac60214a047
Schirmer, C., Nussbaumer, T., Schöb, R., Pörtner, R., Eibl, R., and Eibl, D. (2018). “Development, engineering and biological characterization of stirred tank bioreactors,” in Biopharmaceuticals (London: InTech). doi:10.5772/intechopen.79444
Seidel, S., and Eibl, D. (2021). Influence of interfacial force models and population balance models on the kLa value in stirred bioreactors. Processes 9, 1185. doi:10.3390/pr9071185
Seidel, S., Maschke, R. W., Werner, S., Jossen, V., and Eibl, D. (2021). Oxygen mass transfer in biopharmaceutical processes: Numerical and experimental approaches. Chem. Ing. Tech. 93, 42–61. doi:10.1002/cite.202000179
Shoemake, K. (1985). “Animating rotation with quaternion curves,” in Proceedings of the 12th annual conference on Computer graphics and interactive techniques - siggraph ’85 (New York, New York, USA: ACM Press), 245–254. doi:10.1145/325334.325242
Singh, V. (1999). Disposable bioreactor for cell culture using wave-induced agitation. Cytotechnology 30, 149–158. doi:10.1023/A:1008025016272
Steffen, C. J., Reddy, D. R., and Zaman, K. (1995). “Analysis of flowfield from a rectangular nozzle with delta tabs,” in Fluid dynamics conference (Reston, Virigina: American Institute of Aeronautics and Astronautics). doi:10.2514/6.1995-2146
Stephan P., Kabelac S., Kind M., Mewes D., Schaber K., and Wetzel T. (Editors) (2019). VDI-Wärmeatlas (Berlin, Heidelberg: Springer Reference TechnikSpringer). doi:10.1007/978-3-662-52989-8
Svay, K., Urrea, C., Shamlou, P. A., and Zhang, H. (2020). Computational fluid dynamics analysis of mixing and gas–liquid mass transfer in wave bag bioreactor. Biotechnol. Prog. 36, e3049. doi:10.1002/btpr.3049
Thomassen, Y. E. (2014). Upgrading the established inactivated polio vaccine production process. Wageningen: Ph.D. thesis, Wageningen University.
Thomassen, Y. E., Van Der Welle, J. E., Van Eikenhorst, G., Van Der Pol, L. A., and Bakker, W. A. (2012). Transfer of an adherent vero cell culture method between two different rocking motion type bioreactors with respect to cell growth and metabolic rates. Process Biochem. 47, 288–296. doi:10.1016/j.procbio.2011.11.006
van der Heiden, P., Buevink, M., and Oosterhuis, N. M. G. (2006). Method and apparatus for cultivating cells utilizing wave motion. Leeuwarden: Cellution Biotech B. V. , European Patent Office. WO2007/00173 A2v.
van Leer, B. (1974). Towards the ultimate conservative difference scheme. II. monotonicity and conservation combined in a second-order scheme. J. Comput. Phys. 14, 361–370. doi:10.1016/0021-9991(74)90019-9
van Rossum, G. (2022). Python 3.10. Redwood City: Python Software Foundation. www.python.org.
van’t Riet, K. (1979). Review of measuring methods and results in nonviscous gas-liquid mass transfer in stirred vessels. Ind. Eng. Chem. Proc. Des. Dev. 18, 357–364. doi:10.1021/i260071a001
Vogler, E. A. (1998). Structure and reactivity of water at biomaterial surfaces. Adv. Colloid Interface Sci. 74, 69–117. doi:10.1016/S0001-8686(97)00040-7
Wang, W., Cheng, Y., and Tan, G. (2018). Design optimization of SBS-modified asphalt mixture reinforced with eco-friendly basalt fiber based on response surface methodology. Materials 11, 1311. doi:10.3390/ma11081311
Werner, S., Hacker, D., Baldi, L., Tanner, R., Kühner, M., Broccard, G., et al. (2010). Innovative, non-stirred bioreactors in scales from milliliters up to 1000 liters for suspension cultures of cells using disposable bags and containers – a Swiss contribution. CHIMIA 64, 819. doi:10.2533/chimia.2010.819
Werner, S., Kaiser, S. C., Kraume, M., and Eibl, D. (2014). Computational fluid dynamics as a modern tool for engineering characterization of bioreactors. Pharm. Bioprocess. 2, 85–99. doi:10.4155/pbp.13.60
Werner, S., Olownia, J., Egger, D., and Eibl, D. (2013). An approach for scale-up of geometrically dissimilar orbitally shaken single-use bioreactors. Chem. Ing. Tech. 85, 118–126. doi:10.1002/cite.201200153
Werner, S., Stalder, M., Perepelitsa, N., and Eibl, D. (2016). Engineering characterization of ReadyToProcess WAVE 25 bioreactor system with 20 L Cellbag culture chamber. Uppsala: GE Healthcare Bio-Sciences AB.
Westbrook, A., Scharer, J., Moo-Young, M., Oosterhuis, N., and Perry Chou, C. (2014). Application of a two-dimensional disposable rocking bioreactor to bacterial cultivation for recombinant protein production. Biochem. Eng. J. 88, 154–161. doi:10.1016/j.bej.2014.04.011
Yawalkar, A. A., Heesink, A. B. M., Versteeg, G. F., and Pangarkar, V. G. (2008). Gas-liquid mass transfer coefficient in stirred tank reactors. Can. J. Chem. Eng. 80, 840–848. doi:10.1002/cjce.5450800507
Youngs, D. (1982). “Time-dependent multi-material flow with large fluid distortion,” in Numerical methods in fluid dynamics. Editors K. W. Morton, and M. J. Baines (Reading, United Kingdom: Academic Press).
Zhan, C., Hagrot, E., Brandt, L., and Chotteau, V. (2019). Study of hydrodynamics in wave bioreactors by computational fluid dynamics reveals a resonance phenomenon. Chem. Eng. Sci. 193, 53–65. doi:10.1016/j.ces.2018.08.017
Zhang, H., Zhang, K., and Fan, S. (2009). CFD simulation coupled with population balance equations for aerated stirred bioreactors. Eng. Life Sci. 9, 421–430. doi:10.1002/elsc.200800074
Keywords: 3D-Scan, bioengineering characterization, CELL-tainer, computational fluid dynamics - CFD, mixing time, motion capturing, oxygen mass transfer coefficient, specific power input
Citation: Seidel S, Maschke RW, Kraume M, Eibl R and Eibl D (2022) CFD modelling of a wave-mixed bioreactor with complex geometry and two degrees of freedom motion. Front. Chem. Eng. 4:1021416. doi: 10.3389/fceng.2022.1021416
Received: 17 August 2022; Accepted: 28 September 2022;
Published: 20 October 2022.
Edited by:
Thomas Kaspar Villiger, University of Applied Sciences and Arts Northwestern Switzerland, SwitzerlandReviewed by:
Stefan Radl, Graz University of Technology, Austria Miroslav Šoóš, University of Chemistry and Technology in Prague, Prague, CzechiaCopyright © 2022 Seidel, Maschke, Kraume, Eibl and Eibl. This is an open-access article distributed under the terms of the Creative Commons Attribution License (CC BY). The use, distribution or reproduction in other forums is permitted, provided the original author(s) and the copyright owner(s) are credited and that the original publication in this journal is cited, in accordance with accepted academic practice. No use, distribution or reproduction is permitted which does not comply with these terms.
*Correspondence: Stefan Seidel, stefan.seidel@zhaw.ch