Boost dynamic protocols for producing mammalian biopharmaceuticals with intensified DoE—a practical guide to analyses with OLS and hybrid modeling
 V. Nold1*†
  L. Junghans1*† B. Bayer2
  L. Bisgen1
  M. Duerkop2 R. Drerup1 B. Presser1 T. Schwab1 E. Bluhmki1 S. Wieschalka1‡
  B. Knapp1‡
- 1Development Biologicals, Boehringer Ingelheim Pharma GmbH & Co. KG, Biberach an der Riß, Germany
- 2Novasign GmbH, Muthgasse, Vienna, Austria
Introduction: For the implementation of robust bioprocesses, understanding of temporal cell behavior with respect to relevant inputs is crucial. Intensified Design of Experiments (iDoE) is an efficient tool to assess the joint influence of input parameters by including intra-experimental changes.
Methods: We applied iDoE to the production phase of a monoclonal antibody in a mammalian bioprocess. The multidimensional design space spanned by temperature, dissolved oxygen (DO), timing of change, and growth category was investigated in 12 cultivations. We built ordinary least squares (OLS) and hybrid models (HM) on the iDoE-data, validated them with classical DoE (cDoE)-derived data, and used the models as in silico representation for process optimization.
Results: If the complexity of interactions between changing setpoints of inputs is sufficiently captured during planning and modeling, iDoE proved to be valid for characterizing the mammalian biopharmaceutical production phase. For local behavior and flexible composition of optimization goals, OLS regressions can easily be implemented. To predict global and interconnected dynamics while incorporating mass balances, HM holds potential.
Discussion: iDoE will boost protocols that optimize inputs for different bioprocess phases. The described key aspects of OLS- and HM-based analyses of iDoE-data shall guide future applications during manufacturing.
Introduction
In bioprocess development, the quality-by-design (QbD) principle asks for representative models that reliably predict outcomes of future batches (Val et al., 2010). This approach fosters a better understanding of biological mechanisms and enables model-based process optimization (Schmidberger et al., 2015; Kappatou et al., 2018). If adhered to early during bioprocess development, QbD may accelerate later development steps by maximizing knowledge gain (Möller and Pörtner, 2017; Politis et al., 2017).
One versatile tool in the QbD-framework is classical design of experiments (cDoE). It allows to study the multivariate influence of input parameters on output parameters. Inputs are controllable conditions that are directly adjustable throughout the process. Outputs are read outs indicating process performance or product quality that cannot be directly adjusted but are a consequence of the inputs. In cDoE, combinations of input parameters can be investigated simultaneously and thus allows to resolve multivariate interactions. Moreover, replicates within the multi-dimensional design space increase the statistical power to detect effects over noise. These aspects make cDoE more informative and affordable than one-factor-at-a-time experiments (Politis et al., 2017). Using fixed process parameter setpoints for each individual bioreactor, cDoE is well suited to elucidate static relationships between inputs and outputs. Use cases of cDoE in chemical manufacturing and control are for example scale-down models (Legmann et al., 2009), validation of control parameters in process characterization studies (Moran et al., 2000), and static optimization (Ling et al., 2015). Response surface models based on OLS regression are typical outcomes of cDoE analyses (Ramírez et al., 2001; Torkashvand et al., 2015).
Opposed to constant input settings throughout the experiment in cDoE, iDoE permits intra-experimental setpoint changes of inputs. This changing of setpoints is possible in experiments that feature a temporal component. It enables covering of several input combinations within one bioreactor and thus can increase the efficiency of data generation. Successful application of iDoE was reported previously for Escherichia coli processes (Stosch et al., 2016; Stosch and Willis, 2017; Bayer et al., 2020a; Bayer et al., 2021a). For the growth phase of mammalian bioprocesses, the technical and biological feasibility of iDoE was furthermore shown (Nold et al., 2021). However, the potential of iDoE to study the production phase and optimize protocols for mammalian bioprocesses had not been explored.
The overarching goal was thus to test whether iDoE is applicable to the production phase of mammalian bioprocesses. One goal of the present study was to validate in silico predicted optimal input setpoints for the growth phase of the previously reported mammalian bioprocess (Nold et al., 2021). The optimization aimed for a higher viable cell density (VCD) on day six compared to VCDs measured in bioreactors operated at standard settings.
The second goal was to address whether the cells would respond to changes of input settings during the production phase. Our third goal was to determine how iDoE-based data of the production phase could best be analyzed. Closely related to this goal is the question (3.1) how the transition from growth to production phase may be modelled in the context of differing exposure history and intra-experimental changes to input settings. (3.2) A critical evaluation step for the suitedness of analyses is whether the resulting models are predictive for independently collected data (Rajamanickam et al., 2021). (3.3) A further aspect is whether the models can be used to optimize the process they are built for. Two analyses approaches, OLS regressions and hybrid modelling, had been suggested for iDoE data and are described head-to-head while addressing the subtopics of goal 3.
To account for offsets due to intra-experimental changes of input setpoints, iDoE-stage-wise rebasing was suggested for OLS-based analyses of iDoE-data collected during the growth phase of mammalian bioprocesses (Nold et al., 2021). An iDoE-stage is defined by scheduled changes of input setpoints. In the same publication, the separate modeling of each iDoE-stage and subsequent concatenation was shown (Nold et al., 2021). The potential to combine data of iDoE-stages in a joint model so far was not explored. Further, the inclusion of different starting states reflecting different histories of the cultivation as additional input parameters to the model had not been covered with OLS-based analyses of iDoE-data. Both options were thus tested in pursuit of goal 3.1 for OLS modelling.
As alternative to OLS regression, HM which serially combines machine learning and mechanistic modeling was proposed to describe iDoE-data (Bayer et al., 2021a). This combination is thought to overcome the drawbacks of the individual analysis approaches: limited interpretability of machine learning-based models and substantial efforts to gain and express mechanistic knowledge in differential equations (Saleh et al., 2021). The differential equations define how change rates estimated from the iDoE-data are connected (Narayanan et al., 2019; Bayer et al., 2020b). Additionally, online data can be integrated into the HM. This helps to account for variations in the inputs. The suitedness of HM for iDoE-data originating from the production phase of mammalian bioprocesses had not been proven so far (Möller et al., 2019).
Given the complexity of the adapted OLS and hybrid modelling approach, our fourth goal was to illustrate for future users how these methods can be applied to iDoE data collected during the production phase. We describe in detail how research questions and data structures impact modelling approaches. As guidance, we furthermore report the critical points to consider at each step of the workflows. Together, sophisticated planning and analyzing of iDoE feeds into reaching the final goal: the use of iDoE as novel tool to speed up the development of biopharmaceuticals that addresses unmet medical needs.
Materials and methods
Design planning and evaluation
A D-optimal design for 12 bioreactors was created and evaluated in Design Expert® Version 13 (StatEase). The design comprises three numerical input parameters: temperature (3 setpoints covering a range of 4°C: 32.5°C, 34.5°C, 36.5°C), DO (3 setpoints covering a range of 80%: 10%, 50%, 90%), and timing of the setpoint change relative to the culture duration (3 setpoints: day 6, 9, 11). For each input parameter, the lowest setpoint is represented as -1, the center point is coded as 0, and the highest setpoint is coded as + 1. Two levels of the categorical input parameter growth condition were furthermore considered. One level, termed “platform growth”, represented the exposure to standard levels for DO and temperature (both coded as 0), the second level, termed “optimized growth”, represented the optimal input levels identified in a previous iDoE to maximize cell growth (DO at the -.5-level, temperature at the + 1-level) (Nold et al., 2021). The growth phase lasted from day 0–6. The remaining days of the culture process (7–14) were divided into three iDoE stages: stage I lasting from day 6–9, stage II lasting from day 9–11, and stage III lasting from day 11–14. The D-optimal design obtained from the commercial software solution was modified manually to have balanced numbers of high and low setpoints for temperature and DO across all samples, but not necessarily within one bioreactor. Two bioreactors (1 and 10) constituted cDoE-like controls without scheduled changes of the input settings.
An underlying model structure containing all model terms representing main, quadratic and two factorial interaction effects was assumed. The iDoE was evaluated regarding the statistical power to detect effects of these model terms when assuming effect sizes of three relative to the noise of measurement imprecision and setting the significance level to 5%. The correlations of model terms for the given design were evaluated in addition and evaluated regarding their criticality. Moreover, the leverage of the planned design points was checked and the saturation of the design relative to the degrees of freedom required for the full model structure was considered during DoE evaluation. Once the wet-lab data was available, the assumed underlying modelling structure was adjusted and thus re-evaluated (see Results section).
Cell culture
A Chinese hamster ovary (CHO)-K1 GS cell line producing an immunoglobulin G4 (IgG4) monoclonal antibody was cultivated in suspension using chemically defined media and feeds. Media and bioreactors are proprietary (Boehringer Ingelheim Pharma GmbH and Co. KG, Ingelheim, Germany). Seed cultures were performed in shake flasks until the N-2 stage, followed by a controlled N-1 batch culture carried out in a 12 L-glass bioreactor. iDoE experiments were conducted in fed-batch mode in 3 L-glass bioreactors throughout the 14-day process. All 3 L vessels were inoculated from the same 12 L pre-stage. Temperature, DO, and pH were controlled using online sensors. Temperature and DO setpoints were changed according to the planned iDoE. Feed medium containing glucose was added with a constant rate of 3% (v/v) per day, based on the starting volume. If needed to maintain an optimal concentration, glucose was added as a bolus on a day-to-day basis.
Process analytics
Routine cultivation samples were taken daily over the entire culture duration. Additional sampling was performed from day 6–14. Total cell density (TCD), and VCD were measured using an automated cell counter (Cedex, Roche, Switzerland; measurement error max. 15%), based on an image classification following trypan blue exclusion staining and used to calculate viability. Offline pH, pCO2 and pO2 were determined with a blood gas analyzer (Rapidlab™, Siemens Healthcare GmbH, Germany). Glucose and lactate were measured in cell free samples using photometric assays combined in an automated wet chemical analyzer (Konelelab Prime 60i, Thermo Fisher Scientific, United States; measurement error max. 7%). Titer was quantified with a Protein-A-HPLC method (Thermo Fischer Scientific, United States; measurement error max. 6%).
Data pre-processing
The output parameters were scaled between 0 and 1 for reporting purposes. Different approaches were applied to the input parameters during analysis with OLS and HM. For the OLS regressions, the input parameters were coded between -1 and +1. This approach was chosen to align the analysis with the statistical planning as described (see Design Planning and Evaluation section). Further, it illustrates that simply using the design matrix of inputs (instead of processing and using the measured online data) is possible for iDoE-derived data. For HM, more details of the actual input parameters per time point were considered by using the online measurements. A z-score standardization [also termed autoscaling (Penza and Cassano, 2004)] was applied to the online data. The z-scores result from division of the measured values with their standard deviation. The z-standardization mitigates quantitative effects. Using z-standardized values for the HM is an approach to specifically account for the iDoE-typical changes of input parameter settings over time.
iDoE-adapted ordinary least squares modeling
Processing, visualization, and analysis of data were performed using R version 4.0.2. Given the focus of the iDoE to study the production phase, the output measurements from day six onwards were used and statistically analyzed. We accounted for potential offsets originating from previous input settings by a so-called rebasing. Here, the measurements within each bioreactor were rebased stage-wise by subtracting the initial value of the currently investigated stage from the values of the respective stage. The initial VCD value per stage and bioreactor was used as additional input parameter. For the model of iDoE stage I, the initial VCD value served as a proxy for the two different growth categories. For iDoE stage II and III, it served as a proxy for differing states of the process that would originate from different input histories. Up to three-factorial interactions (including quadratic effects of each input parameter) were eligible to define the complexity of the full OLS model structure for each individual output. The coded design matrix for these potential model terms was defined based on the input parameter setpoints using polynomial contrast coding. Bidirectional selection of model terms optimizing the corrected Akaike information criterion was used to select the final model for each output and iDoE stage I as well as jointly for stage II and III (Seber et al., 1994; Kletting and Glatting, 2009). A visual inspection of the model residuals was undertaken to assess whether the underlying assumptions of the modeling approach (i.e., homogeneity of variance and Gaussian distribution of the residuals) were fulfilled. Model validity was assessed numerically using the root mean squared error (RMSE). Further, the amount of explained variance (R2),
Hybrid modeling
The HM was accomplished in the Novasign GmbH (Vienna, Austria) HM toolbox. It was used to address different research questions than the OLS-based models. Its suitability on predicting growth and production phase globally was tested. Whereas the output parameters are separately modeled in the OLS-based models, the HM approach jointly described the outputs TCD, VCD, product titer, and glucose concentration based on the input parameters temperature, DO, time point, and glucose feed. Viability was calculated separately as the ratio between TCD and VCD. Thereby an unnecessary increase of model complexity is avoided and the bias of the model towards cell density-associated measurements is reduced. Supplementary Figure S18 describes the structure of the serial hybrid model in more detail.
The values of the specific growth rate of all cells μt, the viable cells μv, the product formation rate vp/x, and the glucose consumption rate vgluc are estimated by an artificial neural network (ANN) as a function of the inputs temperature, DO, and the predictions of the previous time step of each output parameter (Eq. 1). By using the predictions of the previous time step, the history was considered. Subsequently, these rates were used in the mechanistic part of the model (Eqs 2–5) to provide time-step-based, concatenated predictions of the output parameters. Further, information on the glucose concentration in the continuous and the bolus feed was added to the mechanistic part of the model. The dilution rate D describes the volume change due to the ratio between the flow of all volume additions into the reactor i.e., substrate and glucose bolus feed, and the overall reactor volume comprising the initial volume plus all these added volumes. The “−1” in the indices of Eq. 1 indicates that the value of the previous time point, incorporating the recent history of the output parameters, is used for the propagation.
XT = TCD [scaled]
XV = VCD [scaled]
P = product titer [scaled]
t-1 = previous time step
gcF = glucose concentration in the feed [scaled]
gcR = glucose concentration in the reactor [scaled]
D = dilution rate (h−1)
Internal cross validation was performed to find the optimal hyperparameters of the ANN, namely the number of neurons and hidden layers. To this end, the data were split into a training and a test partition. The hyperparameters were selected based on the minimization of the error in the training and test partition. Ideally, the data split would consider the distribution of replicates in a way that a setting included in the training partition is not also present in the test partition, because this would cause overly optimistic error estimates (McCarthy, 1976). In a small data set with discrete input parameter setpoints, this is not always possible. The omission of entire design points could, dependent on the leverage of this data point, disproportionately distort the resulting model (Næs and Ellekjær, 1993; Meloun et al., 2011; Saeb et al., 2017). Thus, random data partitioning with a split ratio of ∼.83 (ten experiments for training, two for testing) was used. The ANN, which minimized the error on the training and test data partition (measured via R2 and the RMSE normalized to the respective average analytical value), consisted of an input layer, one hidden layer comprising eight neurons, and one output layer. Model training stopped once no further improvement on the normalized RMSE and R2 in the training and test data partition was observed. Subsequently, the iteration with the average best performance on both data partitions was selected. Eq. 6 provides how the normalized RMSE is computed by setting the squared residual difference between the measured, analytical value y and the estimated counterpart ŷ for each sampling point (t) in relation to the total number N of observations and the mean of the analytical values ȳ.
In the hidden layer, hyperbolic tangens transformations were used as transfer functions, while linear transfer functions were used in the output layer. The Levenberg–Marquardt algorithm was applied to identify the local minimum in each individual data partition. Once a minimum was identified, the algorithm got restarted from randomly initialized weights for the same data partition twenty times. To ensure sufficient variance for model training, this procedure, i.e., random data partitioning and identifying the minimum, was repeated twenty times. The resulting individual HMs were ranked based on their average smallest error for both data partitions. Subsequently, averaging of the top five individual HMs was performed. This averaging represents a robust way to deal with model uncertainties (Mendes-Moreira et al., 2012). To assess the predictive performance and to investigate the grade of overfitting, the averaged HM was applied to an independent, external validation set comprising cDoE data. These validation data were operated without input parameter changes and were not used for training or testing. Due to this independence, the assessment is a valuable indicator of the generalized model performance (external validation). The normalized RMSE, R2, standard deviation (SD) (Eq. 7) and PI (Eq. 8) were used as numeric evaluation metrics. ŷaverage is the estimation of the averaged model, ŷmodel is the estimation of the respective model, i the index of these models, and n is the number of observations at each time t.
Results and discussion
Creation of an iDoE to study the production phase of mammalian cell cultures
The underlying assumption of the iDoE concept is that cells are responsive to changes of input parameter setpoints. To test this for the production phase (day 6–14) of a mammalian bioprocess, an iDoE with three stages was planned. The impact of changing temperature and DO over time on process performance was of interest. The setpoints of these input parameters were on average distributed equally across the production phase and within each iDoE stage, but not necessarily within each bioreactor (Figure 1). The coverage of the design space spanned by temperature and DO is visualized in a two-dimensional representation in Figure 1A. A three-dimensional representation with a split into bioreactors starting with standard growth conditions vs. optimized growth conditions is provided in Figure 1B. Figures 1C, D illustrate in a simplified view how on days 6, 9, and 11 setpoints of temperature and DO underwent scheduled changes, respectively. The design space coverage per stage is visualized in Supplementary Figure S1. Some vertices of the design space were not covered per individual stage, which might limit the power to describe the (interaction) effects of DO and temperature per iDoE stage.
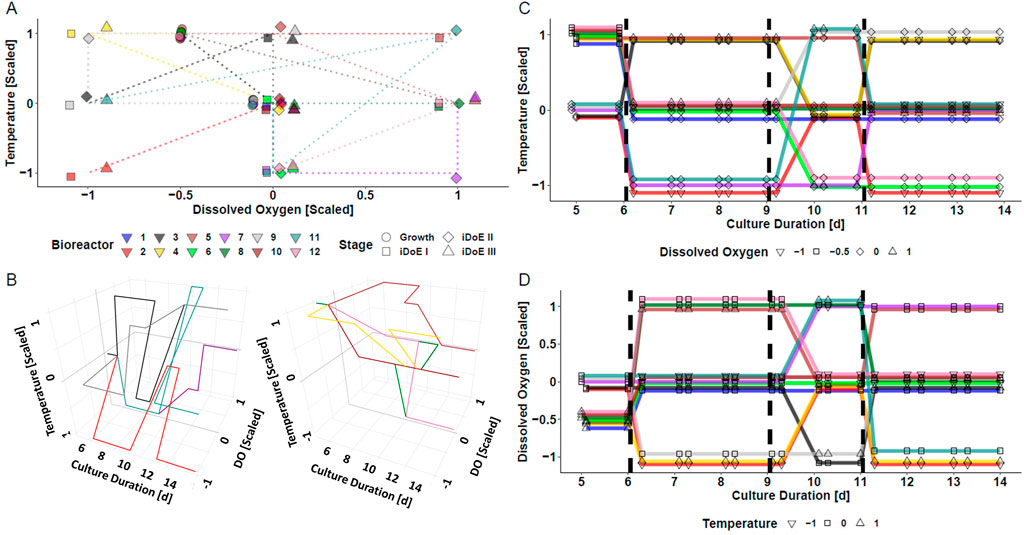
FIGURE 1. Visualization of the Conducted iDoE for the Investigation of the Effect of the Input Parameters Temperature and DO Over Time During the Production Phase of a Mammalian Cell Culture Process. (A) Coverage of the design space defined by temperature and DO by the varying input parameter setpoints applied to the bioreactors over the course of the four experimental stages. Only one replicate per stage is depicted, while there were 7, 7, 3, and 6 sampling time points in the growth phase, iDoE stage I, II, and III, respectively. (B) Visuali zation of the design space coverage in three dimensions for bioreactors operated at platform (left) or optimized (right) growth settings. Changes of the input parameter setpoints of temperature (C) and DO (D) during day five and harvest are visualized with a jitter in the y-axis and diagonal connections instead of vertical steps to avoid overlay of the lines.
Increased temperature and lowered DO are optimal to promote faster VCD growth
To address goal 1, unpaired Welch’s t-tests were applied on VCD and titer measurements on day 6 from bioreactors operated at standard vs. putatively “optimized” settings of temperature and DO during the growth phase (days 0–6). The measured VCD of the bioreactors operated at “optimized” growth conditions was significantly higher (0.665 ± 0.045, mean ± SD) than in the bioreactors exposed to standard settings (0.382 ± 0.033, t (10) = −12.4, p < 0.00001). Analogously, the titer of these bioreactors was higher (0.0697 ± 0.00067) than in bioreactors exposed to standard settings (0.0054 ± 0.0039, t (10) = 21, p < 0.00001). This confirmed that the proposed settings for temperature and DO on days 0–6, which previously had been identified using iDoE-based models for the growth phase (Nold et al., 2021), indeed led to increased VCD and titer compared to standard growth conditions. The external validation of the previously reported iDoE-based models for the growth phase was successful. In the following, these modified settings of temperature and DO are referred to as “growth optimized” in contrast to “growth platform” where DO and temperature are kept at the standard setpoints.
Responsiveness to intra-experimental changes during the production phase is fulfilled
Aiming for answering goal 2, the measured data of CHO cells subjected to intra-experimental setpoint changes of temperature and DO during the production phase are presented in Figure 2. In response to changes of temperature and DO, diverging courses of VCD (Figure 2A), viability (Figure 2B), glucose (Figure 2C), and titer (Figure 2D) are visible. Supplementary Figure S2 shows the data trajectories for TCD and lactate. A notable change in performance is for example observable when the transition from iDoE stage I to II was initiated on day 9: Bioreactor 9 (grey line) was exposed to standard settings during the growth phase and was changed to the -1-DO setpoint but remained at the 0-temperature setpoint for iDoE stage I. With initiation of iDoE stage II on day 9, a temperature change towards the + 1-setpoint was conducted while remaining at -1-DO setpoint. In parallel, a drop in VCD (Figure 2A left panel) but a steep increase in titer (Figure 2D left panel) was observed. Another example for a pronounced response at day 9 is observable between bioreactor 4 (yellow line) and 5 (light brown line), which both started with the optimized growth settings (right panels): Despite the different settings during iDoE stage I, their viability followed a similar path until approximately day 9 (Figure 2B). After the initiation of iDoE stage II, when the setpoint of temperature and DO was lowered for bioreactor 4 and the temperature of bioreactor 5 was increased, the viability in the latter dropped and led to the lowest titer endpoint observed among all bioreactors of the iDoE (Figure 2D). In sum, the measured process performance outputs reveal variability that may be correlated to changing inputs. The results indicate that changes in DO result in smaller effects regarding process performance than changes in temperature. Suited models may capture these input-output associations.
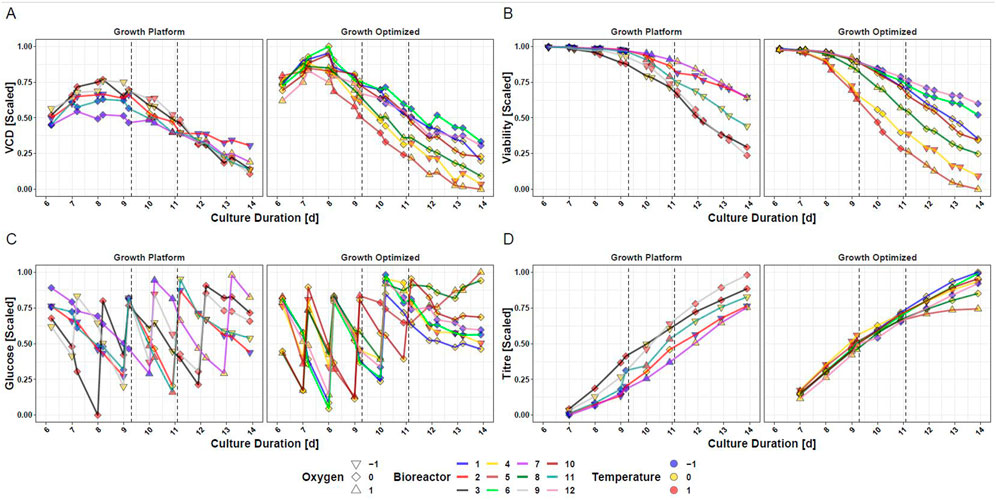
FIGURE 2. Cultured Mammalian Cells Show Different Trajectories for Measured Outputs in the Fed-Batch Process Dependent on the Input Parameter Setpoints of DO and Temperature. (A) VCD (B) Viability (C) Glucose (D) Titer. Dependent on the input parameter settings the cells were exposed to during the growth phase from day 0–6, the data of the bioreactors is separated into growth optimized and growth at platform condition.
Adaptation of OLS modeling to account for offsets in iDoE data
To address goal 3.1 for the OLS approach, characteristic aspects of the iDoE data need to be considered. The improvement of the process performance by optimized vs. standard growth conditions led to an earlier (day 7 vs. 9) and narrower peak VCD. These observations presumably reflect significantly different initial culture states in iDoE stage I. While stage- and bioreactor-wise rebasing corrects for numerical offsets (Nold et al., 2021), the difference in culture states may be accounted for by including ‘initial VCD’ as additional input parameter in the OLS models. We used numeric values of initial VCD to make predictions for bioreactors operated at different growth conditions. This enables validation of the models with external data, an essential step to determine generalizability of model predictions.
Instead of “initial VCD”, the initial values of every to-be-modelled output could in theory be used during modelling together with the other input parameters (temperature, DO, and exposure duration). However, titer usually is too low to be measured directly after the growth phase. Thus, no initial titer value would be available and the model for titer could not be corrected for state-dependent offsets. To promote fairer comparisons between the models for titer and other outputs, “initial VCD” was used as approximation of culture state in the OLS-based models for all output parameters. This modelling decision was furthermore based on the biological rationale that the product formation is a function of VCD, with more living cells potentially producing a higher titer.
After iDoE stage I, the diverging inputs had overwritten the binary grouping elicited by the two growth phase settings. Nevertheless, iDoE stage I introduced variability in the cellular states, which still had to be accounted for during OLS-based modelling. Therefore, and to ensure better comparability between the models of iDoE stage I and the later stages, initial VCD was maintained as eligible input parameter during model selection. The variability of states is reflected in Figure 2 as a broad range of values covered throughout iDoE stages II and III. The measured curves revealed no abnormalities in reaction to input setpoint changes.
In contrast do iDoE stage I, within iDoE stage II and III the trends in all bioreactors were quite similar despite the different timing of the exposure. This and the already applied re-basing per stage and bioreactor enabled the combination of iDoE stage II and III in joint OLS-based models. Such a fusion of information sources can mitigate issues of limited samplings and not covered vertices of the design space during one stage.
Statistical quality assessment of the iDoE investigating the production phase
Given the above-mentioned observations in the iDoE and the resulting updates to the assumed OLS model structure, the evaluation of the design was revisited. Overall, the evaluation of the design quality was positive. Most of the considered model terms were barely correlated (Pearson’s coefficient rho <|.3|, Supplementary Tables S3, S7). The minor correlation structure allowed for a good statistical power to separate effects of temperature, DO, and timing in interaction with each other and up to quadratic order (Supplementary Tables S1, S5). At an assumed signal-to-noise ratio of 3, the power was above 80% except for the quadratic effect of temperature in interaction with state in iDoE stage I (54%) and the interaction of temperature with the quadratic effect of DO and state in iDoE stage II joint with III (73%). The leverage of the individual design points (Supplementary Tables S4, S8) was judged acceptable since it is below .35, with only few data points exhibiting a leverage twice as big as the average leverage. Further, 69 (stage I) and 96 (joint stage II and III) degrees of freedom were available for the detection of a lack of fit (Supplementary Tables S2, S6).
Changes of input parameter setpoints exert different effects dependent on culture state
Applying the above-described considerations, OLS regression delivered two models for each output, one for iDoE stage I and a joint one for iDoE stage II and III. The concatenated predictions are visualized for the overall course of VCD for three selected bioreactors and overlayed with the measured and scaled data points (Figure 3). Quality measures of the OLS models for the individual process performance parameters are provided in the supplements (Supplementary Table S9). The results from the analysis of variance are provided alongside the coefficient estimates for the AICc-selected model terms based on coded input parameters (Supplementary Table S10). As expected from the performance data shown in Figure 2, model terms including temperature are associated with higher absolute values of coefficients than model terms composed of only DO. In line with the observed dependency on the growth phase, many of the model terms for VCD and viability represent an interaction of the initial value of iDoE stage I with temperature, DO, or exposure duration. This observation was less dominant for the models of lactate and titer or in the models for the joint stages II and III. The predicted vs. actual process performance of all iDoE in a time-resolved manner is provided (Supplementary Figures S3, S6, S9, S12).
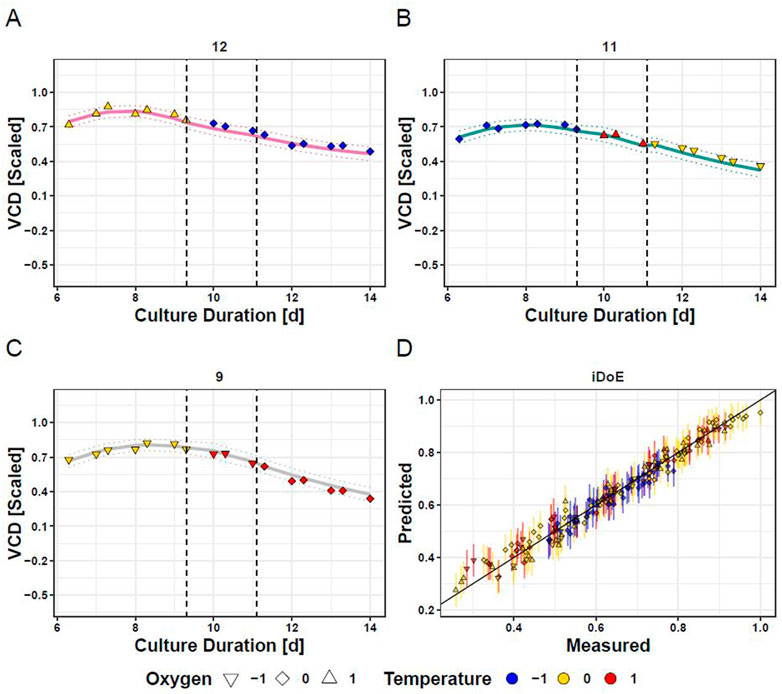
FIGURE 3. Fitting of Concatenated Model Predictions based on iDoE Data with VCD Measurements Obtained During the Conducted iDoE. Measured data points (colored symbols) are overlayed on mean predictions (solid lines) and the 95% prediction intervals (dashed lines) of the concatenated models of iDoE stage I and iDoE stage II joint with III for bioreactor 12 (A), 11 (B), and 9 (C). Accuracy of concatenated predictions over scaled measured values (D).
As validation (goal 3.2), the time-resolved accuracy of the concatenated model predictions compared to external data of the same process but obtained from independent cDoE experiments gathered with another seed train (Nold et al., 2021) are provided (Supplementary Figures S4, S7, S10, S13). This cDoE data was generated from experiments without any changes of input parameter setpoints. It was previously used to compare the insights that can be obtained with iDoE vs. cDoE (Nold et al., 2021). Since this data was never used for the development of the OLS models for the production phase, it is called external validation data. Comparing the model predictions to these represents a good indicator of the generalized model performance. Figure 4 contrasts in a scatter plot format the model predictions for VCD of iDoE (the data it was trained on), and of external validation data from cDoE. Analogous visualizations are provided for viability (Supplementary Figure S8), lactate (Supplementary Figure S11), and titer (Supplementary Figure S14). For cDoE bioreactors that were operated at lower temperatures during the growth phase than the ones studied within this iDoE, the prediction of stage I deviates from the actual values. The higher PIs for these extrapolated settings indicate that the reliability of the model outside of the trained design space might be limited. This decreased performance on completely independent validation data than on the data the models were calibrated on is expected, especially if different experimental operating procedures were used to generate the data. Evaluating the model’s performance on external validation data helps to raise awareness for potential limitations of the model and which restrictions might need to be applied when using the model for optimization. It may, as in the present iDoE, furthermore provide hints on how to improve the underlying data foundation and concomitantly the model.
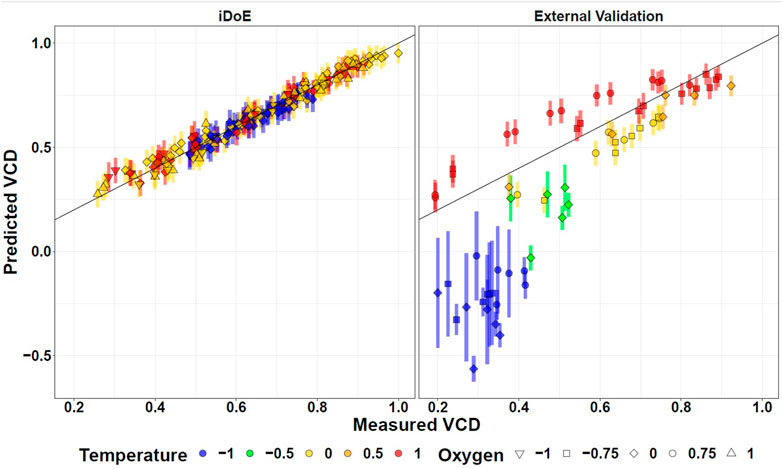
FIGURE 4. Fitting of OLS Model Predictions for VCD Based on iDoE Data to Internal iDoE Data and External Validation Data. Scatterplots visualizing the accuracy of model predictions for iDoE data (left) and external cDoE data (right). The error bars represent the 95% prediction intervals.
Based on the goodness of fit and suited generalizability to external data within the covered design space, the OLS models were judged valid for in silico predictions to find optimal settings in the response surface (goal 3.3) Klicken oder tippen Sie hier, um Text einzugeben. The modelled response surface of VCD over temperature and culture duration during the first iDoE stage for different setpoints of DO and growth phase outcomes is provided (Supplementary Figure S15). If optimal settings during the growth phase (right column) resulted in high VCD values at day 6, a change to lower temperatures and lower DO setpoints is favorable to maintain high viability and VCD values. This restriction might limit oxidative stress and be critical for cellular survival (Halliwell, 2003; Halliwell, 2014; Kuehne et al., 2015; Chevallier et al., 2020). In contrast, if the cells were exposed to standard settings during the growth phase (left column), warmer temperatures until day 9 are recommended to achieve higher VCD. The twist in the recommendation emphasizes that considering the different growth phases can be beneficial to find recommendations that yield optimal outcomes despite different states of the culture. These stage-dependent suggestions could find a valuable application during trouble shootings if the effects of accidental drifts during the process need to be overcome.
Towards the end of stage II and III, low temperature seems to overall be favorable to keep VCD high (Supplementary Figure S16). A quadratic effect of DO is visible, i.e., if the initial VCD value was low (left column), setting DO to -1 or +1 would be predicted to keep VCD high. If the initial VCD was high (right column), the setpoint of DO has fewer influence and the response surfaces resemble each other more.
With respect to titer, barely an effect of temperature is visible (Supplementary Figure S17), but the initial VCD has a strong impact on titer increase. The shapes of the titer-surfaces dependent on DO illustrate a quadratic relationship. The overall recommendation for maximizing VCD and titer would thus be to fix temperature and DO to the -1-setpoint from day 9–14. This is in line with previous publications suggesting lower temperatures to increase productivity (Darja et al., 2016; Vergara et al., 2018).
Serial HMs allow to jointly describe readouts of the bioprocess
The effects of growth phase settings are considered through the concept of HMs where the current prediction is a function of all the current inputs and the predicted outputs one time step before (goal 3.1 for HM). Hence, low vs. a high VCDs at the same timepoint and combination of temperature and DO setpoints will yield different predictions. This integrative nature of HM allows to describe possibly emerging changes in the rates due to the intra-experimental changes of input setpoints and their history. The joint predictions for all output parameters obtained with serial HMs are displayed in Figure 5. The model performance for each output parameter is given as scatter plots. The model performs well in accurately predicting the VCD (Figure 5A, 15% normalized RMSE and R2 = .92) but overestimates the derived viability, since TCD was underestimated (Figure 5B, 16% normalized RMSE and R2 = .84). The titer (Figure 5C, 9% normalized RMSE and R2 = .99) is predicted accurately and with wider PIs towards the end of the bioprocess. Glucose is adequately predicted (Figure 5D, 14% normalized RMSE and R2 = .73) but with an overestimation until day 5. For the prediction of glucose and titer, it must be considered that their production and consumption is linked to the VCD via the mechanistic part of the HM. Therefore, a high analytical error of the VCD measurement indirectly impacts the prediction accuracy of glucose and titer. Details of the time courses in three exemplary bioreactors are provided in Figures 5E–G. In these bioreactors, viability and glucose were overestimated by the HM towards the end of the process and during growth phase, respectively. Titer and VCD were well predicted. The time-resolved presentation of the model demonstrates sharp increases of the glucose concentration after bolus feeding, which were obtained through the incorporation of mechanistic knowledge about the bolus strategy using mass balances. The HM thus can describe highly dynamic time courses. The data and model predictions for the other nine iDoE bioreactors are provided in Supplementary Figure S19. Additionally, the performance of the HM to predict all iDoE and cDoE measurements (Nold et al., 2021) with respect to normalized RMSE and R2 is provided in tabular form (Supplementary Table S11). Scatterplots for the accuracy of the predictions for the validation cDoE data are provided in Supplementary Figure S20 (goal 3.2 for HM). Like seen with the OLS-based models, not covered regions of the design space limit the predictive accuracy of the HM.
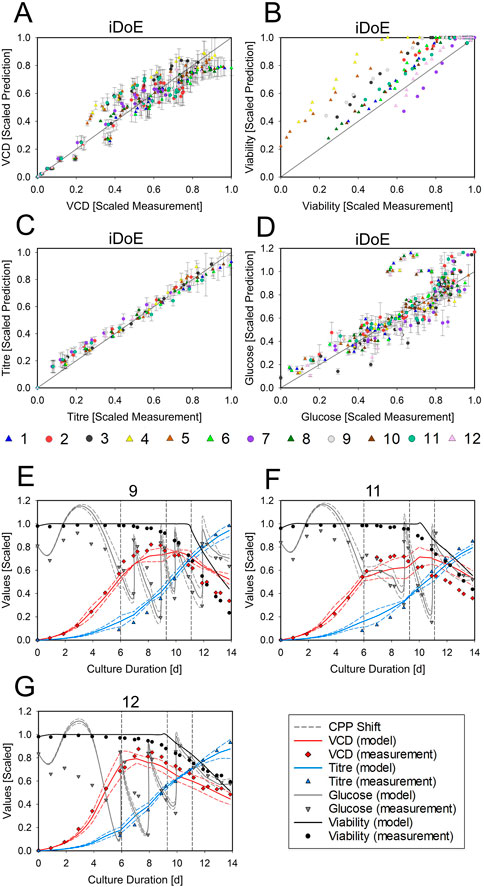
FIGURE 5. Performance of the Averaged HM in Predicting the Outputs of the iDoE and of Independent Validation Data The scatter plots display the scaled measured data points against the scaled HM predictions for VCD (A), viability (B), titer (C), and glucose (D), including the least-square lines. Colors represent the bioreactors. The symbols group into growth phase settings (circle = platform; triangle = growth-optimized). For the time-resolved representation of bioreactor 9 (E), 11 (F), and 12 (G), the scaled measured data points for VCD (red diamonds), viability (black circle), titer (blue triangle), and glucose (grey downward triangle) are overlayed by the scaled predictions of the averaged HM (solid lines) and the PI (dashed lines) in the respective colors. The timing of input setpoint changes is indicated as dashed grey lines.
Currently, the HM solely utilizes its recent predictions and controllable input parameters (temperature, DO, and glucose feed). The focus on controllable inputs has the advantage that these are suited for process optimization. However, limiting the number of potential inputs by omitting non-controllable process parameters (e.g., gas flow or amino acids) could hinder improvements in the predictive accuracy of the HM. The additional inclusion of non-controllable inputs could enable soft-sensor applications (Sommeregger et al., 2017; Bayer et al., 2021a; Bayer et al., 2021b). Further, metabolic information about current amino acid compositions can enable a better transferability during process scale-up (Torkashvand et al., 2015). Several complex biological phenomena (e.g., transcriptional or translational changes in the cell, metabolic differences) were not yet described by ordinary differential equations, which also contributes to the overall modeling error. The data-driven ANN may compensate limitations in mechanistic knowledge to a certain extent but cannot fully account for them. The current shortcomings in mechanistic knowledge may be overcome by future investigations on gene expression or metabolic profiling. Such data could enhance process understanding and model performance.
Guide for improving user experience with iDoE
Related to goal 4, a visual overview of the workflow for iDoE analyses using OLS and hybrid modelling is provided in Supplementary Figure S21. A list of associated considerations that shall guide future implementations of OLS and hybrid modeling in the context of iDoE applied to the transition and production phase of mammalian bioprocesses is provided in Figure 6. Their practical implementation is described and discussed in more detail in the sections above. Steps that are common for either modeling approach were omitted in Figure 6. These steps include e.g., bringing the data into a tabular format or the need of external confirmation experiments to test generalizability and overall validity of the model.
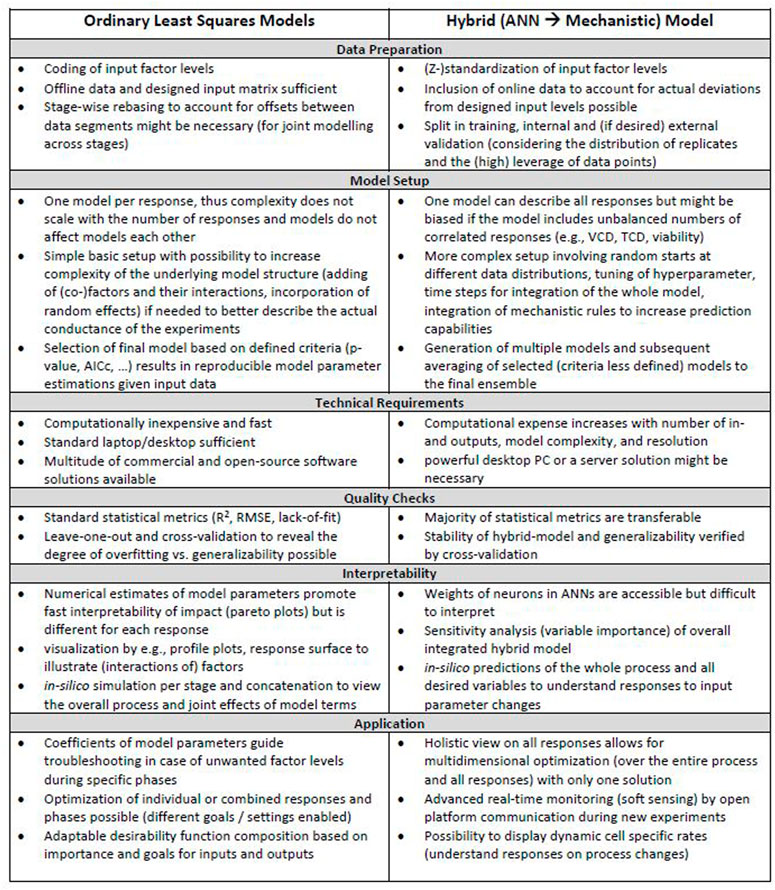
FIGURE 6. Considerations during OLS and HM workflows. Different aspects that need to be considered for OLS and hybrid modeling in the context of iDoE-derived data are provided for each step within the workflow.
Another shared step is planning of the iDoE and evaluating the design quality [e.g., power, degrees of freedom, replicates for pure error estimation, leverage of modeling points, correlation among model terms, and aliasing of effects in the context of the assumed underlying model structure (Welch et al., 1990; Allen and Allen, 20102010; Goos and Jones, 2011; Montgomery and Runger, 2018)]. Our adapted OLS regression and HM results for iDoE confirmed that, independent of the modeling approach, the quality of the iDoE and data is decisive for the goodness of the modeling outcome (Antony and Roy, 1999). Non-covered cold temperature settings during the growth phase were less accurately predicted by both modelling approaches. Given the importance of good design quality, critical aspects on the intricacies of designing iDoE to study mammalian bioprocesses are discussed in the following.
Prior knowledge and the research question provide a good orientation on the choice of input and output parameters and which relationships among them should be studied. The usage of mechanistic knowledge in HM allows the simultaneous predictions of multiple outputs based on current inputs as well as information on substrate bolus feeds and process history (see Figure 5). For OLS, prior assumptions are incorporated into the initial structure of an OLS model by defining the set of eligible model terms in the desired complexity (Hlaváček et al., 1984; Böhning, 1986; Aguiar et al., 1995; Uciński and Patan, 2007; Goos et al., 2016).
Since the OLS-based analysis of iDoE in stages is like analyzing several DoE, it is important that the number of sampling points within an iDoE stage ensures adequate statistical power (>80%). Based on our iDoE-data, a minimum of 2–3 days with 1-2 sampling points per day seems suited for mammalian cultures. To maximize the number of data points that can be analyzed jointly, the stage-defining setpoint changes should be timed at the start and end of a culture phase, i.e., growth, transition, and production phase.
Our observations on the design and iDoE-data (Figures 1, 2, Supplementary Figures S1, S2) furthermore revealed that in addition to balancing input parameter setpoints within an iDoE-stage [analogous to within a DoE (Hlaváček et al., 1984; Böhning, 1986; Aguiar et al., 1995; Uciński and Patan, 2007; Goos et al., 2016)], also a balance across and within bioreactors should be aimed for. If a limited number of bioreactors hinders a fully balanced design, iDoE stages can be analyzed jointly. A joint analysis of data from several iDoE-stages is only reasonable if the response directions are similar enough. This for example could be the case if the iDoE-stages fall within the same culture phase, as shown for stage II and III. The timing of intra-experimental changes within a culture phase should optimally be chosen in a way that the duration of the resulting iDoE stages is equal to not introduce bias towards the longer stage.
Conclusion and outlook
Extension of the iDoE concept to the production phase of mammalian bioprocesses proved feasible. The data at hand validated growth phase optimal settings for achieving higher VCD at day 6 compared to standard settings (goal 1). Further, the cells showed responsivity to changing input settings during the production phase (goal 2). The models of the production phase needed to incorporate differences originating from the previous time points. To account for this, several key aspects within the adapted OLS approach are important (goal 3.1). One is the iDoE-stage-wise rebasing which allows to combine data of iDoE stages that fall within the same culture phase. Another aspect is the inclusion of the initial numerical value of each stage, which serves as approximation for the culture state. While the associated main effect accounts for offsets due to previous input settings, the interactions between the initial value and the other inputs consider the dependency of the current settings on the bioprocess’ history. Using these information, representative OLS-based models that capture the complexity of interacting inputs in a time-resolved manner were obtained (goal 3.2). Their predictivity for independent, external data was shown with a validation data set originating from a cDoE. Through the parallel analysis using OLS and hybrid modeling, we could demonstrate that both analysis strategies successfully describe the iDoE data and the independent cDoE data within the input ranges covered in the iDoE. Since characteristic culture dynamics were accurately described, both model approaches can be used to make in silico predictions, guiding optimization of the manufacturing protocols towards more efficient and robust mammalian bioprocesses (goal 3.3). The modular nature of OLS models appeared beneficial for understanding and optimizing local behaviour within process phases. With separate models, the optimization goals for different process phases can be individually weighted by flexibly composing the desirability functions in a multivariate manner. For HM, the process history and dynamic online data is incorporated intrinsically in an overall model of the bioprocess for all output parameters. Therefore, the HM approach allows for predicting all outputs at once and facilitates global optimization for interconnected dynamics. In addition to optimization, OLS and hybrid models may aid in defining and monitoring control strategies (Woodall, 1985). Together with the previous findings on the applicability of iDoE to the growth phase of mammalian cells (Nold et al., 2021), our results indicate that a combined application of iDoE in all culture phases appears feasible. Therefore, iDoE allow for an efficient characterization of the whole bioprocess, paving the way to model predictive control, more consistent process performance, and ensured product quality. As we see great potential for speeding the development of biologics using iDoE for the efficient creation of models early on in the life cycle of a project, our fourth goal was to share our learnings on modelling iDoE data. We are the first to provide a head-to-head analysis of iDoE-data from a mammalian bioprocess using OLS and hybrid modeling. Our results showed that good design quality is essential for predictive models—irrespective of the analysis strategy. The provided considerations for each step of the OLS and HM workflows shall guide modeling of future iDoE-derived data. To ensure that the models are addressing the question of interest, we would like to emphasize that an intensive exchange of knowledge between modelers and users should accompany the data analyses and model deployment.
Data availability statement
The datasets presented in this article are not readily available because the raw data is subject to IP. However, the scaled and coded data will be shared upon request. Requests to access the datasets should be directed to verena.nold@boehringer-ingelheim.com.
Author contributions
VN—lead: conceptualization, formal analysis, methodology, software, validation, visualization, writing draft; equal: edit, project administration; supporting: data curation, funding aquisition, supervision LJ—lead: conceptualization, supervision; equal: data curation, funding aquisition, methodology, project administration, validation, writing draft, edit BB—lead: formal analysis, methodology; equal: software, validation, visualization, writing draft, edit LB—lead: data curation, investigation; supporting: edit MD—lead: software, equal: edit; supporting: supervision, draft RD—equal: funding aquisition, ressources; supporting: supervision, edit BP—lead: funding aquisition; equal: resources, edit; supporting: supervision TS—lead: funding aquisition, resources; supporting: edit EB—lead: funding aquisition, resources; supporting: edit SW—lead: conceptualization; equal: methodology, administration, supervision, edit; supporting: data curation, funding aquisition, draft BK—lead: conceptualization, administration; equal: methodology, supervision, edit; supporting: data curation, formal analysis, funding aquisition, software, validation, draft.
Acknowledgments
We are thankful for the discussions with our colleagues Joachim Bär, Sabine Arnold at Boehringer Ingelheim Pharma GmbH and Co. KG, as well as Roger Dalmau Díaz from Novasign GmbH. We furthermore thank Moritz von Stosch from DataHow AG for the insights he provided regarding the concept of iDoE.
Conflict of interest
VN, LJ, LB, RD, BP, TS, ES, SW, and BK were empolyed by the Boehringer Ingelheim Pharma GmbH & Co. KG. BB and MD were empolyed by the Novasign GmbH.
Publisher’s note
All claims expressed in this article are solely those of the authors and do not necessarily represent those of their affiliated organizations, or those of the publisher, the editors and the reviewers. Any product that may be evaluated in this article, or claim that may be made by its manufacturer, is not guaranteed or endorsed by the publisher.
Supplementary material
The Supplementary Material for this article can be found online at: https://www.frontiersin.org/articles/10.3389/fceng.2022.1044245/full#supplementary-material
Abbreviations
AICc, corrected Akaike information criterion; ANN, artificial neural network; cDoE, classical design of experiments; CHO, Chinese hamster ovary; DO, dissolved oxygen; DoE, design of experiments; HM, hybrid model; iDoE, intensified design of experiments; OLS, ordinary least squares; PI, prediction interval (95%); QbD, quality-by-design; R2, coefficient of determination; RMSE, root mean square error; SD, standard deviation; TCD, total cell density; VCD, viable cell density.
References
Aguiar, P. F., Bourguignon, B., Khots, M. S., Massart, D. L., and Phan-Than-Luu, R. (1995). D-optimal designs. Chemom. Intelligent Laboratory Syst. 30 (2), 199–210. doi:10.1016/0169-7439(94)00076-x
Allen, T. T. (2010). “Introduction to engineering statistics and lean sigma,” in Doe: Response surface methods. Editor T. T. Allen (Springer-Verlag London), 315–350. doi:10.1007/978-1-84996-000-7_13
Antony, J., and Roy, R. K. (1999). Improving the process quality using statistical design of experiments: A case study. Qual. Assur. 6 (2), 87–95. doi:10.1080/105294199277888
Bayer, B., Duerkop, M., Striedner, G., and Sissolak, B. (2021). Model transferability and reduced experimental burden in cell culture process development facilitated by hybrid modeling and intensified design of experiments. Front. Bioeng. Biotechnol. 9, 740215. doi:10.3389/fbioe.2021.740215
Bayer, B., Maccani, A., Jahn, J., Duerkop, M., Kapeller, E., Pletzenauer, R., et al. (2021). Proton-transfer-reaction mass spectrometry (PTR-MS) for online monitoring of glucose depletion and cell concentrations in HEK 293 gene therapy processes. Biotechnol. Lett. 44 (1), 77–88. doi:10.1007/s10529-021-03205-y
Bayer, B., Stosch, M., Striedner, G., and Duerkop, M. (2020). Comparison of modeling methods for DoE-based holistic upstream process characterization. Biotechnol. J. 15 (5), 1900551. doi:10.1002/biot.201900551
Bayer, B., Striedner, G., and Duerkop, M. (2020). Hybrid modeling and intensified DoE: An approach to accelerate upstream process characterization. Biotechnol. J. 15 (9), 2000121. doi:10.1002/biot.202000121
Böhning, D. (1986). A vertex-exchange-method in D-optimal design theory. Metrika 33 (1), 337–347. doi:10.1007/bf01894766
Borra, S., and Ciaccio, A. D. (2010). Measuring the prediction error. A comparison of cross-validation, bootstrap and covariance penalty methods. Comput. Statistics Data Analysis 54 (12), 2976–2989. doi:10.1016/j.csda.2010.03.004
Browne, M. W. (2000). Cross-validation methods. J. Math. Psychol. 44 (1), 108–132. doi:10.1006/jmps.1999.1279
Chevallier, V., Andersen, M. R., and Malphettes, L. (2020). Oxidative stress-alleviating strategies to improve recombinant protein production in CHO cells. Biotechnol. Bioeng. 117 (4), 1172–1186. doi:10.1002/bit.27247
Darja, O., Stanislav, M., Saša, S., Andrej, F., Lea, B., and Branka, J. (2016). Responses of CHO cell lines to increased pCO2 at normal (37°C) and reduced (33°C) culture temperatures. J. Biotechnol. 219, 98–109. doi:10.1016/j.jbiotec.2015.12.013
Goos, P., and Jones, B. (2011). Optimal design of experiments: A case study approach. Wiley. doi:10.1002/9781119974017
Goos, P., Jones, B., and Syafitri, U. (2016). I-optimal design of mixture experiments. J. Am. Stat. Assoc. 111 (514), 899–911. doi:10.1080/01621459.2015.1136632
Halliwell, B. (2014). Cell culture, oxidative stress, and antioxidants: Avoiding pitfalls. Biomed. J. 0 (0), 0. doi:10.4103/2319-4170.128725
Halliwell, B. (2003). Oxidative stress in cell culture: An under-appreciated problem? FEBS Lett. 540 (1–3), 3–6. doi:10.1016/s0014-5793(03)00235-7
Hlaváček, I., Bock, I., and Lovíšek, J. (1984). Optimal control of a variational inequality with applications to structural analysis. I. Optimal design of a beam with unilateral supports. Appl. Math. Optim. 11 (1), 111–143. doi:10.1007/bf01442173
Kappatou, C. D., Mhamdi, A., Campano, A. Q., Mantalaris, A., and Mitsos, A. (2018). Model-based dynamic optimization of monoclonal antibodies production in semibatch Operation Use of reformulation techniques. Industrial Eng. Chem. Res. 57 (30), 9915–9924. doi:10.1021/acs.iecr.7b05357
Kletting, P., and Glatting, G. (2009). Model selection for time-activity curves: The corrected Akaike information criterion and the F-test. Z. Für Med. Phys. 19 (3), 200–206. doi:10.1016/j.zemedi.2009.05.003
Kuehne, A., Emmert, H., Soehle, J., Winnefeld, M., Fischer, F., Wenck, H., et al. (2015). Acute activation of oxidative pentose phosphate pathway as first-line response to oxidative stress in human skin cells. Mol. Cell 59 (3), 359–371. doi:10.1016/j.molcel.2015.06.017
Legmann, R., Schreyer, H. B., Combs, R. G., McCormick, E. L., Russo, A. P., and Rodgers, S. T. (2009). A predictive high-throughput scale-down model of monoclonal antibody production in CHO cells. Biotechnol. Bioeng. 104, 1107–1120. doi:10.1002/bit.22474
Ling, W. L. W., Bai, Y., Cheng, C., Padawer, I., and Wu, C. (2015). Development and manufacturability assessment of chemically-defined medium for the production of protein therapeutics in CHO cells. Biotechnol. Prog. 31, 1163–1171. doi:10.1002/btpr.2108
McCarthy, P. J. (1976). The use of balanced half-sample replication in cross-validation studies. J. Am. Stat. Assoc. 71 (355), 596–604. doi:10.1080/01621459.1976.10481534
Meloun, M., and Militký, J. (2011). Statistical data analysis "M Meloun, Militký, and Jiří", Eds.; pp. 449–629). New Delhi, India: Woodhead Publishing India. doi:10.1533/9780857097200.449
Mendes-Moreira, J., Soares, C., Jorge, A. M., and Sousa, J. F. D. (2012). Ensemble approaches for regression: A survey. ACM Comput. Surv. 45 (1), 1–40. doi:10.1145/2379776.2379786
Möller, J., Kuchemüller, K. B., Steinmetz, T., Koopmann, K. S., and Pörtner, R. (2019). Model-assisted Design of Experiments as a concept for knowledge-based bioprocess development. Bioprocess Biosyst. Eng. 42 (5), 867–882. doi:10.1007/s00449-019-02089-7
Möller, J., and Pörtner, R. “Model-based design of process strategies for cell culture bioprocesses: State of the art and new perspectives ["Sivakumar joghi thatha gowder,” in New insights into cell culture Technology (London, United Kingdom: IntechOpen). 2017. doi:10.5772/67600
Montgomery, D. C., and Runger, G. C. Applied statistics and probability for engineers. 7th Edition. 2018. https://www.wiley.com/en-us/Applied+Statistics+and+Probability+for+Engineers%2C+7th+Edition-p-9781119400363.
Moran, E. B., McGowan, S. T., McGuire, J. M., Frankland, J. E., Oyebade, I. A., Waller, W., et al. (2000). A systematic approach to the validation of process control parameters for monoclonal antibody production in fed-batch culture of a murine myeloma. Biotechnol. Bioeng. 69 (3), 242–255. doi:10.1002/1097-0290(20000805)69:3<242::aid-bit2>3.0.co;2-i
Narayanan, H., Sokolov, M., Morbidelli, M., and Butté, A. (2019). A new generation of predictive models: The added value of hybrid models for manufacturing processes of therapeutic proteins. Biotechnol. Bioeng. 116 (10), 2540–2549. doi:10.1002/bit.27097
Næs, T., and Ellekjær, M. R. (1993). Cross-validation and leverage-correction revisited. NIR News 4 (1), 8–9. doi:10.1255/nirn.166
Nold, V., Junghans, L., Bisgen, L., Drerup, R., Presser, B., Gorr, I., et al. (2021). Applying intensified design of experiments to mammalian cell culture processes. Eng. Life Sci. 22, 784–795. doi:10.1002/elsc.202100123
Penza, M., and Cassano, G. (2004). Chemometric characterization of Italian wines by thin-film multisensors array and artificial neural networks. Anal. Nutr. Clin. Methods 86, 283–296. doi:10.1016/j.foodchem.2003.09.027
Politis, S. N., Colombo, P., Colombo, G., and Rekkas, D. M. (2017). Design of experiments (DoE) in pharmaceutical development. Drug Dev. Industrial Pharm. 43 (6), 889–901. doi:10.1080/03639045.2017.1291672
Rajamanickam, V., Babel, H., Montano-Herrera, L., Ehsani, A., Stiefel, F., Haider, S., et al. (2021). About model validation in bioprocessing. Processes 9 (6), 961. doi:10.3390/pr9060961
Ramírez, J., Gutierrez, H., and Gschaedler, A. (2001). Optimization of astaxanthin production by Phaffia rhodozyma through factorial design and response surface methodology. J. Biotechnol. 88 (7), 259–268. doi:10.1016/s0168-1656(01)00279-6
Ronchetti, E., Field, C., and Blanchard, W. (1997). Robust linear model selection by cross-validation. J. Am. Stat. Assoc. 92 (439), 1017–1023. doi:10.1080/01621459.1997.10474057
Saeb, S., Lonini, L., Jayaraman, A., Mohr, D. C., and Kording, K. P. (2017). The need to approximate the use-case in clinical machine learning. GigaScience 6 (5), 1–9. doi:10.1093/gigascience/gix019
Saleh, D., Wang, G., Mueller, B., Rischawy, F., Kluters, S., Studts, J., et al. (2021). Cross-scale quality assessment of a mechanistic cation exchange chromatography model. Biotechnol. Prog. 37 (1), e3081. doi:10.1002/btpr.3081
Schmidberger, T., Posch, C., Sasse, A., Gülch, C., and Huber, R. (2015). Progress toward forecasting product quality and quantity of mammalian cell culture processes by performance-based modeling. Biotechnol. Prog. 31 (4), 1119–1127. doi:10.1002/btpr.2105
Seber, G. A. F., and Wild, C. J. (1994). “9 least squares”. Editors John L. Stanford, Vardeman, and B. Stephen Stat. Methods Phys. Sci.(Academic Press), 28, 245–281. doi:10.1016/s0076-695x(08)60259-8
Sommeregger, W., Sissolak, B., Kandra, K., Stosch, M., Mayer, M., and Striedner, G. (2017). Quality by control: Towards model predictive control of mammalian cell culture bioprocesses. Biotechnol. J. 12 (7), 1600546. doi:10.1002/biot.201600546
Stosch, M., Hamelink, J., and Oliveira, R. (2016). Toward intensifying design of experiments in upstream bioprocess development: An industrial Escherichia coli feasibility study. Biotechnol. Prog. 32 (5), 1343–1352. doi:10.1002/btpr.2295
Stosch, M. von, and Willis, M. J. (2017). Intensified design of experiments for upstream bioreactors. Eng. Life Sci. 17 (11), 1173–1184. doi:10.1002/elsc.201600037
Torkashvand, F., Vaziri, B., Maleknia, S., Heydari, A., Vossoughi, M., Davami, F., et al. (2015). Designed amino acid feed in improvement of production and quality targets of a therapeutic monoclonal antibody. PLoS ONE 10 (10), e0140597. doi:10.1371/journal.pone.0140597
Uciński, D., and Patan, M. (2007). D-optimal design of a monitoring network for parameter estimation of distributed systems. J. Glob. Optim. 39 (2), 291–322. doi:10.1007/s10898-007-9139-z
Val, I. J., Kontoravdi, C., and Nagy, J. M. (2010). Towards the implementation of quality by design to the production of therapeutic monoclonal antibodies with desired glycosylation patterns. Biotechnol. Prog. 26 (6), 1505–1527. doi:10.1002/btpr.470
Vergara, M., Torres, M., Müller, A., Avello, V., Acevedo, C., Berrios, J., et al. (2018). High glucose and low specific cell growth but not mild hypothermia improve specific r-protein productivity in chemostat culture of CHO cells. PLoS ONE 13 (8), e0202098. doi:10.1371/journal.pone.0202098
Welch, W. J., Yu, T.-K., Kang, S. M., and Sacks, J. (1990). Computer experiments for quality control by parameter design. J. Qual. Technol. 22 (1), 15–22. doi:10.1080/00224065.1990.11979201
Woodall, W. H. (1985). The statistical design of quality control charts. J. R. Stat. Soc. Ser. D (The Statistician) 34, 155. doi:10.2307/2988154
Yarkoni, T., and Westfall, J. (2017). Choosing prediction over explanation in psychology: Lessons from machine learning. Perspectives on Psychological Science 12 (6), 1100–1122. doi:10.1177/1745691617693393
Keywords: intensified design of experiments, mammalian biopharmaceutical production, upstream process modeling, multivariate optimization, bioprocess phases
Citation: Nold V, Junghans L, Bayer B, Bisgen L, Duerkop M, Drerup R, Presser B, Schwab T, Bluhmki E, Wieschalka S and Knapp B (2023) Boost dynamic protocols for producing mammalian biopharmaceuticals with intensified DoE—a practical guide to analyses with OLS and hybrid modeling. Front. Chem. Eng. 4:1044245. doi: 10.3389/fceng.2022.1044245
Received: 14 September 2022; Accepted: 12 December 2022;
Published: 04 January 2023.
Edited by:
Marieke Klijn, Delft University of Technology, NetherlandsReviewed by:
Federico Galvanin, University College London, United KingdomAnne Richelle, Sartorius, Belgium
Copyright © 2023 Nold, Junghans, Bayer, Bisgen, Duerkop, Drerup, Presser, Schwab, Bluhmki, Wieschalka and Knapp. This is an open-access article distributed under the terms of the Creative Commons Attribution License (CC BY). The use, distribution or reproduction in other forums is permitted, provided the original author(s) and the copyright owner(s) are credited and that the original publication in this journal is cited, in accordance with accepted academic practice. No use, distribution or reproduction is permitted which does not comply with these terms.
*Correspondence: V. Nold, verena.nold@boehringer-ingelheim.com; L. Junghans, lisa.junghans@boehringer-ingelheim.com
†These authors share first authorship
‡These authors share senior authorship