Experimental determination and mathematical modelling of residence time distributions by using pieces of urban art
 Tapio Salmi
 Pasi Tolvanen
 Kari Eränen
  Johan Wärnå
- Laboratory of Industrial Chemistry and Reaction Engineering (TKR), Johan Gadolin Process Chemistry Centre (PCC), Åbo Akademi University, Turku-Åbo, Finland
Residence time distribution (RTD) has a very high impact on the performance of a chemical reactor. The development of new reactor and catalyst structures has increased the importance of deep knowledge in theories of RTDs and good experimental practice in measuring RTDs in real systems. Therefore, RTD studies are included in chemical engineering education all over the world. This work demonstrates how RTDs can be measured by using urban pieces of art. Impulse experiments with an inert tracer (NaCl) were conducted in a marvelous modern artwork, ‘Flow of time’ in Turku/Åbo. The results were successfully interpreted with the classical laminar flow model. The application of the methodology in historical university cities is suggested.
1 Introduction
One of the pioneers of modern chemical reaction engineering, professor P.V. Danckwerts from Cambridge gave a systematic overview of residence time distributions (RTDs) in a classical article published in 1953 (Danckwerts 1953). The frequency and distribution functions E(t) and F(t) arising from impulse and step responses arising from impulse and step change experiments of inert tracers injected into flow reactors were presented and discussed in the work. The basic RTD functions have the mutual relation dF/dt = E(t), i.e. the frequency function can be obtained by differentiation of the distribution function and vice versa, the distribution function is obtained by integrating the frequency function. For the very well-known two ideal flow patterns, complete backmixing and plug flow the frequency functions are exponential function, E(t) = e−t/τ/τ and Dirac’s δ-function, respectively. After the pioneering work of Danckwerts (1953), a lot of effort has been focused on theoretical considerations of various flow patterns and models such as laminar flow and dispersion models. A wave model for non-ideal flow has been proposed by the group of Westerterp (Benneker et al., 1997) as an alternative for axial dispersion model. The RTD functions are standard material in textbooks devoted to chemical reaction engineering, e.g., Levenspiel 1990, Froment et al., 2010, Hill and Root 2014, Baerns et al., 1992, Villermaux 1985, Salmi et al., 2019). In recent times, the methods of computational fluid dynamics (CFD) have been applied to describe flow patterns in chemical reactors, but they require very sophisticated and heavy calculations, particularly, when the flow model is coupled to a kinetic model and models for heat and mass transfer (Baldyga and Bourne 1999).
The recent development of new reactor and catalyst structures, such as monoliths, solid foams, microreactors and 3D-printed structures has caused a renaissance of this subfield of chemical reaction engineering, because it is absolutely necessary to know the flow pattern and RTD for each new reactor and catalyst structure, in order to progress successfully with rational modelling of reaction kinetics, transport phenomena and flow pattern (Stankiewicz and Moulijn 2000; Hessel et al., 2004; Mastroianni et al., 2022; Shumilov et al., 2022). Besides the classical experiments with pulse and step wise added inert tracers, modern tomographic methods are of great help in research and development of new reactor systems. Because of the enormous impact of RTD on the reactor performance, the theory of RTDs and experimental determination of the flow patterns are central elements in chemical engineering education. For undergraduate students, laboratory-scale experiments are designed to illustrate the flow patterns in simple continuous reactors, such as tubular reactors, stirred tanks, reactor cascades and vessels equipped with static mixers.
However, to extend the pedagogic approach, experiments in large scale are highly desirable. The purchase and operation of large-scale apparatus is expensive, particularly if the device is in use just under a very short time during the academic year. A remedy is to utilize the facilities which available in the proximity of the university campus. Numerous European universities are located in downtown areas rich in cultural monuments. Pieces of art can be used for RTD studies as displayed in Figure 1. The equipment is placed in Bilbao, the metropole of Basque country. Similar sources of inspiration can be found all over the world.
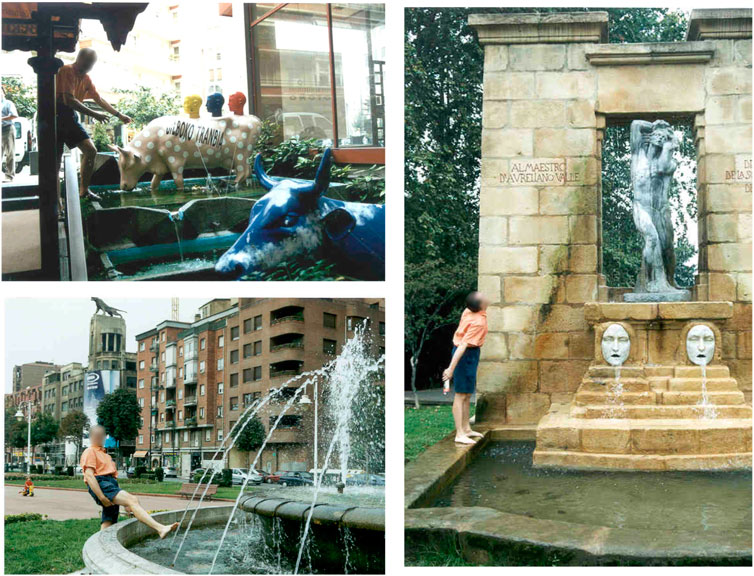
FIGURE 1. Potential experimental device for RTD studies in Bilbao.
In this work, we went out from the Laboratory of Industrial Chemistry and Reaction Engineering Åbo Akademi, into the downtown of the historical city Turku/Åbo in Southwestern Finland and carry out RTD measurements by using an urban piece of modern art. The experimental results were interpreted with laminar flow model.
2 Experimental apparatus and procedure
Turku/Åbo, the oldest city of Finland has a lot of artwork in the downtown area, not only sculptures but also fountains. A very special piece of art placed on the Old City Hall Square (N 60° 27.063 E 022° 16.502) is very suitable for RTD studies: the sculpture ‘Flow of time’ created by the famous Finnish sculptor, academician Kain Tapper (1930–2004). Water is continuously flowing in an open rectangular channel of corten steel, as illustrated in Figure 2. The properties of the experimental device are listed in Table 1. Now the question arises, which RTD model is the best one to describe the flow pattern of this popular urban artwork?
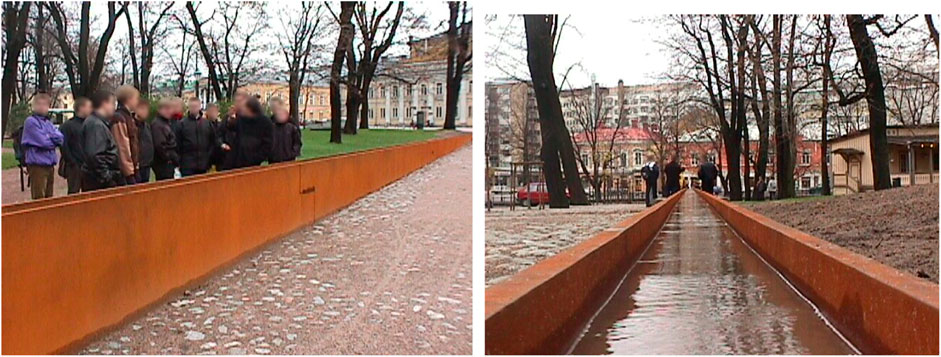
FIGURE 2. The experimental device: Flow of time in Turku/Åbo.
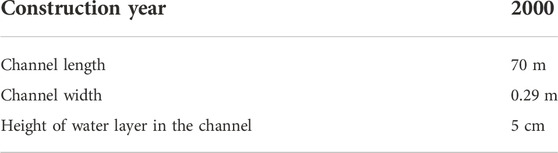
TABLE 1. Properties of “Flow of time”.
A group of young and eager undergraduate students participating in the course “Non-ideal reactor systems” at Åbo Akademi University performed impulse experiments by using “Flow of time”. NaCl was used as inert tracer. An aqueous NaCl solution was prepared in laboratory and transferred manually in plastic containers to the immediate vicinity of the artwork. Three working groups were formed: tracer injectors at the entrance of the artwork, samplers at the flow outlet and a mobile monitoring, recording and cleaning group. The task of the third group was to take photographs and keep the channel clean, because the experiments were performed in autumn and some yellow leaves dropped occasionally down from trees growing close to the channel. The injector group introduced the tracer solution instantaneously to the channel inlet, the stopwatch was switched on and discrete samples were taken in plastic bottles at the channel outlet. Several samples were taken and the experiment was repeated three times to ensure that the impulse response was caught in a representative way, including the increase, the maximum and the decline of the tracer concentration. Impulse experiments were chosen instead of step response experiments, because it was not suitable to feed continuously a salt (NaCl) into the channel of the sculpture. The water temperature was measured with an ancient thermometer found in the laboratory and the volumetric flow rate in the channel was measured by collected outlet flow during specific times in bottles with known volumes. The temperature remained very stable during the experiment (10°C). The experimental work was supervised by the main lecturer of the course, the professor in chemical reaction engineering and two assistant teachers. After completing the experiment, the young investigators collected all the sample bottles and marched 500 m to the laboratory building Axelia. The samples were immediately analyzed with conductometry and concentration versus time plots were prepared. Statistical analysis of the l data from the repeated experiments revealed that the accuracy was within 5% of the experimental data.
3 Interpretation of experimental results
3.1 RTD functions from tracer experiments
The time-dependent values of the E(t) function are obtained from the concentrations observed in the impulse experiments as follows,
where c(t) is the tracer concentration at time t. Eq. 1 fulfills the condition that its integral from 0 to ∞ is 1, i.e. all the fluid elements have the residence time between 0 and ∞. The experimental F(t) function is the integral of E(t),
In case of conductometric analysis, the measurement signal (y = conductivity) is linearly dependent on the concentration,
where α is in fact the signal value of the solvent, in the absence of the tracer, α = y0. The concentration is solved from equation Eq. 3,
After inserting the expression Eq. 4 in equation Eq. 1 we obtain
The primary conductivity data are displayed in Figure 3. The integral in the denominator is determined by numerical integration of the experimental data.

FIGURE 3. Primary experimental data: impulse response from “Flow of time”.
3.2 Laminar flow model
The well-known RTD functions of the simple one-dimensional laminar flow model are
where the mean residence time is τ. The highest liquid velocity is observed in the centre of the channel leading to the shortest residence time τ/2, whereas the liquid velocity at the channel wall is zero.
It is possible to check with simple plots, whether the model describes the experimental data or not. Furthermore, the mean liquid residence time in the channel can be estimated from the data. Two test plots were prepared, a linear one and a logarithmic one:
where X = 1/t3. The plots–ln E versus ln should be straight lines.
The results of the data analysis are provided in Figure 4. The figure indicates that within the experimental accuracy, the flow pattern can be described by the simple one-dimensional laminar flow model. However, some deviations from the linear pattern are visible in Figure 4. Partially they might be caused by experimental inaccuracy, but also by the fact that the one-dimensional laminar flow in circular channels is a simplistic approximation of the flow in the open rectangular channel. For the illustration purposes, for the undergraduate students this approach can in any case be regarded as sufficient.
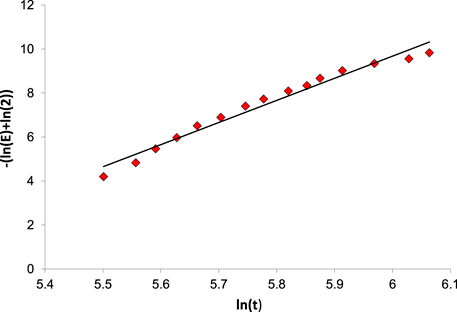
FIGURE 4. Data analysis: logarithmic plot of impulse response data.
4 Conclusion
The importance of very precise investigations of residence time distributions in flow reactors was emphasized, especially because several new types of chemical reactors and catalyst structures have been prepared in recent years. Experimental determination and theoretical interpretation of residence time distributions are central elements in chemical reaction engineering and education. Utilization of urban pieces of art as training sites for the determination and analysis of residence time distributions was proposed and successfully applied on the artwork ‘Flow of time’ in the historical downtown of Turku/Åbo. Impulse experiments obtained with sodium chloride as an inert tracer were carried out and they were interpreted with the laminar flow model. The methodology can be applied in any urban environment were pieces of modern or classical art are available.
Data availability statement
The raw data supporting the conclusion of this article will be made available by the authors, without undue reservation.
Author contributions
TS Conceptualization, Methodology, Formal analysis, Writing—original draft, Writing—review and editing, Resources, Project administration, Funding acquisition,Supervision. PT Conceptualization, Methodology, Formal analysis, Writing: review and editing. KE Conceptualization, Methodology, Resources, Project administration. JW Conceptualization, Methodology, Formal analysis, Data treatment.
Funding
This work is part of the activities financed by Academy of Finland, the Academy Professor grant 319002 (TS).
Conflict of interest
The authors declare that the research was conducted in the absence of any commercial or financial relationships that could be construed as a potential conflict of interest.
The handling editor declared a past co-authorship with the author TS.
Publisher’s note
All claims expressed in this article are solely those of the authors and do not necessarily represent those of their affiliated organizations, or those of the publisher, the editors and the reviewers. Any product that may be evaluated in this article, or claim that may be made by its manufacturer, is not guaranteed or endorsed by the publisher.
References
Baerns, M., Hofmann, H., and Renken, A. (1992). Chemische reaktionstechnik. Stuttgart: Georg Thieme Verlag.
Benneker, A. H., Kronberg, A. E., and Westerterp, K. R. (1997). Longitudinal mass and heat dispersion in tubular reactors. Ind. Eng. Chem. Res. 36, 2031–2040. doi:10.1021/ie960713j
Danckwerts, P. V. (1953). Continuous flow systems: Distribution of residence times. Chem. Eng. Sci. 2, 1–13. doi:10.1016/0009-2509(53)80001-1
Froment, G. B., Bischoff, K. B., and deWilde, J. (2010). Chemical reactor analysis and design. 3rd Edition. New York: Wiley.
Hessel, V., Hardt, S., and Köwe, H. (2004). Chemical micro process engineering. Weinheim: Wiley VCH.
Hill, C. G., and Root, T. W. (2014). An introduction to chemical engineering kinetics and reactor design. 2nd edition. New York: Wiley.
Mastroianni, M., Vajglová, Z., Eränen, K., Peurla, M., Di Serio, M., Murzin, D., et al. (2022). Microreactor technology in experimental and modelling study of alcohol oxidation on nanogold. Chem. Eng. Sci. 260, 117920. doi:10.1016/j.ces.2022.117920
Salmi, T., Mikkola, J.-P., and Wärnå, J. (2019). Chemical reaction engineering and reactor technology. 2nd Edition. Boca Raton Fl: CRC Press Taylor & Francis Group.
Shumilov, V., Kirilin, A., Tokarev, A., Boden, S., Schubert, M., Hampel, U., et al. (2022). Preparation of γ-Al2O3/α-Al2O3 ceramic foams as catalyst carriers via the replica technique. Catal. Today 383, 64–73. doi:10.1016/j.cattod.2020.09.019
Stankiewicz, A., and Moulijn, J. A. (2000). Chem: Transforming Chemical Engineering. Engineering Progress, January 2000.Process intensification
Villermaux, J. (1985). Génie de la Réaction Chimique – conception et Fonctionnement des Réacteurs. Paris: Lavoisier.
Notation
c concentration
E frequency function
F distribution function
t time
X linear variable
y measurement signal, conductivity
α parameter in signal model
β parameter in signal model
τ mean residence time
Keywords: RTD, tracer, laminar flow, dispersion, frequency function, piece of art
Citation: Salmi T, Tolvanen P, Eränen K and Wärnå J (2022) Experimental determination and mathematical modelling of residence time distributions by using pieces of urban art. Front. Chem. Eng. 4:1054124. doi: 10.3389/fceng.2022.1054124
Received: 26 September 2022; Accepted: 01 November 2022;
Published: 15 November 2022.
Edited by:
Martino Di Serio, University of Naples Federico II, ItalyReviewed by:
Ernesto Salzano, University of Bologna, ItalyFabrizio Scala, University of Naples Federico II, Italy
Copyright © 2022 Salmi, Tolvanen, Eränen and Wärnå. This is an open-access article distributed under the terms of the Creative Commons Attribution License (CC BY). The use, distribution or reproduction in other forums is permitted, provided the original author(s) and the copyright owner(s) are credited and that the original publication in this journal is cited, in accordance with accepted academic practice. No use, distribution or reproduction is permitted which does not comply with these terms.
*Correspondence: Pasi Tolvanen, ptolvane@abo.fi