MRI on a new polymeric multichannel membrane for ultrafiltration
 Stefanie Kern1†
  Rahel Lerner1†
  Nicolas Schork1 Hermann Nirschl1 Martin Heijnen2
  Gisela Guthausen1,3*
- 1Institute of Mechanical Process Engineering and Mechanics, Karlsruhe Institute of Technology (KIT), Karlsruhe, Germany
- 2inge GmbH-Dupont, Greifenberg, Germany
- 3Engler Bunte Institut, Water Chemistry and Technology, Karlsruhe Institute of Technology (KIT), Karlsruhe, Germany
Membrane ultrafiltration in new polymeric multi-channel membranes designed for in-out filtration was investigated to get insights into structure, flow and filtration properties. The apparent novelty of the membrane concerns the geometry and configuration of the feed channels. In-situ magnetic resonance imaging (MRI) allows non-invasive and non-destructive investigations with adequate spatial and time resolution. The structure of the new polymeric membrane was measured with an in-plane spatial resolution of 35 µm/pixel revealing first the polymer density distribution over the 19-channel membrane and second the wettability of the fiber and its cavities of different dimensions. MRI was also used to answer questions about flow and consequently feed distribution in the channels. Finally, in-situ filtration of an aqueous solution of sodium alginate was observed which led to deposit formation at the channel’s inner surfaces. The kinetics of this deposit formation was quantified. Backwashing and flushing gave insight into the cleanability of the channels.
1 Introduction
Polymeric ultrafiltration membranes for various water treatment applications have become standard practice since the 1990’s in many plants where turbidity, solids or pathogens need to be removed. These membranes are mostly in the hollow fiber format, as these can be operated in a dead-end/direct mode with periodic backwash as cleaning mechanism, reducing energy consumption in comparison to flat sheet, spiral wound modules. However, early membrane installations regularly suffered from fiber defects (Gijsbertsen-Abrahamse et al., 2006). As an answer to this issue, much more robust hollow fibers with significantly improved mechanical strength and durability were introduced to the market, for example the Multibore™ membrane (Heijnen et al., 2012). This Multibore™ membrane has gained a position as one of the most trusted membranes in the market and is widely used all over the world. Recently, a completely novel membrane, the Multibore™ PRO, came into the market in which the number of capillaries has increased to 19. It has a similar geometry compared to the geometries previously investigated by computational dynamics and integrally in (Doleček and Cakl, 1998; Ghidossi et al., 2006; Ghidossi et al., 2010). Apart from the number of capillaries and the capillary diameter, other characteristics like pore size, materials and surface charge for membrane filtration have been kept identical to the Multibore™ fiber membrane. From an application point of view, this new membrane Multibore™ PRO enables a drastic increase in packing density as one of the main advantages. This leads to modules with higher membrane surface area (the largest module increased from 80 to 95 m2 due to the novel Multibore™ PRO), and consequently full systems can be built with considerably lower physical as well as ecological footprint.
The Multibore™ membranes are optically opaque, thus the question arises how to characterize the filtration properties of the fiber, while a variety of powerful methods is known which in principle allow in-situ monitoring of filtration processes (Rudolph et al., 2019). Optical modalities are limited in their applicability on in-out filtration of opaque media although they gave valuable information especially in flat sheet filtration, for example (Drews et al., 2009; Dickhout et al., 2017). Apart from integral measures of flux J and transmembrane pressure pTMP as a function of filtration time known for a complete variety of substances, nuclear magnetic resonance (NMR) in form of its imaging modality, magnetic resonance imaging (MRI), was successfully applied to measure deposit formation and flow fields in the feed channels of diverse hollow fiber membranes irrespective, whether made of ceramics or polymeric materials, amongst others: (Creber et al., 2010; Bütehorn et al., 2011; Culfaz et al., 2011; Yang et al., 2014; Fridjonsson et al., 2015; Arndt et al., 2017; Schork et al., 2019; Schuhmann et al., 2019; Wypysek et al., 2019; Simkins et al., 2020; Zargar et al., 2020; Schork et al., 2021; Wypysek et al., 2021). Detailed insight into nature and time evolution of deposits in form of gels, cakes and concentration polarization was obtained, and as a consequence, deposit formation was quantitatively modeled.
On that broad basis of MRI investigations and methods, the new 19-channel fiber was investigated with respect to structure, water uptake, filtration, and cleaning properties on the microscopic level. The time resolution needs to be sufficiently good to reveal the kinetics of deposit formation. Investigations concern the fluid and deposit distribution in the channels under different conditions, and give detailed insight into the performance of the membrane. They show the impact of the drastically enlarged filtration area of the MultiboreTM Pro fiber.
2 Materials and methods
2.1 Polymeric multichannel membrane
The vast majority of polymeric ultrafiltration membranes for water filtration are made from either Polyvinyldifluoride (PVDF) or Polyethersulphone (PES). Both membrane types can be used for a wide range of filtration applications, from drinking water to municipal tertiary wastewater treatment, with differences in operating conditions. The PVDF membranes are usually operated by feeding the raw water to the outside of the fibers (out-in filtration), whereas the PES membranes are operated with raw water entering the lumen side of the capillaries (in-out filtration). Flux rates vary from 50 to 100 L/(m2h) in typical applications, depending on the feed water characteristics. The in-out membranes are typically backwashed with a flux of around 230 L/(m2h). Up to recently, the membranes by inge GmbH-Dupont were produced from PES and consisted of seven capillaries, the mentioned Multibore™ membrane. These membranes usually are operated in dead-end/direct flow mode. In a previous study this membrane has been analyzed by MRI (Schuhmann et al., 2019), showing that the flow distribution during filtration as well as during backwashing is even. The average pore size of these membranes is around 20 nm and the molecular weight cut-off has been measured at 100 kDa (both based on manufacturers internal methods). The novel polymeric membranes used in the present study have the same base ingredients with PES as the main polymer, the surface characteristics and average pore size, however they exhibit 19 feed capillaries. This membrane is called the Multibore™ PRO. The inner diameter of the channels amounts to 2*r0 = 0.7 mm, as compared to 0.9 mm for the Multibore™ membrane with seven capillaries. As evident from the photograph (Figure 1), the channels are sorted in two rings of 6 and 12 channels around the central channel with corresponding radii of about 1 mm and 2.2 mm. The benefits of this fiber are easier handling during manufacturing, but as mentioned and more importantly, it is possible to effectively pack more active membrane surface area in a module. This increase amounts to around 18%. As a consequence, less modules need to be transported and filtration plants can be built with a reduced physical footprint.
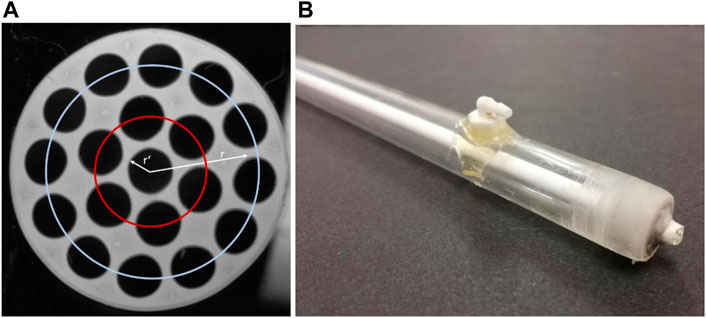
FIGURE 1. (A) Photograph of the polymeric 19-channel membrane in an axial slice. The channels are located around the central channel with inner diameters of roughly 0.7 mm. The radii are around 1 mm and 2.2 mm, respectively, for the 6-membered (red) and the 12-membered (light blue) ring of channels. Additionally, the radial coordinate r is indicated, which is the radial distance from the center. (B) Photograph of the MRI compatible filtration module with permeate outlet and the glued membrane.
The Multibore™ PRO membrane fibers were glued by silicone into an MRI compatible filtration module, which allowed in-situ measurements under filtration conditions (under flow) as well as under static conditions.
2.2 Feed properties filtration parameters
Fresh 19-channel Multibore™ PRO membranes were used to study wettability and flow fields in the diverse feed channels. The latter give an indication about the incoming flow and the transition from a 6 mm feed tube to the 19 channels of the membrane. Doubly-deionized water was used in these studies ensuring an independence on common water impurities.
The specifications of Multibore™ PRO defined the pressure ranges of filtration. Thus, transmembrane pressures pTMP in the range pTMP ϵ [0.1, 0.5] bar were used in the filtration and backwashing experiments. Filtration was performed over 1–2 h in the constant pressure mode, while backwashing at pTMP = 0.5 bar was done on a time scale of [20, 30]s. In each study, one filtration cycle was performed.
While using pure water as feed to determine the water equivalent or flux reference, MR images revealed structural changes with increasing “filtration” time. The flux J amounted to J = 82 L/(m2h) at pTMP = 0.12 bar, while J = 325 L/(m2h) at pTMP = 0.51 bar.
As feed in the filtration experiments, the well-known aqueous sodium alginate solution, for example (Arndt et al., 2017; Schork et al., 2021), was applied with the following composition: cNaAl = 200 mg/L, cCa2+ = 2 mmol/L, and the concentration of MRI contrast agent “Nanomag-D-spio MagAlg” was cCA = 1 mmol/L. The sodium alginate is known to form gels mediated by Ca2+ ions which is illustrated in the egg-box model (Grant et al., 1973). Above a certain concentration and on a time scale compatible with the MRI experiments the build-up of deposit can thus be monitored and analyzed. The nano-particulate contrast agent used is chemically compatible with the sodium alginate and was shown to remain in the gel. It therefore provides a well-established possibility to improve the MR image contrast while keeping the MRI measurement time comparatively short in a time range <1 min. The characteristics of the contrast agent, which are most relevant for the MRI experiments apart from possible sedimentation and agglomeration, are the relaxivities, i.e., the paramagnetic relaxation enhancement. The relaxivities of Nanomag-D-spio MagAlg amount to r1 = 1.1 1/(s mol) and r2 = 231.2 1/(s mol) at a 1H Larmor frequency of 200 MHz, in the range of previous values (Arndt et al., 2016; Arndt et al., 2017; Schuhmann et al., 2018; Schork et al., 2021). The transverse relaxivity r2 is dominant as usually observed in the case of nano-particulate contrast agents, for example (Vuong et al., 2012). This dominance of r2 leads to a reduced intensity in the MR images when the contrast agent is present in significant concentrations above the lower limit of detection. The deposits of alginate gel on the inner surface of the channels will therefore appear “darker” than the liquid feed and permeate in the usually acquired relaxation weighted images.
Apart from the mentioned concentrations, the following filtration parameters were used in the experiments: Filtration was performed as in-out filtration with quasi-constant pressure, namely pTMP = 0.5 bar for pure water filtration (water equivalent) and during filtration of aqueous sodium alginate, respectively. The backwashing was also performed at pTMP = 0.5 bar. The filtration setup was the same as described for example in Schork et al.( 2021). Also, the procedures for filtration and backwashing were similar to the previously described ones.
2.3 MRI: Experimental setup
The polymeric 19-channel membrane Multibore™ PRO was glued into an MRI compatible single-fiber module as mentioned (Figure 1), the fluidic connections and valves for controlling the fluidic paths of feed, concentrate, and permeate were realized as described e.g., in (Schuhmann et al., 2019; Schork et al., 2021). In-situ MRI experiments were performed to get time and spatially resolved insight into filtration and backwashing properties via structural imaging and flow imaging. All experiments were performed on an NMR Bruker Avance III 200 MHz spectrometer equipped with the software Paravision 6. An actively shielded Micro2.5 gradient provided the gradient pulses for three-dimensional spatial resolution, while a MIC-WB40 birdcage was used with an inner diameter of 20 mm as radio-frequency coil. The raw data were processed within self-written MATLAB scripts to obtain the MR images of the 19-channel membranes as well as the radial distributions of MR intensity as a function of filtration time. The module was constructed such that it could be repositioned in the magnet/birdcage during the processes.
Diverse pulse sequences are known in MRI (Callaghan, 1991; Kimmich, 1997), three of them were used to study the new membrane and were established in previous investigations (Schuhmann et al., 2019; Schork et al., 2021): Shortly, image contrast is created by NMR relaxation times in the case of the used RARE and FLASH sequences. These relaxation times are often specific for the materials under investigation. Depending on the chosen pulse sequence parameters, mainly repetition time TR and echo time τE, the MRI signal of a given volume element is weighted accordingly. Thereby and roughly, TR determines the weighting by the longitudinal relaxation time T1, whereas τE determines the weighting by the transverse relaxation time T2.
The advantage of “rapid acquisition with relaxation enhancement” RARE is founded in its lower sensitivity towards magnetic susceptibility and its relative stability against image artifacts when compared to gradient echo-based sequences like “fast low angle shot” FLASH or “echo planar imaging” EPI, while RARE requires often larger measurement times. As the magnetic susceptibility differences between feed, permeate, and the polymeric material of the membrane are relatively small in the present case, the images especially during filtration were acquired using a FLASH sequence based on gradient refocusing. The flow fields were measured by flow_map, which allows the measurement of relative velocities in the channels in all spatial directions, i.e, vx, vy, vz, while knowing about the limitations in the actual implementation. Flow_map is also based on gradient refocusing, therefore sensitive to T2*, which is an effective transverse relaxation rate taking into account the locally slightly different magnetic fields in the sample under investigation. The essential experimental MRI parameters are summarized in Table 1.
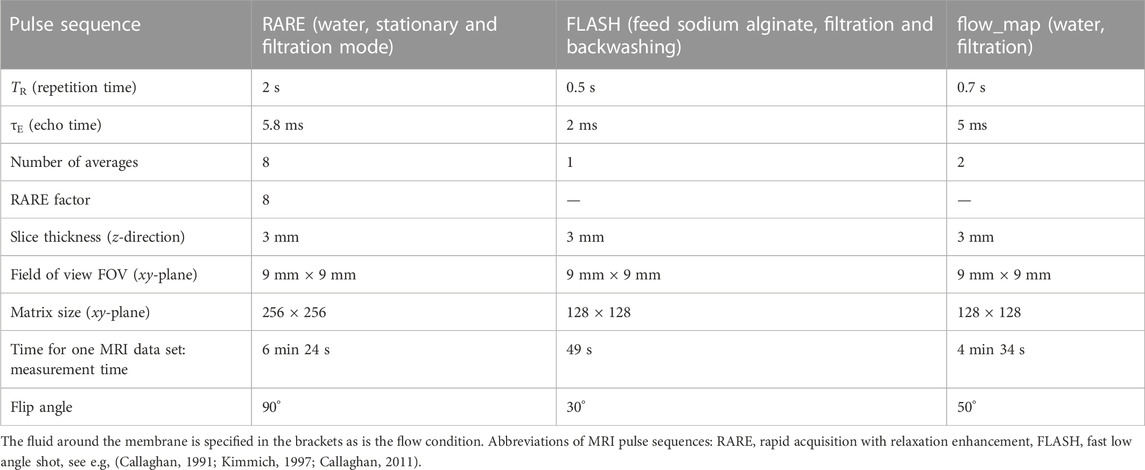
TABLE 1. MRI parameters for structural and flow MRI.
3 Results and discussion
3.1 Pure water filtration: Structure and flow fields
3.1.1 Structure of the polymeric 19-channel fiber
The first question to be answered concerns the wettability apart from the geometry. A piece of a fiber was therefore soaked into pure water and measured by MRI using a RARE sequence (Table 1). The measurement was done stationary (velocity field
The axial MR images of the hollow fiber membrane show the expected structure: the 19 feed channels are easily identified. As they are filled with pure water as is the outer volume in the sample’s container, these areas are bright and initially show the largest normalized intensities around 0.85. The inner surfaces of the channels as well as the outer surface of the membrane exhibit normalized intensities around 0.6–0.7, while the remaining area of the polymer shows normalized intensities around 0.8. Additionally, areas in the fiber with almost no MRI signal can be clearly identified which are attributed to areas of high air content and smaller polymer density. These voids show different sizes in the inner and outer ring (6 and 12 voids, respectively), while an internal structure appears to be present in the inner, larger air-filled areas.
When soaked into water for 48 h (MR image in the middle of Figure 2), the inner surface of all the channels becomes bright which means larger relative MRI intensities in these pixels. As the acquisition parameters were the same, i.e., dominantly T2 weighted images were acquired, and the spin density does also not change significantly, the first interpretation would be that the effective transverse relaxation of these regions became slower, leading to larger normalized intensities in the images. However and remarkably, the normalized intensity became larger than that of the water phase in the surrounding of the membrane which is in contradiction to the previous statement. An explanation can be found in the less pronounced weighting with the longitudinal relaxation time T1. This weighting causes damping of the intensity of those materials with large T1 while the intensity of materials with smaller T1 will become comparatively larger in the images. In the present system, pure water shows relatively large T1 relaxation times, while polymers and guest molecules in these structures usually exhibit smaller T1. An interpretation of the findings thus could be that the active layer of the membrane swells during exposure to water or releases substances which reduce the longitudinal relaxation time of mainly water molecules in these areas which increase slightly the intensity in the images. In this case, washing of the membrane would reduce the effect.
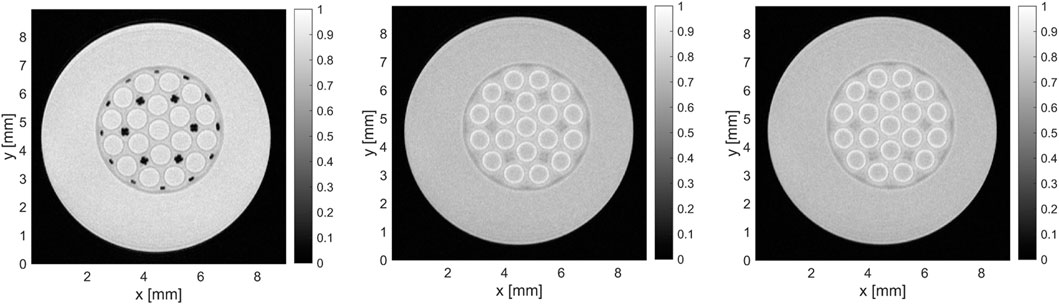
FIGURE 2. Axial RARE MR images of the 19-channel membrane during exhibition to pure water. From left to right: fresh membrane in pure water, membrane after being soaked in pure water for 48 h, and membrane in the filtration module after 10 min of axial flow through at pTMP = 1 bar. The images show significant changes of contrast near the inner surface, i.e., in the active layers, of the 19 feed channels as well as in the dark regions of low polymer density, while the inner surfaces/active layers of the feed channels gain intensity upon water contact.
Please note in addition that the black voids visible in the left image (fresh membrane, Figure 2) became gray, an intrinsic structure becomes clearly visible especially for the larger voids. The interpretation is that the voids become increasingly filled with water, thus the NMR intensity increases with time. Similar observations were made on the polymeric membrane Multibore™ (Schuhmann et al., 2019).
The image on the right in Figure 2 was measured after 10 min of axial flow of pure water in the feed channels leading to a volume of about 3L during that time. The images in the middle and on the right in Figure 2 differ only very little. If the bright rings would only be due to some release of substances like glycerin, these substances will be washed out, and the image will again present darker rings around the feed channel—which is not observed. Instead, the bright and slightly expanded structures remained. This observation suggests the interpretation of swelling being the more probable. Swelling of polymers in addition leads to changes in the effective pore size distribution and thus affects the overall filtration efficiency.
3.1.2 Flow fields of pure water in the 19-channel membrane
An important quality factor of a multichannel membrane concerns the distribution of feed and filtration properties of each channel. Questions are whether the channels are equally fed and streamed through by feed and consequently provide an increased filtration performance—ideally just related to the area of the active filtration layer which would be just the sum of all the 19 single channel areas. An approach for investigation of this battery of questions is to measure the flow field inside the channels and in the supporting material of the membrane (velocity field
On the macroscopic scale (Figure 3, bottom), pTMP slightly increased at the beginning of pure water filtration while J essentially became constant after 1 min, subsequently showing a slight decrease in accordance with pTMP. Initial velocity images were measured with the pulse sequence flow_map which results in the flow field in the membrane, and more importantly, it allows for the comparison of in-plane velocities, here vx, and the axial velocity vz in the 19 feed channels. Please note the different grey scale bars on the images which represent the velocities vz and vx. They differ by roughly an order of magnitude. In addition, vx shows positive and negative contributions, depending on the position of the channel as the permeate flow is symmetric along r from inside to the outside of the membrane.
FIGURE 3. Top left: Positions of MRI measurements along the filtration module. Position z = 32.5 cm is located near the permeate outlet, z = 20 cm roughly is in the middle of the used membrane. While pTMP = .5 bar, the velocity along z, vz, shows the expected laminar profile in the channels (pure water). The value of vz obviously depends on the radial position of the channel in the xy plane: vz is much larger in the center channel of the membrane than in the outer channels. Compared to vz, the in-plane velocities, here the example of vx, are orders of magnitude smaller as expected. Nevertheless, channeling of the permeate in the fiber can be observed similar to the findings in (Schuhmann et al., 2019). Please also note that the direction of flow is radial, which leads to positive and negative values of vx. Bottom: Parallel to the MRI measurements, the established filtration parameters were recorded as a function of filtration time for pure water filtration: While pTMP increases slightly, the permeate volume flow or flux J approximately stays constant.
It is evident in the image (Figure 3) that vz depends on the position of the channel within the membrane in this measurement on a fresh membrane near the permeate outlet (z = 32.5 cm): While vz in all channels behaves laminarly, its quantity depends on the radial position r: The orders of magnitude are the following: vz,max(r = 0 mm) = 11 cm/s (corresponding to (x,y) = (4.5, 4.75) mm in the image) in the center of the membrane, vz,max(r = 1 mm) = 8 cm/s and vz,max(r = 2.2 mm) = 4 cm/s. Summarizing, the axial water flow is not equal in the diverse channels at the initial stage and z = 32,5 cm, but decreases as function of distance from the center. These findings are supported by the in-plane velocities, here on the example of vx. Its absolute maximum values were observed in the ridges between the channels while the absolute values increase with r. This is correlated with the liquids volume to be transported to the permeate channel. The ridges visible in the vx flow image cross the areas of lower polymer density in the inner as well as in the outer ring, which serve for a reduction element of pressure resistance. Hardly measurable, but to be mentioned and discussed is the radial variation of pTMP. The distance of a specific feed channel depends on the position in the membrane, so does the individual pTMP unless the construction of the membrane is such that the difference in pTMP at least is partially compensated by structuring the support material. An indication for the consideration of this fact can be seen in the ridges which are obvious in the vx images.
Interestingly, the velocity distribution at z = 20 cm (not shown) is significantly narrower which was measured at a later time after flushing the membrane for several hours with water. While the flow within the channels is still laminar as expected, the dependence on the hollow fiber membrane’s radius was no longer observed.
3.3 Filtration and backwashing of aqueous sodium alginate
Filtration was performed on a fiber with a length of about 38 cm, while the observation by MRI was realized at z = 32.5 cm (Figures 3, 4). The filtration mode was in-out in dead-end/direct flow which allowed the detailed observation of deposit formation in each of the 19 channels.
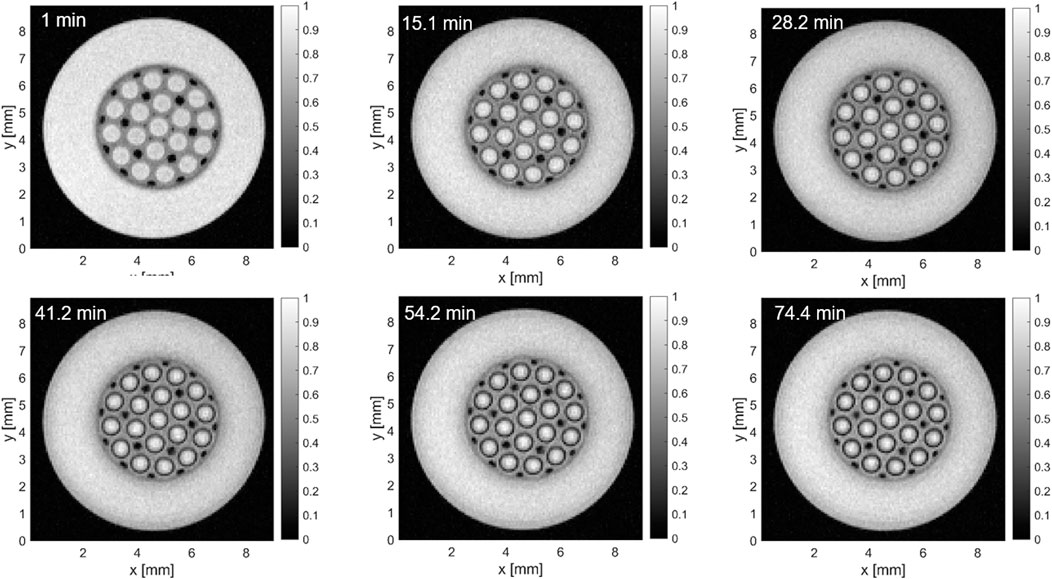
FIGURE 4. Exemplary axial MR images of a time series measured during filtration with aqueous sodium alginate at z = 32.5 cm. The filtration time is indicated in the images. The deposit forms on the inner surface of each of the channels, while the permeate keeps the expected high relative signal intensities. The deposit is already evident in the second image in the upper row after 15.1 min and has an effective thickness of more than 140 µm. During this first hour of deposit formation the channels show similar behavior which is indicated by the relative thickness and the relative signal intensity of the deposit along the filtration time. Please also note that the air-filled areas in the membrane (black areas) are MR-silent over the complete filtration experiment.
With increasing filtration time, the deposit at z = 32.5 cm forms on the inner surface of the feed channels. All 19 channels qualitatively show a similar behavior as a function of filtration time: the black rings increase in effective thickness, while the structure of the membrane does not change. The air-filled areas which were observed also in the experiments with pure water are visible in all the measured images. Permeate is hardly visible in these voids, they appear to be filled with water only in the case of reverse pressure difference.
The MR images were processed to quantify the kinetics of deposit formation exemplarily in three channels, one in each ring (not shown). Each of the three channels was regarded as an area in which the signal intensity was averaged over the angle, see also (Schuhmann et al., 2018; Schork et al., 2019; Schuhmann et al., 2019; Schork et al., 2020), leading to a radial profile of the MR intensity as a function of the distance to the center, the radius coordinate r′ of the channel under investigation (Figure 1). For an easy comparison, the radial distance r′ was normalized to the radius of the feed channels r0. The thus calculated intensity profiles I(r′/r0) of the center channel and of the channel in the inner ring were modelled by a sigmoidal Boltzmann function, which reveals the tangential slope m, the turning point x0 apart from intensities as fit parameters:
It was also noted that the radial dependence of the MR intensity in the channel located in the outer ring followed an exponential behavior which is indicative for slower deposit formation and gelling.
Especially x0 reveals the progress of deposit formation and can be regarded as a measure for the deposit height. It allows the quantification of the deposit formation kinetics at the given temperature, pressure, and feed composition. x0 of all three channels can be described by exponential decay functions (Figure 5, on the right) of filtration time t, while the time parameter amounts to 31 min for the center channel, 33 min for the ring at r = 1.1 mm and to 90 min for the channel in the outer ring at r = 2.2 mm. Few, not very reliable data points were excluded from the fit at small t in case of r = 1.1 mm.
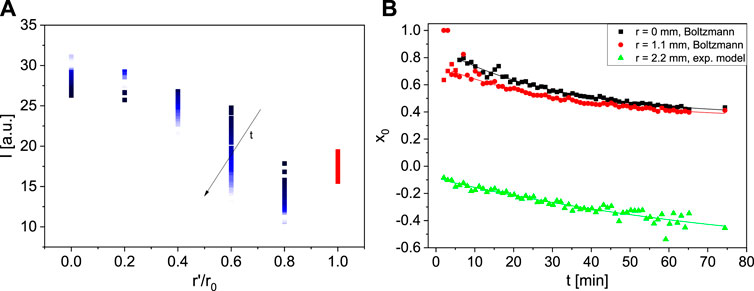
FIGURE 5. Three-step data processing: The normalized r′-profiles were obtained by averaging of the MR intensity I over the angle leading to the profiles I(r′/r0), here on the example of the center channel (A), implicitly as a function of filtration time t. These profiles were modelled by a sigmoidal Boltzmann function for the center channel and the channel at r = 1.1 mm and an exponential function for r = 2.2 mm, respectively, leading to the corresponding fit parameters as a function of t. Due to partial volume effects, the point directly at the membranes surface was excluded (red points in the left graph). (B) Subsequently, the time-critical parameters x0(t) were modelled by an exponential decay function, resulting in the typical times for deposit formation under the chosen conditions.
Apart from deposit formation, the cleanability of the feed channels and especially of their active layer is essential for an efficient and long-term use. Experiments were therefore performed which show these properties in the present case of the alginate gel deposit (Figure 6).
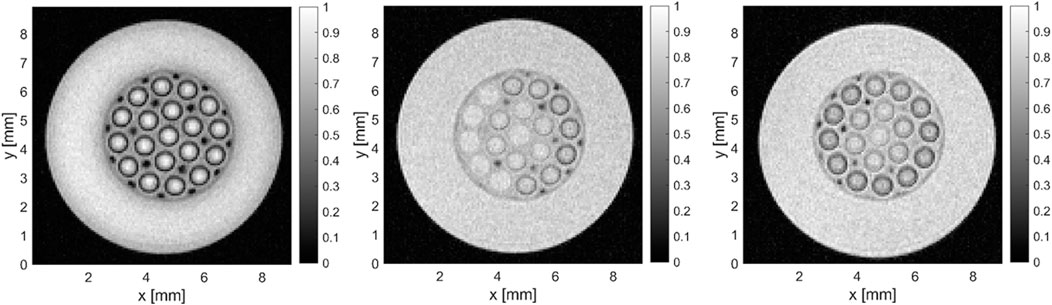
FIGURE 6. From left to right: After filtration, dark deposit rings are visible in all 19 channels (z = 32.5 cm). At z = 32.5 cm, flow-through reduced the deposit in seven channels nearly completely, in additional five channels to a large extent, while the deposit is still prominent in seven channels located in the outer ring. At z = 27.7 cm instead, flow-through reduced the deposit in the inner channels. Please note also the behavior of the dark, air-filled regions: While they appear dark in the MR image directly after filtration, the less dense regions appear at least partially filled with water in the images during flushing.
One procedure to remove deposits is backwashing. It was applied to the 19-channel membrane after filtration and flow-through. An MR image was acquired at z = 27.7 cm, which reveals that the gel layer was removed in all but four channels (Figure 7). These channels show the diversity of residues: a complete but swollen gel layer was observed as well as disrupted parts and partial washing-out. The majority of the channels, however, is cleaned up completely from the perspective of the MRI with the used spatial resolution of 70 µm. It is worth to note that the MR-intense circular regions at the surface of the channels disappeared, and the polymer shows a uniform MR intensity. The dark regions as well disappeared in the image. These facts indicate that the backwashing with pTMP = .5 bar leads to structural changes and water redistribution in the fiber.
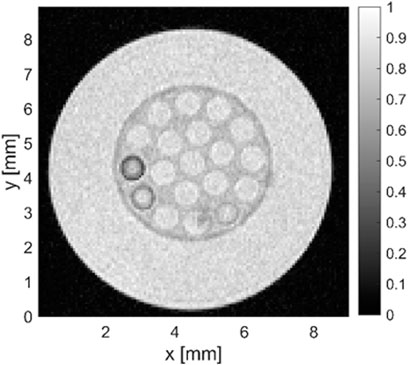
FIGURE 7. MR image after backwashing of the membrane: in four channels, the deposit is still observed to different extents, one being blocked (left), the neighboring channel still covered, but fluffily. A detached piece of the alginate gel is visible in the channel on the bottom, while its neighbor shows a less dense and loose structure.
4 Conclusion
MRI studies on a new 19-channel polymeric membrane for ultrafiltration first gave insight into structure, wettability, flow distribution and liquid distribution. Second, the filtration of a gel-forming aqueous solution of sodium alginate provided insight into the deposit formation in the different channels and showed homogeneous flow distribution over the 19 channels. The kinetics of deposit formation could be quantified. The time constants in an exponential model were in the range of 30–90 min under the given conditions. The results of the fouling experiments clearly showed that all 19 capillaries contribute equally during filtration. Backwashing led to effective, but still incomplete cleaning of the channels, with no clear preferential routes observed between the three rows of channels. Compared to previous MRI measurements on ceramic membranes, the polymeric membranes do not require the well-established spin echo-based methods, e.g., RARE, during filtration due to the lower difference of magnetic susceptibilities of the involved substances. The use of gradient echo-based sequences like the well-known FLASH leads to smaller measurement times while retaining the information depth and consequently to an improved time resolution of the MRI observation of deposit formation. In summary, the applicability of FLASH is better for the polymeric membranes compared to the ceramic membranes due to the smaller magnetic susceptibility difference between the aqueous solutions and the polymeric membrane.
Data availability statement
The raw data supporting the conclusion of this article will be made available by the authors, without undue reservation.
Author contributions
Conceptualization and methodology: SK, RL, and GG. Data curation, investigation: NS and GG. Resources: HN and MH. Visualization and writing—original draft preparation: SK, RL, MH, and GG. Writing—review and editing: SK, RL, NS, HN, MH, and GG. Supervision and funding acquisition: HN. All authors have read and agreed to the published version of the manuscript.
Funding
This work was supported by Deutsche Forschungsgemeinschaft concerning the NMR instrumentation as well as within “Sachbeihilfe.”
Acknowledgments
The diverse financial supports by DFG are highly appreciated. Special thanks to the colleagues in the instrumental facility Pro2NMR.
Conflict of interest
Author MH was employed by inge GmbH-Dupont.
The remaining authors declare that the research was conducted in the absence of any commercial or financial relationships that could be construed as a potential conflict of interest.
Publisher’s note
All claims expressed in this article are solely those of the authors and do not necessarily represent those of their affiliated organizations, or those of the publisher, the editors and the reviewers. Any product that may be evaluated in this article, or claim that may be made by its manufacturer, is not guaranteed or endorsed by the publisher.
References
Arndt, F., Roth, U., Nirschl, H., Schütz, S., and Guthausen, G. (2016). New insights into sodium alginate fouling of ceramic hollow fiber membranes by NMR imaging. AIChE J. 62 (7), 2459–2467. doi:10.1002/aic.15226
Arndt, F., Schuhmann, S., Guthausen, G., Schütz, S., and Nirschl, H. (2017). In situ MRI of alginate fouling and flow in ceramic hollow fiber membranes. J. Membr. Sci. 524, 691–699. doi:10.1016/j.memsci.2016.11.079
Bütehorn, S., Utiu, L., Küppers, M., Blümich, B., Wintgens, T., Wessling, M., et al. (2011). NMR imaging of local cumulative permeate flux and local cake growth in submerged microfiltration processes. J. Membr. Sci. 371 (1-2), 52–64. doi:10.1016/j.memsci.2011.01.018
Callaghan, P. T. (1991). Principles of nuclear magnetic resonance microscopy. New York: Oxford University Press.
Callaghan, P. T. (2011). Translational dynamics and magnetic resonance: Principles of pulsed gradient spin echo NMR. New York, US: Oxford University Press.
Creber, S. A., Pintelon, T. R. R., Graf von der Schulenburg, D. A., Vrouwenvelder, J. S., van Loosdrecht, M. C. M., and Johns, M. L. (2010). Magnetic resonance imaging and 3D simulation studies of biofilm accumulation and cleaning on reverse osmosis membranes. Food Bioprod. Process. 88 (C4), 401–408. doi:10.1016/j.fbp.2010.08.010
Culfaz, P. Z., Bütehorn, S., Utiu, L., Küppers, M., Blümich, B., Melin, T., et al. (2011). Fouling behavior of microstructured hollow fiber membranes in dead-end filtrations: Critical flux determination and NMR imaging of particle deposition. Langmuir 27 (5), 1643–1652. doi:10.1021/La1037734
Dickhout, J. M., Moreno, J., Biesheuvel, P. M., Boels, L., Lammertink, R. G. H., and de Vos, W. M. (2017). Produced water treatment by membranes: A review from a colloidal perspective. J. Colloid Interface Sci. 487, 523–534. doi:10.1016/j.jcis.2016.10.013
Doleček, P., and Cakl, J. (1998). Permeate flow in hexagonal 19-channel inorganic membrane under filtration and backflush operating modes. J. Membr. Sci. 149 (2), 171–179. doi:10.1016/S0376-7388(98)00195-1
Drews, A., Arellano-Garcia, H., Schöneberger, J., Schaller, J., Wozny, G., and Kraume, M. (2009). Model-based recognition of fouling mechanisms in membrane bioreactors. Desalination 236 (1), 224–233. doi:10.1016/j.desal.2007.10.071
Fridjonsson, E. O., Vogt, S. J., Vrouwenvelder, J. S., and Johns, M. L. (2015). Early non-destructive biofouling detection in spiral wound RO membranes using a mobile Earth׳ s field NMR. J. Membr. Sci. 489, 227–236. doi:10.1016/j.memsci.2015.03.088
Ghidossi, R., Carretier, E., Veyret, D., and Moulin, P. (2010). Optimizing the compacity of ceramic membranes. J. Membr. Sci. 360, 483–492. doi:10.1016/j.memsci.2010.05.050
Ghidossi, R., Veyret, D., and Moulin, P. (2006). Computational fluid dynamics applied to membranes: State of the art and opportunities. Chem. Eng. Process. Process Intensif. 45 (6), 437–454. doi:10.1016/j.cep.2005.11.002
Gijsbertsen-Abrahamse, A. J., Cornelissen, E. R., and Hofman, J. A. M. H. (2006). Fiber failure frequency and causes of hollow fiber integrity loss. Desalination 194, 251–258. doi:10.1016/j.desal.2005.11.010
Grant, G. T., Morris, E. R., Rees, D. A., Smith, P. J., and Thom, D. (1973). Biological interactions between polysaccharides and divalent cations: The egg-box model. FEBS Lett. 32 (1), 195–198. doi:10.1016/0014-5793(73)80770-7
Heijnen, M., Winkler, R., and Berg, P. (2012). Optimisation of the geometry of a polymeric Multibore® ultrafiltration membrane and its operational advantages over standard single bore fibres. Desalination Water Treat. 42 (1-3), 24–29. doi:10.5004/dwt.2012.2446
Rudolph, G., Virtanen, T., Ferrando, M., Guel, C., Lipnizki, F., and Kallioinen, M. (2019). A review of in situ real-time monitoring techniques for membrane fouling in the biotechnology, biorefinery and food sectors. J. Membr. Sci. 588, 117221. doi:10.1016/j.memsci.2019.117221
Schork, N., Schuhmann, S., Gruschke, O., Groß, D., Zick, K., Nirschl, H., et al. (2020). “Recent MRI and diffusion studies of food structures,” in Annual reports on NMR spectroscopy. Editor G. A. Webb (Massachusetts, United States: Academic Press), 203–264.
Schork, N., Schuhmann, S., Nirschl, H., and Guthausen, G. (2021). Compressed sensing MRI to characterize sodium alginate deposits during cross-flow filtration in membranes with a helical ridge. J. Membr. Sci. 626, 119170. doi:10.1016/j.memsci.2021.119170
Schork, N., Schuhmann, S., Nirschl, H., and Guthausen, G. (2019). In situ measurement of deposit layer formation during skim milk filtration by MRI. Magnetic Reson. Chem. 57, 738–748. doi:10.1002/mrc.4826
Schuhmann, S., Schork, N., Beller, K., Nirschl, H., Oerther, T., and Guthausen, G. (2018). In-situ characterization of deposits in ceramic hollow fiber membranes by compressed sensing RARE-MRI. AIChE J. 64 (11), 4039–4046. doi:10.1002/aic.16201
Schuhmann, S., Simkins, J. W., Schork, N., Codd, S. L., Seymour, J. D., Heijnen, M., et al. (2019). Characterization and quantification of structure and flow in multichannel polymer membranes by MRI. J. Membr. Sci. 570, 472–480. doi:10.1016/j.memsci.2018.10.072
Simkins, J. W., Schuhmann, S., Guthausen, G., Heijnen, M., Codd, S. L., and Seymour, J. D. (2020). Characterization of biofilm distribution in hollow fiber membranes using Compressed Sensing Magnetic Resonance Imaging. J. Membr. Sci. 594, 117437. doi:10.1016/j.memsci.2019.117437
Vuong, Q. L., Van Doorslaer, S., Bridot, J.-L., Argante, C., Alejandro, G., Hermann, R., et al. (2012). Paramagnetic nanoparticles as potential MRI contrast agents: Characterization, NMR relaxation, simulations and theory. Magnetic Reson. Mater. Phys. Biol. Med. 25 (6), 467–478. doi:10.1007/s10334-012-0326-7
Wypysek, D., Kalde, A. M., Pradellok, F., and Wessling, M. (2021). In-situ investigation of wetting patterns in polymeric multibore membranes via magnetic resonance imaging. J. Membr. Sci. 622, 119026. doi:10.1016/j.memsci.2020.119026
Wypysek, D., Rall, D., Wiese, M., Neef, T., Koops, G.-H., and Wessling, M. (2019). Shell and lumen side flow and pressure communication during permeation and filtration in a multibore polymer membrane module. J. Membr. Sci. 584, 254–267. doi:10.1016/j.memsci.2019.04.070
Yang, X., Fridjonsson, E. O., Johns, M. L., Wang, R., and Fane, A. G. (2014). A non-invasive study of flow dynamics in membrane distillation hollow fiber modules using low-field nuclear magnetic resonance imaging (MRI). J. Membr. Sci. 451 (0), 46–54. doi:10.1016/j.memsci.2013.09.015
Keywords: MultiboreTM PRO, multichannel fiber, MRI, filtration, polysaccharides, polymeric membrane
Citation: Kern S, Lerner R, Schork N, Nirschl H, Heijnen M and Guthausen G (2023) MRI on a new polymeric multichannel membrane for ultrafiltration. Front. Chem. Eng. 4:1083180. doi: 10.3389/fceng.2022.1083180
Received: 28 October 2022; Accepted: 16 December 2022;
Published: 01 February 2023.
Edited by:
Diana Bernin, Chalmers University of Technology, SwedenReviewed by:
Geneviève Gésan-Guiziou, INRA Centre Bretagne-Normandie, FranceSergio G. Salinas-Rodriguez, IHE Delft Institute for Water Education, Netherlands
Copyright © 2023 Kern, Lerner, Schork, Nirschl, Heijnen and Guthausen. This is an open-access article distributed under the terms of the Creative Commons Attribution License (CC BY). The use, distribution or reproduction in other forums is permitted, provided the original author(s) and the copyright owner(s) are credited and that the original publication in this journal is cited, in accordance with accepted academic practice. No use, distribution or reproduction is permitted which does not comply with these terms.
*Correspondence: Gisela Guthausen, gisela.guthausen@kit.edu
†These authors have contributed equally to this work and share first authorship