Nebulization of model hydrogel nanoparticles to macrophages at the air-liquid interface
 Emma R. Sudduth
 Emily L. Kolewe
 Jodi Graf
 Yinkui Yu
 Joaquina Somma
 Catherine A. Fromen
- Department of Chemical and Biomolecular Engineering, University of Delaware, Newark, DE, United States
Introduction: Nanoparticle evaluation within the pulmonary airspace has increasingly important implications for human health, with growing interest from drug delivery, environmental, and toxicology fields. While there have been widespread investigations of nanoparticle physiochemical properties following many routes of administration, nanoparticle behavior at the air-liquid interface (ALI) is less well-characterized.
Methods: In this work, we fabricate two formulations of poly(ethylene)-glycol diacrylate (PEGDA)-based model nanoparticles to establish an in vitro workflow allowing evaluation of nanoparticle charge effects at the ALI.
Results and Discussion: Both cationic and anionic PEGDA formulations were synthesized with similar hydrodynamic diameters around ∼225 nm and low polydispersity, with expected surface charges corresponding with the respective functional co-monomer. We find that both formulations are readily nebulized from an aqueous suspension in a commercial Aeroneb® Lab Nebulizer, but the aqueous delivery solution served to slightly increase the overall hydrodynamic and geometric size of the cationic particle formulation. However, nanoparticle loading at 50 μg/ml of either formulation did not influence the resultant aerosol diameter from the nebulizer. To assess aerosol delivery in vitro, we designed a 3D printed adapter capable of ensuring aerosol delivery to transwell 24-well culture plates. Nanoparticle uptake by macrophages was compared between traditional cell culture techniques and that of air-liquid interface-cultured macrophages following aerosol delivery. Cell viability was unaffected by nanoparticle delivery using either method. However, only traditional cell culture methods demonstrated significant uptake that was dependent on the nanoparticle surface charge. Concurrently, air-liquid interface culture resulted in lower metabolic activity of macrophages than those in traditional cell culture, leading to lower overall nanoparticle uptake at air-liquid interface. Overall, this work demonstrates that base-material similarities between both particle formulations provide an expected consistency in aerosol delivery regardless of the nanoparticle surface charge and provides an important workflow that enables a holistic evaluation of aerosolizable nanoparticles.
Introduction
In the era of the COVID-19 pandemic, investigations of aerosol delivery to the lung have gained significant attention. Studies specifically of pulmonary nanoparticle (NP) delivery remain of great importance to the medical field, with opportunities to design new therapeutics and also investigate outcomes of aerosol exposure with virology and toxicological implications (Lu and Hickey, 2007; Patton and Byron, 2007; Mühlfeld et al., 2008; Mansour et al., 2009; Weers et al., 2010; Bressot et al., 2015; Muralidharan et al., 2015; Bressot et al., 2018). Synthetic NPs offer an untapped opportunity for new therapeutics, enabling deep lung deposition, co-delivery and sustained release, and controlled interactions with lung immune cells to drive local immune responses (Neutra and Kozlowski, 2006; Swartz et al., 2012; Zhao et al., 2014; Moyer et al., 2016). When evaluated at the microenvironment length scale of the lung, NPs with at least one dimension measured in the nanometer range have physical characteristics that can enable mucosal penetration, cellular uptake, and even tissue extravasation (Muralidharan et al., 2015). However, isolated NPs do not deposit at high efficiencies in the deep lung, due to the physical barrier of the branching lung structure and the lack of inertia to promote deposition (Patton and Byron, 2007). Thus, for drug delivery applications, NPs require additional considerations for aerosol formulation, which can include controlled aggregation or delivery in an excipient carrier, with development of many novel formulations underway (El-Sherbiny and Smyth, 2010; El-Sherbiny et al., 2010; Du et al., 2015; Jarai et al., 2020; Abdellatif et al., 2021; Jarai et al., 2021a; Popowski et al., 2022). However, while there are widespread investigations into the role of NP physiochemical properties following many routes of administration, studies of NPs performed in both the drug delivery and toxicology fields have only recently integrated both aerosol and biological assessments, with many outstanding questions remaining.
This seemingly obvious omission stems from the slow development of effective models of the pulmonary microenvironment. The overall complexity of the lung presents considerable challenges towards establishment of useful in vitro models and tools, requiring multiscale approaches to mimic critical attributes of the human airway (Ehrmann et al., 2020; Kolewe et al., 2020; Peterman et al., 2020). In the last decade, numerous advances to in vitro approaches mimicking the complex pulmonary microenvironment have enabled improved understanding of NP interactions at this barrier (Ehrmann et al., 2020). Traditional in vitro characterization involves aerosol aerodynamic diameter measurements using diffraction and impactor approaches (Fernandes and Vanbever, 2009; Nahar et al., 2013), with human deposition extrapolated through the use of experimental and computational models, as well as preclinical animal studies (Paur et al., 2011; Longest et al., 2019; Kolewe et al., 2022). Prior to animal testing, there are numerous biologically-based systems to model the lung. Cell cultures have been maintained at the air-liquid interface (ALI), including ciliated primary and immortalized cells capable of secreting mucins, as well as co-culture systems mimicking the full pulmonary barrier (Blank et al., 2007; Kreda et al., 2007; Brandenberger et al., 2010; Bachler et al., 2015; Marshall et al., 2015), dynamic barrier cell culture systems (Vlahakis et al., 1999; Huh et al., 2010), synthetic biomaterials (Dunphy et al., 2014; Bomb et al., 2022), and organ-on-a-chip models (Tenenbaum-Katan et al., 2018). Collectively, adoption of advanced in vitro models has critically revealed that behaviors established in traditional submersion culture do not accurately reflect many behaviors at the pulmonary interface (Dunphy et al., 2014; Bomb et al., 2022). Thus, the study of NPs for pulmonary drug delivery requires continued in vitro evaluation of behaviors at the ALI leveraging these model advances.
Our group and others have employed poly(ethylene)-glycol diacrylate (PEGDA)-based NP as model NPs to study interactions within the lung, with large focus on preclinical murine evaluations to assess complex biological outcomes (Roberts et al., 2013; Fromen et al., 2015; Fromen et al., 2016; Perry et al., 2020; Jarai et al., 2021b; Jarai and Fromen, 2022). PEGDA NPs are polymeric based hydrogels synthesized through free radical polymerization, providing tunable chemistry that has been useful to investigate aspects of charge and modulus for alternative routes of administration (Merkel et al., 2011; Anselmo et al., 2015; Fish et al., 2017). Unlike many commonly used model NP materials, such as PLGA (Allen et al., 2018) or polystyrene (Li et al., 2022), unfunctionalized, anionic PEGDA NPs have been found to be non-inflammatory (Jarai and Fromen, 2022) and immunologically inert (Roberts et al., 2013) following direct murine lung delivery. This base chemistry is slowly degrading (Stillman et al., 2020), enabling long-term studies of the fate of inhaled particles in the lung (Shen et al., 2015), with surface modifications (Shen et al., 2015) and co-monomers (Merkel et al., 2011; Anselmo et al., 2015; Fish et al., 2017; Stillman et al., 2020; Jarai et al., 2021b) able to readily alter the degradation kinetics. Using this model platform, NP surface charge has been implicated in altering the cellular fate of NPs administered to the airway (Fromen et al., 2015; Fromen et al., 2016), building on complementary work investigating the role of other physiochemical NP properties such as size (Blank et al., 2013) and swellability (El-Sherbiny et al., 2010).
Given this promising use for the PEGDA NP chemistry as a probe to evaluate long-term responses within the pulmonary airspace, we sought to address previously overlooked attributes of how these NPs behave when delivered as aerosols (Figure 1). In this work, we investigate the aerosolization of two formulations of PEGDA NPs within a commercial Aeroneb® Lab Nebulizer and assess their delivery at the ALI. We formulate PEGDA-based NPs with two different co-monomers to infer a positive or negative surface charge of NPs in solution. The aerodynamic, hydrodynamic, and geometric diameters are measured and utilized to gauge expectant lung penetration and cellular uptake. Given the prevalence of macrophages dominating the immune landscape of the ALI in the alveoli, we assess cell survival and NP uptake of macrophages cultured at the liquid-liquid interface (LLI, i.e., traditional cell culture technique) and the ALI through a new macrophage-ALI culture approach. Together, these studies present an important piece of the in vitro evaluation workflow to assess NP behavior in the lung microenvironment.

FIGURE 1. Traditional LLI vs. aerosol-loaded ALI comparison study of PEGDA-based NPs. Overview schematic of the traditional liquid-liquid interface (LLI) compared to the air-liquid interface (ALI) study of model nanoparticle (NP) uptake in macrophage-like cell line, RAW 264.7. The LLI was performed in standard well plates and dosed via pipette, while ALI studies were performed in transwell plates with NP dosage via Aeroneb® Lab Nebulizer. Poly(ethylene)-glycol diacrylate (PEGDA) particle physiochemical and cellular effects were compared between cationic, (+) NP, and anionic, (−) NP, formulations, indicated throughout as pink and purple, respectively.
Materials and methods
Materials
For all biological studies, dilutions and formulations were performed using sterile Dulbecco’s Modified Eagle Medium (DMEM) (Corning) supplemented with 10% fetal bovine serum (FBS, Gibco) and 1% penicillin-streptomycin or sterile molecular grade water (Cytiva). All other reagents were used as provided by the manufacturer and stored following manufacturer’s instructions. Reagents were obtained from Fisher Scientific unless otherwise noted within subsections below.
PEGDA nanoparticle synthesis
Poly(ethylene)-glycol diacrylate (PEGDA)-based hydrogel nanoparticles (NPs) were synthesized via a reverse emulsion photopolymerization technique at 50 wt% solids as described previously (Jarai and Fromen, 2022). Briefly, NP pre-polymer solution was composed of ∼89 wt% PEGDA700 (MW = 700), 10 wt% charge-establishing functional monomer, 1 wt% photoinitiator diphenyl(2,4,6-trimethylbenzoyl)phosphine oxide (PI, Sigma Aldrich), and .05 or .1 wt% fluorescent dye (Cy5 Maleimide, Fluoroprobe) in methanol. The cationic functional monomer was 2-aminoethyl methacrylate (AEM, Sigma Aldrich) and the anionic was 2-carboxyethyl acrylate (CEA, Sigma Aldrich), creating two PEGDA NP formulations which will be referred to as (+) NP and (−) NPs, respectively. Pre-polymer solution compositions for cationic and anionic particles are shown in Figure 2. A volume of 100 μl of the polar monomer mix was added to 1 ml of a continuous, non-polar phase of silicone oil AP1000 (Sigma Aldrich). The polar phase was vortex mixed with the non-polar phase for 1 min until homogenous then tip sonicated. The NPs were polymerized via UV light (APM LED UV Cube with a wavelength of 365 nm at a distance of ∼28 cm from the light source, ∼5–10 mW/cm2) for 30 s. Following polymerization, 800 μl of hexanes were added to the emulsion to break up the remaining oil in solution. The NPs were centrifuged at 18,200 RCF for 5 min and sequentially washed twice with ethanol.
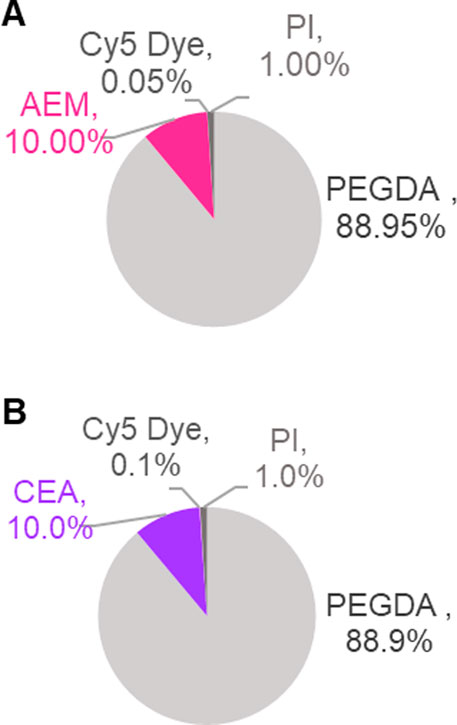
FIGURE 2. PEGDA-based NP synthesis chemistry. Fluorescent PEGDA NP were produced at 50 wt% solids using reverse emulsion photopolymerization technique via free radical polymerization. Graphs represent solids composition of monomeric pre-particle phase by weight percent (%). Two functional monomers, 2-aminoethyl methacrylate (AEM) and 2-carboxyethyl acrylate (CEA) were used to create cationic [(A), +] and anionic [(B), −] NP types, both incorporated at 10 wt% solids. Fluorescent Dye (Cy5 Dye) was incorporated at amounts appropriate for fluorescent assays specific to NP chemistry.
Thermogravimetric Analysis (TGA)
Stock concentration of NPs was measured via Thermogravimetric Analysis (TGA) using TA Instruments TGA 550. Two technical replicates of the NP stock at 50 μl were added to platinum pans on the TGA. The mass of the sample was determined by ethanol evaporation via a temperature ramp up to 90°C followed by 10 min isothermal incubation.
Dynamic light scattering (DLS)
Dynamic Light Scattering (DLS) was performed using Malvern Zetasizer Nano S instrument. NP samples were prepared by diluting stock solutions to ∼0.1 mg/ml in either ethanol or water. Hydrodynamic diameters (Dh), polydispersity indices (PDIs), and zeta potential at room temperature were averaged from at least two independent replicates, 3 technical replicates each.
Cryo-scanning electron microscopy (Cryo-SEM)
Pre and post nebulizer samples for both (+) NPs and (−) NPs were prepared at 1 mg/ml in water. Aliquots of 2 μl were flash frozen using the High-Pressure Freezer Leica EM ICE. The samples were then sputter-coated with platinum for 60 s and imaged under high vacuum using an Apreo VolumeScope Scanning Electron Microscope at 2 kV and a variety of magnifications, specified under figure captions. NP geometric diameter was quantified using the measuring tool on ImageJ and scale bars were autogenerated from SEM images (n ≥ 4).
Optical particle sizer (OPS)
An optical particle sizer spectrometer 3330 (OPS, TSI Inc.) was utilized to calculate the aerodynamic diameter of aerosol droplets carrying (+) or (−) NPs generated from the Aeroneb® Lab Nebulizer, standard VMD 4.0–6.0 μm (Kent Scientific). NPs were prepared at 50 μg/ml and then 100 μl samples were added to the nebulizer chamber. NP solutions were nebulized for 1 min into a holding chamber directly above the OPS device, which sampled continuously from the holding chamber at a flow rate of 1 LPM for 5 min until aerosols were no longer being detected to ensure the quantification of the entire nebulized sample. The mass median aerodynamic diameters (MMAD) and the geometric standard deviation (GSD) were calculated for each sample according to Eqs 1, 2.
Design of 3D-printed nebulizer adapter for transwell application
A deposition adapter was designed with Autodesk® Fusion 360 and 3D printed on a Carbon M1 3D printing platform (Carbon, Inc.) following manufacturer’s instructions. The adapter was printed using the proprietary material PR 25 White manufactured by Carbon following the dimensions displayed in our results. The top was designed to fit on the Aeroneb® Lab Nebulizer and the bottom has a smaller opening to fit the 24-well transwell plate. The design was inspired by prior work (Horstmann et al., 2021) with one major modification; there is an internal circular lip to lessen the abrupt pressure drop caused by the internal diameter change to the 24-well plate and to collect excess liquid droplets from condensation. The adapter allows a portion of aerosolized volume to deposit in the transwell plate, and the rest of the volume is collected in the internal lip to keep liquified large droplets from forming on the adapter and subsequently dripping into the plate.
Fluorescence characterization of NPs
Following initial TGA measurements of NP stocks, subsequent NP concentrations were determined using fluorescence measurements using a plate reader. Samples were read at Ex. 590 nm, Em. 640 nm using the Biotek Cytation 5 Multimode Imager. The gain for each assay was adjusted as indicated in figure captions. Median fluorescence intensity (MFI) was directly compared for each NP type by running 200 μl of 10 times diluted NP stock through Novocyte Flow Cytometer (n = 2) and comparing intensity on the APC channel (Ex. 640 nm/Em. 660 nm, Gain:800), shown in Supplementary Figure S1.
Buffers
PEGDA NP solutions were diluted to 1 mg/ml in 1 ml of 0.5 M sodium phosphate buffers adjusted to varied pHs. The prepared buffers were NaH2PO4 (pH 5), Na2HPO4 (pH 10), or a 50/50 mol mixture of the solutions (pH 7). These are referred to as pH 5, 10, and 7 respectively.
Characterization of nebulization effects on NPs
NP samples were spun down at 18,200 RCF then resuspended in 1 ml of water. Prepared samples were nebulized using the Aeroneb® Lab Nebulizer (VMD: 4.0–6.0 μm). Recovery through the nebulizer without the 3D adapter was measured by collecting aerosols and resulting droplets as the device was held over a 24-well plate. The recovery through the 3D adapter was measured by collecting aerosols onto a transwell (Falcon 24-Well Hanging Transwell, PET membrane, 0.4 μm pore) and then resuspending that deposited sample in 100 μl of water. The percentage of NPs recovered post-nebulization was determined via fluorescence reading on BioTek Cytation 5 MultiMode Imager using Eq. 3.
Liquid-liquid and air-liquid interface cell culture
The murine macrophage-like cell line, RAW 264.7 (ATCC), was cultured in complete DMEM media (Corning) with 10% FBS (certified Gibco heat inactivated, United States of America origin) and 1% peninicillin-streptomycin. All experiments were performed with cell lines not exceeding a passage number of 10. Air-Liquid Interface (ALI) studies were performed in Falcon 24-Well Hanging Transwells (PET membrane, 0.4 μm pore), while Liquid-Liquid Interface (LLI) studies were performed in 96-well plates. Cells were seeded with 100 μl volume at a density of 8 × 10⁴ cells/well in the growth area with an additional 300 μl of media added to the basal chamber for ALI cultures. ALI was established via removal of apical chamber media 4 hours-post seeding and incubation at 37°C, 5% CO2. All cell plates were incubated overnight at 37°C, 5% CO2 before NP treatment.
Cellular uptake studies
ALI and LLI cultures were treated with the following sample groups (n = 3 biological replicates): untreated (UT), 25 or 50 μg/ml (+) NPs, 25 or 50 μg/ml (−) NPs. For ALI samples, NPs were re-suspended in sterile water at appropriate concentration based on NP recovery calculated using Eq. 3. NPs were dosed at the indicated concentrations of NP treatment via inserting the Aeroneb® Lab Nebulizer into the 3D printed device and holding directly over individual transwells throughout dosing. Volumes of 100 μl were delivered for roughly 30 s, and then the set-up was discharged with 100 μl of sterile water for 30 s in between every sample. The device was wiped down in between deliveries to remove any leftover condensation. For LLI samples, NPs were re-suspended in complete DMEM media at concentrations equivalent to the mass of each NP formulation deposited post-nebulization and then dosed via pipette.
Samples were left to incubate for either 6- or 24-h time points at 37°C, 5% CO2. After, 24 h, adherent LLI and ALI imaging samples were prepared by fixation in a 4% PFA solution at room temperature for 20 min in the dark. Following fixation, cells were washed once in PBS and then sequentially stained with Fluorescent Dye 488-I Phalloidin (Fisher Scientific) for 30 min in the dark and 4′, 6-diamidino-2′-phenylindole, dihydrochloride (DAPI) (Fisher Scientific) for 5 min in the dark with two PBS washes after removal each stain. Samples were then resuspended in a FACS solution (2% FBS in PBS) and stored at 4°C. Images of samples were collected using the Biotek Cytation 5 MultiMode Imager at 40x.
NP internalization and viability after 6 and 24 h was quantified via flow cytometry using NovoCyte Flow Cytometer. At the appropriate time point, cells were washed twice with PBS, detached using 0.25% Trypsin-EDTA (Corning), spun down for 5 min at 500 RCF, and then washed twice with PBS. Cells were stained with Zombie Yellow™ Live/Dead Stain (BioLegend) for 20 min at room temperature in the dark and then washed once with PBS. Uptake and viability was measured on the APC channel (Ex. 640 nm/Em. 660 nm, Gain:800) and Pacific Orange Channel (Ex. 405 nm/Em. 572 nm), respectively.
Metabolic activity after 24 h was determined via a CellTiter-Glo 2.0 Cell Viability Assay (Promega) following manufacturer’s instructions. Luminescence was measured on Biotek Cytation 5 Multimode Imager and relative luminescence was calculated by dividing sample luminescence by a 50/50 media and CellTiter-Glo control well.
Statistical analysis
GraphPad Prism 9 (GraphPad Software Inc.) was used to perform statistical analyses. Numerical data are represented as mean ± standard deviation (SD) or geometric standard deviation (GSD) as reported in the figure captions. Appropriate post hoc statistical tests were performed as reported in figure captions. Tukey’s multiple comparisons test as part of one-way or two-way ANOVAs was used unless stated otherwise. Results shown are representative of at least two independent experiments, with NP or biological replicates reported in the figure captions.
Results
PEGDA-based NPs exhibit similar physiochemical properties before and after nebulization
Our overall goal was to compare macrophage uptake between traditional liquid delivery at the liquid-liquid interface (LLI) and aerosol delivery at the air-liquid interface (ALI) for both positively and negatively charged PEGDA-based NPs (Figure 1). Two PEGDA hydrogel NP formulations were successfully synthesized with cationic AEM or anionic CEA functional monomers following the compositions shown in Figures 2A, B, referred to as (+) NP and (−) NPs, respectively. During the formulation phase, (+) NPs were sufficiently fluorescent at 0.05 wt% Cy5 Maleimide incorporation, while (−) NPs required an increased addition of Cy5 that was incorporated 0.1 wt%. However, it was still found that the (+) NP showed statistically higher fluorescence intensity compared to the (−) NP stock (Supplementary Figure S1).
Following synthesis, the two PEGDA NP formulations were characterized using DLS and cryo-SEM (Table 1; Figure 3, respectively). Cryo-SEM images of both formulations revealed an abundance of spherical NPs ranging in geometric diameters from ∼200–250 nm (Figures 3A, B), which was confirmed via DLS. DLS measurements in both water and ethanol determined differential stability for the two formulations; (−) NPs showed aggregation in ethanol that was mitigated in water, while (+) NPs exhibited the reverse phenomenon (Supplementary Table S1). Given this preference, DLS measurements were reported in the preferred solvent for each formulation, with (−) NPs measured in water, while (+) NPs were measured in ethanol (Table 1). DLS measurements for the as-synthesized, pre-nebulized (+) NP and (−) NP formulations resulted in hydrodynamic diameters (Dh) between 200 and 250 nm in their preferred solvent with PDI below 0.15, indicating reasonable homogeneity and minimal aggregation of the synthesized NPs. As expected, zeta potential for the (+) NP was found to be +29 ± 1 mV, while the (−) NP was found to be −32 ± 4 mV.
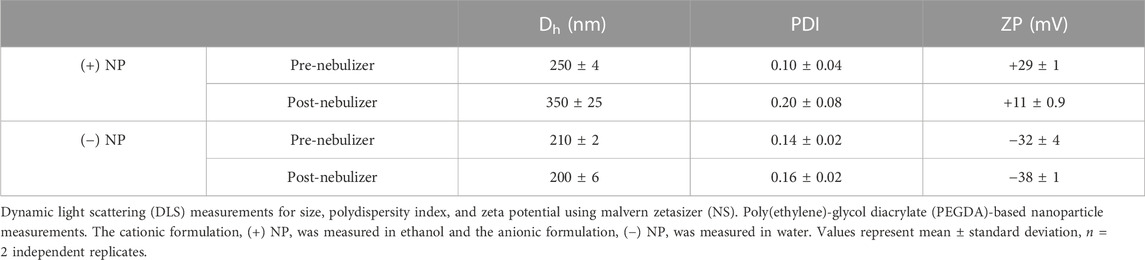
TABLE 1. PEGDA-based particle hydrodynamic and charge characterization.
FIGURE 3. Cryo-SEM Characterization of PEGDA NPs before and after nebulization. Representative cryo-SEM images of PEGDA-based NPs taken on Apreo VolumeScope Scanning Electron Microscope. (A) Pre-nebulized (+) NP (110 nm, 50,000X). (B) Pre-nebulized (−) NP (240 nm, 80,000X). (C) Post-nebulized (+) NP (290 nm, 65 K X). (D) Post-nebulized (−) NP (190 nm, 65,000X). Scale bar represents 100 nm.
Nebulized samples were produced using the Aeroneb® Lab Nebulizer (VMD 4–6 µm) and collected in 24-well plates. All samples were nebulized in water and the post-nebulizer sample was resuspended in the preferred solvent (i.e., ethanol for (+) NP and water for (−) NP) for consistent DLS characterization. Shown in Table 1, (−) NPs demonstrated minimal change in size and zeta potential following nebulization from the pre-nebulized samples. In contrast, (+) NPs demonstrated aggregation, resulting in an increased Dh to 350 ± 25 nm and a 2x increase in PDI, along with a decrease in zeta potential after passing through nebulizer mesh. Given the overall decreased stability for (+) NPs in water, nebulizing in an aqueous solution is likely responsible for these changes. Indeed, cryo-SEM images confirm this trend between pre- and post-nebulization (Figure 3). All NPs retained their spherical shape post nebulization, as seen by visual inspection. Additionally, an ImageJ sizing analysis demonstrated non-significant changes post nebulization, where (−) NPs average size pre- and post-nebulizing were 250 ± 90 and 170 ± 40 nm, respectively, and (+) NPs were 150 ± 80 and 230 ± 40 nm, respectively. However, a few cases of particle aggregation were found in the (+) NPs, which were not present in (−) NP samples (Supplementary Figure S2). Importantly from both DLS and cryo-SEM results, both NP formulations were largely unaltered by the nebulization process, demonstrating minimal change to critical physiochemical features of the as-synthesized formulation.
Designed 3D-printed adapter enables uniform aerosol delivery of both PEGDA-based NPs
Previous studies (Horstmann et al., 2021) provided the framework to create custom 3D-printed adapters for the Aeroneb® Lab Nebulizer for consistent and efficient aerosol delivery of cargo to transwell plates. As shown in Figure 4, we developed a new custom design with a well bottom to collect condensation and enhance aerosol delivery specifically to 24-well transwells. As shown in Figures 4A, B, the design of the adapter consisted of a top inlet portion designed to fit snugly on the Aeroneb® Lab Nebulizer, with an outlet of decreased diameter to fit on top of the 24-well transwell plate. The addition of an internal circular lip served to lessen the abrupt pressure drop caused by the internal diameter change to the 24-well plate and was able to collect excess liquid droplets. The adapter allowed a portion of aerosolized volume to deposit in the transwell plate and the rest of the volume was collected in the internal lip to keep large, coalescing droplets from forming on the adapter and subsequently dripping into the plate. The as-printed part is shown in Figure 4C and was able to able to successfully interface with both the Aeroneb® Lab Nebulizer and 24-well plate opening.

FIGURE 4. Design and dimensions of the 3D printed adapter for Aeroneb® Lab Nebulizer. Technical drawing (Autodesk® Fusion 360) of the designed adapter for Aeroneb® Lab Nebulizer with units in mm of the (A) side view and (B) top view. (C) Adapter was 3D printed using a Carbon M1 printer in PR 25 resin. Scale bar represents 1 cm.
It is known that cargo recovery through mesh nebulizers is relatively poor, with prior work reporting efficiencies of only ∼10% aerosolized from the Aeroneb® Lab Nebulizer (Horstmann et al., 2021). Losses can stem from both inefficiencies in the nebulizer and deposition within the nebulizer itself, which can be exacerbated with the introduction of any additional surface area, such as an adapter. Thus, it was important to confirm post-nebulizer NP efficiency of the NP used here with the Aeroneb® Lab Nebulizer and the adapter interface. Percent NP recovery was determined by finding the ratio of the fluorescence between the nebulizer deposited NPs into a 24-well plate or transwell and the total loaded NP amount to the nebulizer (Eq. 1). It was found that with or without the adapter, the (+) NP recovery through the nebulizer was around 12%. Interestingly, (−) NP recovery decreased considerably from 30% without the adapter to 7% using the 3D-printed adapter device. Thus, the use of the adapter did not significantly reduce the aerosol output of either formulation and the introduction of the lipped-adapter ensured a comparable ∼10% efficiency through the adapter for both (−) and (+) NPs.
Both (+) and (−) NPs were loaded in water at 50 μg/ml in 100 μl inlet volume and aerosolized through the Aeroneb® Lab Nebulizer. The resulting aerosol size with the loaded NPs was confirmed using an Optical Particle Sizer (OPS) to determine MMAD and GSD (Eqs 2, 3). It was found that without the 3D-printed adapter, MMAD values did not significantly deviate across any samples, including the NP-free control (water), or the (+) and (−) NP groups and that they were within the expected range given the selected mesh size of the Aeroneb® Lab Nebulizer (Figure 5A). Aerosols delivered through the 3D-printed device exhibited a slight increase in size that was not statistically different from those without the adapter, falling within the expected 4–6 µm range based on the mesh properties. The slight increase in aerosol size with the adapter may stem from increased coalescence within the adapter; however, most importantly, the addition of 50 μg/ml of either NP formulation did not contribute to altering the NP stability within the aerosol droplet. Additionally, aerosol counts without the adapter were not statistically significantly different from those with the adapter (Figure 5B), indicating that there was no notable decrease in aerosol formation observed with the introduction of the lipped-adapter.
FIGURE 5. Aerosol measurements of nebulized NPs with and without the 3D printed adapter. OPS aerodynamic diameter and particle count quantification for the formulations of particles with water (black), (+) NPs (pink), and (−) NPs (purple) measured with free nebulizer and with the 3D-printed adapter. (A) Aerodynamic diameter is represented as the MMAD ± GSD. There was no statistical significance considering either nebulization formula (p = .81, two-way ANOVA, n = 3) or adapter use (p = .24, two-way ANOVA, n = 3). (B) OPS particle counts between 3.46 and 7.00 µm indicated nebulization formula was a significant factor (p = .003, two-way ANOVA, n = 3) while adapter use was not significant (p = .21, two-way ANOVA, n = 3).
PEGDA-based NPs exhibit minimal uptake by in vitro macrophages at the ALI
Building on the desire to better evaluate PEGDA NP formulations following aerosolization, we sought to evaluate NP uptake following deposition at the ALI. Here, monocultures of macrophage RAW 264.7 cells were cultured on both traditional liquid-liquid interface (LLI) and compared to ALI cultures to determine differences between surface charge dependent NP internalization. Macrophages are a critical cell type present in the lung microenvironment whose role is to engulf foreign bodies and activate innate immunity, making them likely targets for NP internalization (Hussell and Bell, 2014).
Here, LLI cultures were grown using traditional methods on cell culture plastic in 96-well plates. Contrastingly, ALI cultures were seeded in transwells of similar surface area to LLI but had media from the top compartment removed 4 h post seeding to establish the appropriate interface. All samples were incubated overnight at 37°C, 5% CO2 prior to NP dose at either ALI or LLI. LLI cultures were dosed directly with liquid NP treatment via pipette at low and high NP concentrations, 25 μg/ml and 50 μg/ml, respectively. ALI wells were individually treated with NP aerosols using the Aeroneb® Lab Nebulizer fitted to the 3D printed adapter above the well plate. NP concentration for ALI was increased according to the percent NP recovered calculated previously, such that equivalent NP masses to the LLI conditions would be delivered. To visualize NP uptake and morphology of cells, fixed samples dosed via traditional methods at LLI and with the nebulization method at ALI were stained to demonstrate actin and nuclei using phalloidin and DAPI, respectively. Morphology between non-NP internalizing cells and NP internalizing cells appeared similar, inferring that there were no obvious cytotoxicity concerns as due to NP uptake (Figure 6). At 24-h post-delivery, it appeared that (+) NPs demonstrated dose-dependent uptake that was higher than that of the (−) NP post-delivery in the LLI condition (Figures 6A–D). In contrast, after the same period the ALI culture demonstrated minimal to no uptake of either particle formulation for both the high and low dose (Figure 6E–H).
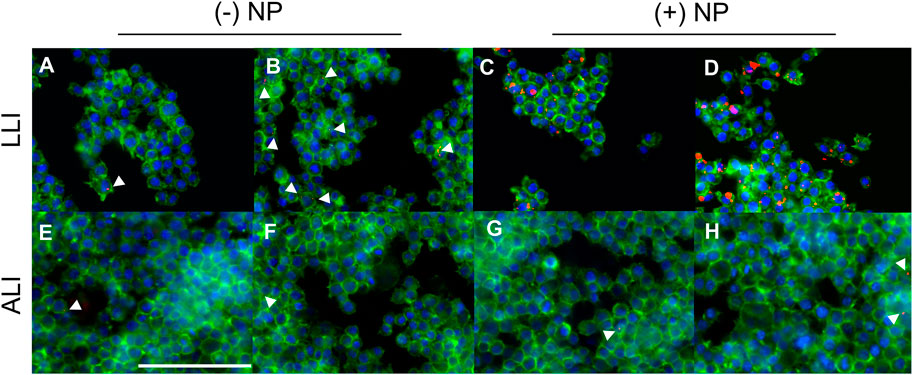
FIGURE 6. Macrophages dosed with NPs at the LLI and ALI. PFA-fixed cells stained with Phalloidin (green) and DAPI (blue) dosed with NPs (red), imaged at 40x using BioTek Cytation 5 MultiMode Imager. RAW 264.7 cells were cultured using traditional LLI 96-well plate method [top row, (A–D)] or at the ALI in transwell 24-well plate method [bottom row, (E–H)] with (−) NPs left, (A,B,E,F) or (+) NPs right, (C,D,G,H). NPs were dosed at either 25 μg/ml (A,C,E,G) or 50 μg/ml (B,D,F,H) via pipette (A–D) or Aeroneb® Lab Nebulizer with adapter (E–H). Scale bar represents 100 μm.
To quantify particle uptake overtime, a flow cytometry analysis was used to measure NP internalization. Uptake of NPs was measured at 6- and 24-h post-dosage via fluorescence shifts from flow cytometry using two parameters. Median fluorescence intensity (MFI) was used to indicate overall population shifts towards NP uptake, while the percent of samples with a fluorescence intensity greater than 1% of the appropriate untreated samples, known as %NP+, was used to quantify NP uptake. Representative gating is shown in Supplementary Figure S4.
MFI values were compared between treated groups at different dosing conditions (Figure 7A) and fold changes were determined as the ratio of the treated group divided by that of the untreated group at the same delivery interface. After 6 h, (−) NPs showed a ∼1.5-fold increase in MFI for LLI cultures only at 50 μg/ml and a ∼1.6 and ∼1.8-fold increase in MFI for 25 and 50 μg/ml dosed ALI samples, respectively (Figure 7B). The MFI of (+) NPs dosed LLI samples was significant and dose dependent at 6-h post-delivery, where low and high NP concentrations increased by ∼3.3 and ∼7.2-fold, respectively (Figure 7B). After 24 h, all LLI dosed cultures showed significant fold-changes that had increased from 6-h samples (Figure 7D). At this time point, (−) NP-dosed LLI cultures MFI increased for low and high NP concentrations by ∼2.2- and ∼3.1-fold, respectively, while (+) NP-dosed LLI cultures increased by ∼5.2- and ∼16-fold, respectively (Figure 7D). However, all ALI cultures after 24 h showed decreased MFI compared to untreated samples (Figure 7D).
FIGURE 7. ALI vs. LLI Uptake of PEGDA-based NPs. RAW 264.7 cells dosed with either (+) NPs (pink) or (−) NPs (purple) for 6 h (B,C) or 24 h (D,E) at the LLI (open) or ALI (striped). (A) Representative NP uptake overlayed histograms at 24-h post dose at LLI. (B/D) MFI comparison. (C/E) %NP+ gating comparison. All bar charts represent mean
The percent of NP uptake (%NP+) generally followed MFI trends at 6 and 24 h for both (+) NP and (−) NP samples (Figures 7C, E). At 6-h post-delivery, LLI populations demonstrated 33% and 53% NP-internalized populations for low and high %NP+ population, respectively (Figure 7C), and at 24 h, the NP-positive populations increased to 48% and 76%, respectively (Figure 7E). Interestingly, while MFI data did not show significant increase for ALI delivery at 6- or 24-h post-delivery, the high concentration dose for (+) NP did show significant increase in the percent %NP+ population at both time points (Figure 7C, E). ALI uptake for the high dose of (+) NP yielded 10% and 7% %NP+ populations at 6 and 24 h, respectively. However, while this positive population was significant at both 6- and 24-h post-delivery, the percentage of NP-internalizing did not increase after 24 h (Figures 7C, E). In fact, unlike at the LLI, every treatment group demonstrated lower %NP + at 24 h post-delivery compared to 6 h post-delivery (Figures 7C, E).
To determine if the designed NPs demonstrated any pH sensitivity that may impact their fluorescence signal when internalized by cells, NPs were resuspended in three different 0.5 M sodium phosphate buffer conditions (Supplementary Figure S3) at a concentration of 1.0 mg/ml. It was observed that both NP formulations had the highest fluorescent signal in the basic conditions. However, minimal changes to fluorescence intensity were observed for either NP between pH 7.0 and pH 5.0. Thus, fluorescent intensity of the NPs is expected to be constant between extracellular and internalized environments, ensuring consistent detection efficiency for in vitro uptake studies that could not be attributed to the low ALI results.
Previous studies (Goodman et al., 2004; Fröhlich, 2012) have reported surface charge dependent cytotoxicity effects after NP treatment. Here, post-delivery cellular viability was determined via two methods using a live/dead stain for flow cytometry and luminescence-based metabolic assay of plated cells. It was found that at 6- and 24- hours post-delivery for LLI and ALI conditions, both NP types showed a majority of live cells via flow cytometry that did not statistically deviate from untreated samples (Figure 8A). The same trend was observed at 24 h (Figure 8B), indicating that cells were still alive at both LLI and ALI. Morphometric assessments of cells in Figure 6 further supports the presence of viable, live cells in both LLI and ALI. In contrast, metabolic activity measurements of the LLI and ALI cultures via CellTiter Glow assay indicated differences in metabolic activity between the cultures; as shown in Figure 8C, higher metabolic activity was observed for all of the LLI conditions when compared to the ALI conditions. While no trends were observed between NP dosed samples, this difference in metabolic activity likely contributed to the decreased NP uptake compared to ALI.
FIGURE 8. Cytotoxicity Study of PEGDA-based NPs at LLI vs. ALI. RAW 264.7 cells dosed with (+) NPs (pink) or (−) NPs (purple) at the LLI (open) or ALI (striped) for 6 or 24 h. (A) Live/Dead Zombie-Yellow (BioLegend) Viability analysis from Novocyte Flow Cytometry assay at 6 h and (B) 24 h. (C) Cell-titer glo 2.0 assay after 24 h at the LLI (clear) and ALI (striped). Bar charts represent mean
Discussion
Evaluating PEGDA NPs as nebulized aerosols is a critical step in understanding how this platform chemistry can be used to study interactions in the pulmonary microenvironment. In this work, we investigated the aerosolization of two formulations of PEGDA NPs within a commercial Aeroneb® Lab Nebulizer and assessed their delivery at the ALI. We successfully fabricated both cationic and anionic PEGDA formulations with similar hydrodynamic diameters around ∼225 nm and low PDIs, with expected surface charges corresponding with the respective functional monomer (Figure 2; Table 1). We find that both NPs are readily nebulized from an aqueous suspension in a commercial device, with minimal impact on their overall aerosol MMAD (Figure 3 and Figure 5). To assess aerosol delivery in vitro, we designed a 3D printed adapter capable of ensuring aerosol (and not droplet) delivery to 24-well culture plates (Figure 4). Using this adapter, we evaluated NP uptake of macrophages cultured at the LLI and ALI, finding higher cell uptake of (+) NP than (−) NP at LLI but overall minimal uptake of either formulation by macrophages at the ALI (Figures 6, 7). Interestingly, ALI culture resulted in lower metabolic activity than cells cultured at LLI, which may account for these observed differences (Figure 8). Collectively, these results represent the first evaluation of nebulized PEGDA NPs at the ALI and identify areas for further investigation.
One of the biggest questions heading into this investigation was the effect of nebulization on PEGDA NP properties. The Aeroneb® Lab Nebulizer is a vibrating mesh nebulizer, extruding aerosol droplets through a deforming mesh from a liquid reservoir (Vecellio, 2006; Pritchard et al., 2018). While the technology is used to nebulize small molecules and protein therapeutics in the clinic, we sought to evaluate if NP formulations would be similarly stable through the nebulization process. NP characteristics were quantified pre- and post-nebulization to ensure the nebulization process was minimally influenced by the NP formulation and, likewise, the NPs were minimally influenced by nebulization. NP-loaded aerosols from the nebulizer were collected and NPs analyzed for changes to Dh and ZP (Table 1) and both geometric diameter and morphology (Figure 3). Anionic (−) NPs were unimpacted by nebulization, with no significant changes to terms of Dh and ZP after the process; however, the (+) NPs demonstrated a ∼100 nm increase in Dh, a 2x increase in PDI, and a ∼15 mV decrease in zeta potential after passing through nebulizer mesh, although it still retained a net positive charge. Given the overall decreased stability for (+) NPs in water, nebulizing in an aqueous solution is likely responsible for these changes, rather than the nebulization process itself. Considering DLS measurements of (+) NP in water prior to nebulization (Supplementary Table S1), in addition to evidence of aggregation on cryo-SEM imaging (Supplementary Figure S2), it is likely that aerosol aggregation was occurring during nebulization. This aggregation is hypothesized to be due to particle-particle attractive interactions in water during nebulization, as the (+) NP exhibit preferential solubility in ethanol. However, this aggregation did not significantly influence the overall aerosol size, as indicated by MMAD measurements via the OPS (Figure 5A). Additionally, the geometric diameters for both (+) and (−) NPs were not statistically significantly different, as was shown in cryo-SEM images (Figure 3). The combined physical characteristic NP and aerosol evaluations suggest that the Aeroneb® Lab Nebulizer is capable of successfully nebulizing both NP formulations, although future considerations of stabilizing (+) NP, such as with PEG or zwitterionic stabilizing coatings (Shen et al., 2015; Schneider et al., 2017; King and Fiegel, 2022), should be pursued to increase stability for aqueous nebulization.
While NP charge did not significantly influence nebulization, it has been shown to significantly influence NP transport across the mucus barrier (Bandi et al., 2020). Mucus is a complex viscoelastic fluid comprised of 95% water and predominantly mucins a highly glycosylated protein secreted by goblet cells of the airways and slightly negatively charged (Ohar et al., 2019; Bandi et al., 2020). It is hypothesized that ionic interactions of positively charged NPs reduce transport across the mucus layer. The post-nebulizer (+) NP zeta-potential was +11 ± 0.9 mV, which is expected to exhibit reduced mucus transport, further motivating the need for additional surface modifications for effective transport. However, cationic NPs have been shown to have increased phagocytosis and lung accumulation compared to anionic NPs, with improved localization to draining lymph nodes and altered antigen presenting cell distributions (He et al., 2010; Fröhlich, 2012; Fromen et al., 2016). Thus, the combined transport characteristics opposingly improve and impair delivery, motivating the continued evaluation of both PEGDA NP formulations here.
In attempt to deliver nebulized NP-containing aerosols to 24-well culture plates, we originally implemented an existing 3D printed device for our cell culture studies (Horstmann et al., 2021). We noted the presence of significant condensation when using the as-designed device to delivery to 24-well culture plates, possibly due to differences in 3D printing materials and process finishing, that led us to question the integrity of the delivered aerosols. This led us to re-design the 3D printed adapter to contain an internal lip capable of collecting condensation and preventing droplet transfer to the well (Figure 4). Using this new device, we sought to quantify aerosol outputs and compare to measurements without the adapter. Both NP hydrodynamic and aerosol aerodynamic diameters were measured with DLS and OPS, respectively (Table 1; Figure 5A). It was found that the total aerosol output from the nebulizer did not significantly change with NP-loaded solutions using the adapter, thus the quality of released aerosols was not impacted, ensuring true aerosol delivery to the ALI cell culture environment (Figure 5B).
Once we had optimized the aerosol deposition from the nebulizer to the 24-well ALI cultures, we were able to dose equivalent amounts of (+) and (−) NPs at both the LLI and ALI to evaluate macrophage uptake over time. Overall, (+) NPs had higher cell uptake compared to (−) NPs under both ALI and LLI conditions (Figures 6, 7). This is expected of cationic NP based on literature and hypothesized to be due to electrostatic attraction with the negatively charged cell membrane (Fröhlich, 2012). Additionally, there was less uptake with lower concentration 25 μg/ml doses, suggesting dose-dependent uptake, again following with our initial expectations.
While these trends were globally consistent at both the ALI and LLI, we were surprised to observe significantly more NP uptake observed at the LLI when compared to ALI looking at both MFI and %NP+ outputs (Figure 7). Similarly, experiments performed under LLI conditions demonstrated significant increase in NP uptake between 6 and 24 h, while there was only significant uptake at ALI for the 50 μg/ml dose of (+) NPs for either of these time points. We hypothesize that this overall poor uptake at ALI has to do with the decreased metabolic activity observed by ALI cells (Figure 8C), which may indicate differential mobility and proliferative capacity throughout the timespan of the experiment. The opposite internalization trend has generally been reported in the literature, such that cells uptake more NPs under ALI conditions compared to LLI (Schürch et al., 2014); however, it is important to note that the majority of ALI cultures focus on epithelial cell barriers (Brandenberger et al., 2010; Leibrock et al., 2019; Mills-Goodlet et al., 2020), rather than the macrophage culture initiated here. While co-cultures including innate immune phagocytes have been developed for ALI culture (Brandenberger et al., 2010), quantification of macrophage-specific uptake at ALI is rarely performed, making it challenging to benchmark our results. We also hypothesize the differences in the culture substrate is influencing this inconsistency with epithelial cell ALI literature. Since LLI experiments were performed on standard tissue culture treated plastic well plates and ALI experiments were performed on cell culture inserts, the insert is suspected to have played a role in varying NP uptake; macrophage mobility is reduced on cell culture inserts and NPs will be capable of diffusing across the membrane, both of which would contribute to fewer NP accessible to macrophages for uptake at the ALI. Additionally, the use of serum in the media used to dose the LLI samples is known to create a protein corona effect on NPs in solution which could allow for enhanced cellular recognition (Li et al., 2021). This also supports the observation of lowered NP uptake in the ALI condition, where molecular-grade water free of protein additives was used. Thus, the influence of environmental factors on cell uptake are not entirely consistent between ALI and LLI conditions.
The overall low uptake by macrophages at the ALI points to some limitations of the presented work and opportunities for further investigation. For example, this ALI system does not have mucus and thus does not truly mimic the interface experienced by macrophages in the lung. The lung is lined with a dynamic liquid lining fluid that will likely serve to increase NP diffusion and support cell mobility (Hussell and Bell, 2014). Here, modifications to our ALI-macrophage culture approach, including alveolar-derived cells, and the introduction of deformable fluid interfaces (Ehrmann et al., 2020) may be more representative of the in vivo environment, where alveolar macrophages are capable of significant phagocytosis and known to be the dominant cellular clearance mechanism (Hussell and Bell, 2014). Additionally, macrophages in the lungs do not exist at such high proximity to each other in our culture conditions and are not representative of the dominant cell type of the lung region of interest (i.e., alveolar epithelial cells) but instead represent the potential uptake of phagocytosing cells. Finally, cells were only evaluated for survival and uptake but macrophage characteristics were not evaluated; NP interactions could still influence cell fate beyond simply uptake (Jarai and Fromen, 2022), especially if longer time points are considered. Future evaluations leveraging the ALI-macrophage culture approach may continue to elucidate distinct phenotypical behavior.
Overall, we have demonstrated an in vitro workflow to expand our characterization of PEGDA NPs for aerosol delivery, leveraging a commercial nebulizer. While NP loading had minimal impact on the nebulization and aerosol generation, NP formulation played an important role in cell uptake at both LLI and ALI. Through this research, we can evaluate the overall functional capacity and lung delivery potential of NP formulations, with capacity to delineate advantageous attributes of future therapeutics intended to increase function at the ALI. While our macrophage-only ALI culture resulted in lower-than-expected NP-uptake, these studies point to important challenges in designing therapeutics for pulmonary drug delivery and suggest further investigations of NP physiochemical features in subsequent ALI cultures. Collectively, this work represents an important step toward improved and informed designs for studying NP interactions in the pulmonary space.
Equation 1: NP Recovery Through Nebulizer
Equation 2: Mass Median Aerodynamic Diameter (MMAD)
d-50 is the particle diameter cutoff below the 50th percentile on a cumulative percent mass distribution.
d+50 is the particle diameter cutoff above the 50th percentile on a cumulative percent mass distribution.
M-50 is the cumulative percent mass at the cutoff below the 50th percentile on a cumulative percent mass distribution.
M+50 is the cumulative percent mass at the cutoff above the 50th percentile on a cumulative percent mass distribution.
Equation 3: Geometric Standard Deviation (GSD)
d84 = the particle diameter at the 84th percentile on a cumulative percent mass distribution.
d16 = the particle diameter at the 16th percentile on a cumulative percent mass distribution.
Data availability statement
The raw data supporting the conclusion of this article will be made available by the authors, without undue reservation.
Author contributions
ES, EK, JG, and CF conceived and designed the proposed studies. ES and JG synthesized the NPs. ES performed the in vitro aerosol experiments. EK performed OPS studies. YY and JS designed the aerosol in vitro adapter and consulted on aerosol experiments. ES and EK analyzed the data. ES prepared the formal analysis and visualizations. CF managed the project and acquired funding and resources. ES, EK, JG, and CF prepared the original draft; all authors edited versions of the manuscript and approved the final manuscript.
Funding
Research reported in this work was supported by the National Institutes of Health—National Institute of General Medical Sciences under Award Numbers R35GM142866. ES was funded by NIGMS Award Number T32-GM133395. The content is solely the responsibility of the authors and does not necessarily represent the official views of the National Institutes of Health. Microscopy access was supported by grants from the NIH-NIGMS (P20 GM103446), the NIGMS (P20 GM139760) and the State of Delaware.
Acknowledgments
The authors acknowledge Debra Powell for Cryo-SEM preparation and imaging, as well as Michael Trautmann-Rodriguez and Ian Woodward for helpful discussions.
Conflict of interest
The authors declare that the research was conducted in the absence of any commercial or financial relationships that could be construed as a potential conflict of interest.
Publisher’s note
All claims expressed in this article are solely those of the authors and do not necessarily represent those of their affiliated organizations, or those of the publisher, the editors and the reviewers. Any product that may be evaluated in this article, or claim that may be made by its manufacturer, is not guaranteed or endorsed by the publisher.
Supplementary material
The Supplementary Material for this article can be found online at: https://www.frontiersin.org/articles/10.3389/fceng.2022.1086031/full#supplementary-material
References
Abdellatif, A. A. H., Tawfeek, H. M., Abdelfattah, A., El-Saber Batiha, G., and Hetta, H. F. (2021). Recent updates in COVID-19 with emphasis on inhalation therapeutics: Nanostructured and targeting systems. J. Drug Deliv. Sci. Technol. Jun 63, 102435. doi:10.1016/j.jddst.2021.102435
Allen, R. P., Bolandparvaz, A., Ma, J. A., Manickam, V. A., and Lewis, J. S. (2018). Latent, immunosuppressive nature of poly(lactic-co-glycolic acid) microparticles. ACS Biomater. Sci. Eng. Mar. 12 4 (3), 900–918. doi:10.1021/acsbiomaterials.7b00831
Anselmo, A. C., Zhang, M., Kumar, S., Vogus, D. R., Menegatti, S., Helgeson, M. E., et al. (2015). Elasticity of nanoparticles influences their blood circulation, phagocytosis, endocytosis, and targeting. ACS Nano. Mar. 24 9 (3), 3169–3177. doi:10.1021/acsnano.5b00147
Bachler, G., Losert, S., Umehara, Y., von Goetz, N., Rodriguez-Lorenzo, L., Petri-Fink, A., et al. (2015). Translocation of gold nanoparticles across the lung epithelial tissue barrier: Combining in vitro and in silico methods to substitute in vivo experiments. Part Fibre Toxicol. 12, 18. doi:10.1186/s12989-015-0090-8
Bandi, S. P., Kumbhar, Y. S., and Venuganti, V. V. K. (2020). Effect of particle size and surface charge of nanoparticles in penetration through intestinal mucus barrier. J. Nanoparticle Res. 22 (3), 62. doi:10.1007/s11051-020-04785-y
Blank, F., Rothen-Rutishauser, B., and Gehr, P. (2007). Dendritic cells and macrophages form a transepithelial network against foreign particulate antigens. Am. J. Respir. Cell Mol. Biol. 36 (6), 669–677. doi:10.1165/rcmb.2006-0234oc
Blank, F., Stumbles, P. A., Seydoux, E., Holt, P. G., Fink, A., Rothen-Rutishauser, B., et al. (2013). Size-dependent uptake of particles by pulmonary antigen-presenting cell populations and trafficking to regional lymph nodes. Am. J. Respir. Cell Mol. Biol. 49 (1), 67–77. doi:10.1165/rcmb.2012-0387oc
Bomb, K., Pradhan, L., Zhang, Q., Jarai, B. M., Bhattacharjee, A., Burris, D. L., et al. (2022). Destructive fibrotic teamwork: How both microenvironment stiffness and profibrotic interleukin 13 impair alveolar macrophage phenotype and function. Biomaterials Sci. 10 (19), 5689–5706. doi:10.1039/d2bm00828a
Brandenberger, C., Rothen-Rutishauser, B., Mühlfeld, C., Schmid, O., Ferron, G., Maier, K., et al. (2010). Effects and uptake of gold nanoparticles deposited at the air–liquid interface of a human epithelial airway model. Toxicol. Appl. Pharmacol. 242 (1), 56–65. doi:10.1016/j.taap.2009.09.014
Bressot, C., Aubry, A., Pagnoux, C., Aguerre-Chariol, O., and Morgeneyer, M. (2018). Assessment of functional nanomaterials in medical applications: Can time mend public and occupational health risks related to the products' fate? J. Toxicol. Environ. Health A 81 (19), 957–973. doi:10.1080/15287394.2018.1477271
Bressot, C., Shandilya, N., Nogueira, E. SdC., Cavaco-Paulo, A., Morgeneyer, M., Le Bihan, O., et al. (2015). Exposure assessment based recommendations to improve nanosafety at nanoliposome production sites. J. Nanomater. 2015, 1–10. doi:10.1155/2015/931405
Du, J., Bandara, H. M. H. N., Du, P., Huang, H., Hoang, K., Nguyen, D., et al. (2015). Improved biofilm antimicrobial activity of polyethylene glycol conjugated tobramycin compared to tobramycin in Pseudomonas aeruginosa biofilms. Mol. Pharm. 12 (5), 1544–1553. doi:10.1021/mp500846u
Dunphy, S. E., Bratt, J. A. J., Akram, K. M., Forsyth, N. R., and El Haj, A. J. (2014). Hydrogels for lung tissue engineering: Biomechanical properties of thin collagen–elastin constructs. J. Mech. Behav. Biomed. Mater. 38, 251–259. doi:10.1016/j.jmbbm.2014.04.005
Ehrmann, S., Schmid, O., Darquenne, C., Rothen-Rutishauser, B., Sznitman, J., Yang, L., et al. (2020). Innovative preclinical models for pulmonary drug delivery research. Expert Opin. Drug Deliv. Apr 17 (4), 463–478. doi:10.1080/17425247.2020.1730807
El-Sherbiny, I. M., and Smyth, H. D. C. (2010). Poly(ethylene glycol)–carboxymethyl chitosan-based pH-responsive hydrogels: Photo-induced synthesis, characterization, swelling, and in vitro evaluation as potential drug carriers. Carbohydr. Res. 345 (14), 2004–2012. doi:10.1016/j.carres.2010.07.026
El-Sherbiny, I. M., McGill, S., and Smyth, H. D. C. (2010). Swellable microparticles as carriers for sustained pulmonary drug delivery. J. Pharm. Sci. 99 (5), 2343–2356. doi:10.1002/jps.22003
Fernandes, C. A., and Vanbever, R. (2009). Preclinical models for pulmonary drug delivery. Expert Opin. Drug Deliv. 6 (11), 1231–1245. doi:10.1517/17425240903241788
Fish, M. B., Fromen, C. A., Lopez-Cazares, G., Golinski, A. W., Scott, T. F., Adili, R., et al. (2017). Exploring deformable particles in vascular-targeted drug delivery: Softer is only sometimes better. Biomaterials 124, 169–179. doi:10.1016/j.biomaterials.2017.02.002
Fröhlich, E. (2012). The role of surface charge in cellular uptake and cytotoxicity of medical nanoparticles. Int. J. Nanomedicine 7, 5577–5591. doi:10.2147/ijn.s36111
Fromen, C. A., Rahhal, T. B., Robbins, G. R., Kai, M. P., Shen, T. W., Luft, J. C., et al. (2016). Nanoparticle surface charge impacts distribution, uptake and lymph node trafficking by pulmonary antigen-presenting cells. Nanomedicine Nanotechnol. Biol. Med. 12 (3), 677–687. doi:10.1016/j.nano.2015.11.002
Fromen, C. A., Robbins, G. R., Shen, T. W., Kai, M. P., Ting, J. P. Y., and DeSimone, J. M. (2015). Controlled analysis of nanoparticle charge on mucosal and systemic antibody responses following pulmonary immunization. Proc. Natl. Acad. Sci. 112 (2), 488–493. doi:10.1073/pnas.1422923112
Goodman, C. M., McCusker, C. D., Yilmaz, T., and Rotello, V. M. (2004). Toxicity of gold nanoparticles functionalized with cationic and anionic side chains. Bioconjugate Chem. 15 (4), 897–900. doi:10.1021/bc049951i
He, C., Hu, Y., Yin, L., Tang, C., and Yin, C. (2010). Effects of particle size and surface charge on cellular uptake and biodistribution of polymeric nanoparticles. Biomaterials 31 (13), 3657–3666. doi:10.1016/j.biomaterials.2010.01.065
Horstmann, J. C., Thorn, C. R., Carius, P., Graef, F., Murgia, X., de Souza Carvalho-Wodarz, C., et al. (2021). A custom-made device for reproducibly depositing pre-metered doses of nebulized drugs on pulmonary cells in vitro. Front. Bioeng. Biotechnol. 9, 643491. doi:10.3389/fbioe.2021.643491
Huh, D., Matthews, B. D., Mammoto, A., Montoya-Zavala, M., Hsin, H. Y., and Ingber, D. E. (2010). Reconstituting organ-level lung functions on a chip. Science 328 (5986), 1662–1668. doi:10.1126/science.1188302
Hussell, T., and Bell, T. J. (2014). Alveolar macrophages: Plasticity in a tissue-specific context. Nat. Rev. Immunol. 14 (2), 81–93. doi:10.1038/nri3600
Jarai, B. M., and Fromen, C. A. (2022). Nanoparticle internalization promotes the survival of primary macrophages. Adv. NanoBiomed Res. 2, 2100127. doi:10.1002/anbr.202100127
Jarai, B. M., Stillman, Z., Attia, L., Decker, G. E., Bloch, E. D., and Fromen, C. A. (2020). Evaluating UiO-66 metal–organic framework nanoparticles as acid-sensitive carriers for pulmonary drug delivery applications. ACS Appl. Mater. Interfaces 12 (35), 38989–39004. doi:10.1021/acsami.0c10900
Jarai, B. M., Stillman, Z., Bomb, K., Kloxin, A. M., and Fromen, C. A. (2021). Biomaterials-based opportunities to engineer the pulmonary host immune response in COVID-19. ACS Biomaterials Sci. Eng. 7 (5), 1742–1764. doi:10.1021/acsbiomaterials.0c01287
Jarai, B. M., Stillman, Z., and Fromen, C. A. (2021). Hydrogel nanoparticle degradation influences the activation and survival of primary macrophages. J. Mater. Chem. B 9 (35), 7246–7257. doi:10.1039/d1tb00982f
King, B. M., and Fiegel, J. (2022). Zwitterionic polymer coatings enhance gold nanoparticle stability and uptake in various biological environments. Aaps J. Jan. 4 24 (1), 18. doi:10.1208/s12248-021-00652-3
Kolewe, E. L., Feng, Y., and Fromen, C. A. (2020). Realizing lobe-specific aerosol targeting in a 3D-printed in vitro lung model. J. aerosol Med. Pulm. drug Deliv. 34 (1), 42–56. doi:10.1089/jamp.2019.1564
Kolewe, E. L., Padhye, S., Woodward, I. R., Wee, J., Rahman, T., Feng, Y., et al. (2022). Spatial aerosol deposition correlated to anatomic feature development in 6-year-old upper airway computational models. Comput. Biol. Med. 149, 106058. doi:10.1016/j.compbiomed.2022.106058
Kreda, S. M., Okada, S. F., van Heusden, C. A., O'Neal, W., Gabriel, S., Abdullah, L., et al. (2007). Coordinated release of nucleotides and mucin from human airway epithelial Calu-3 cells. J. Physiology 584, 245–259. doi:10.1113/jphysiol.2007.139840
Leibrock, L., Wagener, S., Singh, A. V., Laux, P., and Luch, A. (2019). Nanoparticle induced barrier function assessment at liquid–liquid and air–liquid interface in novel human lung epithelia cell lines. Toxicol. Res. 8 (6), 1016–1027. doi:10.1039/c9tx00179d
Li, H., Wang, Y., Tang, Q., Yin, D., Tang, C., He, E., et al. (2021). The protein corona and its effects on nanoparticle-based drug delivery systems. Acta Biomater. 129, 57–72. doi:10.1016/j.actbio.2021.05.019
Li, X., Zhang, T., Lv, W., Wang, H., Chen, H., Xu, Q., et al. (2022). Intratracheal administration of polystyrene microplastics induces pulmonary fibrosis by activating oxidative stress and Wnt/β-catenin signaling pathway in mice. Ecotoxicol. Environ. Saf. 232, 113238. doi:10.1016/j.ecoenv.2022.113238
Longest, P. W., Bass, K., Dutta, R., Rani, V., Thomas, M. L., El-Achwah, A., et al. (2019). Use of computational fluid dynamics deposition modeling in respiratory drug delivery. Expert Opin. Drug Deliv. Jan. 16 (1), 7–26. doi:10.1080/17425247.2019.1551875
Lu, D., and Hickey, A. J. (2007). Pulmonary vaccine delivery. Expert Rev. Veccines 6 (2), 213–226. doi:10.1586/14760584.6.2.213
Mansour, H. M., Rhee, Y. S., and Wu, X. (2009). Nanomedicine in pulmonary delivery. Int. J. Nanomedicine 4, 299–319. doi:10.2147/ijn.s4937
Marshall, L. J., Oguejiofor, W., Willetts, R. S., Griffiths, H. R., and Devitt, A. (2015). Developing accurate models of the human airways. J. Pharm. Pharmacol. Mar 67 (3), 464–472. doi:10.1111/jphp.12340
Merkel, T. J., Jones, S. W., Herlihy, K. P., Kersey, F. R., Shields, A. R., Napier, M., et al. (2011). Using mechanobiological mimicry of red blood cells to extend circulation times of hydrogel microparticles. Proc. Natl. Acad. Sci. 108 (2), 586–591. doi:10.1073/pnas.1010013108
Mills-Goodlet, R., Schenck, M., Chary, A., Geppert, M., Serchi, T., Hofer, S., et al. (2020). Biological effects of allergen–nanoparticle conjugates: Uptake and immune effects determined on hAELVi cells under submerged vs. air–liquid interface conditions. Environ. Sci. Nano. 7 (7), 2073–2086. doi:10.1039/c9en01353a
Moyer, T. J., Zmolek, A. C., and Irvine, D. J. (2016). Beyond antigens and adjuvants: Formulating future vaccines. J. Clin. Invest. 126 (3), 799–808. doi:10.1172/jci81083
Mühlfeld, C., Rothen-Rutishauser, B., Blank, F., Vanhecke, D., Ochs, M., and Gehr, P. (2008). Interactions of nanoparticles with pulmonary structures and cellular responses. Am. J. Physiology-Lung Cell. Mol. Physiology 294 (5), L817–L829. doi:10.1152/ajplung.00442.2007
Muralidharan, P., Malapit, M., Mallory, E., Hayes, D., and Mansour, H. M. (2015). Inhalable nanoparticulate powders for respiratory delivery. Nanomedicine Nanotechnol. Biol. Med. 11 (5), 1189–1199. doi:10.1016/j.nano.2015.01.007
Nahar, K., Gupta, N., Gauvin, R., Absar, S., Patel, B., Gupta, V., et al. (2013). In vitro, in vivo and ex vivo models for studying particle deposition and drug absorption of inhaled pharmaceuticals. Eur. J. Pharm. Sci. official J. Eur. Fed. Pharm. Sci. 49 (5), 805–818. doi:10.1016/j.ejps.2013.06.004
Neutra, M. R., and Kozlowski, P. A. (2006). Mucosal vaccines: The promise and the challenge. Nat. Rev. Immunol. 6, 148–158. doi:10.1038/nri1777
Ohar, J. A., Donohue, J. F., and Spangenthal, S. (2019). The role of guaifenesin in the management of chronic mucus hypersecretion associated with stable chronic bronchitis: A comprehensive review. Chronic Obstr. Pulm. Dis. 6 (4), 341–349. doi:10.15326/jcopdf.6.4.2019.0139
Patton, J. S., and Byron, P. R. (2007). Inhaling medicines: Delivering drugs to the body through the lungs. Nat. Rev. Drug Discov. Jan. 6 (1), 67–74. doi:10.1038/nrd2153
Paur, H-R., Cassee, F. R., Teeguarden, J., Fissan, H., Diabate, S., Aufderheide, M., et al. (2011). In-vitro cell exposure studies for the assessment of nanoparticle toxicity in the lung—a dialog between aerosol science and biology. J. Aerosol Sci. 42 (10), 668–692. doi:10.1016/j.jaerosci.2011.06.005
Perry, J. L., Tian, S., Sengottuvel, N., Harrison, E. B., Gorentla, B. K., Kapadia, C. H., et al. (2020). Pulmonary delivery of nanoparticle-bound toll-like receptor 9 agonist for the treatment of metastatic lung cancer. ACS Nano 14 (6), 7200–7215. doi:10.1021/acsnano.0c02207
Peterman, E. L., Kolewe, E. L., and Fromen, C. A. (2020). Evaluating regional pulmonary deposition using patient-specific 3d printed lung models. JoVE J. Vis. Exp. 2020, e61706. doi:10.3791/61706
Popowski, K. D., Moatti, A., Scull, G., Silkstone, D., Lutz, H., Lopez de Juan Abad, B., et al. (2022). Inhalable dry powder mRNA vaccines based on extracellular vesicles. Matter. Sep. 7 5 (9), 2960–2974. doi:10.1016/j.matt.2022.06.012
Pritchard, J. N., Hatley, R. H. M., Denyer, J., and Hollen, D. (2018). Mesh nebulizers have become the first choice for new nebulized pharmaceutical drug developments. Ther. Deliv. 9 (2), 121–136. doi:10.4155/tde-2017-0102
Roberts, R. A., Shen, T., Allen, I. C., Hasan, W., DeSimone, J. M., and Ting, J. P. Y. (2013). Analysis of the murine immune response to pulmonary delivery of precisely fabricated Nano- and microscale particles. PLOS ONE 8 (4), e62115. doi:10.1371/journal.pone.0062115
Schneider, C. S., Xu, Q., Boylan, N. J., Chisholm, J., Tang, B. C., Schuster, B. S., et al. (2017). Nanoparticles that do not adhere to mucus provide uniform and long-lasting drug delivery to airways following inhalation. Sci. Adv. 3 (4), e1601556. doi:10.1126/sciadv.1601556
Schürch, D., Vanhecke, D., Clift, M. J. D., Raemy, D., de Aberasturi, D. J., Parak, W. J., et al. (2014). Modeling nanoparticle-alveolar epithelial cell interactions under breathing conditions using captive bubble surfactometry. Langmuir ACS J. surfaces colloids 30 17, 4924–4932. doi:10.1021/la500307q
Shen, T. W., Fromen, C. A., Kai, M. P., Luft, J. C., Rahhal, T. B., Robbins, G. R., et al. (2015). Distribution and cellular uptake of PEGylated PolymericParticles in the lung towards cell-specific targeted delivery. Pharm. Res. 32 (10), 3248–3260. doi:10.1007/s11095-015-1701-7
Stillman, Z., Jarai, B. M., Raman, N., Patel, P., and Fromen, C. A. (2020). Degradation profiles of poly(ethylene glycol)diacrylate (PEGDA)-based hydrogel nanoparticles. Polym. Chem. 11 (2), 568–580. doi:10.1039/c9py01206k
Swartz, M. A., Hirosue, S., and Hubbell, J. A. (2012). Engineering approaches to immunotherapy. Sci. Transl. Med. 4 (148), 148rv9. doi:10.1126/scitranslmed.3003763
Tenenbaum-Katan, J., Artzy-Schnirman, A., Fishler, R., Korin, N., and Sznitman, J. (2018). Biomimetics of the pulmonary environment in vitro: A microfluidics perspective. Biomicrofluidics 12 (4), 042209. doi:10.1063/1.5023034
Vecellio, L. (2006). The mesh nebuliser: A recent technical innovation for aerosol delivery. Breathe 2 (3), 252–260. doi:10.1183/18106838.0203.252
Vlahakis, N. E., Schroeder, M. A., Limper, A. H., and Hubmayr, R. D. (1999). Stretch induces cytokine release by alveolar epithelial cells in vitro. Am. J. Physiology-Lung Cell. Mol. Physiology 277 (1), L167–L173. doi:10.1152/ajplung.1999.277.1.l167
Weers, J. G., Bell, J., Chan, H. K., Cipolla, D., Dunbar, C., Hickey, A. J., et al. (2010). Pulmonary formulations: What remains to be done? J. aerosol Med. Pulm. drug Deliv. 23, S-5–S-23. doi:10.1089/jamp.2010.0838
Keywords: aerosol, nebulizer, PEGDA (poly(ethylene glycol) diacrylate), nanoparticle, air-liquid interface (ALI), surface charge
Citation: Sudduth ER, Kolewe EL, Graf J, Yu Y, Somma J and Fromen CA (2023) Nebulization of model hydrogel nanoparticles to macrophages at the air-liquid interface. Front. Chem. Eng. 4:1086031. doi: 10.3389/fceng.2022.1086031
Received: 31 October 2022; Accepted: 20 December 2022;
Published: 11 January 2023.
Edited by:
Karla Mayolo-Deloisa, Monterrey Institute of Technology and Higher Education (ITESM), MexicoReviewed by:
Wean Sin Cheow, Singapore Institute of Technology, SingaporeChristophe Bressot, French National Instiute for Industrial Environment and Risks (INERIS), France
Copyright © 2023 Sudduth, Kolewe, Graf, Yu, Somma and Fromen. This is an open-access article distributed under the terms of the Creative Commons Attribution License (CC BY). The use, distribution or reproduction in other forums is permitted, provided the original author(s) and the copyright owner(s) are credited and that the original publication in this journal is cited, in accordance with accepted academic practice. No use, distribution or reproduction is permitted which does not comply with these terms.
*Correspondence: Catherine A. Fromen, cfromen@udel.edu