A biofuels outlook for the U.S. and Brazil and what it might mean for sustainable development goal 7
 Jarrett Whistance
 Deepayan Debnath
 Wyatt Thompson
- 1Food and Agricultural Policy Research Institute, University of Missouri-Columbia, Columbia, MO, United States
- 2Institute of Data Analytics, Kalyani, India
Sustainable Development goals set out at the United Nations with broad support include targets relating to food security, energy access, and the environment. Some national policies have turned to renewable fuels to achieve energy and environmental goals, with biofuel use mandates applied in countries that account for significant market shares. However, the context in which the development goals were set and these biofuel policies put in place might differ from current and future conditions. The scope for biofuel expansion might be restrained by technical limits on blending rates, slower future growth in transportation energy demand after the pandemic, and the interactions with feedstock and other agricultural commodity markets, which could take different forms given larger biofuel volumes and other changes. Considering the expected policies and broader context, this study provides a 10-year outlook for biofuel use, production, feedstock demands, and other related variables with a primary focus on the United States and Brazil. We find scope for increasing biofuel use in both countries, particularly for biomass-based diesel, in the projection period and growing displacement of petroleum product-related greenhouse gas emissions, which is consistent with sustainable development goal seven.
Introduction
According to the consensus view of the Intergovernmental Panel on Climate Change, global climate change could devastate our environment and lead to a shortage of food that leads further to widespread malnutrition and famine that potentially puts human civilization in peril (IPCC - Intergovernmental Panel on Climate Change, 2023). Members of the United Nations (UN) identified a need to set goals or targets related to sustainable development in the future.
In the fall of 2015, the UN approved seventeen multilateral and international Sustainable Development Goals (SDGs) in the 2030 Agenda for Sustainable Development (U.N., 2015). The UN SDGs encompass three interconnected elements: economic development, social inclusion, and environmental sustainability (U.N., 2015). In part, the SDGs aim to tackle global warming, including damages triggered by more frequent natural disasters such as flooding due to intensive rains and extreme droughts.
While the SDG’s seventeen goals cover many other topics, our focus here is on SDG-7 (United Nations -Sustainable Development Goals, 2023) specifically, which speaks to the issues of affordable and clean energy. Clean and affordable energy is seen by many as a key to the development of agriculture, businesses, communications, education, healthcare, and transportation. More importantly, goal 7.2 supports substantial increases in the share of renewable energy, including biofuels, in the global energy mix by 2030. The focus on biofuels might reflect the overlap or conflict between goals that reflect climate change risks and the importance of low-cost liquid fuels for developing economies. The climate impacts of greenhouse gas (GHG) emissions from burning liquid fossil fuels might be reduced if the share from renewable sources rises while still providing energy to support production processes.
In the context of reduction in fossil fuel use and climate change mitigation policies, this study sheds light on biofuel’s past trends, current status, and future trajectory. We summarize available data about how ethanol and biomass-based diesel (“biodiesel” for convenience) volumes from different feedstocks have evolved, focusing on a few specific countries (See Supplementary Figures S1, S2). We also project the feedstock used for various biofuel production and the greenhouse gas emissions related to fossil fuel—with and without biofuels for the U.S. and Brazil—two major renewable fuel producing and consuming countries (IEA, 2021; IEA, 2022). The 10-year projections we present are the result of certain assumptions, such as normal economic and weather conditions. These projections of biofuel, feedstock, and related indicators combine into an internally consistent outlook that can identify key trends and uncertainty in these markets.
Biofuels are considered to be cleaner energy sources as they emit fewer greenhouse gases than fossil fuel combustion. Thus, they are identified as an important source of clean energy under SDG Goal 7 (García-Franco, 2021). Ethanol and biodiesel are the two most common forms of liquid biofuels (Palandri et al., 2019). Almost all the ethanol used worldwide for pharmaceuticals, solvent industries, and fuels is produced through fermentation (Debnath, 2019). Ethanol is produced through the fermentation of sugars derived mainly from corn grain and sugarcane, as well as from sugar beet, wheat grain (or other cereal grains), molasses, and various other grasses, including miscanthus, and switchgrass. Biomass-based diesel is another important biofuel and includes methyl-ester biodiesel and renewable diesel. Methyl-ester biodiesel is analogous to ethanol in broad terms but derived mainly from vegetable oil-based feedstocks (e.g., soybean oil, rapeseed oil, and palm oil), is produced under different processes, and is blended with petroleum diesel (Tsaoulidis et al., 2023). Renewable diesel can also be made from similar agricultural commodities and waste oils, including used cooking oil but is chemically identical to diesel, which makes it a “drop-in” fuel that can be blended into petroleum diesel at any concentration (DOE, 2023). Because of their close ties to both the energy sector and the agriculture sector, biofuels consequently relate to the energy and climate goals of the SDGs along with the SDGs that focus on food security and household wellbeing.
Background
Bioenergy—as the name implies—uses biological inputs to produce energy in the form of electricity, heat for industrial applications and cooking in stoves and boilers, and transportation energy mix. We focus on this last category, specifically biofuels that can be used in vehicles with or in place of petroleum-based products such as gasoline and diesel.
Vegetable oils, cereal grains, and sugarcane are commonly used feedstocks in the biofuel industry, while lesser volumes of biofuel are produced from cellulosic biomass derived from grasses or wastes (Palandri et al., 2019). Biofuels also provide socioeconomic, environmental, and technical advantages, with some studies finding employment benefits (Brinkman et al., 2018; DOE, 2023; Urbanchuk, 2023) and reduced GHG emissions compared to fossil fuels (EPA, 2010; Hochman and Zilberman, 2018). Biofuels are typically obtained from gains through the process of fermentation which gives them technical advantages compared to renewable fuels (Kocar and Civas, 2013; Voegele, 2013; Ramos et al., 2016; Ramos and Duque, 2019). Hill et al. (2006) found that ethanol and biodiesel use have certain environmental benefits: they are economically competitive, can be a net energy gain, and can meet higher demand without competing with food supplies. Biofuel policies might be related to the imperatives that underlie SDG Goal 7: 1) energy security and independence, 2) a reduction in petroleum-based fuel use, and 3) reducing global GHG emissions.
Around the world, policies are being implemented to reduce the transportation sector’s carbon footprint, and measures are being taken to introduce electric and hybrid cars, hydrogen-propelled trucks, trains, and other heavy vehicles. However, due to the nature of the different means of transportation (terrestrial, maritime, air), different considerations or constraints might affect the policy options available in the near term. Liquid biofuels for transportation already represent an alternative to replace not only part of the fossil hydrocarbons but also a means to reduce carbon and toxic net emissions linked to gasoline and diesel combustion motors. Moreover, biofuels can also interact with petroleum in fossil fuel markets. Debnath et al. (2017a) explore this idea in more detail, where the authors examine the uncertain relationship between ethanol and gasoline. For example, under certain market conditions—a non-binding government mandate—ethanol might act as a substitute for petroleum-based gasoline. However, it can act more as a complementary good when the non-binding mandate becomes binding, as is the case in the United States, where nearly all motor gasoline is currently consumed in the form of a 10 percent blend with ethanol (EPA, 2022).
Policies in place now seek to reduce the GHG emissions from the transportation sector. However, limiting these emissions is challenging with the increasing world population and the gross domestic product (GDP), which have risen by 29% and 84%, respectively, over the last decades (as shown in Figures 1, 2). The increasing use of biofuels—both ethanol and biodiesel—could reduce emissions in this sector. Governments across the globe have mandated the use of ethanol and biodiesel with petroleum fuels (Palandri et al., 2019). For example, in 2005, the U.S. adopted the Renewable Fuels Standard, which mandated biofuel use (Taheripour et al., 2022; EPA, 2023). Indeed, biofuel use has increased globally (Figure 3). However, it is presumably not always strictly a result of policy alone. The majority of bioethanol use is concentrated in two countries, the United States and Brazil. Globally, due to some combination of policy, prices, income, and preferences, the use of both ethanol and biodiesel has increased significantly over the last decade by over 100% and 30%, respectively.
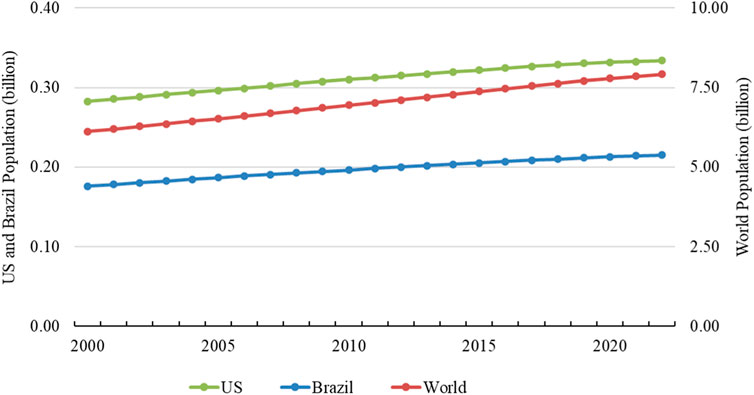
FIGURE 1. Historical Trend in United States and Brazil (on left axis) and world (on right axis) population. Source: S&P Global (2023).
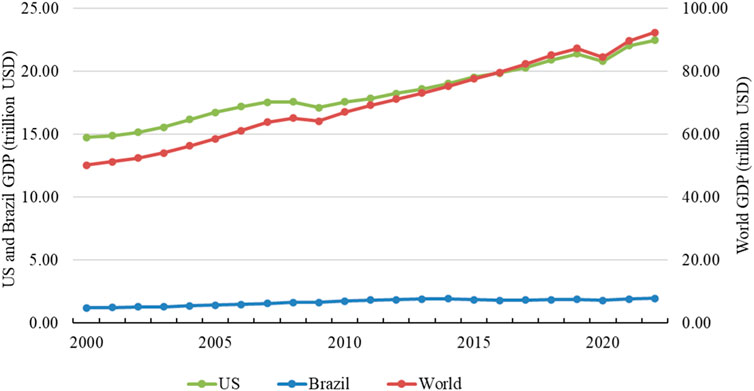
FIGURE 2. Historical trend in Gross Domestic Product (GDP) for the United States, Brazil, and the World. Source: S&P Global (2023).
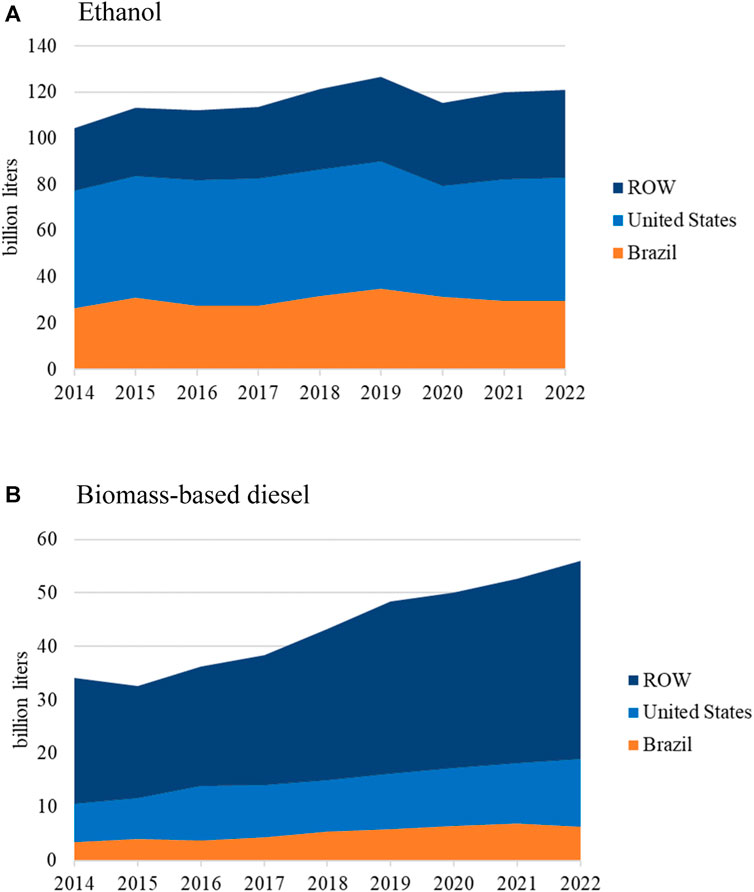
FIGURE 3. Historical trend in ethanol and biodiesel use for the United States and Brazil. (A) Ethanol. (B) Biomass-based diesel. Source: Foreign Agriculture Service of the United States Department of Agriculture, (2023).
Debnath and Babu (2019) summarize the status of biofuels in the global fuel mix and their contribution to the reduction of GHG emissions. However, there is debate around food versus fuel in terms of the production of crop-based biofuels (Debnath et al., 2019) and its indirect land use consequences (Searchinger et al., 2008; Khanna and Crago, 2012; Taheripour and Tyner, 2013). Many studies (Ji and Long, 2016; Austin et al., 2022) summarize the environmental and economic effects of the expansion of biofuel production and use. Here, we take one of the partial-equilibrium modeling approaches covered by those previous reviews and update it using the latest knowledge to evaluate the future of biofuel use and the volume of feedstocks used to meet such demand. Further, we examine the role of ethanol and biodiesel in the two major biofuels producing and consuming countries, the United States and Brazil, in lowering the GHG emissions related to petroleum-based fuel with in the transportation sector.
Methodology
We project market conditions using an economic model that represents supplies, demands, trade, stocks, and prices of key commodities. The underlying economic theory has long been the basis of structural representations that explicitly represent an agent’s behavior, market balance, and other economic or physical relationships. This is a partial equilibrium model that spans biofuels and many agricultural commodity markets. While more elaborate descriptions are available elsewhere for the feedstock markets (Gerlt and Westhoff, 2011) and U.S. biofuels (Whistance and Thompson, 2019) or in a Supplementary Material as regards biofuels in other countries, we summarize key aspects here, focusing on renewable fuel markets. Evolutions of this model have been used to develop extensive commodity market outlooks as well as to investigate various market outcomes related to biofuel-related policies (Debnath et al., 2017a; Debnath et al., 2017b; Johansson et al., 2020; Westhoff et al., 2023). The model used here is one of a broad set of partial and general equilibrium models of markets that have been used for forward-looking analysis including in the context of climate change and biofuel (Gurgel et al., 2007; Keeney and Hertel, 2009; Gehlhar and Somwaru, 2010; Hertel et al., 2010; Beckman et al., 2011; Nelson et al., 2014; Chatzopoulos et al., 2021; Chen et al., 2021; Fujimori et al., 2022). The starting point of this analysis is a version based on available market and policy data as of August 2023 with projections based on the assumption of normal economic conditions and no changes from existing or planned policies (Chiuchiarelli et al., 2023; Westhoff et al., 2023).
This summary of biofuels starts with the production of renewable fuels in each country, which depends in part on the relative value of the output fuel and the input cost, particularly feedstock prices. The production response to changes in profitability can take some time as plant capacity evolves over time, but we assume the industry will expand when profitable and contract when the output price falls relative to input costs. The specification is related to the profit-maximization problem of a firm with a Leontief production function for renewable fuels, QO, that combines feedstock quantities, QF, and other inputs, QZ, in a fixed proportion, but with decreasing returns to scale in the other inputs used to reflect limits to processing capacity or access to other inputs as shown in Eq. 1. Thus,
where the conversion rate from feedstock to output, βF, is largely invariant in the short run and links output renewables to input feedstocks based on underlying physical characteristics. The production function relates output to other inputs, including capital, facilities, and energy, using two parameters,
The key term in Eq. 2 is the real processor margin that equals the output price, PS, less the feedstock price, PF, converted into like terms using the physical relationship, βF, and deflated by the price of other inputs, PZ. This relationship is rendered in the dynamic, annual model as a local linear approximation, with expected returns and an adjustment process (Nerlove, 1956) to represent the challenges of changing production capacity over time. Expected margins are proxied as a moving average of recent margins. We assume existing trends typically persist to some extent into the future, so there is implicitly some scope for improvements in technologies. The representation omits the potential for a radical technological improvement that causes large changes in biofuel production. Production is often decomposed so that the volume of biofuel made from certain crops or crop products can be identified.
Consumption is a result of the demand for fuels. In the absence of any mandate, renewable fuel demand depends on the population, income, renewable fuel price, and competing petroleum product prices. In these cases, renewable fuel and petroleum products are represented as substitutes at least at the margin; a higher petroleum product price tends to increase the consumption of alternative fuels. If, instead, a mandate is in place, then the mandate can be represented as a function of the mandated share times the petroleum product use. In some cases, such as U.S. RFS (Renewable Fuel Standard) and Brazil RenovaBio programs, the policy mechanisms to implement the mandated volumes, the prices of certificates of compliance (Renewable Identification Numbers (RINs) in the United States and Biofuel Decarbonization Credits (CBIOs) in Brazil), the gaps between the biofuel producer and consumer prices, and the costs of the mandate that are assumed to be paid by the fuel sector. Thus, for any particular biofuel, the demand for that biofuel
The mandate is discussed further below, but a key point here is that an increasingly binding mandate will tend to drive up the price processors get for generating co-produced biofuels and compliance certificates while driving down the price consumers pay for the biofuel alone. In practice, the demand equations used in the model are local linear approximations and also include trend terms. These trend terms are often included to capture long-run patterns in consumer tastes or preferences, such as shifts towards less liquid fuel use per person in some regions due to factors such as greater adoption of electric vehicles or less driving overall (Elkhafif and Kubursi, 1993; IEA, 2021).
Trade and price determination are considered together. In cases where a country’s trade is substantial relative to the internal market and unrestricted, the internal price is usually linked to the external price, taking exchange rates into account. Arbitrage between internal and external markets tends to keep prices in line, with trade flows expanding or contracting otherwise. In other cases where a country’s trade is constrained, such as by policy or underlying product differentiations, the trade equation might depend on relative internal and external prices. In these cases, the trade will expand according to the profitability, but only up to a point, given the context.
Ending stocks of renewable fuels are typically represented as a combination of two factors. First, a transaction—reflecting the volume of product moving through the system is a simple function of a key quantity, including production or consumption, to give it scale. The second factor is speculation, which is driven by the real price. In some cases, renewable fuel stocks are small or very little, so they are mostly ignored.
The representations of a few countries are more detailed (see Whistance and Thompson, 2019, or the Supplementary Material). The U.S. is the most elaborate case, where biomass-based diesel is decomposed into biodiesel and renewable diesel. Ethanol use takes three forms based on different biofuel inclusion rates (E10, E15, and E85). E10 is a low-level ethanol-blended fuel that contains 10% ethanol and 90% gasoline—more than 98% of the motor gasoline sold in the U.S. is E10. E15, another low-level blended fuel, is a mixture of 15% ethanol and 85% gasoline -it can only be used in vehicles made after 2001. E85, also known as flex-fuel, has the highest percent of ethanol at 85% and the rest at 15% gasoline. E85 can only be used in flex-fuel vehicles (DOE, 2023). Trade is also differentiated somewhat based on product. Brazil is another case where the markets are represented with greater detail, with biofuel trade by product and different forms of ethanol use—hydrous and anhydrous)—separated.
Policies are represented as they affect incentives where possible. Demand mandates that require a certain share of fuel use to come from renewable sources are often represented as a lower bound on domestic renewable fuel use. When binding, these policies can cause petroleum and renewable products to be complemented in demand (Thompson et al., 2011). The renewable fuel policies of the U.S. and Brazil are represented in more detail using actual mechanisms, including traded certificates of compliance that are explicitly tallied up and priced (RINs in the United States and CBIOs in Brazil). The mandate is explicitly represented in the model as a requirement that the mandated volume,
The renewable fuel model is connected to a complicated agricultural commodity and agricultural product market modeling system. The entire model system spans crop and crop-product markets in which renewable fuel feedstock demands play a critical role: rising renewable fuel use, due to demand strength or policy, will tend to increase biofuel producer returns and lead to greater purchases of feedstocks, driving up the prices of these crops and crop products. Livestock and livestock product markets are also represented and linked to the renewable fuel model—resulting in competing demand for ethanol feedstocks, such as corn and soybeans. However, livestock and livestock product suppliers also purchase protein meal that is co-produced with vegetable oil that biomass-based diesel producers buy. The complicated interactions among commodity markets represented here go beyond direct competition between livestock and biofuel sectors in feedstock markets. These and other relationships are maintained in the projections by using a model that explicitly represents the cross-commodity impacts. This fully functional model was updated most recently to reflect market information as of August 2023 (Chiuchiarelli et al., 2023; Westhoff et al., 2023).
Historical data sources for the model are primarily official statistics. Foreign Agriculture Service, Economic Research Service, and other US Department of Agriculture agencies are sources of invaluable data about markets. The U.S. Department of Energy’s Energy Information Agency organizes and provides fuel market data. Other sources include international organizations (IEA, 2023), government sources (CEPEA, 2023; Ministério de Minas e Energia, 2023a, 2023b), and private data sources (S&P Global, 2023). Projection period biofuel and agricultural commodity market data are study-model outputs, while S&P Global is the source of macroeconomic and petroleum price projections. Projections reported here assume normal weather conditions and unchanging or announced policies to provide a set of baseline trends or patterns.
Macroeconomic context
Macroeconomic assumptions are important for market projections (Table 1). We do not generate our own projections of global macroeconomic conditions. Instead, we rely on projections developed by S&P Global (2023). We summarize here information that is available with more detail elsewhere (Chiuchiarelli et al., 2023; Westhoff et al., 2023).
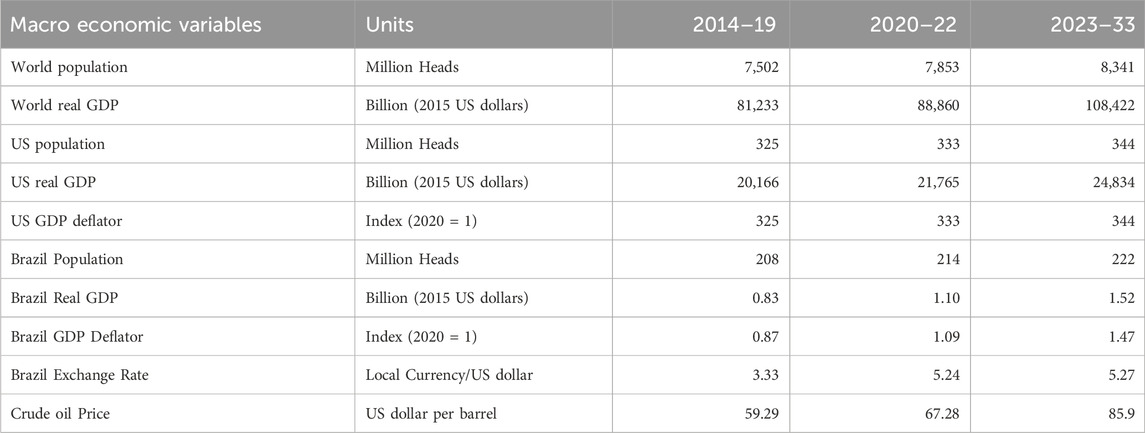
TABLE 1. Macroeconomic assumptions.
In terms of real GDP, global GDP is projected to slow somewhat in 2023 relative to 2022 before rebounding back in 2024 and settling at an average growth rate of 2.7 percent per year after that. GDP growth in the U.S. is projected to follow a similar trajectory only at a small rate of growth (e.g., averaging about 1.7 percent per year after 2024), while China’s GDP is projected to grow somewhat faster than the global average (4.5 percent per year). S&P Global (2023) projects strong GDP growth in Brazil of over 3 percent per year from 2025 compared to the stagnation of 2013–21 (as shown in Figure 2). This source expects that the nominal exchange rate of the Brazilian real relative to the USD will lose value after some appreciation going into 2023. Given relative rates of inflation, as measured by GDP deflators, the real Brazil-U.S. exchange rate is projected to appreciate. Global, as well as U.S. and Brazil, population growth rates are projected to decline slightly over time (as shown in Figure 2).
We also rely on petroleum price projections provided by S&P Global. The two petroleum prices we focus on are the West Texas Intermediate and Refiners’ Acquisition Cost in the United States. Both prices follow the same path of declining prices in 2023 and 2024 before climbing steadily through the end of the projection period in 2032 and reaching $95 and $97 per barrel, respectively, which is only slightly higher than where they were in 2022 in nominal terms. Consumer prices for gasoline and diesel in the U.S. also decline from their 2022 levels, and while they begin rising toward the end of the projection period, they do not return to their 2022 levels by the end. Retail gasoline prices in the U.S. average $3.56 per gallon from 2028 to 2032, and retail diesel prices average around $3.99 for the same period.
Results
Global biofuel use expansion has been uneven, and the relative contributions of specific countries have varied. We focus on the results relating to two large producers and consumers of biofuels, namely, the United States and Brazil (Table 2). (See the Supplementary Material for information about other countries and overall biofuel trade.) Moreover, further expansion is anticipated, given the market and policy conditions (Figure 4). The U.S. is expected to remain the dominant market for ethanol, but growth in Brazil resumes, and other countries account for growing market share. Biomass-based diesel use in the U.S. and Brazil is expected to increase in the future.
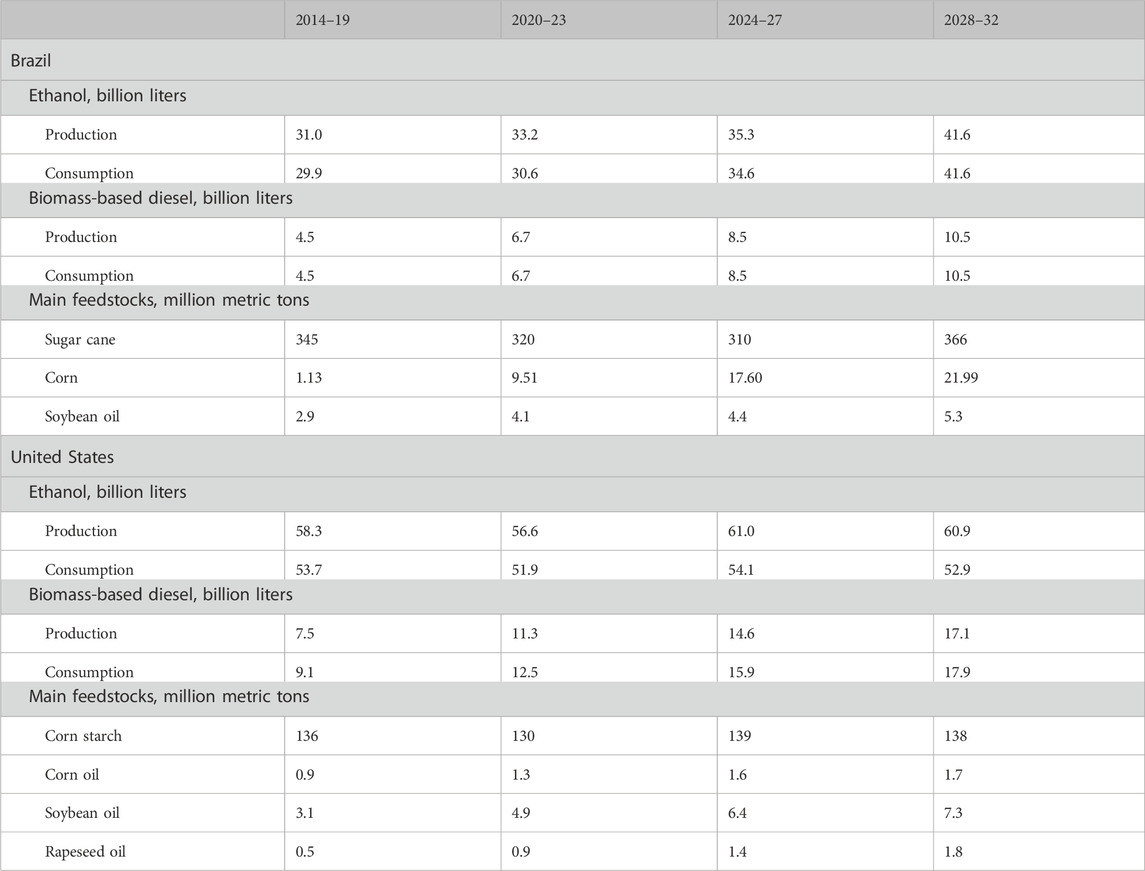
TABLE 2. Historical and projected ethanol and biodiesel production and consumption by countries and corresponding feedstocks.
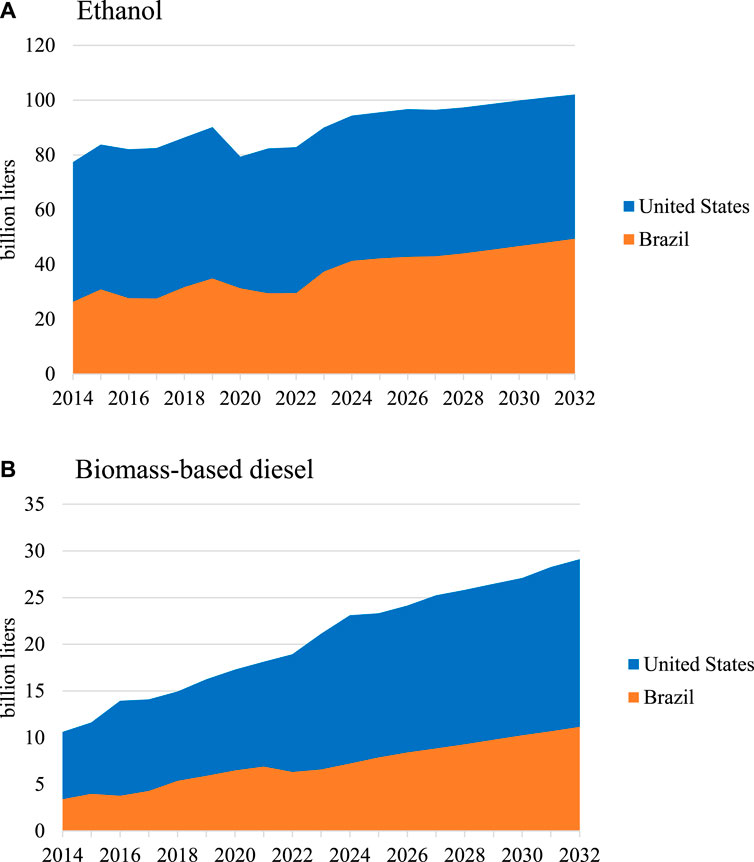
FIGURE 4. Ethanol and biodiesel consumption for the United States and Brazil, historical data and projections. (A) Ethanol. (B) Biomass-based diesel. Sources: Foreign Agriculture Service of the United States Department of Agriculture, (2023) for historical data.
Biofuel uses in the United States and Brazil
Liquid motor fuel and, by extension, liquid biofuel use in the U.S. depends not only on the market context (i.e., prices) and policies (e.g., the Renewable Fuel Standard) but a variety of other factors, including technology deployment. For example, there have been many announcements about rising electric vehicle sales over time. However, meeting those targets will depend on how quickly the technology can be deployed and used by a sufficient number of consumers. In our outlook, the combination of factors, including rising prices, rising mandates for the share of biofuel use, and an increasing share of electric vehicles in the light-duty market led to declining motor gasoline use over the projection period. Motor gasoline demand never reaches pre-COVID levels in our projections and falls to less than 473 billion liters by 2032. Although the RFS requires increasing shares of biofuel in the motor fuel pool over time, the pool is shrinking in our outlook, and ethanol demand will begin to decline after 2026. Low-blend fuels such as E10 continue to make up the bulk of the U.S. ethanol disappearance in our projections, but mid-level blends - E15 will triple their share from less than 5 percent of ethanol disappearance to just less than 16 percent by 2032. High-blend fuels - E85 remains steady through most of the projection period. They start to increase in the final 2 years as mandates become somewhat more binding.
On the other hand, diesel fuel demand in the U.S. continues to rise slightly over time as the economy grows, and biomass-based diesel use rises over time as well. The blend rate is more difficult to ascertain in our projections because we do not split domestic disappearance into traditional methyl-ester (FAME) type biodiesel, which tends to be used at lower blend rates (i.e., less than 10 percent in most cases) and renewable diesel, which can be used at any blend level with petroleum diesel because they are chemically the same. However, we do split production into FAME and renewable diesel. Data representing market conditions in 2023, although preliminary at this time, suggest that renewable diesel production has overtaken FAME production. Our outlook points to continued increases in the share of renewable diesel in total production over the projection period. Based on that, and the fact that imports of FAME into the U.S. remain low, domestic use of biomass-based diesel is projected to be mostly renewable diesel.
Brazil’s biofuel use prospects are also affected by a combination of factors, including general economic conditions, feedstock prices, and policy. Ethanol and biodiesel use mandates are assumed to remain in place. Moreover, the RenovaBio policy introduced in 2019 is included in this study (ANP, 2020; USDA, 2021). This last new policy is an essential element of the baseline assumptions. During and after the pandemic, the targets have been waived, and the biofuel levels outlined in the RenovaBio appeared considerably easy to meet if judged by the size of compliance costs compared to the value of fuels in the market. Going forward, we assume the policy will be implemented as stated, and the target will not be waived. Higher-income and policy implications drive biofuel use up in the future. Considering these facts, ethanol use is expected to rebound and grow strongly in the projection period. Biodiesel use is also expected to rise quickly due in part to economic growth, a use mandate, and RenovaBio.
While the U.S. and, perhaps, Brazil are not the primary focus of the U.N.’s sustainable development goals, the results of this outlook have implications for the developing economies that are the focus of those goals. As it relates to energy use going forward, we show rising biofuel use in both the U.S. and Brazil, due in large part to their own biofuel mandates. This, combined with a somewhat shrinking pool of overall liquid fuel use in the transportation sector due to electrification, might imply greater availability of liquid fuels, including biofuels, in developing regions. This would be a step toward meeting SDG 7.2 in that the overall share of renewable energy is increasing and perhaps mitigating some of the effects of climate change while the fuel itself may be more widely available.
Biofuel feedstocks
Global biofuel feedstock use follows roughly the same path as biofuel use (as shown in Figure 5). The shares of specific feedstocks can be unexpected owing to the differences in feedstock availability in each country and conversion rates from renewable input to biofuel output. For example, sugar cane accounts for the largest share of ethanol feedstocks if volumes of feedstock are simply summed up. The surge in ethanol use in Brazil in the near future help sugarcane feedstock use to recover in the projection period. Corn starch-based ethanol use continues to rise in the projection period, but much of the increase is from outside the U.S., even though the U.S. accounts for a significant part of the total volume of consumption. Biodiesel use rises in the projection period for all feedstocks, although at a slower rate than in the past. The volume of the primary feedstocks, specifically vegetable oils derived from soybeans, rapeseed and palm oil, rises, but their share falls. The use of other biodiesel feedstocks, including animal fats and recycled oils (Foreign Agriculture Service of the United States Department of Agriculture, 2023), continues to rise in part because of policies favoring renewable fuels that emit fewer GHGs.
FIGURE 5. U.S. and Brazil biofuel feedstock use. (A) Major feedstocks use in the United States. (B) Major feedstocks use in Brazil. Source: Foreign Agriculture Service of the United States Department of Agriculture, (2023) for historical data and authors’ calculations for projection data. Note: Volumes are summed without regard to their relative conversion rates from feedstock input to biofuel output.
The U.S. offers an interesting and important example. There, nearly all fuel ethanol is produced from corn starch. As of August 2023, around 40% of the corn crop each year is used to produce fuel ethanol and its associated co-products, including distillers’ corn oil (used in biomass-based diesel production) and distillers’ grains (used in livestock feed rations) (Office of the Chief Economist of the United States Department of Agriculture, 2023). Although domestic demand for ethanol tapers off alongside motor gasoline consumption in our projections, production continues to rise as growth in export demand outpaces the declines in domestic consumption. The U.S. ethanol production is estimated to rise from 58.7 billion liters in 2023 to an average of 60.5 billion liters between 2028 and 2032. This also implies a slight increase in the amount of corn used as a feedstock in the production process from about 136.6 million metric tons in the 2023/24 marketing year to around 138.2 million metric tons in later years. During the same time, sugarcane used in ethanol production in Brazil increased by 78,459 million tons or 24% (from 2023/24 to 2031/32).
Biomass-based diesel is produced primarily from soybean oil in the United States. As ethanol production increased, distillers corn oil became a more prominent feedstock, as well. It was spurred on not only by increasing availability but also by a favorable carbon intensity score by California Air Resource Board as part of the state’s Low Carbon Fuel Standard (CARB, 2023). In recent years, soybean oil has accounted for around 45% of biomass-based diesel production, with distillers corn oil making up around 15% and a mix of other waste oils and tallows making up the remainder. Going forward, the expansion in biomass-based diesel production is projected to be met with greater use of soybean oil for two reasons: first, there is little room for increased distillers corn oil production as nearly all dry-mill facilities are producing all they can, and only modest increases in ethanol production imply limited growth in corn oil production. Second, the further growth in the use of waste greases and tallows as renewable diesel feedstocks is minimal. Soybean oil used as a feedstock in the U.S. is projected to expand from 5.9 million metric tons in the 2023/24 marketing year to an average of 7.0 million metric tons during 2028/29 and 2031/32 marketing years, and in Brazil, it raised by 11%.
Depending on which feedstocks are used for biofuel production and their competing uses in the global food supply, the expansion of biofuel use might be tempered if it leads to an increase in food price inflation. For example, increased use of sugar from sugarcane in Brazil to produce ethanol might lead to somewhat less sugar available on the global market and, hence, higher sugar prices and potentially reduced caloric intake. Similarly, a higher-than-anticipated increase in the price of biomass-based diesel feedstocks, including soybean oil and rapeseed oil, might be viewed as more problematic in terms of food security effects than a similar increase in the price for feedstocks like waste oils and animal tallows. Here is where policymakers, especially in developing nations, would need to decide for themselves and their constituents how to balance the desire to meet a broad goal such as SDG 7 with potential concerns regarding food security given their economic situation.
U.S. GHG emissions if only petroleum products were used
The GHG emissions from transportation fuels would be different if not for renewable fuels. Here, we calculate these emissions in the hypothetical case that the total transportation energy was delivered using fossil fuels without any renewables.
These calculations are simplifications of much more complicated potential outcomes. First, we assume that the renewable fuels substitute 1:1 on an energy basis for the petroleum fuel they are replacing. For example, a liter of ethanol has roughly two-thirds the energy content of a liter of gasoline. If each liter of ethanol used was instead replaced by a liter of gasoline, it would require two-thirds of the same volume. Biodiesel and renewable diesel are more similar in energy content to petroleum-based diesel, but a similar concept applies. Second, rather than mapping the aggregate production volumes in our outlook to each of the specific pathways and their respective emissions scores, we apply values that are generally applicable. Third, we ignore the long list of potential market effects that this shift would cause; we do not estimate market conditions with and without biofuels.
As part of the administration of the RFS, the EPA (Environmental Protection Agency) is responsible for analyzing and assigning lifecycle greenhouse gas emissions scores for the various feedstock-to-fuel production pathways. Using those lifecycle scores and comparing them to the baseline emissions score for petroleum-based fuels, we calculate the approximate emissions that have accrued through the use of biofuels blended with petroleum fuels. In this case, we follow the lead of the EPA and use a net emission score of 77.2 kg CO2e/mmBtu for ethanol compared to the baseline gasoline score of 98.2 kg CO2e/mmBtu. Meanwhile, we assume biomass-based diesel produced from soybean oil has a net emissions score of 42.2 kg CO2e/mmBtu compared to petroleum diesel score of 97.0 kg CO2e/mmBtu (EPA, 2016).
The results of this simple comparison are shown in Figures 6, 7. In the case of motor gasoline use, the baseline GHG emissions are projected to decline somewhat over time as vehicles become more fuel-efficient and less motor gasoline is used. The stacked area shows the shift in GHG emissions that might occur if the current and projected levels of ethanol use in the U.S. were displaced by an energy-equivalent volume of petroleum-based gasoline, ignoring other market effects. In other words, how much might GHG emissions change if the gasoline and diesel fuel markets shifted from the current context, in which they are blended with biofuels (labeled “blended” in the figures), to a context in which they are not blended with biofuel (labeled “unblended” in the figures). All else equal, replacing the biofuel content of fuels with an energy-equivalent amount of petroleum fuel leads to an increase in GHG emissions. Given a reasonably flat projection for ethanol use, as the blend rate is not projected to expand much beyond its current level, the shift in GHG emissions is also flat. The results for diesel fuels in Figure 7 are more pronounced. In this case, GHG emissions from projected diesel fuel use are still rising slightly over time. Concurrently, biomass-based diesel use is projected to expand beyond the current level, so the shift in GHG emissions that might occur if biomass-based diesel were displaced by an energy-equivalent amount of petroleum diesel would also expand slightly over time.

FIGURE 6. GHG emissions from motor gasoline used (“blended”) and the GHG emissions from motor gasoline if ethanol were displaced (“unblended”) in the United States.
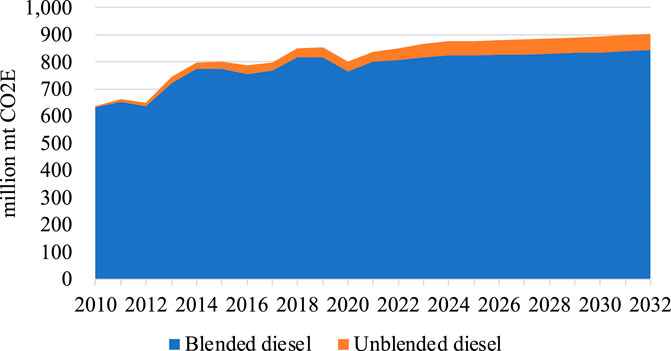
FIGURE 7. GHG emissions from diesel used (“blended”) and the GHG emissions from diesel if biomass-based diesel were displaced (“unblended”) in the United States.
Brazil’s GHG emissions if only petroleum products were used
Motor gasoline and ethanol are used in much more equal proportions in Brazil relative to the U.S. case. Thus, while the U.S. uses more ethanol at present, the share of ethanol use in Brazilian motor fuels is higher than the U.S. ethanol share. Moreover, given the treatment of the new RenovaBio program, the projections suggest a growing share of ethanol in Brazil. One consequence of these baseline projections is flat or falling GHG emissions from motor gasoline (as shown in Figure 8). In addition, the volume of GHG from motor gasoline would rise by a larger share in the future than in the past if ethanol were displaced by the energy equivalent amount of petroleum gasoline. As before, however, this displacement is calculated at a one-for-one rate, and broader market impacts are set aside.
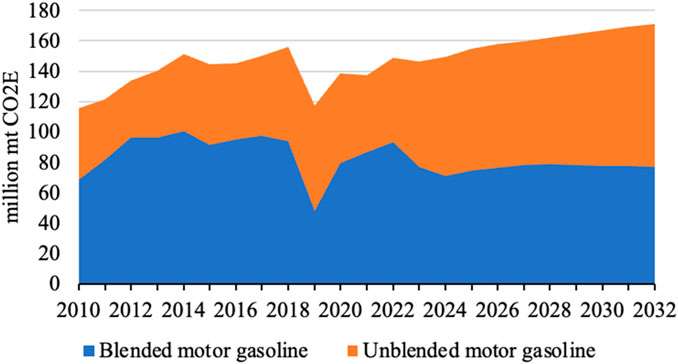
FIGURE 8. GHG emissions from motor gasoline used (“blended”) and the GHG emissions from motor gasoline if ethanol were displaced (“unblended”) in Brazil.
Diesel and biodiesel use are both projected to grow after years of stagnation, as shown in Figure 9. Thus, GHG emissions from diesel are projected to return to past levels and then rise slowly. If biomass-based diesel were displaced as assumed in these calculations, then there could be an additional 10%–15% higher emissions in the projection period.
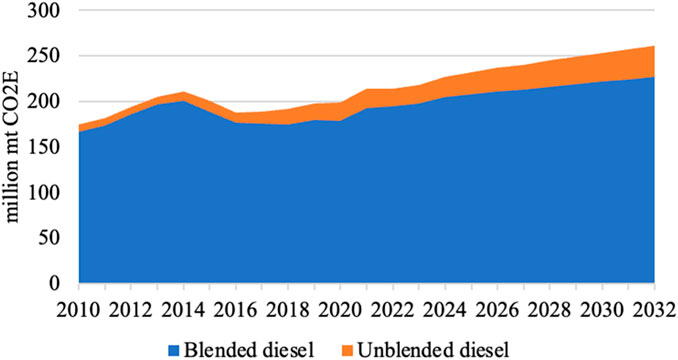
FIGURE 9. GHG emissions from diesel used (“blended”) and the GHG emissions from diesel if biomass-based diesel were displaced (“unblended”) in Brazil.
We see evidence here that policies such as RenovaBio in Brazil and the Renewable Fuel Standard in the U.S. might lead to levels of GHG emission reduction that are consistent with the climate change mitigation goal of SDG 7. While it is a generalized comparison, this is the sort of result that, again, policymakers in developing nations could incorporate into their process when deciding whether or not to implement similar policies in order to contribute further to SDG 7 and other sustainable development goals.
Conclusion
United Nations members set development goals, including provisions for enhancing food security, expanding energy access, and mitigating climate change. Some nations have implemented biofuel policies that reflect a view that these fuels might contribute to some of these goals or other societal objectives. Biofuel use mandates in the U.S. and Brazil presumably have helped to cause these countries to account for a large share of total biofuel use in the past decade. The global pandemic briefly halted the trend toward greater growth in ethanol use and slowed the expansion of biomass-based diesel use. We review the recent conditions and outlook for biofuels to consider the role of these energy commodities in meeting the development goals.
Global ethanol use growth continued from 2014 to 2019 and is expected to increase further, given the existence of biofuel policies and macroeconomic settings, after recovering from the pandemic. The U.S. is expected to remain the dominant ethanol market. Most ethanol is expected to be made from sugarcane by volume, followed by corn. Global biodiesel use has shown more strength in the past several years than ethanol use and is projected to continue to rise at a fast pace, although not as rapidly as in the past. In the future, the U.S. and Brazil play an essential and growing part. Biodiesel feedstocks are also drawn from an increasingly diverse array of inputs, going beyond the usual oils from oilseeds and palm.
These projections can be related to sustainable development goals. Rising biofuel use suggests greater availability of energy, and the broader base of expansion outside of the U.S. and EU indicates that more of these increases could be in developing countries. The potential for negative future impacts of biofuels on food security might be limited if the majority of feedstock growth is in biodiesel feedstocks other than vegetable oils commonly used for food products. Future growth of sugarcane use for ethanol, if realized, might reduce calorie intake but it could otherwise be difficult to make a strong case for the contribution of sugar food consumption or other sweeteners to food security. Regarding climate change mitigation, we have some evidence that the contribution of biofuels to petroleum products displaces a modest overall portion of GHG emissions. However, an underlying uncertainty about GHG emissions calculations is how to relate national emission estimates to global impacts. Thus, we cannot confidently calculate GHG emissions that are consistent with the country-specific GHG policies and also estimate global impacts. We recognize that the full effects of biofuels in general and biofuel policies specifically on markets are complicated and go beyond the scope of the present work. The outlook and GHG calculations generated in this study show that the U.S. and Brazil’s biofuel production and use might contribute towards the UN SDG-7.
Data availability statement
The original contributions presented in the study are included in the article/Supplementary Material, further inquiries can be directed to the corresponding author.
Author contributions
JW: Writing–original draft. DD: Writing–original draft. WT: Writing–original draft, Writing–review and editing.
Funding
The authors declare financial support was received for the research, authorship, and/or publication of this article. This material is based in part on work supported by the U.S. Department of Agriculture, under Agreement No. 58-0111-21-012 and the USDA National Institute of Food and Agriculture, Hatch project number MO-C1537173.
Conflict of interest
The authors declare that the research was conducted in the absence of any commercial or financial relationships that could be construed as a potential conflict of interest.
Publisher’s note
All claims expressed in this article are solely those of the authors and do not necessarily represent those of their affiliated organizations, or those of the publisher, the editors and the reviewers. Any product that may be evaluated in this article, or claim that may be made by its manufacturer, is not guaranteed or endorsed by the publisher.
Author disclaimer
Any opinion, findings, conclusions, or recommendations expressed in this publication are those of the authors and do not necessarily reflect the view of the U.S. Department of Agriculture nor the University of Missouri.
Supplementary material
The Supplementary Material for this article can be found online at: https://www.frontiersin.org/articles/10.3389/fceng.2023.1290763/full#supplementary-material
References
Agência Nacional do Petróleo (ANP) (2020). RenovaBio. https://www.gov.br/anp/pt-br/assuntos/renovabio.
Alternative Fuels Data Center (2023). Alternative fuels data center- ethanol blends. https://afdc.energy.gov/fuels/ethanol_blends.html.
Austin, K. G., Jones, J. P. H., and Clark, C. M. (2022). A review of domestic land use change attributable to U.S. biofuel policy. Renew. Sustain. Energy Rev. 159, 112181. doi:10.1016/j.rser.2022.112181
Beckman, J., Hertel, T., Taheripour, F., and Tyner, W. (2011). Structural change in the biofuels era. Eur. Rev. Agric. Econ. 39 (1), 137–156. doi:10.1093/erae/jbr041
Brinkman, M. L. J., da Cunha, M. P., Heijnen, S., Wicke, B., Guilhoto, J. J. M., Walter, A., et al. (2018). Interregional assessment of socio-economic effects of sugarcane ethanol production in Brazil. Renew. Sustain. Energy Rev. 88, 347–362. doi:10.1016/j.rser.2018.02.014
California Air Resources Board (2023). LCFS pathway certified carbon intensities. https://ww2.arb.ca.gov/resources/documents/lcfs-pathway-certified-carbon-intensities.
Centro de Estudos Avançados em Economia Aplicada (CEPEA) (2023). Indicador do açúcar cristal branco. www.cepea.esalq.usp.br/br/indicador/acucar.aspx.
Chatzopoulos, T., Pérez Domínguez, I., Toreti, A., Adenäuer, M., and Zampieri, M. (2021). Potential impacts of concurrent and recurrent climate extremes on the global food system by 2030. Environ. Res. Lett. 16, 124021. doi:10.1088/1748-9326/ac343b
Chen, L., Debnath, D., Zhong, J., Ferin, K., VanLock, A., and Khanna, M. (2021). The economic and environmental costs and benefits of the renewable fuel standard. Environ. Res. Lett. 16, 034021. doi:10.1088/1748-9326/abd7af
Chiuchiarelli, S., Binfield, J., Thompson, W., and Bordigioni, M. (2023). Baseline update for international agricultural narkets. FAPRI-MU Report 5-23. Washington, D.C, USA: Food and Agricultural Policy Research Institute.
Debnath, D. (2019). “From biomass to biofuel economics,” in Biofuels, bioenergy and food security. Editors D. Debnath, and S. Babu (Cambridge, Massachusetts, United States: Academic Press), 45–60.
Debnath, D., and Babu, S. (2019). “From biomass to biofuel economics,” in Biofuels, bioenergy and food security. Editors D. Debnath, and S. Babu (Cambridge, Massachusetts, United States: Academic Press), 45–60.
Debnath, D., Khanna, M., Rajagopal, D., and Zilberman, D. (2019). The future of biofuels in an electrifying global transportation sector: imperative, prospects and challenges. Appl. Econ. Perspect. Policy 41 (4), 563–582. doi:10.1093/aepp/ppz023
Debnath, D., Whistance, J., and Thompson, W. (2017b). The causes of two-way U.S.-Brazil ethanol trade and the consequences for greenhouse gas emission. Energy 141, 2045–2053. doi:10.1016/j.energy.2017.11.048
Debnath, D., Whistance, J., Thompson, W., and Binfield, J. (2017a). Complement or substitute: ethanol’s uncertain relationship with gasoline under alternative petroleum price and policy scenarios. Appl. Energy 191, 385–397. doi:10.1016/j.apenergy.2017.01.028
Department of Energy (DOE) (2023). Alternative fuels data center- renewable gasoline. https://afdc.energy.gov/fuels/emerging_hydrocarbon.html.
Elkhafif, M. A., and Kubursi, A. A. (1993). The demand for gasoline: a two stage approach. Int. J. Forecast. 9 (4), 457–465. doi:10.1016/0169-2070(93)90073-v
Environmental Protection Agency (EPA) (2010). Renewable fuel standard program (RFS2) regulatory impact analysis. EPA-420-R-10-006. Washington, D.C., United States: EPA.
Environmental Protection Agency (EPA) (2016). Summary table of lifecycle greenhouse gas emissions for select pathways. https://www.epa.gov/sites/default/files/2016-07/documents/select-ghg-results-table-v1.pdf.
Environmental Protection Agency (EPA) (2022). Ethanol waivers (E15 and E10). https://www.epa.gov/gasoline-standards/ethanol-waivers-e15-and-e10.
Environmental Protection Agency (EPA) (2023). Overview for renewable fuel standard. https://www.epa.gov/renewable-fuel-standard-program/overview-renewable-fuel-standard.
Foreign Agriculture Service (FAS) of the United States Department of Agriculture (2023). Global agricultural information network. https://gain.fas.usda.gov/.
Fujimori, S., Wu, W., Doelman, J., Frank, S., Hristov, J., Kyle, P., et al. (2022). Land-based climate change mitigation measures can affect agricultural markets and food security. Nat. Food 3, 110–121. doi:10.1038/s43016-022-00464-4
García-Franco, A., Godoy, P., de la Torre, J., Duque, E., and Ramos, J. L. (2021). United Nations sustainability development goals approached from the side of the biological production of fuels. Microb. Biotechnol. 14 (14), 1871–1877. doi:10.1111/1751-7915.13912
Gehlhar, M. A. W., and Somwaru, A. (2010). Effects of increased biofuelson the U.S. economy in 2022, Report ERR-102 of the Economic Research Service. Washington, D.C, USA: U.S. Department of Agriculture.
Gerlt, S., and Westhoff, P. (2011). FAPRI-MU stochastic US crop model documentation, FAPRI-MU report #09-11. Washington, D.C, USA: Food and Agricultural Policy Research Institute.
Gov BR (2023b). Painel Dinâmico da Plataforma CBIO. https://www.gov.br/anp/pt-br/centrais-de-conteudo/paineis-dinamicos-da-anp/paineis-dinamicos-do-renovabio/painel-dinamico-da-cbio.
Gurgel, A., Reilly, J., and Paltsev, S. (2007). Potential land use implications of a global biofuels industry. J. Agric. Food Industrial Organ. 5, 9. doi:10.2202/1542-0485.1202
Hertel, T., Tyner, W., and Birur, D. (2010). The global impacts of biofuel mandates. Energy J. 31 (1), 75–100. doi:10.5547/issn0195-6574-ej-vol31-no1-4
Hill, J., Nelson, E., Tilman, D., and Tiffany, D. (2006). Environmental, economic, and energetic costs and benefits of biodiesel and ethanol biofuels. PNAS 103 (30), 11206–11210. doi:10.1073/pnas.0604600103
Hochman, G., and Zilberman, D. (2018). Corn ethanol and U.S. biofuel policy 10 years later: a quantitative assessment. Am. J. Agric. Econ. 100 (2), 570–584. doi:10.1093/ajae/aax105
International Energy Agency (IEA) (2021). Biofuel production by country/region and fuel type, 2016-2022. Paris, France. https://www.iea.org/data-and-statistics/charts/biofuel-production-by-country-region-and-fuel-type-2016-2022.
International Energy Agency (IEA) (2021). Global EV outlook 2021. Paris, France. https://www.iea.org/reports/global-ev-outlook-2021.
International Energy Agency (IEA) (2022). Renewables 2022: transport biofuels. Paris, France. https://www.iea.org/reports/renewables-2022/transport-biofuels.
International Energy Agency (IEA) (2023). Oil market report. Paris, France. https://www.iea.org/reports/oil-market-report-july-2023.
IPCC - Intergovernmental Panel on Climate Change (2023). AR6 synthesis report: climate change 2023. Switzerland: Interlaken.
Ji, X., and Long, X. (2016). A review of the ecological and socioeconomic effects of biofuel and energy policy recommendations. Renew. Sustain. Energy Rev. 61, 41–52. doi:10.1016/j.rser.2016.03.026
Johansson, R., Meyer, S., Whistance, J., Thompson, W., and Debnath, D. (2020). Greenhouse gas emission reduction and cost from the United States biofuels mandate. Renew. Sustain. Energy Rev. 119, 109513. doi:10.1016/j.rser.2019.109513
Keeney, R., and Hertel, T. (2009). The indirect land use impacts of United States biofuel policies: the importance of acreage, yield, and bilateral trade responses. Am. J. Agric. Econ. 81 (4), 895–909. doi:10.1111/j.1467-8276.2009.01308.x
Khanna, M., and Crago, C. L. (2012). Measuring indirect land use change with biofuels: implications for policy. Annu. Rev. Resour. Econ. 4 (1), 161–184. doi:10.1146/annurev-resource-110811-114523
Kocar, G., and Civas, N. (2013). An overview of biofuels from energy crops: current status and future prospects. Renew. Sustain. Energy Rev. 28 (28), 900–916. doi:10.1016/j.rser.2013.08.022
Ministério de Minas e Energia (2023a). Assuntos. https://www.gov.br/anp/pt-br/assuntos.
Nelsona, G., Valin, H., Sands, R., Havlík, P., Ahammad, H., Deryng, D., et al. (2014). Climate change effects on agriculture: economic responses to biophysical shocks. Proc. Natl. Acad. Sci. 111 (9), 3274–3279. doi:10.1073/pnas.1222465110
Nerlove, M. (1956). Estimates of the elasticities of supply of selected agricultural commodities. J. Farm Econ. 38 (2), 496. doi:10.2307/1234389
Office of the Chief Economist (OCE) of the United States Department of Agriculture (2023). World agricultural supply and demand estimates. www.usda.gov/oce/commodity/wasde.
Palandri, C., Giner, C., and Debnath, D. (2019). “Technology, policy, and institutional options,” in Biofuels, bioenergy and food security. Editors D. Debnath, and S. Babu (Cambridge, Massachusetts, United States: Academic Press), 23–41.
Ramos, J. L., and Duque, E. (2019). Twenty-first-century chemical odyssey: fuels versus commodities and cell factories versus chemical plants. Microb. Biotechnol. 12, 200–209. doi:10.1111/1751-7915.13379
Ramos, J. L., Valdivia, M., Garcıa-Lorente, F., and Segura, A. (2016). Benefits and perspectives on the use of biofuels. Microb. Biotechnol. 9 (9), 436–440. doi:10.1111/1751-7915.12356
Searchinger, T., Heimlich, R., Houghton, R. A., Dong, F., Elobeid, A., Fabiosa, J., et al. (2008). Use of US croplands for biofuels increases greenhouse gases through emissions from land-use change. Science 319 (5867), 1238–1240. doi:10.1126/science.1151861
S&P Global (2023). Global economic outlook. https://www.spglobal.com/ratings/en/research-insights/special-reports/global-economic-outlook-q1-2023.
Taheripour, F., Baumes, H., and Tyner, W. E. (2022). Economic impacts of the U.S. Renewable fuel standard: an ex-post evaluation. Front. Energy Res. 10, 749738. doi:10.3389/fenrg.2022.749738
Taheripour, F., and Tyner, W. E. (2013). Biofuels and land use change: applying recent evidence to model estimates. Appl. Sci. 3 (1), 14–38. doi:10.3390/app3010014
Thompson, W., Whistance, J., and Meyer, S. (2011). Effects of US biofuel policies on US and world petroleum product markets with consequences for greenhouse gas emissions. Energy Policy 39, 5509–5518. doi:10.1016/j.enpol.2011.05.011
Tsaoulidis, D. E., Garciadiego-Ortega, , and Angeli, P. (2023). Intensified biodiesel production from waste cooking oil and flow pattern evolution in small-scale reactors. Front. Chem. Eng. 5 (5), 1144009. doi:10.3389/fceng.2023.1144009
United Nations -Sustainable Development Goals (2023). The sustainable development goals report 2023. New York, NY, USA: United Nations. https://www.un.org/sustainabledevelopment/energy/.
United Nations (U.N.) (2015). The 2030 Agenda for sustainable development. New York, NY, USA: United Nations. https://www.un.org/development/desa/jpo/wp-content/uploads/sites/55/2017/02/2030-Agenda-for-Sustainable-Development-KCSD-Primer-new.pdf.
Urbanchuk, J. M. (2022). Contribution of the ethanol industry to the economy of the United States in 2022. Pennsylvania, USA: ABF Economics, Doylestown. https://d35t1syewk4d42.cloudfront.net/file/2428/Ethanol%20Industry%20Contribution%20to%20the%20US%20Economy%20in%202022.pdf.
USDA (2021). Implementation of RenovaBio - Brazil's national biofuels policy. Global agricultural information network. Report Number: BR2021-0008. https://fas.usda.gov/newgainapi/api/%20Report/DownloadReportByFileName?fileName=Implementation%20of%20RenovaBio%20-%20Brazil%27s%20National%20Biofuels%20Policy_Sao%20Paulo%20ATO_Brazil_02-25-2021.
US Department of Energy (2023). United States energy and employment report 2023. https://d35t1syewk4d42.cloudfront.net/file/2553/2023%20USEER%20REPORT.pdf.
Voegele, E. (2013). Annual EU report projects increased ethanol production. URL http://ethanolproducer.com/annual-eureport.
Westhoff, P., Rosenbohm, M., Whistance, J., Binfield, J., Chiuchiarelli, S., Maltsbarger, R., et al. (2023). U.S. agricultural market outlook, FAPRI-MU Report #02-23. Washington, D.C, USA: Food and Agricultural Policy Research Institute. https://fapri.missouri.edu/wp-content/uploads/2023/03/2023-Baseline-Outlook.pdf.
Keywords: agricultural commodity and agricultural product markets, biodiesel, biofuel 10 years outlook, ethanol, feedstocks demand, greenhouse gas emissions, petroleum fuel demand
Citation: Whistance J, Debnath D and Thompson W (2024) A biofuels outlook for the U.S. and Brazil and what it might mean for sustainable development goal 7. Front. Chem. Eng. 5:1290763. doi: 10.3389/fceng.2023.1290763
Received: 08 September 2023; Accepted: 29 December 2023;
Published: 02 February 2024.
Edited by:
Antoni Sánchez, Autonomous University of Barcelona, SpainReviewed by:
Dimitrios Tsaoulidis, University of Surrey, United KingdomFilipa A. Vicente, National Institute of Chemistry, Slovenia
Copyright © 2024 Whistance, Debnath and Thompson. This is an open-access article distributed under the terms of the Creative Commons Attribution License (CC BY). The use, distribution or reproduction in other forums is permitted, provided the original author(s) and the copyright owner(s) are credited and that the original publication in this journal is cited, in accordance with accepted academic practice. No use, distribution or reproduction is permitted which does not comply with these terms.
*Correspondence: Deepayan Debnath, deepayan.debnath@gmail.com