 Francesca O. Alfano*
 Alberto Di Renzo
- Department of Computer Engineering, Modeling, Electronics and Systems Engineering (DIMES), University of Calabria, Rende, Italy
Modelling particulate systems with the Discrete Element Method (DEM) is an established practice, both in the representation and analysis of natural phenomena and in scale-up and optimization of industrial processes. Since the method allows tracking individual particles, each element can possess geometrical, physical, mechanical or chemical surface properties different from those of the other particles. One example is a polydisperse particulate system, i.e., characterized by a size distribution, opposed to the idealized monodisperse case. In conventional DEM, a softer particle stiffness is commonly adopted to reduce the computational time. It might happen that artificially soft particles, when colliding against a wall boundary, exhibit such large, unrealistic overlap that they “pass through” the wall and exit the domain. In the case of highly polydisperse systems, this often occurs when fine particles are pushed against the wall by coarse particles with masses several orders of magnitude larger. In the manuscript, a novel method is proposed, named thick wall, to allow the particles in contact with the walls to experience relatively large overlaps without ending up ejected out the domain. In particular, a careful way to calculate the particle-wall overlap and force unit vector can accommodate normal displacements larger than the maximum usually allowed, i.e., typically the particle radius, thereby preventing particles from being expelled from the domain. First, critical velocities for which single particles and pairs of fine/coarse particle escape the domain are analytically characterized using the linear and the Hertz models. The thick wall concept is then introduced and its effect on the maximum critical velocity is demonstrated with both contact models. Finally, application to pharmaceutical powder composed of carrier (coarse) and active pharmaceutical ingredient (API) (fine) particles in a shaken capsule prove this to be an example of vulnerability to the phenomenon of fine particle ejection and to significantly benefit from the thick wall modification.
1 Introduction
Particulate material processing often involves dealing with some degree of polydispersity, e.g., the particle size inherently follows a distribution, or the process requires particles of different sizes to be mixed for improved efficiency. Despite the importance of powder sampling and preparation, sieving and other classification processes are always imperfect. In binary or multi-solid mixtures small-size particles arise naturally, which may then exhibit segregation and final product inhomogeneity. Also, fines may be generated by abrasion of coarse brittle materials. If the small particles are sufficiently fine, they are subjected to adhesive forces and are often found attached to coarser particles, potentially detaching as a result of collisions with the containing walls or by the shearing action of a fluid stream. Examples include formation of dust during bulk solids handling (Schulz et al., 2022; Schulz et al., 2023), the deaggregation of active pharmaceutical ingredient (API) powder from coarser carrier particles in dry powder inhalation devices (Sharma and Setia, 2019; Chaurasiya and Zhao, 2020; Spahn et al., 2022), the production of active material with a layer of conducting material (e.g., carbon black) during dry mixing in battery electrodes manufacturing (Lischka et al., 2024), the use of solid flow-aids to improve powder flowability or to track powder mixing (Fulchini et al., 2017; Karde et al., 2023; Khala et al., 2023) and the improvement of powder bed homogeneity in additive manufacturing of ceramic materials by using bimodal particle size distribution (Sofia et al., 2018; Schmidt and Peukert, 2022).
The Discrete Element Method (DEM), also in combination with computational fluid dynamics (CFD-DEM), is commonly utilized to model the behavior of granular materials, due to its versatility in dealing with very different flow regimes, packing density and dispersion of particle properties (Golshan et al., 2020; Kieckhefen et al., 2020). DEM has been successfully used to study the segregation of particles differing in size and density in fluidized beds (Di Renzo et al., 2011; Peng et al., 2016), the mixing of electrically charged API and carrier particles for inhalation in a vibrating container (Yang et al., 2015), the mixing of binary particle beds in a rotating drum (Huang and Nakagawa, 2023), the size segregation during powder spreading for additive manufacturing using laser powder bed fusion (Shaheen et al., 2021), the detachment of API from carrier particles in dry powder inhalers (Cui and Sommerfeld, 2015; Tong et al., 2017; Ariane et al., 2018; Alfano et al., 2021a; Alfano et al., 2022a; Alfano et al., 2022b).
Particles trajectories are solved for each solid element, including during interparticle contacts and impacts with walls, by considering the compression and rebounding stages. Indeed, contact forces are generally modelled using the soft-sphere model, which assumes the particles to keep their spherical shape and bases the force computation upon the calculation of the particle overlap. Linear spring-dashpot or Hertzian-type spring with some dissipation mechanisms is adopted in the direction normal to the contact plane, with similar mechanical models plus surface sliding in the tangential direction (Zhu and Yu, 2006; Zhu et al., 2007). In a collision, the material parameters like the normal spring stiffness or (Young’s) modulus of elasticity primarily determine the particle maximum deformation and the contact duration, the latter being responsible also for the maximum integration time-step (Kruggel-Emden et al., 2010). The realistic interparticle or particle-wall contact time is orders of magnitude smaller than the typical characteristic processing times. So, very commonly, softer than realistic stiffness constants are set, even two or more orders of magnitude smaller. Systematic ways to reduce the stiffness have been proposed to minimize its influence on the intended simulated quantities (Hærvig et al., 2017; Washino et al., 2018; Washino et al., 2024; He et al., 2021). For cohesionless particles, the differences in the contact dynamics does not affect, if not marginally, the kinematics (Thornton et al., 2011), so for moderate to granular flows with little inertial effects the evolution of the particles trajectories is unaffected (see e.g., in Kuo et al., 2002; Grima and Wypych, 2011). For cohesive particles, special treatments have been proposed, such as in (Washino et al., 2018; Washino et al., 2024). On the other hand, the larger integration time-step and reduced simulation time greatly benefit the feasibility of the intended DEM study. In addition to particle stiffness, the number of particles is another parameter significantly affecting the computational time required in DEM simulations. Depending on the algorithm used, the computational time may have a quadratic (worst case) or quasi-linear (best-case) dependence on the number of particles. Strongly polydisperse systems are often characterized by a high number of fine particles, thus significantly impacting computation times.
Given the particle properties, a reduced material stiffness can be computed that allows for the quickest simulations of the particle flow without incurring in excessive particle overlap. The maximum overlap depends on the impact velocity, so conditions may arise leading to localized high overlaps. In monodisperse particle systems, the critical velocity leading to overlaps comparable to the particle radius are very rarely encountered. However, simulations of polydisperse systems are much more vulnerable in this regard. It will be shown in the following subsections that in the case of particle of significantly different sizes, the expected interparticle or particle-wall overlap becomes overly exaggerated at much lower impact velocities, up to the point that particles can cross the wall boundaries and leave the geometric domain. An obvious solution would be to use a larger value of the material stiffness, so that the maximum overlap decreases to acceptable values. The required increase can be rather significant, with the consequence that the contact duration decreases correspondingly, and the required smaller time-step leads to much higher simulation times.
The objective of this work is to characterize the conditions of size difference, material properties and operating conditions leading to the above-referenced unrealistic overlap and to propose and test a robust calculation method to overcome such limits, without sacrificing the advantageous increased time-step. The first part, characterization of the conditions for unrealistic overlaps, will help understand and predict what particulate systems (e.g., highly polydisperse, or cohesive fine-on-coarse particle systems) may exhibit vulnerability to the phenomenon. So, the conditions leading to the unfavorable phenomenon are discussed and characterized first analytically for mono- and poly-disperse systems, in terms of critical impact velocity (the maximum velocity before particle crossing the wall occurs) as a function of size difference and material properties. Then, a modified and more robust calculation of the overlap is proposed, which aims to prevent particles from crossing the boundaries even when high overlaps are expected, yet without requiring changes in the integration time-step. Such a solution would prevent the onset of fine particles ejection out of the system, at essentially no additional computational cost. Expected limitations of the solution are discussed. Finally, an application of the DEM-CFD model to the flow of a fine-coarse pharmaceutical mixture in a capsule is presented and discussed, comparing the results of the conventional method with those of the proposed method.
2 DEM model of contacts with walls
We start by recalling the basic elements of the contact model in DEM simulations. The collision of two perfectly spherical particles and of one particle with a flat wall are considered for simplicity, although the subsequent treatment is amenable to other particle or wall shapes without significant changes. Also, for the sake of simplicity, only normal elastic contact will be considered in the mathematical derivation. This will include both linear spring and Hertzian contact models. For an analytical treatment of the elastic-dissipative contacts the interested reader is referred to Antypov and Elliott (2011).
In soft-sphere DEM simulations, the particles are modelled in their motion as rigid (i.e., non-deformable) spheres and walls as rigid flat surfaces. When the distance of the particle center from the wall is less than the particle radius, a contact is identified. The spherical shape is also used to compute the particle deformation during the collision, measuring it as the particle to surface or inter-particle overlap (Figure 1). According to the displacement-driven formulation, at each time instant, the elastic repulsive force is computed from the overlap, by means of geometrical and stiffness material parameters, followed by integration of Newton’s second law of dynamics for the new velocity and new position, ready for the next time integration. Such scheme allows tracking the instantaneous particle positions, deformation (overlap), velocity and forces during the collisions.
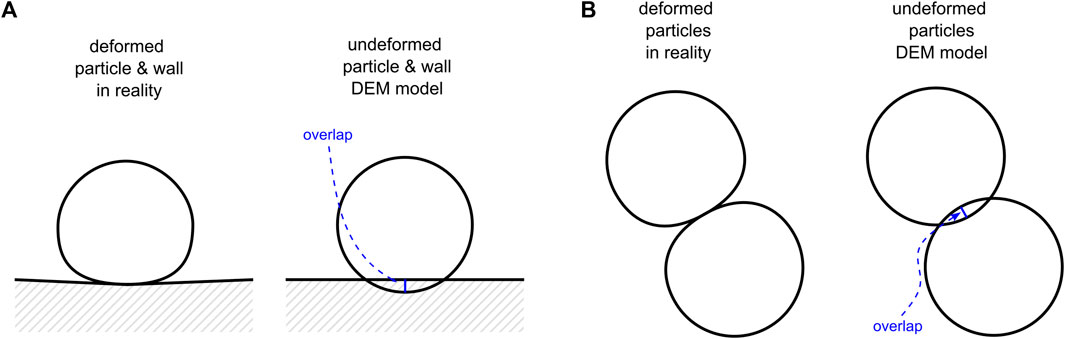
FIGURE 1. Particle in contact with a wall (A) or with another particle (B); comparison between actually deformed contacting shapes and DEM-modelled undeformed representation, showing the overlap concept.
As anticipated, we are concerned with the possibility that particles undergo excessive overlaps, with the somewhat unexpected result that they may definitely cross the wall boundaries. As will be shown for the particles with different sizes, this phenomenon has severe consequences, much more often in the case of particle-wall collisions (Figure 2) than in particle-particle collisions. There are two reasons for that: 1) the inter-particle contact overlap must reach the sum of the two radii (
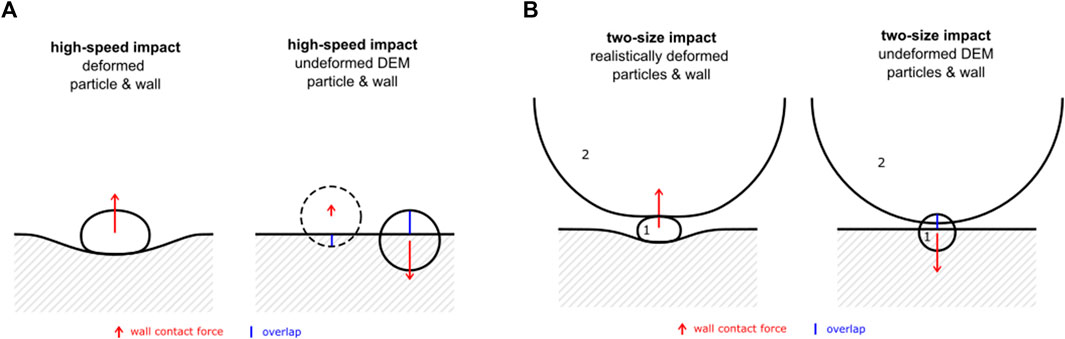
FIGURE 2. Collisions giving rise to very high modelled overlap, showing the wall contact force with a red arrow and the overlap with a blue line. (A) high-speed impact of a single particle against a wall shown with actual deformation (left) and undeformed DEM model (right); (B) wall impact of two particles with the coarse one (2) strongly pushing, through its inertia, the fine one (1) towards the wall. Under certain high-loading conditions (as depicted for the undeformed two spheres), the calculated overlap “reverses” (see accompanying text) and the wall force is directed towards the wall rather than against it. Deformations are exaggerated for illustration purposes.
In a typical implementation with the linear spring model, the elastic force is expressed by
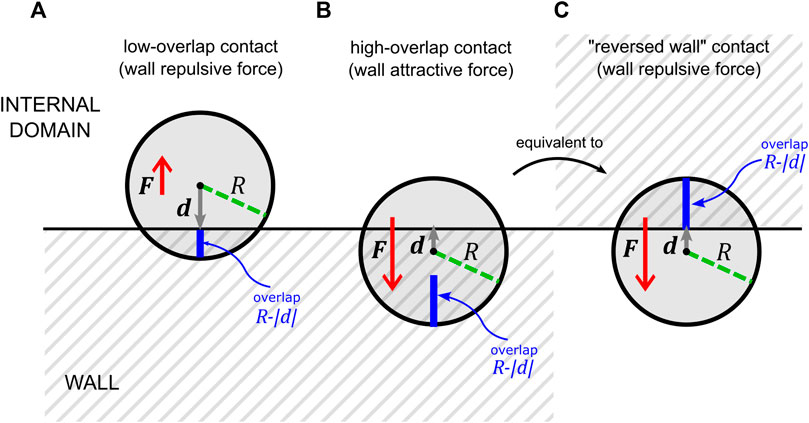
FIGURE 3. Schematic representation of the variables involved in the calculation of the wall normal force (see accompanying text for the variables’ definition and role in the contact model formulas). (A) Common low overlap conditions; (B) very high deformation case, with wrong calculation of the overlap and unit vector; (C) reversed wall contact conditions equivalent to scheme (B).
For the purpose of this study, contact conditions can be distinguished in two cases: common, low-overlap contacts, in which the deformation is relatively low; the distance vector points toward the wall, the overlap represents the actual total deformation, and the resulting force is wall repulsive (Figure 3A); very high deformation case, in which the particle center overcomes the wall surface; the overlap does not represent the total deformation and the distance vector points towards the internal domain, with the consequence that the force is wall attractive (Figure 3B). The second case is equivalent to a reversed wall contact (Figure 3C): the unit vector changes direction, and so does the force, and the overlap corresponds to the deformation of a wall on the other side of the domain; since the process diverges the particle will end up ejected.
Therefore, the focus of what follows will be on particle-wall contacts and the relevant critical conditions. Conditions leading to the critical point where the undeformed overlap reaches the particle radius are analytically derived for the case of a single particle impacting a flat wall and for a coarse/fine two-particle system impacting a flat wall (Figure 2). Both cases are investigated assuming a linear spring model and the Hertzian contact theory.
2.1 Single particle contact: linear spring model
Key results for the current analysis are the evolution of the particle overlap and the collision duration, which will be discussed below for the different cases. As anticipated, the focus will be on the purely elastic force in the wall normal direction, neglecting the effects of other contact forces (e.g., plastic or viscoelastic components). Gravity force is neglected as well, since it is several orders of magnitude smaller than contact forces for the particle sizes considered in this study.
Assuming that a particle approaches the wall with an initial velocity
in which
and the collision duration is
Before proceeding further, it is useful to adopt a dimensionless formulation, so that general relationships will be more easily identified. The following variable changes are set:
The ODE can be re-expressed in the following terms:
and the initial conditions are
A characteristic dimensionless number can be defined, which is named here “impact number”
The dimensionless solution of Eq. 5 is
and
2.1.1 Linear model—critical impact conditions
The critical condition for our analysis is attained when the overlap reaches the particle radius, i.e., the critical, maximum overlap allowed before particle crossing the wall occurs, using the conventional calculation method described above. At that stage, the normal vector pointing from the particle center to the wall closest point reverses direction, and the overlap starts becoming computed in the opposite direction (Figure 3). As a result of this change, the repulsive force becomes directed in the opposite direction and the particle is accelerated towards the other side of the wall, i.e., it gets ejected out of the domain. It is noteworthy that no reduction in the time-step or change in the integration algorithm can solve this specific issue, as it is inherent in the approximation of undeformed bodies (spherical particles and flat walls), and unrelated to numerical accuracy of the integration scheme. Only using stiffer materials can mitigate the occurrence of particle ejection, but it comes at the cost of longer simulation times.
Analytically, this critical condition is easy to determine, by simply setting
The critical impact velocity
where the subscript
Given the particle and wall properties, Eq. 9 allows determining the maximum impact velocity that a wall can withstand without letting the particle trespass it. Note that the purely elastic collision is the most extreme case since there is the minimum critical normal impact velocity and the maximum overlap. By introducing the contributions of dissipative forces, the maximum overlap decreases and the critical velocity increases.
Values for the critical impact velocity are shown in Figure 4 as a function of different combinations of typical values of the relevant properties (radius, density, stiffness). A higher rigidity, with a larger stiffness constant value, leads to a higher critical velocity, with a slope 0.5 on the log-log plot (Figures 4A,B). The values for a light small particle, for example,
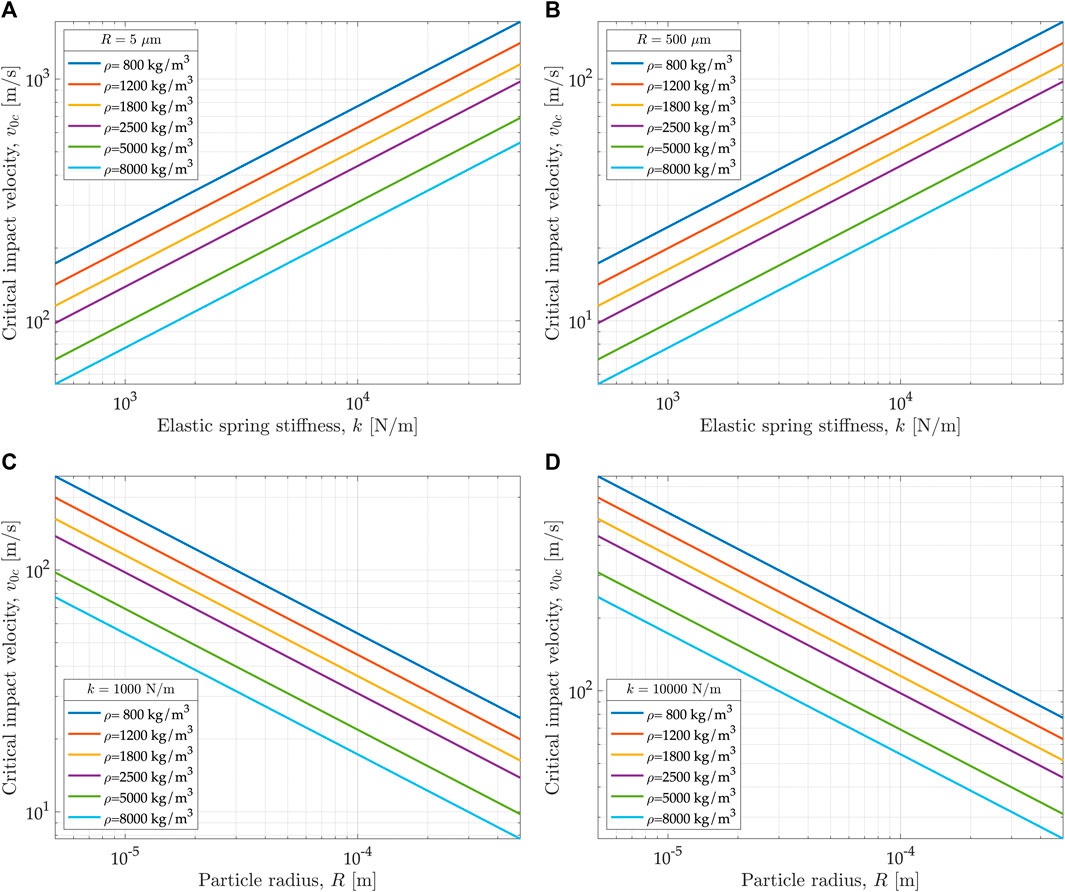
FIGURE 4. Critical velocity as a function of the elastic spring stiffness and particle density for radius
It is interesting to derive the relations for the critical impact velocity if the elastic stiffness is related to the real material properties, like the Young’s modulus of elasticity
This can be substituted into Eq. 9 to give the following variant of the critical impact velocity expression
The interesting result is that the critical velocity becomes independent of the particle radius and changes only with the material modulus of elasticity and the particle density. As a curiosity, it is worth noting that
2.2 Single particle contact: Hertz model
The full consideration of mechanical normal stress-strain relation during a contact of homogeneous sphere with a flat wall was derived by Hertz and later extended to contacts between particles of different sizes and properties (Johnson, 1987). The well-known macroscopic elastic force-displacement relationship is
The corresponding ODE governing the transient motion becomes non-linear
and cannot be easily solved analytically even for the purely elastic case. A few results are available (see e.g., Maw et al., 1976), such as the collision duration and the maximum displacement, which are sufficient for our purpose. In particular, the maximum displacement is
By expressing the particle mass as function of the density and size, the maximum dimensionless overlap is easily obtained as
Interestingly, inside the parenthesis in Eq. 15, the square of the impact velocity
2.2.1 Hertz model—critical impact conditions
Following the results of the Hertz theory of elastic contact applied to a collision, the critical condition, i.e.,
where the subscript
It is worth noting that the critical velocity is independent of the particle radius, but changes only with the material density and Young’s modulus.
Figure 5 shows the plots of the critical velocity according to the Hertz theory as a function of typical values of the Young’s modulus for a range of density values. Values above 200 m/s are easily obtained provided that the Young’s modulus is higher than 1 GPa, as typical of many solid materials. For stiffer systems, like steel (
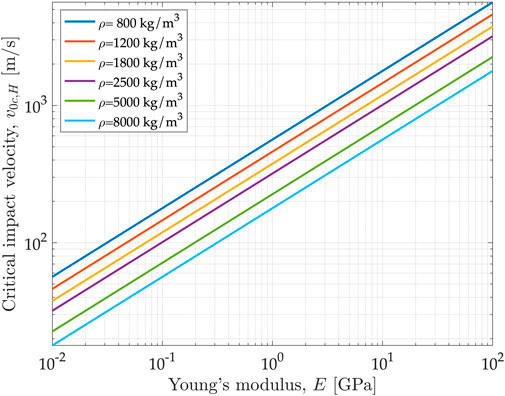
FIGURE 5. Critical velocity according to the Hertz contact model as a function of the Young’s modulus of elasticity and particle density.
Also, it turns out slightly different from the value obtained with the linear model, even when the linear spring stiffness was related to the Young’s modulus (Eq. 10). In particular, the ratio of the critical velocities obtained with the two models is
3 DEM model of fine-coarse particle collision
In Section 2, the critical velocity leading to the particle center passing through the wall was calculated using the linear and the Hertz model. It is observed that the resulting velocities are generally high. In the present Section, cases in which relatively fine particles are pushed towards the wall by relatively coarser particles and the corresponding critical velocities are investigated. Like above, the analysis will be conducted separately using the linear model and the Hertz theory. The reference configuration is as depicted in Figure 2B, in which the particle close to the wall is denoted by 1 and the other one pushing it is denoted by 2.
3.1 Fine-coarse contact: linear spring model
For simplicity, it will be assumed that the two particles 1 (fine) and 2 (coarse) move integral with one another, as if they are kept together by a strong adhesive force. The analysis will be substantially valid also for the case in which the particle 1 moves parallel to the wall (e.g., rolling on it) and the particle 2 hits it perpendicularly, pushing it against the wall. The two particles will be assumed to have the same density, as the generalization to the case of different densities is trivial.
Under these assumptions, the inertia of both particles is to be repulsed by the containing walls, while the maximum allowed penetration equals the radius of particle 1, if such particle is to remain inside the boundary. The equation governing the motion of the colliding body is the same as in Section 2.1, but with different parameters. The oscillation pulsation becomes
The collision duration is
The dimensionless impact number is
and, as before, the solution for the highest value of the dimensionless displacement is
3.1.1 Linear model—critical impact conditions
The critical condition for a fine-coarse contact is achieved when the highest overlap reaches the radius of particle 1, i.e., when the dimensionless overlap is
yielding
in which the particle size ratio
It is interesting to compare the critical velocity value for the fine-coarse contact with that of a single particle contact, as their ratio depends only on the particle size ratio
Figure 6 shows the plot of the critical velocity ratio of the fine-coarse contact over single particle contact as a function of the particle size ratio
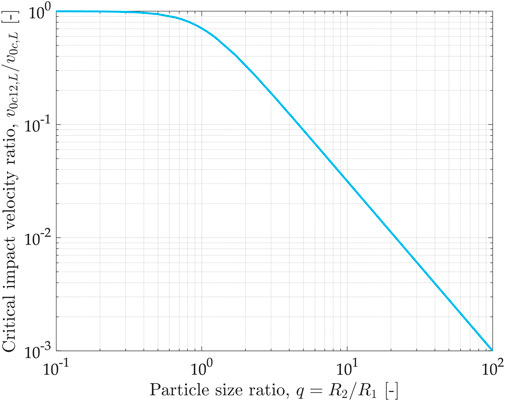
FIGURE 6. Critical impact velocity ratio (fine-coarse case over single particle contact), calculated according to the linear contact model as a function of the particle size ratio.
In some of the applications discussed in Section 1, the particle size ratio can reach up to 50, which corresponds to a decrease of the critical velocity to less than 0.3% of the single particle critical value, or even more.
Similar to the case for a single particle, let us use the definition of the contact stiffness in terms of the Young’s modulus (Eq. 10). The corresponding variant of the critical impact velocity is
which yields the same decrease of the critical velocity ratio as that plotted in Figure 6. As noted earlier, the result in terms of the mechanical parameter
3.2 Fine-coarse contact: Hertz model
The same approach used in the linear model is adopted here, by substituting the mass of the single particle with the total mass,
The analytical expression of the maximum overlap is
The dimensionless form of such overlap can be expresses as
3.2.1 Hertz model: critical impact conditions
The critical velocity at which the overlap reaches the radius of the particle contacting the wall (1) as a function of the relevant variables is obtained by setting
By comparing the obtained value with that of a single particle, one obtains
exactly like in the linear model case. This indicates that a decrease in the critical velocity by one or two orders of magnitude for size ratio
4 A thick wall concept for particle-wall contacts
Under the conditions discussing above for the fine-coarse contact, the probability for the finer particles to be pushed out of the domain by the coarse particles is rather high, even in flows at moderate velocities. This evidently leads to reconsider the importance of a robust treatment of the wall contacts, if the objective is to avoid the risk of having fine particles ejected by coarse particles.
4.1 Robust solution of the normal contact
A simple modification of the overlap calculation is proposed, by conceptually adding a sort of solid “thickness” to the wall. In Section 2, we briefly discussed the conventional implementation of the particle-wall normal contact force. The key steps are the expression of the wall force exerted on the particle as a function of the overlap and the unit vector and the calculation of these last two variables. They are discussed here in relation to Figure 7 where a high-deformation contact is schematically shown with the variables involved in the conventional calculation of the force (Figure 7A) and in the calculation proposed according to the thick wall concept (Figure 7B).
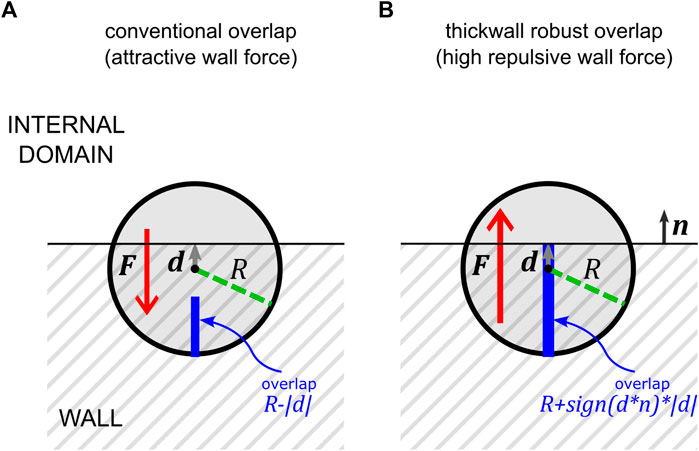
FIGURE 7. Schematic representation of the high deformation particle-wall contact with the particle center beyond the wall boundary. (A) Conventional calculation of the overlap and the unit vector—see Eqs. 28, 29—for the contact force, which leads to a force directed towards the wall (the particle will be pushed out of the internal domain, across the wall); (B) robust calculation of the overlap and the unit vector according to the thick wall concept; the particle experiences a high overlap, corresponding to the very high deformation and the force direction is correctly pointing towards the internal domain (the particle will eventually rebound inside the domain).
The wall normal force is expressed by
The (scalar) overlap and the unit vector for the direction are computed, respectively, by
in which
As introduced in Section 2.1, when the particle center (with its undeformed spherical shape) goes beyond the wall surface, the distance vector
In which the sign function outputs +1 or −1 depending on the sign of the scalar product between the distance vector and the surface normal vector
The above simple modification allows a far more robust consideration of the particle wall contact under extreme deformation cases. The particles can go with their center beyond the wall surface or even completely beyond it, without causing unexpected consequences. The increased overlap will determine a higher repulsive force, eventually safeguarding the presence of the particle inside the domain.
The robust calculation of the overlap discussed above shows no particular limit, e.g., a maximum deformation. The details in the implementation of DEM computational models can introduce limitations associated with the wall contact detection algorithm. Indeed, all codes implement some sort of distance cut-off to detect contacts, which means that if the particle is pressed against the wall so that its center is too far (inside) from the surface, then the contact with the wall will no longer be identified and considered active. This is expected to be a very extreme case, unlikely even for coarse particles pushing fine ones with significant particle size difference.
4.2 Critical velocity corresponding to higher maximum overlap
A simple way to investigate how the critical velocity changes in an expanded overlap range is to adapt the previous calculation by expressing it as a function of the maximum dimensionless overlap.
Using the linear model, the more general definition of the critical velocity becomes
yielding a linear dependence on the value of
With the Hertz theory approach, the two results are slightly different, i.e.,
and
yielding a superlinear dependence of the critical velocity on the maximum dimensionless overlap.
As one example, with a maximum dimensionless overlap
The advantage of the proposed formulation is that the higher possible impact velocity is achieved without the need to use stiffer solids, which would cause the necessary integration time step to decrease and the total computational burden for the same simulation time to increase correspondingly.
4.3 Discussion of known limitations
At the end of Section 4.1 potential causes for overlap limits have been identified, mainly associated with the contact detection algorithm. Here, other limitations associated with geometrical considerations are briefly discussed.
The proposed solution is expected to work for truly thick walls. If thin walls are considered, the approach may introduce artificial and possibly unwanted thickness. It is the case of walls separating two regions of the system both populated with particles (Figure 8A). For example, the vortex finder in cyclones separates an internal region for the gas outflow and an annular region where the gas-solid mixture enters tangentially, so special care must be exercised.
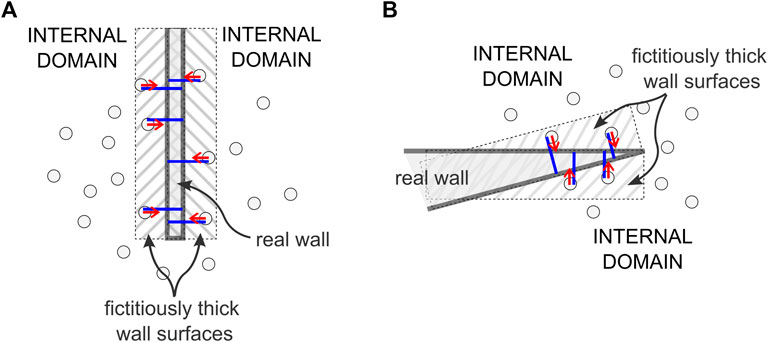
FIGURE 8. Problematic cases for application of the thick wall concept when actual solid walls are thin. Forces shown as red arrows and overlap as blue segments. (A) Thin laminar wall separating two regions populated with particles, for which the wall thickness generates fictitious wall effects outside the actual thickness of the wall. (B) Sharp wedge-shaped wall, in which fictitious wall regions appear that exert action on the surrounding particles.
Other similar problematic cases include walls with wedges, pointed tips or other types of very sharp edges, where the thickness may act as corner smoothing or generate artifacts, possibly changing the particle behavior in the close proximity of these regions (see Figure 8B). The extent of the issue depends directly on the “depth” of the thick wall, i.e., on the maximum overlap allowed for particles going beyond the wall surfaces. In both cases shown in Figure 8, the forces shown, represented by red arrows, show that the particles are attracted to the closest wall surface (actually being repelled by the wall surface on the opposite side). So, because of the combined action of the two thick boundaries inside the real wall, the particles will likely end up trapped inside the wall at an equilibrium surface halfway between the two wall surfaces.
Another limitation is associated with the validity of the mechanical relations under such large overlaps. Hertz theory for the contact of an elastic sphere with a flat wall is valid in the limit of small deformations, a condition that evidently cannot be enforced here, where deformations are very significant. Unfortunately, it is far from easy to estimate the error introduced by extrapolating outside the original validity of the theory. On the other hand, considering the other assumptions commonly accepted in DEM simulations, such as perfect sphericity of the particles, highly softened elastic moduli, ideally smooth surfaces, homogeneous materials and so on, we speculate that in general the proposed thick wall concept remains within the same limits of acceptability, without further deteriorating the overall level of approximation.
5 DEM application to pharmaceutical particle motion in capsule
To demonstrate the usefulness of the thick wall concept, we show an application in transient modelling of the motion of carrier and active pharmaceutical ingredient (API) particles of pharmaceutical interest in an inhaler capsule during a simulated inhalation cycle. The computational model and simulation conditions details are available in (Alfano et al., 2022c; Alfano et al., 2023) and a brief summary is reported below.
5.1 Computational model and tool
As anticipated earlier, the Discrete Element Method (DEM) is used to simulate the particle-particle-structure system inside a rotating and vibrating capsule, representing the characteristic evolution during an inhalation process. Each particle is tracked by solving Newton’s equations of motion for the translational and rotational components:
in which
where
In the contact forces, the Hertzian elastic component is complemented by an adhesion/cohesion model, named the Johnson-Kendall-Roberts (JKR) model (Johnson et al., 1971), including attractive forces for negative overlap. The model equations read:
where
In addition to the elastic and cohesive forces, a viscous/damping force contribution is considered to account for a constant coefficient of restitution. The total normal contact force is the sum of the JKR contribution and the viscous damping term:
where
As for the fictitious forces generated by the moving (i.e., non-inertial) frame of reference, two features have been implemented: 1), the gravity vector was made to rotate according to the angular velocity assumed for the capsule and 2) formulations for three force contributions, named the centrifugal force, Euler force (related to angular acceleration), and Coriolis force. The reader is referred to our previous work (Alfano et al., 2022c) for the details of the corresponding expressions.
The DEM implementation available in the MFiX code, version 18.1.5 (Garg et al., 2012), as modified by our group as detailed in Alfano et al. (2021b); Alfano et al. (2022c); Alfano et al. (2023), is adopted. The original open-source MFiX-DEM code has been extended to include the CDT rolling friction model, the JKR elastic-cohesive model including attractive forces also for negative overlaps upon detachment, all the fictitious forces discussed above and the implementation of the proposed thick wall concept, by means of Eqs. 30, 31.
5.2 Simulated capsule motion
Two DEM simulations were conducted, with and without the thick wall effect (wit critical overlap set to
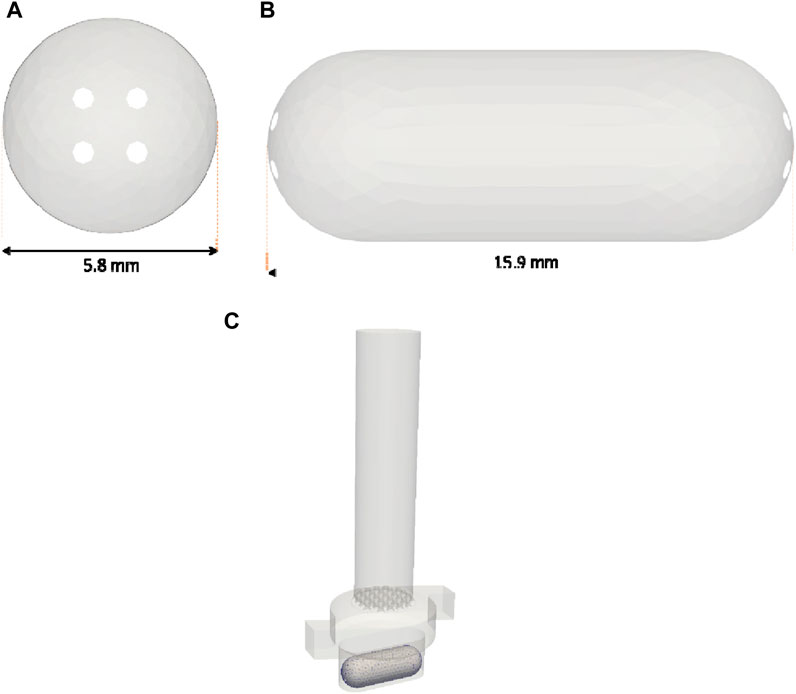
FIGURE 9. Side (A) and front (B) views of the capsule, along with its dimensions. The initial position inside the inhaler is shown in (C).
Within the capsule, 1 mg of a typical DPI formulation is present, composed by the carrier-API pair lactose-salbutamol. The powder configuration is illustrated in Figure 10. Salbutamol API particles adhere to a much larger carrier particle (lactose) to enhance the flowability properties of the formulation. The weight fraction of the active ingredient is approximately 1%. The active ingredient has a diameter of
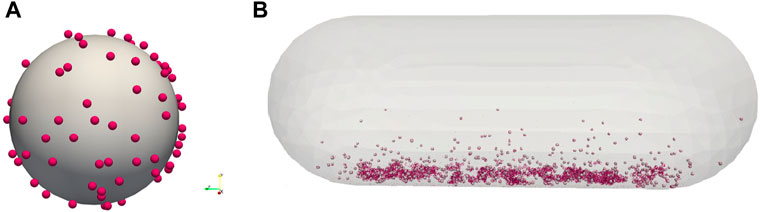
FIGURE 10. API-carrier configuration. (A) single coated carrier particle; (B) all particles inside the capsule. Total mass: 1 mg; API is about 1% (w/w).
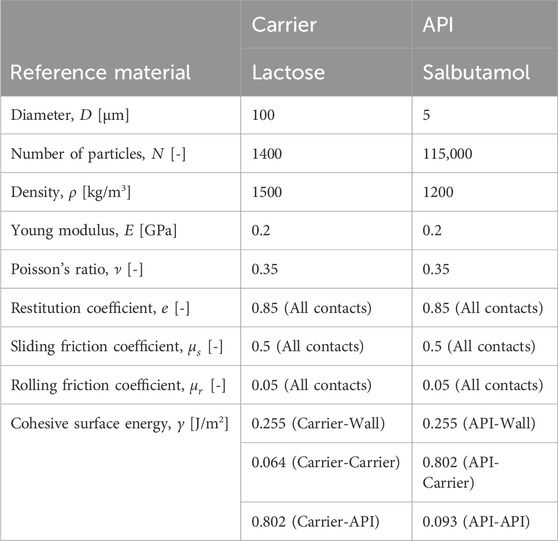
TABLE 1. DEM simulation parameters.
Without the implementation of special treatments for the wall contacts, at various points during the simulation, some API particles end up ejected from the capsule walls. This is shown in a snapshot in Figure 11A, which provides a close-up of a moment when the phenomenon occurs for the first time (at about 0.1 ms). Fine violet particles are clearly visible below, outside the capsule. A deeper investigation of the local dynamics reveals that the responsibility is to be attributed to the mechanism shown in Figure 2B, for which a carrier particle either hits an API particle already touching the wall or it is the same carrier particle with sticking API fine particles that pushes some of them actually through the walls and out of the capsule. The process of particle ejection from the bottom part of the capsule is significant in the very first few instants. Then, it goes on at a smaller rate throughout the entire simulation time.
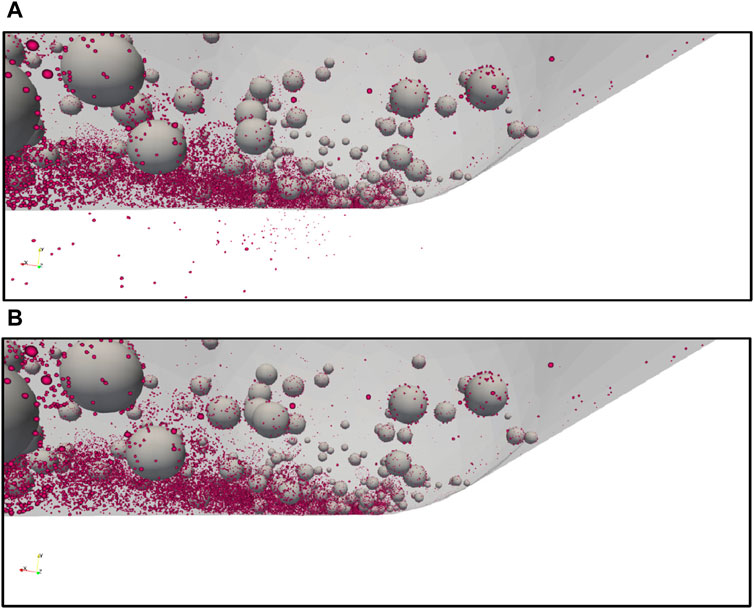
FIGURE 11. Close up of an instant in time (about 0.1 ms) when fine API particles (violet) get compressed between coarse carrier particles (grey) and the capsule walls. (A) Simulation without thick wall, (B) simulation with thick wall (the critical overlap is approximately 2 times the fine particle diameter).
In Figure 11B, the particle configuration is shown for the simulation with the thick wall, at the same moment in time and with the exact same angle. It can be observed that in this case, despite still having the identical simulation setup, particle configuration and integration time-step, the API particles do not exit the capsule geometry.
An analysis of the number of particles ejected outside the capsule over time is reported for both simulations in Figure 12. Despite its simplicity, it can be observed that the use of thick wall proves very effective in significantly restricting the phenomenon, with only 4 particles found outside the geometry, compared to more than 150 particles in the simulation without thick wall in such a short simulation time.
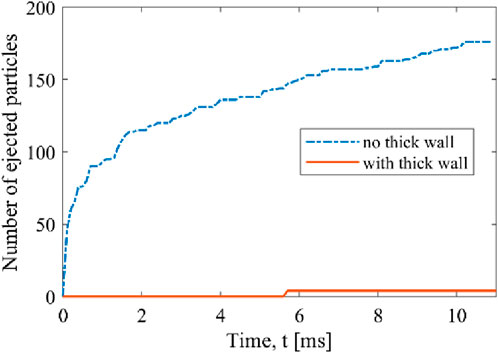
FIGURE 12. Number of ejected particles during the simulation in the absence or presence of the thick wall implementation.
It is useful to investigate the causes and compare with the critical velocity values for the contact model used (Hertz). The critical velocities
In scenarios where the carrier compresses the API particle, with a size ratio of 20, a dramatic decrease is observed, as the critical velocity
Recalculations are done under thick wall conditions. For the API particle, the critical velocity increases to 15.5 m/s and for the carrier particle to 13.9 m/s. In the fine-coarse case, the critical velocity for API ejection becomes
The simulation was conducted using the JKR model, which is derived from the Hertz model regarding the elastic contribution. In comparison with the linear model, values of the elastic constants can be estimated by imposing equality between the critical velocities obtained analytically (Eq. 22; Eq. 25), resulting in
Figure 13 shows the velocity magnitude distribution for carrier and API particles at the end of the simulation. It is observed that the majority of particles, both API and carrier, exhibit velocities lower than 1 m/s. However, the maximum velocity recorded for an API particle at this moment in time is 5.8 m/s (not shown), a value close to the critical velocity. The maximum velocity for a carrier particle is about 1.7 m/s. The data presented thus suggest that the escape of API particles is more likely due to compression between the carrier and the wall, although the possibility that some of the API particles are expelled due to having velocities greater than the critical velocity cannot be excluded. What can be concluded from the number of escaped particles is that the use of thick wall implementation almost completely eliminates the problem of particle ejection, by simply leading to an increase of the maximum critical velocity, without affecting the integration time-step and the corresponding required simulation time.
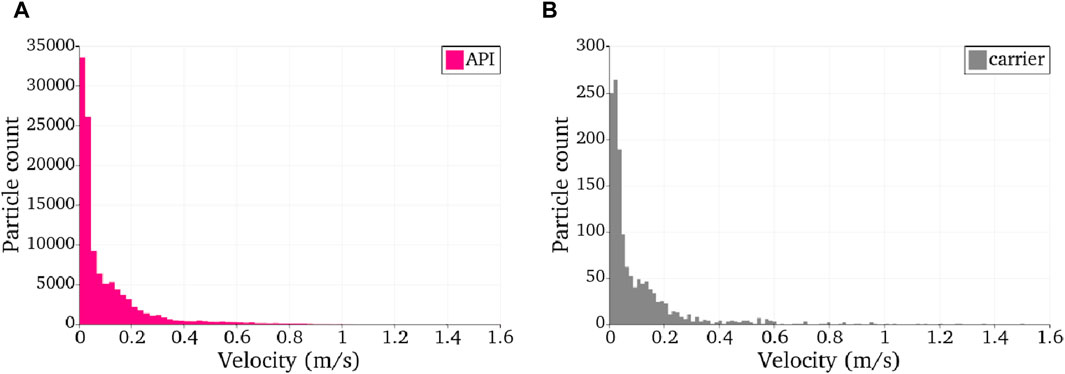
FIGURE 13. Velocity magnitude distribution for (A) API and (B) carrier particle at the end of the simulation (approx. 10 ms).
6 Conclusion
The problem of fine particles possibly subjected to ejection out of the domain in DEM simulation of highly polydisperse systems is addressed. Critical velocities leading to particle passing through walls are characterized analytically, showing the role played by the most relevant geometrical, physical and mechanical parameters, using both the linear model (with the spring stiffness) and the Hertz theory (with the Young’s modulus). Conditions are identified for which coarse particles can push the fine ones out of the domain as a result of excessive overlaps. This is not due to time-step limitations or approximated numerical algorithms, but solely to the difference in the colliding masses and ultimately to their size difference. A possible worsening factor is the—rather frequent—use of softer than real stiffnesses. A simple modification to the implementation of the contact overlap and force unit vector is proposed, conceptually named thick wall, according to which contacts with larger overlap are allowed, like up to the particle diameter, or even more, without sacrificing the integration time-step. Pharmaceutical powders for inhalation formulations are often composed by a coarse carrier coated by fine API particles. The shaking motion of a capsule for Dry Powder Inhalers is simulated by DEM. It is shown that the ejection issue is rather frequently encountered and fine particles continuously leave the capsule domain during shaking. By implementing the thick wall modification (maximum overlap twice the fine particle diameter), the problem nearly completely vanishes. It is noteworthy that the simulation time is totally unaffected by the change.
Limitations of the thick wall concept associated with the excessive overlap and cases in which thin or sharp wall shapes may lead to geometrical and physical artifacts are also discussed. Such limitations are inherent in the concept and cannot be easily overcome. Current basic DEM assumptions like calculations based on undeformed shapes naturally lead to sacrificing accuracy under all conditions. In the future, detailed consideration of deformable, non-spherical bodies interacting with deformable walls may lead to more physically based evaluation of the contact forces. However, the far larger additional cost of computing local deformations and stresses may be justified only with very high accuracy specifications. With the current computational power, this is only likely in systems with few, quasi-static particles. Similarly, additional elements of the contact could be introduced in future studies to increase the realism of the model, such as irregular particle shapes, dissipative phenomena occurring at high deformations and even particle breakage models.
Data availability statement
The raw data supporting the conclusion of this article will be made available by the authors, without undue reservation.
Author contributions
FA: Data curation, Formal Analysis, Investigation, Methodology, Software, Visualization, Writing–original draft, Writing–review and editing. GI: Data curation, Formal Analysis, Investigation, Methodology, Software, Writing–original draft, Writing–review and editing. FD: Conceptualization, Funding acquisition, Resources, Supervision, Writing–original draft, Writing–review and editing, Methodology, Software. AD: Conceptualization, Funding acquisition, Resources, Supervision, Writing–original draft, Writing–review and editing.
Funding
The author(s) declare that financial support was received for the research, authorship, and/or publication of this article. This work has benefitted from the support of the following projects, which are gratefully acknowledged: ICSC National Research Centre for High Performance Computing, Big Data and Quantum Computing, funded by European Union—Next Generation EU (grant number CN00000013, CUP: H23C22000360005), through Piano Nazionale di Ripresa e Resilienza, M4C2, Investimento 1.4 and PRIN PNRR “TRIBOTWIN” project (CUP: H53D23008560001) funded by European Union—Next Generation EU, component M4C2, investimento 1.1.
Conflict of interest
The authors declare that the research was conducted in the absence of any commercial or financial relationships that could be construed as a potential conflict of interest.
The author(s) declared that they were an editorial board member of Frontiers, at the time of submission. This had no impact on the peer review process and the final decision.
Publisher’s note
All claims expressed in this article are solely those of the authors and do not necessarily represent those of their affiliated organizations, or those of the publisher, the editors and the reviewers. Any product that may be evaluated in this article, or claim that may be made by its manufacturer, is not guaranteed or endorsed by the publisher.
References
Ai, J., Chen, J. F., Rotter, J. M., and Ooi, J. Y. (2011). Assessment of rolling resistance models in discrete element simulations. Powder Technol. 206, 269–282. doi:10.1016/j.powtec.2010.09.030
Alfano, F. O., Benassi, A., Gaspari, R., Di Renzo, A., and Di Maio, F. P. (2021a). Full-scale DEM simulation of coupled fluid and dry-coated particle flow in swirl-based dry powder inhalers. Ind. Eng. Chem. Res. 60, 15310–15326. doi:10.1021/acs.iecr.1c02864
Alfano, F. O., Di Maio, F. P., and Di Renzo, A. (2022a). Deagglomeration of selected high-load API-carrier particles in swirl-based dry powder inhalers. Powder Technol. 408, 117800. doi:10.1016/J.POWTEC.2022.117800
Alfano, F. O., Di Renzo, A., and Di Maio, F. P. (2023). Discrete element method evaluation of triboelectric charging due to powder handling in the capsule of a DPI. Pharmaceutics 15, 1762. doi:10.3390/pharmaceutics15061762
Alfano, F. O., Di Renzo, A., Di Maio, F. P., and Ghadiri, M. (2021b). Computational analysis of triboelectrification due to aerodynamic powder dispersion. Powder Technol. 382, 491–504. doi:10.1016/J.POWTEC.2021.01.011
Alfano, F. O., Di Renzo, A., Gaspari, R., Benassi, A., and Di Maio, F. P. (2022b). Modelling deaggregation due to normal carrier–wall collision in dry powder inhalers. Processes 10, 1661. doi:10.3390/pr10081661
Alfano, F. O., Sommerfeld, M., Di Maio, F. P., and Di Renzo, A. (2022c). DEM analysis of powder deaggregation and discharge from the capsule of a carrier-based Dry Powder Inhaler. Adv. Powder Technol. 33, 103853. doi:10.1016/j.apt.2022.103853
Antypov, D., and Elliott, J. A. (2011). On an analytical solution for the damped Hertzian spring. EPL Europhys. Lett. 94, 50004. doi:10.1209/0295-5075/94/50004
Ariane, M., Sommerfeld, M., and Alexiadis, A. (2018). Wall collision and drug-carrier detachment in dry powder inhalers: using DEM to devise a sub-scale model for CFD calculations. Powder Technol. 334, 65–75. doi:10.1016/j.powtec.2018.04.051
Chaurasiya, B., and Zhao, Y.-Y. (2020). Dry powder for pulmonary delivery: a comprehensive review. Pharmaceutics 13, 31. doi:10.3390/pharmaceutics13010031
Cui, Y., and Sommerfeld, M. (2015). Forces on micron-sized particles randomly distributed on the surface of larger particles and possibility of detachment. Int. J. Multiph. Flow 72, 39–52. doi:10.1016/J.IJMULTIPHASEFLOW.2015.01.006
Di Maio, F. P., and Di Renzo, A. (2004). Analytical solution for the problem of frictional-elastic collisions of spherical particles using the linear model. Chem. Eng. Sci. 59, 3461–3475. doi:10.1016/j.ces.2004.05.014
Di Renzo, A., Cello, F., and Di Maio, F. P. (2011). Simulation of the layer inversion phenomenon in binary liquid--fluidized beds by DEM–CFD with a drag law for polydisperse systems. Chem. Eng. Sci. 66, 2945–2958. doi:10.1016/J.CES.2011.03.035
Di Renzo, A., and Di Maio, F. P. (2005). An improved integral non-linear model for the contact of particles in distinct element simulations. Chem. Eng. Sci. 60, 1303–1312. doi:10.1016/j.ces.2004.10.004
Fulchini, F., Zafar, U., Hare, C., Ghadiri, M., Tantawy, H., Ahmadian, H., et al. (2017). Relationship between surface area coverage of flow-aids and flowability of cohesive particles. Powder Technol. 322, 417–427. doi:10.1016/j.powtec.2017.09.013
Garg, R., Li, T., and Pannala, S. (2012). Documentation of open-source MFIX–DEM software for gas-solids flows. Available at: https://mfix.netl.doe.gov/doc/mfix-archive/mfix_current_documentation/dem_doc_2012-1.pdf.
Golshan, S., Sotudeh-Gharebagh, R., Zarghami, R., Mostoufi, N., Blais, B., and Kuipers, J. A. M. (2020). Review and implementation of CFD-DEM applied to chemical process systems. Chem. Eng. Sci. 221, 115646. doi:10.1016/J.CES.2020.115646
Grima, A. P., and Wypych, P. W. (2011). Investigation into calibration of discrete element model parameters for scale-up and validation of particle-structure interactions under impact conditions. Powder Technol. 212, 198–209. doi:10.1016/j.powtec.2011.05.017
Hærvig, J., Kleinhans, U., Wieland, C., Spliethoff, H., Jensen, A. L., Sørensen, K., et al. (2017). On the adhesive JKR contact and rolling models for reduced particle stiffness discrete element simulations. Powder Technol. 319, 472–482. doi:10.1016/J.POWTEC.2017.07.006
He, Y., Hassanpour, A., Alizadeh Behjani, M., and Bayly, A. E. (2021). A novel stiffness scaling methodology for discrete element modelling of cohesive fine powders. Appl. Math. Model 90, 817–844. doi:10.1016/J.APM.2020.08.062
Huang, C., and Nakagawa, M. (2023). Effects of rotation axis on mixing behavior of dissimilar particles in rotating drums. Powder Technol. 428, 118868. doi:10.1016/J.POWTEC.2023.118868
Johnson, K. L., Kendall, K., and Roberts, A. D. (1971). Surface energy and the contact of elastic solids. Proc. R. Soc. Lond. A Math. Phys. Eng. Sci. 324, 301–313.
Karde, V., Khala, M. J., Hare, C., and Heng, J. Y. Y. (2023). Use of shear sensitive coloured guest component to track powder mixing in adhesive binary mixtures. Powder Technol. 414, 118068. doi:10.1016/J.POWTEC.2022.118068
Khala, M. J., Hare, C., Karde, V., and Heng, J. Y. Y. (2023). A numerical analysis of the influence of material properties on dry powder coating performance. Chem. Eng. Res. Des. 193, 158–167. doi:10.1016/J.CHERD.2023.03.028
Kieckhefen, P., Pietsch, S., Dosta, M., and Heinrich, S. (2020). Possibilities and limits of computational fluid dynamics–discrete element method simulations in process engineering: a review of recent advancements and future trends. Annu. Rev. Chem. Biomol. Eng. 11, 397–422. doi:10.1146/annurev-chembioeng-110519-075414
Kruggel-Emden, H., Stepanek, F., and Munjiza, A. (2010). A study on adjusted contact force laws for accelerated large scale discrete element simulations. Particuology 8, 161–175. doi:10.1016/J.PARTIC.2009.07.006
Kuo, H. P., Knight, P. C., Parker, D. J., Tsuji, Y., Adams, M. J., and Seville, J. P. K. (2002). The influence of DEM simulation parameters on the particle behaviour in a V-mixer. Chem. Eng. Sci. 57, 3621–3638. doi:10.1016/S0009-2509(02)00086-6
Lischka, C., Gerl, S., Kappes, J., Chauhan, A., and Nirschl, H. (2024). Experimental & simulative assessment of mixing quality for dry Li-Ion cathode production in an Eirich intensive mixer. Powder Technol. 431, 119072. doi:10.1016/J.POWTEC.2023.119072
Maw, N., Barber, J. R., and Fawcett, J. N. (1976). The oblique impact of elastic spheres. Wear 38, 101–114. doi:10.1016/0043-1648(76)90201-5
Peng, Z., Joshi, J. B., Moghtaderi, B., Khan, Md. S., Evans, G. M., and Doroodchi, E. (2016). Segregation and dispersion of binary solids in liquid fluidised beds: a CFD-DEM study. Chem. Eng. Sci. 152, 65–83. doi:10.1016/j.ces.2016.05.032
Schmidt, J., and Peukert, W. (2022). Dry powder coating in additive manufacturing. Front. Chem. Eng. 4, 995221. doi:10.3389/fceng.2022.995221
Schulz, D., Reinecke, S. R., Woschny, N., Schmidt, E., and Kruggel-Emden, H. (2023). Development and evaluation of force balance based functions for dust detachment from bulk particles stressed by fluid flow. Powder Technol. 417, 118257. doi:10.1016/J.POWTEC.2023.118257
Schulz, D., Woschny, N., Schmidt, E., and Kruggel-Emden, H. (2022). Modelling of the detachment of adhesive dust particles during bulk solid particle impact to enhance dust detachment functions. Powder Technol. 400, 117238. doi:10.1016/J.POWTEC.2022.117238
Shaheen, M. Y., Thornton, A. R., Luding, S., and Weinhart, T. (2021). The influence of material and process parameters on powder spreading in additive manufacturing. Powder Technol. 383, 564–583. doi:10.1016/J.POWTEC.2021.01.058
Sharma, R., and Setia, G. (2019). Mechanical dry particle coating on cohesive pharmaceutical powders for improving flowability - a review. Powder Technol. 356, 458–479. doi:10.1016/J.POWTEC.2019.08.009
Sofia, D., Chirone, R., Lettieri, P., Barletta, D., and Poletto, M. (2018). Selective laser sintering of ceramic powders with bimodal particle size distribution. Chem. Eng. Res. Des. 136, 536–547. doi:10.1016/j.cherd.2018.06.008
Spahn, J. E., Zhang, F., and Smyth, H. D. C. (2022). Mixing of dry powders for inhalation: a review. Int. J. Pharm. 619, 121736. doi:10.1016/J.IJPHARM.2022.121736
Thornton, C., Cummins, S. J., and Cleary, P. W. (2011). An investigation of the comparative behaviour of alternative contact force models during elastic collisions. Powder Technol. 210, 189–197. doi:10.1016/j.powtec.2011.01.013
Tong, Z. B., Yang, R. Y., and Yu, A. B. (2017). CFD-DEM study of the aerosolisation mechanism of carrier-based formulations with high drug loadings. Powder Technol. 314, 620–626. doi:10.1016/j.powtec.2016.10.004
Washino, K., Chan, E. L., and Tanaka, T. (2018). DEM with attraction forces using reduced particle stiffness. Powder Technol. 325, 202–208. doi:10.1016/j.powtec.2017.11.024
Washino, K., Nakae, S., Yamagami, R., Chan, E. L., Tsuji, T., and Tanaka, T. (2024). Scaling of attraction force and rolling resistance in DEM with reduced particle stiffness. Chem. Eng. Res. Des. 203, 501–519. doi:10.1016/J.CHERD.2024.02.006
Yang, J., Wu, C.-Y., and Adams, M. (2015). DEM analysis of the effect of electrostatic interaction on particle mixing for carrier-based dry powder inhaler formulations. Particuology 23, 25–30. doi:10.1016/j.partic.2014.12.007
Zhu, H. P., and Yu, a. B. (2006). A theoretical analysis of the force models in discrete element method. Powder Technol. 161, 122–129. doi:10.1016/j.powtec.2005.09.006
Zhu, H. P., Zhou, Z. Y., Yang, R. Y., and Yu, A. B. (2007). Discrete particle simulation of particulate systems: theoretical developments. Chem. Eng. Sci. 62, 3378–3396. doi:10.1016/J.CES.2006.12.089
Nomenclature
Keywords: simulation, granular material, DEM, contact mechanics, wall model
Citation: Alfano FO, Iozzi G, Di Maio FP and Di Renzo A (2024) A thick wall concept for robust treatment of contacts in DEM simulation of highly polydisperse particulate systems. Front. Chem. Eng. 6:1362466. doi: 10.3389/fceng.2024.1362466
Received: 28 December 2023; Accepted: 04 March 2024;
Published: 14 March 2024.
Edited by:
Zhengbiao Peng, The University of Newcastle, AustraliaReviewed by:
Haifeng Lu, East China University of Science and Technology, ChinaChuan-Yu Wu, University of Surrey, United Kingdom
Copyright © 2024 Alfano, Iozzi, Di Maio and Di Renzo. This is an open-access article distributed under the terms of the Creative Commons Attribution License (CC BY). The use, distribution or reproduction in other forums is permitted, provided the original author(s) and the copyright owner(s) are credited and that the original publication in this journal is cited, in accordance with accepted academic practice. No use, distribution or reproduction is permitted which does not comply with these terms.
*Correspondence: Alberto Di Renzo, YWxiZXJ0by5kaXJlbnpvQHVuaWNhbC5pdA==; Francesca O. Alfano, ZnJhbmNlc2NhLmFsZmFub0B1bmljYWwuaXQ=