Facile Fluorescence “Turn on” Sensing of Lead Ions in Water via Carbon Nanodots Immobilized in Spherical Polyelectrolyte Brushes
 Yuchuan Tian1
  Antonios Kelarakis2*
  Li Li1* Fang Zhao1 Yunwei Wang1 Weihua Wang3
  Qingsong Yang1 Zhishuang Ye1
  Xuhong Guo1,4*
- 1State-Key Laboratory of Chemical Engineering, East China University of Science and Technology, Shanghai, China
- 2School of Physical Sciences and Computing, University of Central Lancashire, Preston, United Kingdom
- 3The Alle Chemical Company, Shandong, China
- 4Engineering Research Center of Materials Chemical Engineering of Xinjiang Bingtuan, Shihezi University, Shihezi, China
Heavy metal detection has become very important for the protection of water resource. In this work, a novel controllable probe is presented for the sensitive detection of Pb2+ in aqueous solutions. The probe was synthesized via the immobilization of surface functionalized carbon dots (named as CAEA-Hs) into the shell of the spherical polyelectrolyte brushes (SPB). The fluorescence of CAEA-H was firstly “turned off” via electrostatic interaction induced quenching. Based on the aggregation induced emission enhancement (AIEE), the fluorescence of the immobilized CAEA-H could be specifically turned on via the aggregation of the SPB particles. This fluorescence “turn on” sensor could selectively detect Pb2+ among five different metal ions with a relatively wide detecting range (0–1.67 mM) and good linear relationship (R2 = 0.9958). Moreover, the aggregating behavior and nano-structure of CAEA-H loaded SPB have been systematically analyzed via small angle X-ray scattering, turbidity titration, and Zeta-potential measurement. Based on a series of control experiments, we finally gain an insight into the sensing mechanism of this novel sensing probe. This contributed a proof of concept demonstration that sensitive and selective chemical detection can be achieved via a C-dot/SPB synergistic platform.
Introduction
In recent years, carbon nanodots (C-dots) has become one of the most fascinating research topics in both fluorescent (Zuo et al., 2016) and electrochemical fields (Qi et al., 2016). C-dots are nano-carbon materials composed of carbogenic cores with functional groups (hydroxyl, carboxyl, amino etc.) (Krysmann et al., 2011). Particularly, because of their excellent fluorescence ability such as high quantum yields (Krysmann et al., 2011) and low toxicity (Tao et al., 2012) in biologic environment, C-dots stand out from the traditional fluorescent quantum dots and are gradually being regarded as the potential benign alternatives to heavy-metal-based quantum dots. As a result, researchers have explored various applications of C-dots in bio-imaging (Yang et al., 2009), cancer therapy (Huang et al., 2012; Hola et al., 2014), photocatalysis (Li et al., 2010), and chemical sensing (Wang and Hu, 2014). Among them, using C-dots as chemical sensors has drawn more and more attention due to their large specific surface area, good electrical conductivity, and high fluorescent emission (Fernandes et al., 2015). Depending on different sensing mechanisms, C-dots can be exploited in testing various analytes such as heavy metal ions (Guo et al., 2013, 2015), proteins (Freire et al., 2018), nitrocompounds (Campos et al., 2016), and other bioanalytes (Niu and Gao, 2014).
Heavy metal ions are causing growing environmental problems and can do severe damage to the well-being of mankind. Thus finding an efficient way to detect heavy metal ions in aqueous solution has become imperative. To date, various C-dots induced heavy metal sensors have been reported (Liu et al., 2011; Wee et al., 2013; Li et al., 2018; Luo et al., 2018; Tabaraki and Sadeghinejad, 2018). In principle, two distinct mechanisms are involved for the heavy metal detection by C-dots: fluorescence quenching (Sharma et al., 2017) and electrochemical redox reaction (Li et al., 2018). By modifying electrodes with different C-dot hybrids, researchers can prepare electrochemical sensors with low detection limit in a wide linear range. However, such sensing methods still have certain drawbacks, such as complicated electrode-modifying process, the use of sophisticated instruments and rather time-consuming sample preparation process. Consequently, there is a growing trend of using C-dot-based fluorescent sensor to detect heavy metal ions.
In order to achieve high selectivity and sensitivity, researchers tend to employ different precusors as carbon source and nitrogen source (Liu et al., 2011; Wee et al., 2013; Luo et al., 2018), or modify the surface of C-dots with different functional groups (Shen et al., 2013). However, in all these methods, the selectivity and sensitivity of fluorescent sensors are largely depended on C-dots themselves and the interaction between C-dots and the analytes, resulting in inevitable limitations. Based on that, fluorescence “turn on” sensors have been developed in recent years. In most cases, they are achieved by combining C-dots with organic or inorganic quenchers at first as “off-state,” followed by interaction with the analyte to reach the “on-state.” Yuan et al. (2014) developed a “turn on” sensing platform by modifying C-dots with bis-(dithiocarbamato) copper (II) (CuDTC2-CDs). The fluorescence of C-dots could be quenched by CuDTC2-CDs through electron and energy transfer process. Further addition of Hg2+ could significantly turn on the fluorescence of CuDTC2-CDs by displacing Cu2+ in the complex with Hg2+. Compared with “turn off” sensor based on fluorescence quenching mechanism, “turn on” fluorescence sensors are more desirable due to the high selectivity and wider detection range (Wei et al., 2012). Recently, based on aggregation induced emission enhancement (AIEE), a novel class of fluorescence “turn on” sensors has been proposed (Liu et al., 2016; Wang et al., 2016; Xu et al., 2018). Xu et al. (2018) prepared a fluorescent probe based on AIEE to selectively and sensitively detect Hg2+. C-dots were co-doped with nitrogen and sulfur (N, S-CDs). The resulting C-dots were well-dispersed in water and had a “turn-on” fluorescence response to Hg2+.
In order to optimize the AIEE based “turn on” sensing, it is important to understand the mechanism of the relevant fluorescence enhancing phenomenon. In the previous studies (Wang et al., 2016; Xu et al., 2018), several characterization methods were chosen to study the mechanism of AIEE: fluorescence emission spectroscopy, X-ray photoelectron spectroscopy (XPS), UV-vis spectroscopy, and transmission electron microscope (TEM). However, none of them, except for TEM, could directly confirm the behavior of aggregation of the bonded C-dots complex. Even in TEM characterization, during the sample preparation process, the nanoparticles will aggregate due to the evaporation of the solvent. Therefore, other more explicit characterization methods are needed to better examine the mechanism of AIEE.
Small angle X-ray scattering (SAXS) has proven to be one of the most efficient ways to understand the structure of nanoparticles (Wang et al., 2014, 2015; Tangso et al., 2015). For complex systems, SAXS is especially of great advantage since it is capable to analyze the nano-composites in-situ within various environments and give us a detailed information about the inner structure (Tian et al., 2016), load distribution (Wang et al., 2014), nano-shape (Polte et al., 2010), and even the aggregation behavior (Mathew et al., 2004). Therefore, we envision that SAXS could be a powerful tool to understand the AIEE process during the fluorescent “turn on” process.
Due to the strong electrostatic force among the polyelectrolyte chains and the controllable behavior change, the core-shell shaped spherical polyelectrolyte brushes (SPB) have been known as the ideal candidate for immobilizing functional nanoparticles such as proteins (Wang et al., 2013), metals (Sharma and Ballauff, 2004; Mei et al., 2007), and quantum dots (Liu et al., 2014).
For most of the C-dots involved fluorescent metal sensors, the sensing mechanism is based on the direct fluorescence quenching between sensors and Metal ions (Liu et al., 2011; Wee et al., 2013; Luo et al., 2018). To the best of our knowledge, only two articles (Wang et al., 2016; Xu et al., 2018) studied the detection of heavy metals such as Hg2+, or Fe3+ that is based on the AIEE process using C-dots as templates for the AIEE detection of Pb2+. Moreover, in our study, SAXS was employed for the first time to prove the specific aggregation behavior between C-dots-SPBs nanoparticles under the presence of Pb2+.
Herein, we design a novel Pb2+ fluorescence “turn on” sensing probe by immobilizing C-dots into the brush shell of SPB in water solution. Based on previous study, excitation-dependent C-dots were synthesized with citric acid as carbon-source, and ethanolamine as N-source (CAEA). The surface of C-dots was further functionalized with extra carboxyl and hydroxyl groups via reaction with nitric acid (named as CAEA-H). Using core-shell poly(styrine)-poly(acrylic acid) SPB (named as PAA brushes) as carrier, we successfully immobilized the obtained C-dots into the brush layer of PAA chains (named as CAEA-H-PAA brushes). Due to electrostatic quenching, the emission fluorescence of the CAEA-H was significantly “turned off” after the C-dots were immobilized in SPB. By fluorescence titration for different metal ions in water solution, we obtained a selective and sensitive detection of Pb2+ via CAEA-H-PAA brushes nanocomposite sensor with a wide linear detecting range. Specifically, we found that among several different metal ions (including Ag+, Pb2+, Zn2+, Al3+, and Cd2+), only Pb2+ could efficiently “turn on” the quenched emission fluorescence through the AIEE process between the nanocomposite sensor and Pb2+. Moreover, the mechanism of the AIEE process was systematically studied by fluorescence emission spectra, SAXS, Zeta-potential measurement, and turbidity titration (As shown in Scheme 1).
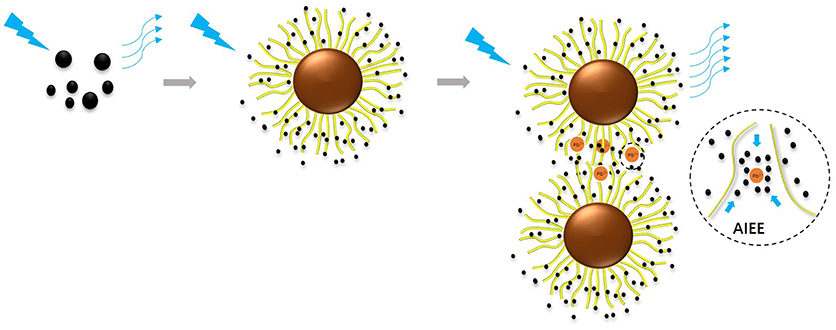
Scheme 1. Fluorescence turn on sensing of Pb2+ via immobilization C-dots into SPB.
Experimental Section
Materials
Citric acid (CA), nitric acid, and potassium chloride were purchased from Sigma-Aldrich and ethanolamine (EA) was purchased from Alfa Aesar. Acrylic acid (AA), K2S2O8 (KPS), styrene, sodium chloride (NaCl) and sodium dodecyl sulfonate (SDS) were purchased from Shanghai Reagent Company. 2-Hydroxy-4′-hydroxyethoxy-2-methyl propiophenone (HMP), and methacryloyl chloride were purchased from Tokyo Chemical industry Co. Silver nitrate (AgNO3), lead chloride (PbCl2), zinc chloride (ZnCl2), and aluminum chloride (AlCl3) were purchased from Shanghai Reagent Company. Cadmium chloride was purchased from Titan Reagent Company. Sodium dihydrogen phosphate (NaH2PO4) and iron(III) chloride (FeCl3) was obtained from Macklin Reagen. Manganese(II) chloride (MnCl2), potassium chloride (KCl), calcium chloride anhydrous (CaCl2), and disodium hydrogen phosphate (Na2HPO4) was purchased from Shanghai Lingfeng Reagent. Nickel(II) Chloride anhydrous (NiCl2) was from Damas Beta reagent company, cobaltous(II) chloride anhydrous (CoCl2) and Barium chloride anhydrous (BaCl2) was from Infinity Science. Photo-initiator 2-[p-(2-hydroxy-2-methyl propiopenone)]-ethyleneglycol methacrylate (HEMEM) was synthesized in our laboratory according to our previous paper (Guo et al., 1999). Ultrapure water was purified by reverse osmosis (Millipore Milli-Q) and used in all experiments. Styrene and AA were used after reduced pressure distillation and stored in a refrigerator at 4°C. KPS was recrystallized in water. All the other materials were used without further purification.
Synthesis and Modification of C-Dots
The synthesis of C-dots was based on the previous publication (Krysmann et al., 2011). In brief, C-dots were synthesized by controlled pyrolysis of CA and EA (molar ratio 3:1) at 180°C for 30 min under reflux, followed by a 30 min further heating at 230°C in the absence of the reflux condenser. Then the samples were pyrolyzed in the oven at 300°C for 1 h. Afterwards the product (named CAEA) was treated with 3 M nitric acid with a volume ratio 1:3 at 120°C for 16 h, in order to modify the C-dot surface with extra carboxyl and hydroxyl groups (CAEA-H). In both cases, the C-dot solution was dialyzed against ultrapure water through SnakeSkin Pleated Dialysis Tubing membrane (with a molecular weight cutoff of 3,500 Da) until the conductivity of the outer solution became constant.
Synthesis of PS-PAA Spherical Polyelectrolyte Brushes
The PS core was synthesized using a conventional emulsion polymerization according to the literature (Guo et al., 1999). In short, 0.74 g KPS, 0.24 g SDS, and 10 g styrene were added to the flask with 150 mL water, followed by the repeated degassing and subsequent flushing with nitrogen for at least 3 times. The reaction was carried out at 80°C for 2 h under the nitrogen atmosphere with a stirring rate of 300 rpm. Then 1 g photo-initiator HMEM dissolved in 7 g acetone was slowly added to the system under starved condition (0.05 ml/min). After another reaction for 2.5 h, the obtained PS core was purified in Milli-Q water by dialysis for 3 days.
The PAA brushes were synthesized through photo-emulsion polymerization. In a typical run, 100 g PS core solution was added to a 500 ml three-necked flat-bottomed quartz photo-reactor. The amount of AA added in mole is equal to that of styrene in PS core. Then more water was added to the reactor until the mass of the whole reaction system reached 400 g. After the addition of AA to the PS core latex, the system was degassed by repeated evacuation and flushing of nitrogen for at least three times. Then photo-emulsion polymerization was accomplished after UV radiation at room temperature with vigorous stirring for 2.5 h. The obtained SPB (with PAA brushes) were purified by ultra-filtration until the conductivity of outer water became constant.
Immobilization of C-Dots Into SPB (CAEA-H-PAA brushes)
In our study, we chose the carboxyl-group-rich CAEA-H as the template for the fluorescence “turn on” sensor. By adding C-dots solution into SPB solution dropwise under magnetic stirring for 30 min, CAEA-H immobilized in PAA brushes (CAEA-PAA brushes) with different mass ratios were prepared. The concentration of CAEA-H was fixed at 0.3 mg/mL, while two concentrations of PAA brushes were used: 1.2 and 3.6 mg/mL, respectively. Additionally, the same amount of CAEA was immobilized onto PAA brushes in the same manner as a control group.
Fluorescence “Turn on” Sensing of Metal Ions
We chose 5 different metal salts (AgNO3, PbCl2, ZnCl2, AlCl3, and CdCl2) to test the sensing ability of the CAEA-H-PAA brushes. 0.6 mL CAEA-H-PAA solution was despersed into 2.4 mL phosphate buffer solution (PBS) (pH 7.4, 10 mM). Two milliliters of the obtained solution was put into a 3 mL quartz cuvette. Then different volumes (from 20 to 100 μL) of 5 metal ion solutions (concentration = 0.05 M) were added into the cuvette respectively, followed by the monitor of fluorescence emission spectrometer (F97pro, Shanghai Lengguang Technology Fluorometer). The fluorescence quenching data was collected in the form of I/I0, where I0 and I are the fluorescence emission before and after adding metal ions. Also, a control experiment was carried out by studying the unmodified CAEA-PAA brushes in the same manner.
Structure Characterization by Small Angle X-ray Scattering
In the SAXS test, 0.1 mL of sample solution was placed in the sample cell wrapped by polyimide films on both sides. The scattering intensity data of C-dots solution, PAA solution and CAEA-H-PAA-metal ions complex solution were collected by beamline BL16B1 at Shanghai Synchrotron Radiation Facility (SSRF) respectively. The concentration of CAEA-H was fixed at 0.3 mg/mL at 10 mM pH 7.4 PBS buffer, and the concentration of metal ions changed from 0 to 1.67 mM with an increment of 0.33 mM. The testing distance between samples to the detector was 2 or 5 m.
Other Characterizations
The size and size distribution of C-dots and CAEA-H-PAA brushes were studied by transmission electron microscopy (TEM, JEOL JEM-2010) at 200 kV. The zeta potential and the diameter of the SPB was collected via dynamic light scattering (DLS, Particle Sizer NICOMP 380 ZLS instrument). Turbidity (%T), reported as 100 – %T, was obtained with a Brinkmann PC 950 colorimeter (420 nm filter). FTIR spectra were recorded using a Nicolet IR2000 spectrophotometer at room temperature. The agglomerates and fluorescence of C-dots-SPB was observed via a polarized light microscope (2500P, LEIKADAM) with a fluorescence module (excitation wavelength λ = 390–410 nm).
Normally, the experiments were repeated 3 times to achieve a satisfying reproducibility.
SAXS Theory
Analysis of SPB
Generally, the contribution of the scattering intensity of a single SPB consists of the following 3 parts: (Rosenfeldt et al., 2004)
Here q means the scattering vector, and Ics(q) denotes the scattering intensity that results from the core-shell structure of SPB. Furthermore, Ics(q) is governed by the radial excess electron density distribution of the polyelectrolyte chains: Δρe(r) = ρe(r) – ρeM, where ρe(r) is the electron density distribution profile of SPB, and ρeM is the electron density distribution of the background. Ics(q) can be calculated from B2(q) where B(q) is the scattering amplitude: (Dingenouts et al., 1998)
Moreover, for polydisperse system, the Ics(q) can be easily obtained from the sum of the B(q) weighted by the number density (De Robillard et al., 2000).
The second part Ifluct is mainly attributed to the fluctuations from the polyelectrolyte chains. It can be simplified with the Lorentzian equation (De Robillard et al., 2000):
where ξ is the spatial extension of the fluctuation. Both Ifluct(0) and ξ are adjustable parameters in this case.(Rosenfeldt et al., 2004) At higher q values, Ifluct(q) plays a predominant role in the overall scattering intensity.
The third part Ips(q) comes from the contribution of the PS core, which is negligible in our case with a rather narrow q distribution (Rosenfeldt et al., 2004).
Analysis of C-Dots
Similar to PS core, a single carbon dot can be modeled as a “hard” sphere with a uniform electron density distribution inside, Δ (541.8 e−/nm3) and a narrow shell with a rather lower density, Δ. This means rcore and ΔρCDs are much higher than dshell and Δ, respectively. Hence, it is reasonable to neglect the contribution of shell, and the scattering intensity of C-dots ICDs could be calculated as follow:
Analysis of C-Dots-SPB
In theory, for a binary system composed of a big sphere and several small spheres (Rosenfeldt et al., 2004), the overall scattering intensity is the square of the sum of the two scattering amplitude B(q) of different spheres. Based on the previous studies (Rosenfeldt et al., 2004; Wang et al., 2017), at small scattering angles, for monodisperse system, the analysis process can be further simplified as follows: the immobilized small particles are deemed to increase the electron density of the large sphere around its surface, resulting in the increase of Ics at smaller q region (q < 0.4 nm−1). Whereas, in a higher q region (q > 0.6 nm−1), the scattering intensity is the sum of Ifluct and the intensity of the free small spheres having the same concentration to the C-dots-SPB solution [ICDs(q)]. Thus, for our system, at a rather small q region (0.05–1.5 nm−1), the scattering intensity of C-dots-SPB could be obtained as follows:
Fitting Model
The scattering intensity can be calculated from Equation (2). Hence the critical part is to find the ideal fitting model for the system. The 5-layer model has proven to be an efficient model to simplify the fitting process without scarifying accuracy (Dingenouts et al., 1998; De Robillard et al., 2000; Rosenfeldt et al., 2004; Wang et al., 2017). As shown in Figure 1, the distribution of the shell is divided into 5 layers where in each layer, the Δρe(r) is a constant.
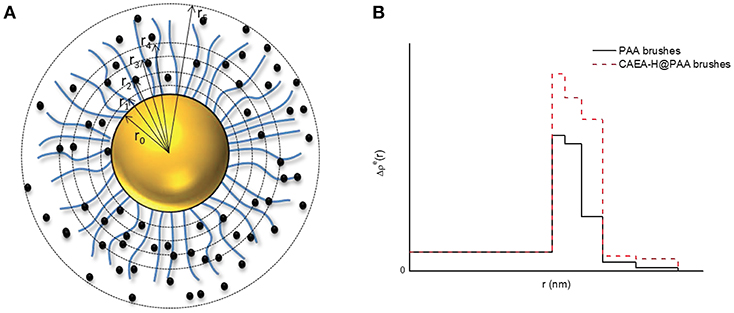
Figure 1. The five-layer model for the distribution of Δρe for C-dots- SPB. (A) Schematic illustration of C-dots-SPB structure; (B) Δρe(r) of PAA brushes and C-dots-PAA brushes.
Hence, the integral of Equation (2) could be calculated as follows:
Δρ is the excess electron density of PS core (6.4 e/nm3). Δρej is the given excess electron density of each layer, and rj is the radius of each layer. When C-dots are loaded into brush shell, we can accordingly increase the Δρej of each layer to fit the scattering intensity increase at small q-values (< 0.4 nm−1, as shown in Figure 1B).
For polydisperse system with a narrow size distribution, Gaussian distribution G(r) is used to model the dispersity of both C-dots and C-dots-SPB in solution: (De Robillard et al., 2000; Rosenfeldt et al., 2004).
where R0 is the average radius, and δ is the standard deviation. Therefore, the intensity could be calculated from Equation (8):
where γ is the adjustable parameter, N/V is the number density of the nanoparticles, and S(q) is the structure factor among particles that only influences the intensity at small q-values. For dilute system with noninteracting particles, S(q) can be simplified to 1.
However, it is worth noting that, for systems with a broad size distribution or nonnegligible particle interactions, it is no longer acceptable to use Gaussian distribution to build the distribution model (Wang et al., 2017). Obviously, for an original system that fits Gaussian distribution, the further special binding-up between several particles would inevitably cause the inconsistency to the Gaussian distribution. Moreover, when aggregation happens, the structure factor S(q) should be also taken into account (Hilfiker et al., 1990; Wang et al., 2017).
Hence, for our further discussion concerning the aggregation of SPB, the fitting model with Gaussian distribution can no longer serve its purpose. Moreover, the corresponding aggregation behavior with the addition of Pb2+ could be directly confirmed from the raw scattering curves based on the elevation of the first wave hollow (Hilfiker et al., 1990; Wang et al., 2017). As a result, a detailed observation of the scattering intensity is reliable enough to confirm the aggregation behavior of C-dots-SPB system without further fitting.
Results and Discussion
Characterizations of CAEA-H and CAEA-H-PAA Brushes
The FTIR results of CAEA-H are shown in Figure 2. The broad adsorption peak from 2,500 to 3,650 cm−1 along with the adsorption around 1,000 cm−1 could be attributed to the vibration of -COOH, N-H and O-H. (Shen et al., 2013; Luo et al., 2018). And the peaks at 1,640 and 1,563 cm−1 are the vibration of C = O and C-N, respectively (Krysmann et al., 2011). The peak at 1,382 cm−1 represents the adsorption bands arising from -OH groups (Freire et al., 2018). The peak at 1,265 cm−1 denotes the vibration of C-N (Luo et al., 2018). And the peaks at 831 and 792 cm−1 are attributed to the bending vibration of the C = C-H bond from the sp2 carbon (Shen et al., 2013). The FTIR adsorption of CAEA-H indicates the presence of different functional groups such as -COOH, -NH2, and -OH at the C-dot surface, as well as the carbogenic core with sp2 orbital (Krysmann et al., 2011).
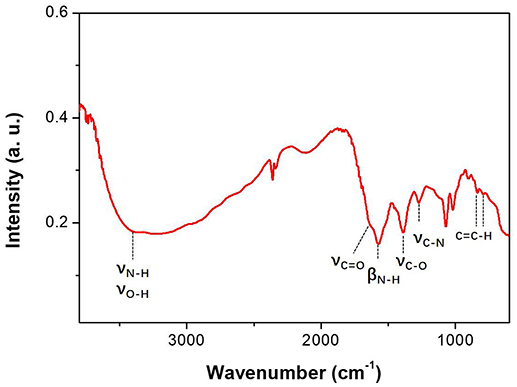
Figure 2. FTIR spectra of CAEA-H.
The morphology of CAEA-H and CAEA-H-PAA brushes were studied via TEM. As shown in Figure 3A, the CAEA-H particles were almost monodispersed with an average diameter 4.3 nm. This agrees well with the previous publications (Cao et al., 2007; Bourlinos et al., 2008; Ray et al., 2009). For PAA brushes, though a well-defined sphere structure can be observed from Figure 3B, the core-shell structure cannot be exhibited from the TEM image (Grünewald et al., 2015). As is shown in Figure 3C, it is hard to distinguish the CAEA-H from the surface of PAA brushes. That is probably due to the low contrast of the CAEA-H to the surrounding PAA brushes. Nevertheless, there were almost no unbonded C-dots found in the background, indicating that most C-dots were successfully immobilized inside PAA brushes.
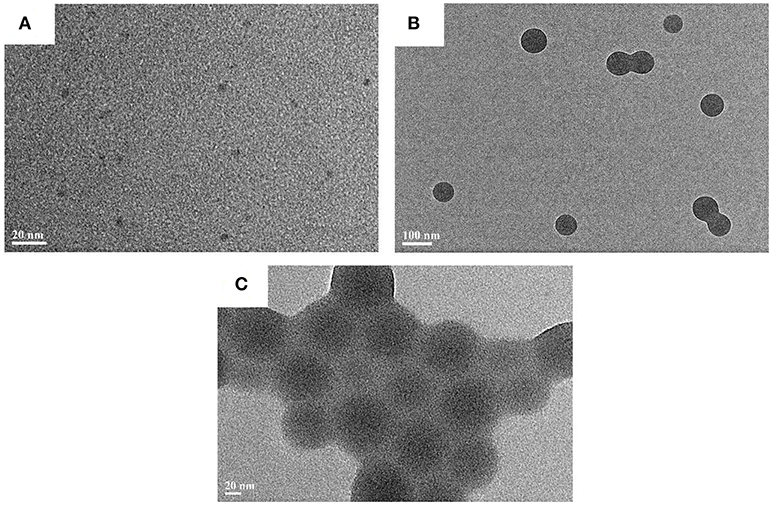
Figure 3. TEM results of C-dots and C-dots loaded particles: (A) CAEA-H, (B) PAA brushes, and (C) CAEA-H-PAA.
SAXS can give us a better understanding of the nano-structure of CAEA-H-PAA brushes. As shown in Figure 4A, at small q-values (0.09–0.3 nm−1), the upturn of the scattering intensity of CAEA-H is caused by the partial aggregation of the CAEA-H (Wang et al., 2017). When CAEA-H was immobilized into PAA brushes, the I(q) of CAEA-H-PAA increased over a broad q range (0.083–1.5 nm−1) without any influence on the dispersity. Compared with the intensity that simply derived from the direct sum of I(q)CAEA−H and I(q)PAA, we can discern a distinct elevation of the curve in the small q region (0.083–0.7 nm−1) for CAEA-H-PAA. This elevation mainly resulted from the addition of CAEA-H into the brush shell PAA. Whereas, at higher q-values (0.7–1.5 nm−1), the scattering intensity of (CAEA-H-PAA brushes) and (CAEA-H + PAA brushes) overlapped well each other. This suggests that the scattering intensity at higher q values of the mixed system is mainly governed by the combination of the intensity of free CAEA-H and the fluctuation from the polymer chains (Rosenfeldt et al., 2004).
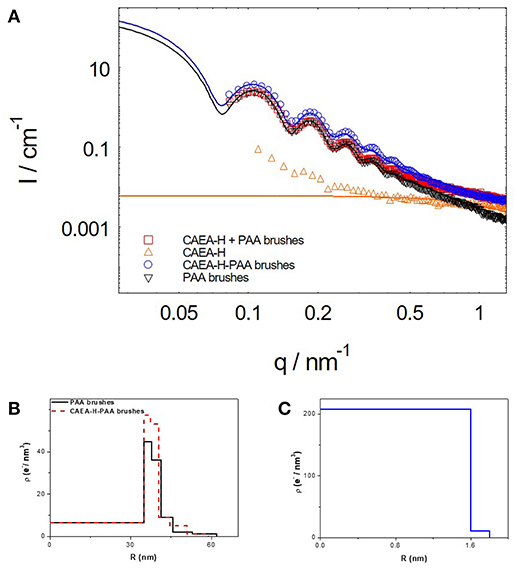
Figure 4. (A) SAXS results of CAEA-H, PAA brushes and C-dots-PAA brushes (the solid lines are the fitting curves). (B) Excess electron density distribution of CAEA-H-PAA brushes. (C) The excess electron density distribution of CAEA-H. The concentrations of CAEA-H and PAA brushes in SAXS tests were 0.3 and 3.6 mg/mL, respectively in an aqueous solution of 10 mM NaCl and pH 7.4.
Moreover, from the radial excess electron distribution profile (Figure 4B), we can obtain more specific details about the inner structure. The sharp increase of the electron density at the inner of the brush shell further proves the fact that most carbon dots are immobilized into the inner part of PAA brush shell. Due to the immobilization of C-dots, the electrostatic repulsions were weakened, resulting in the decrease of radius of the SPB from 62 to 59 nm, which is consistent with the DLS results (Wang et al., 2017) (Figure S1). The radius of CAEA-H, determined from its Δρe(r) chart in Figure 4C, was 1.8 nm, which is slightly smaller than the TEM results (2.15 nm).
Electrostatic Interaction Induced Fluorescence Quenching
It is generally believed that the fluorescence emission comes from the conjugated π state (C = C) from the core region, the functional groups around (C = O, -COOH, -OH, and -NH2), and the electronic state transitions (Krysmann et al., 2011; Zeng et al., 2017).
As shown in Figure 5A, the fluorescent emission spectra of CAEA-H coincide well with our previous publication (Krysmann et al., 2011). A excitation wavelength dependent emission was observed for different excitation wavelength. The fluorescence emission increased as the increase of excitation wavelength. The excitation-dependent emission was attributed to the C = C in core region.
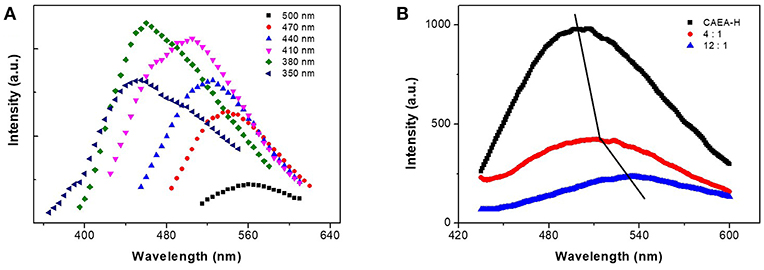
Figure 5. (A) Fluorescent emission spectra of CAEA-H at different excitation wavelength. (B) Emission spectra of CAEA-H-SPB with different mass ratios of SPB and C-dots at excitation wavelength 430 nm (the mass concentration of C-dots was fixed at 0.3 mg/mL).
When comparing the emission spectra of CAEA-H-PAA brushes with different ratios of SPB to C-dots (0:1, 4:1, 12:1), we can clearly observe the “turn off” of emission after PAA brushes were added to the CAEA-H system at Figure 5B. Upon increasing the amount of the PAA brushes, the fluorescence quenching was more remarkable. In literatures (Itoh et al., 1984; Wang et al., 2004; Hu et al., 2005), it has been proved that the strong electrostatic force between polyelectrolytes and some counter ions could lead to strong enhancement of fluorescence quenching. Whereas in the context of our work, the electrostatic force between PAA chains (-COOH) and CAEA-H (-NH2) plays a major role in the fluorescence quenching between CAEA-H and PAA brushes. Besides that, there is a clear red-shift of the emission peaks in Figure 5B. It is possibly due to the polarity change caused by the immobilization of CAEA-H into PAA brushes (Hu et al., 2005). According to the fluorescence emission data in Figure 5B, the approximate immobilization amount of CAEA-H-PAA 1:12 obtained from the quenching efficiency (I/I0) was ca. 0.05 mg/mg-SPB. From SAXS results (Figure 4B), the amounts of C-dots could be approximately calculated from the difference between the excess electron distribution of SPB and CAEA-H-SPB. From the calculation the approximate immobilization amount was ca. 0.04 mg/mg-SPB. Within the error allowed, the immobilization amounts of C-dots for CAEA-H-PAA-1:12 could be 0.04 ± 0.02 (mg/mg SPB) (See Supplementary Material for the detailed calculation process).
Here, we use the normalized emission ratio (ICAEA−H−PAA/ICAEA−H) to study the fluorescence emission at different pH and salt condition. The emission ratio was higher when more SPB was added to the system. As shown in Figure 6A, at pH = 3 or 5, the emission ratio of CAEA-H-PAA-4:1 was low at “off-state.” At pH = 7 or 9, however, the emission ratio for CAEA-PAA-4:1 drastically increased to nearly 1 as “on-state” and remained stable. Similar to the case of proteins (Wang et al., 2013), the electrostatic interaction between C-dots and SPB is a combination of electrostatic repulsion and attraction. When pH increases, the electrostatic repulsion between the carboxyl groups on the PAA chains and CAEA-H becomes stronger due to the enhancement of ionization of -COOH group, resulting in the weakening of the overall electrostatic attraction between PAA brushes and CAEA-H. As a result, more free CAEA-H will exist in the solution which leads to the enhancement of fluorescence. After pH = 7, the repulsion is already larger than attraction force among PAA chains and CAEA-H, thus further increase of pH would no longer increase the emission ratio.
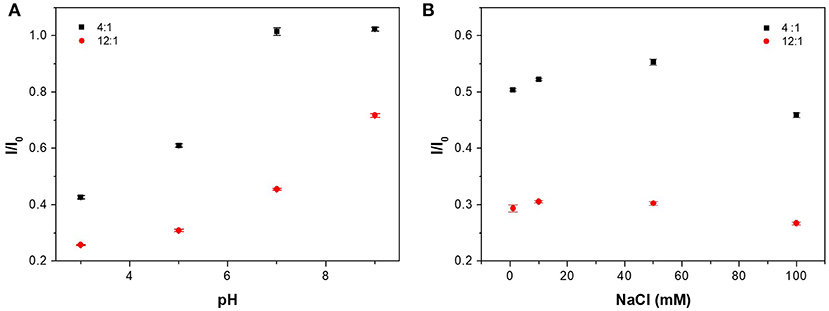
Figure 6. Influence of pH (A) and salt concentration (B) on the emission ratio of CAEA-H-PAA at different mass ratios of PAA brushes and CAEA-H. NaCl concentration was 10 mM in (A), and pH was 3 in (B). The concentration of C-dots is fixed at 0.3 mg/mL.
As for ionic strength at Figure 6B, for different amount of PAA brushes, similar trend of emission quenching at different NaCl concentrations has been found. In the low NaCl concentration range (0–10 mM), the quenching efficiency increased firstly, and then reached a maximum around 10 mM. This behavior could be attributed to the migration of the CAEA-H from inner brush shell to the outer solution due to the ion exchange with the Na+. At even higher salt concentrations, the existence of many counter ions in the solution would be confined around PAA shell, which would prominently screen the fluorescence of CAEA-H via electrostatic quenching (Itoh et al., 1984). The above discussion confirms that the quenching of CAEA-H with the presence of PAA brushes is mainly induced by the electrostatic interactions among CAEA-H and PAA chains.
Facile Detecting Pb2+ of CAEA-H-PAA Brushes in Aqueous Solution
Figure 7 shows the detection of metal ions by CAEA-H and CAEA-H-PAA, where the mass ratio of CAEA and SPB is 1:12 and the samples are dispersed in 10 mM PBS buffer (pH 7.4). When there were no PAA brushes (Figure 7A), the increase in the concentration of different metal ions seems to have less impact on the fluorescence emission. Still, for heavy metals Pb2+ and Cd2+, a slight increase of the fluorescence emission (I/I0 ≈ 1.05) could be detected, this rather limited effect might be attributed to a change of C-dots electronic environment that results in stronger fluorescence. Moreover, a control experiment had been done via testing the emission ratio of the unmodified CAEA with Pb2+ (0.06 mg/mL CAEA at 10 mM PBS buffer with pH 7.4) (see Table S1). And it was found that there was no fluorescence enhancement with a emission ratio of 0.98. By contrast, the emission of CAEA-H in Figure 7A slightly increased under the same condition.
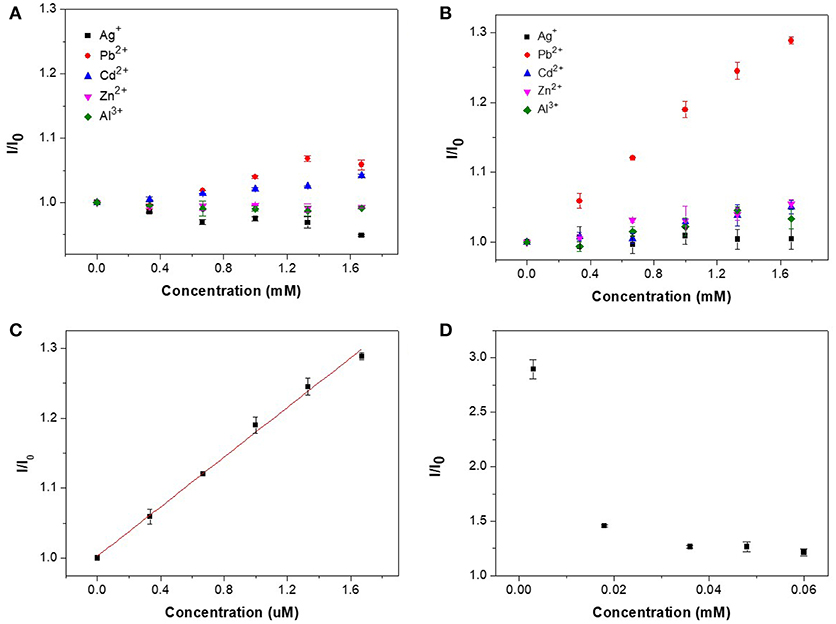
Figure 7. Fluorescence titration for different metal ions in (A) CAEA-H, and (B) CAEA-H-PAA (mass ratio of CAEA-H and SPB 1:12) aqueous solution. The concentration of CAEA-H was 0.06 mg/mL by dispersing samples into 10 mM PBS buffer (pH 7.4) in both solutions. (C) Linear fitting results of the I/I0 of CAEA-H-PAA SPB for detecting Pb2+. (D) Relationship between fluorescence emission and the concentration of CAEA-H-PAA brushes.
As for the SPB-imported CAEA-H-PAA brushes (Figure 7B), the nominalized emission I/I0 for detecting Pb2+ ions was remarkably improved from 1.05 to 1.28, whereas for other metal ions, the fluorescence only slightly increased with the increase of concentration. Moreover, a good linear relationship between the Pb2+ concentration and I/I0 was acquired. As shown in Figure 7C, the regression equation is I/I0 = 1.0028 + 0.1770 [Pb2+] with a R2 of 0.9958. The detecting limit was found to be 22.8 μM based on the calculation from 3δ/s (Wee et al., 2013), where δ is the standard deviation for 10 blank samples, and s is the slope of the calibration curve. The calibration curve for CAEA-H-PAA system exhibits an excellent linear relation with a considerably wide detecting range compared to other sensors using fluorescent methods (Liu et al., 2011; Wee et al., 2013; Li et al., 2018; Luo et al., 2018; Tabaraki and Sadeghinejad, 2018).
Due to the unique property for SPB to adsorb counter ions (Mei et al., 2007; Wang et al., 2013), the sensitivity of the sensor could be further increased by simply decreasing the sensor-to-target ratio (Wei et al., 2012). Experiment was carried out via decreasing the sensor concentration to 0.003 mM while the concentration of Pb2+ was fixed at 1.33 mM. As shown in Figure 7D, the sensitivity for detecting Pb2+ increased with the decrease of sensor concentration. This result extends the potential application of our CAEA-H-PAA brushes sensing platform with adjustable sensitivity.
Selectivity of the CAEA-H-PAA for Pb2+
To investigate the selectivity of the sensor, the fluorescence emission spectra of CAEA-H-PAA after the addition of 1.67 mM different metal ions (Mn2+, K+, Na+, Ca2+, Pb2+, Zn2+, Ba2+, Fe3+, Co2+, Ni2+, Cd2+, Ag+, and Al3+) were studied. The fluorescence emission was recorded in the form of quenching ratio: (I – I0)/I0, where I and I0 is the fluorescence emission of CAEA-H-PAA after and before the addition of different metal ions. As is shown in Figure 8, the CAEA-H-PAA exhibits excellent selectivity of Pb2+ among 13 tested metal ions.
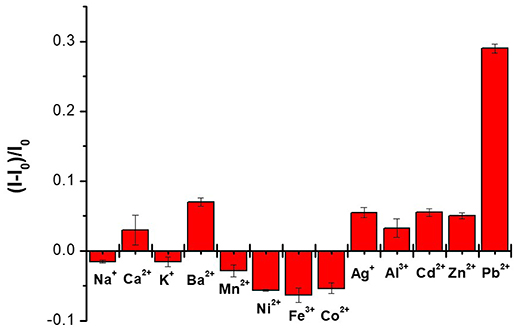
Figure 8. Selectivity study of the CAEA-H-PAA (mass ratio 1:12) over different metal ions. The concentration of the CAEA-H was 0.06 mg/mL at 10 mM pH 7.4 PBS buffer.
Detection of Pb2+ in Real Water Samples
To study the feasibility of this C-dots-SPB probe, the spiked recovery of the CAEA-H-PAA in real water samples (Lake water, from Qiandao Lake, Zhejiang Province; natural mineral water, from Mount Huangshan City; and tap water in the laboratory from Shanghai) has been carried out via addition of different concentration of Pb2+ (0.667, 1, 1.33 mM). As shown in Table S2, for different water samples, the sensor achieved good recoveries of 90.6–108%. And relative standard division is < 2.13%.
Fluorescence “Turn on” Mechanism for the Detection of Pb2+
Different from the traditional fluorescence quenching mechanism that is based on the electron and fluorescent resonance energy transfer process (Sun et al., 2016), the AIEE fluorescence enhancing process is based on the aggregation behavior of the carbon dots. In principle, in the aggregates, the intramolecular motion is restricted, which block the nonradiative path and activated radiative decay (Wang et al., 2016). As shown by the fluorescence emission spectra excited at 410 nm (Figure S2), the emission peaks of CAEA-H-PAA brushes slightly blue shifted to a smaller value from 491 to 470 nm, indicating the specific interaction between CAEA-H and PAA brushes (Xu et al., 2018).
In order to further understand the role that PAA brushes play in the enhancement of AIEE detection, we conducted a series of characterizations including SAXS, turbidity titration and Zeta-potential analysis.
Herein we conducted the SAXS tests for CAEA-H-PAA with the different amounts of Pb2+ and other 4 metal ions (Figures S4), respectively. As shown in Figure 9, when Pb2+ was added to CAEA-H-PAA solution, the scattering oscillation became gradually obscure and shift to a higher value as the Pb2+ concentration was increased. The obscure of the scattering oscillation from the SAXS curve is due to the increase of polydispersity which is caused by the aggregation of particles (Hilfiker et al., 1990). Moreover, the significant increase of the scattering intensity in the middle q region (0.1–0.3 cm−1) suggested the possible accumulation of CAEA-H among the PAA chains due to the aggregation of SPB particles (Tian et al., 2016).
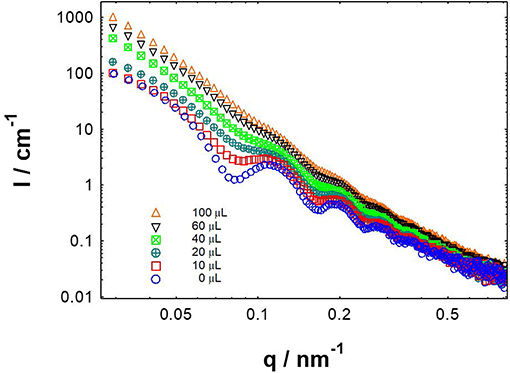
Figure 9. SAXS results of CAEA-H-PAA (CAEA-H / SPB mass ratio 1:12) aqueous solution at different Pb2+ adding amounts. CAEA-H-PAA SPB concentration was 3.9 mg/mL in pH 7.4 10 mM PBS buffer. The curves were measured by adding different volumes of 0.0167 M Pb2+ aqueous solution into CAEA-H-PAA solution.
Compared with other metal ions (Figure S3), only the scattering curves of Pb2+ on CAEA-PAA showed a distinct increase in polydispersity with the increase of Pb2+ concentration, indicating the trend of aggregation. Also, without the immobilization of CAEA-H (Figure S4), only Pb2+ could obscure the scattering oscillation (Figure S4) among the 5 metal ions. The SAXS data suggest the specific aggregation behavior between SPB and Pb2+ makes CAEA-H-SPB an ideal potential sensor to selectively detect Pb2+.
Other characterization methods were also used to confirm the specific aggregation behavior between CAEA-H-PAA and Pb2+. In Figure 10A, with the increase of Pb2+ concentration, the turbidity gradually increased, while the turbidity of other 4 metal ions remained stable.
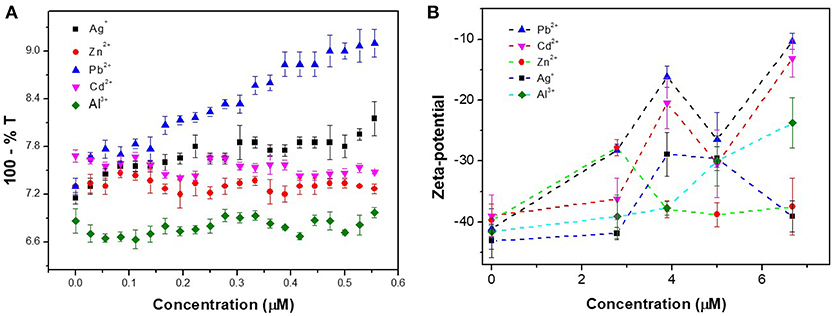
Figure 10. (A) Turbidity titration for different metal ions in CAEA-H-PAA SPB salt-free aqueous solution. The concentration of CAEA-H-PAA SPB solution was 0.013 mg / mL at pH 6.8. (B) Zeta-potential of CAEA-H-PAA SPB salt-free aqueous solution at different concentration of metal ions. The concentration of CAEA-H-PAA SPB solution was 0.065 mg/mL at pH = 6.8.
As shown in Figure 10B, compared to other metal ions, the absolute value of Pb2+ Zeta-potential was the least for all the concentrations, indicating that the Pb2+-CAEA-H-PAA system was most unstable among the 5 different metal ions and was more likely to aggregate.
As is shown in Figure S5. the diameter and the polydispersity of CAEA-H-PAA after the addition of Pb2+ were the largest among all tested metal ions (Pb2+, Zn2+, Al3+, Ag+, Cd2+), further indicating the specific aggregating behavior of CAEA-H-PAA after the adding of Pb2+.
Additionally, the optical and fluorescence microscopy has been conducted to further confirm the specific aggregation between CAEA-H-PAA particles. As shown in the fluorescence microscopy in Figures S6A–D, only the agglomerates of CAEA-H-PAA and PAA brushes at 100 μL Pb2+ can be observed, which confirms the specific aggregation behavior of Pb2+ with CAEA-H-PAA and PAA brushes. And only CAEA-H-PAA shows a significant fluorescence emission. This suggests that the AIEE phenomenon is caused by the confining of C-dots inside SPB shell and the further aggregation of SPB particles at the presence of Pb2+.
Thus, by different characterization methods we could confirm the specific interaction between CAEA-H-PAA and Pb2+. However, it still remains to be discussed that how the aggregation behavior of SPB will enhance the fluorescence emission. To this end, 2 relevant control experiments were carried out: fluorescence titration of Pb2+ into CAEA-H-PAA at pH 7.4 with smaller mass ratio of SPB and CAEA-H (4:1); and fluorescence titration of Pb2+ into CAEA -PAA at pH 7.4 at the same mass ratio of 12:1.
As shown in Table S1, for CAEA-H-PAA at pH 7.4 with a mass ratio 4:1, only a little increase in the fluorescence emission was found (I/I0 = 1.02). As we have discussed in Figure 6A, when the mass ratio was 4:1 and pH = 7.4, there was no apparent electrostatic interaction between CAEA-H and SPB. In other words, there were no CAEA-H that “gathered” inside the brush shell. When Pb2+ ions were added to the system, further enhancement of the fluorescence emission was not significant. This proves that the CAEA-H needs to be immobilized into the brush system to enhance the fluorescence emission. Moreover, the rather weak fluorescence enhancement of Cd2+ for CAEA-H-PAA at mass ratio 12:1 and pH = 7.4 indicates that the aggregation of the PAA system was also inevitable for the “turn on” fluorescence detection. However, for CAEA-PAA at the same condition (mass ratio 12:1 and pH = 7.4), from Table S1 we can observe that there was no increase of the fluorescence emission either. This suggests that although the CAEA were immobilized into the brush shell, and specific aggregation of SPB happened due to Pb2+ addition, the fluorescence couldn't be turned on because there was no aggregation behavior between CAEA and Pb2+. Moreover, from previous literature (Morris et al., 1997), it has been confirmed that at basic condition, large amounts of Pb(II) would be adsorbed in the Acrylic Acid copolymer microgels, which might cause the specific aggregation between SPB particles. Thus, we can draw the conclusion now that the fluorescence “turn on” sensing of Pb2+ by our CAEA-H-PAA system is based on the combination of immobilizing CAEA-H into PAA brush shell, the specific aggregation of the CAEA-H-PAA, and the aggregation of CAEA-H.
Mechanistically, it should be noted that introduction of Pb(II) to SPB suspension results in agglomeration even in the absence of C-dots. For C-dot decorated SPB systems, this behavior suggests that C-dots experience a confined environment where their motion is severely restricted, an effect that gives rise to AIEE. In addition, in Figure S7, we studied the relationship between the concentration and the emission ratio between CAEA-H-PAA with 100 μL Pb2+ and the emission of free CAEA-H at the same condition. The observation that the fluorescence intensity of the agglomerated system (CAEA-H-PAA) far exceeds that of the initial C-dot solution, indicates that de-absorption of C-dots (due to competitive action from Pb(II)) should play only a minor role, if at all present. Regardless the exact features of the underlying mechanism it is clear that C-dots/SPB coupling can generate powerful systems with interesting sensing capabilities.
Conclusion
In this paper, a novel fluorescence “turn on” sensor based on the immobilization of CAEA-H into PAA brushes was prepared. It could selectively detect Pb2+ among different metal ions with a wide detecting range (0–1.67 mM) and good linear correlation (R2 = 0.9958). For this fluorescence “turned on” probe, the fluorescence of CAEA-H was firstly quenched by immobilization into PAA brushes via electrostatic interaction induced quenching. The addition of Pb2+ caused the aggregation of SPB particles would specifically “turn on” the fluorescence of the Carbon dots. The results suggest that the AIEE process is based on the mutual contribution of CAEA-H immobilization, the specific aggregation of the CAEA-H-PAA, and the aggregation of CAEA-H within SPB shell. This novel SPB-based sensor can serve as a promising demonstration on the sensing of Pb2+ with a wide detecting range and controllable parameters, and a proof of showing that sensitive and selective chemical detection can be achieved via a C-dot/SPB synergistic platform.
Author Contributions
YT, AK, LL, FZ, YW, WW, QY, ZY and XG were involved in the experimental works. YT performed all the experiments and wrote the paper. WW and YT performed the fluorescence test and the synthesis of Carbon dots. QY and ZY provided the PAA brushes for SAXS test. AK and XG supervised on the establishment of the experiment scheme. LL instructed on the fitting of SAXS data and revised the SAXS fitting part of the manuscript. AK, FZ, YW and XG provided the revision to the whole manuscript.
Conflict of Interest Statement
The authors declare that the research was conducted in the absence of any commercial or financial relationships that could be construed as a potential conflict of interest.
Acknowledgments
We thank the financial support by the NSFC Grants (5171101370, 51773061, and 21476143), 111 Project Grant (B08021), and the financial support from China Scholarship Council for YT to work in Preston within the framework Newton Fund PhD Placement Grant (201503780053). We thank Shanghai Synchrotron Radiation Facility for its experimental support.
Supplementary Material
The Supplementary Material for this article can be found online at: https://www.frontiersin.org/articles/10.3389/fchem.2018.00470/full#supplementary-material
References
Bourlinos, A. B., Stassinopoulos, A., Anglos, D., Zboril, R., Georgakilas, V., and Giannelis, E. P. (2008). Photoluminescent carbogenic dots. Chem. Mater. 20, 4539–4541. doi: 10.1021/cm800506r
Campos, B. B., Contreras-Cáceres, R., Bandosz, T. J., Jiménez-Jiménez, J., Rodríguez-Castellón, E., da Silva, J. C. E., et al. (2016). Carbon dots as fluorescent sensor for detection of explosive nitrocompounds. Carbon N. Y. 106, 171–178. doi: 10.1016/j.carbon.2016.05.030
Cao, L., Wang, X., Meziani, M. J., Lu, F., Wang, H., Luo, P. G., et al. (2007). Carbon dots for multiphoton bioimaging. J. Am. Chem. Soc. 129, 11318–11319. doi: 10.1021/ja073527l
De Robillard, Q., Guo, X., Ballauff, M., and Narayanan, T. (2000). Spatial correlation of spherical polyelectrolyte brushes in salt-free solution as observed by small-angle X-ray scattering. Macromolecules 33, 9109–9114. doi: 10.1021/ma001373n
Dingenouts, N. N., Bolze, J., Pötschke, D., and Ballauff, M. (1998). Analysis of polymer latex by small-angle X-ray scattering. Adv.Polym. Sci. 144, 1–47.
Fernandes, D., Krysmann, M. J., and Kelarakis, A. (2015). Carbon dot based nanopowders and their application for fingerprint recovery. Chem. Commun. 51, 4902–4905. doi: 10.1039/C5CC00468C
Freire, R. M., Le, N. D. B., Jiang, Z., Kim, C. S., Rotello, V. M., and Fechine, P. B. A. (2018). NH2-rich Carbon Quantum Dots: a protein-responsive probe for detection and identification. Sens. Actuators B Chem. 255, 2725–2732. doi: 10.1016/j.snb.2017.09.085
Grünewald, T. A., Lassenberger, A., van Oostrum, P. D., Rennhofer, H., Zirbs, R., Capone, B., Vonderhaid, I., et al. (2015). Core-shell structure of monodisperse poly (ethylene glycol)-grafted iron oxide nanoparticles studied by small-angle X-ray scattering. Chem. Mater. 27, 4763–4771. doi: 10.1021/acs.chemmater.5b01488
Guo, X., Weiss, A., and Ballauff, M. (1999). Synthesis of spherical polyelectrolyte brushes by photoemulsion polymerization. Macromolecules 32, 6043–6046. doi: 10.1021/ma990609o
Guo, Y., Wang, Z., Shao, H., and Jiang, X. (2013). Hydrothermal synthesis of highly fluorescent carbon nanoparticles from sodium citrate and their use for the detection of mercury ions. Carbon N. Y. 52, 583–589. doi: 10.1016/j.carbon.2012.10.028
Guo, Y., Zhang, L., Zhang, S., Yang, Y., Chen, X., and Zhang, M. (2015). Fluorescent carbon nanoparticles for the fluorescent detection of metal ions. Biosens. Bioelectron. 63, 61–71. doi: 10.1016/j.bios.2014.07.018
Hilfiker, R., Eicke, H. F., Sager, W., Steeb, C., Hofmeier, U., and Gehrke, R. (1990). Form and structure factors of water/AOT/oil microemulsions from synchrotron SAXS. Ber. Bunsengesellschaft phys. Chem. 94, 677–683. doi: 10.1002/bbpc.19900940611
Hola, K., Zhang, Y., Wang, Y., Giannelis, E. P., Zboril, R., and Rogach, A. L. (2014). Carbon dots-emerging light emitters for bioimaging, cancer therapy and optoelectronics. Nano Today 9, 590–603. doi: 10.1016/j.nantod.2014.09.004
Hu, Y. J., Liu, Y., Pi, Z. B., and Qu, S. S. (2005). Interaction of cromolyn sodium with human serum albumin: a fluorescence quenching study. Bioorg. Med. Chem. 13, 6609–6614. doi: 10.1016/j.bmc.2005.07.039
Huang, P., Lin, J., Wang, X., Wang, Z., Zhang, C., He, M., et al. (2012). Light-triggered theranostics based on photosensitizer-conjugated carbon dots for simultaneous enhanced-fluorescence imaging and photodynamic therapy. Adv. Mater. 24, 5104–5110. doi: 10.1002/adma.201200650
Itoh, Y., Morishima, Y., and Nozakura, S. (1984). Amphiphilic copolymers as media for light-induced electron transfer-I. Electrostatic effect on the forward reaction as studied by fluorescence quenching. Photochem. Photobiol. 39, 451–457. doi: 10.1111/j.1751-1097.1984.tb03874.x
Krysmann, M. J., Kelarakis, A., Dallas, P., and Giannelis, E. P. (2011). Formation mechanism of carbogenic nanoparticles with dual photoluminescence emission. J. Am. Chem. Soc. 134, 747–750. doi: 10.1021/ja204661r
Li, H., He, X., Kang, Z., Huang, H., Liu, Y., Liu, J., et al. (2010). Water-soluble fluorescent carbon quantum dots and photocatalyst design. Angew. Chem. Int. Ed. 49, 4430–4434. doi: 10.1002/anie.200906154
Li, L., Liu, D., Shi, A., and You, T. (2018). Simultaneous stripping determination of cadmium and lead ions based on the N-doped carbon quantum dots-graphene oxide hybrid. Sens. Actuators B Chem. 255, 1762–1770. doi: 10.1016/j.snb.2017.08.190
Liu, L. Q., Li, Y. F., Zhan, L., Liu, Y., and Huang, C. (2011). One-step synthesis of fluorescent hydroxyls-coated carbon dots with hydrothermal reaction and its application to optical sensing of metal ions. Sci. China Chem. 54:1342. doi: 10.1007/s11426-011-4351-6
Liu, X., Xu, Y., Ma, S., Ma, Y., Ahmad, A., Tian, Y., et al. (2014). Encapsulation of quantum dot clusters in stimuli-responsive spherical polyelectrolyte brushes. Ind. Eng. Chem. Res. 53, 11326–11332. doi: 10.1021/ie501035s
Liu, Z. X., Wu, Z. L., Gao, M. X., Liu, H., and Huang, C. Z. (2016). Carbon dots with aggregation induced emission enhancement for visual permittivity detection. Chem. Commun. 52, 2063–2066. doi: 10.1039/C5CC08635C
Luo, L., Song, T., Wang, H., Yuan, Q., and Zhou, S. (2018). A highly selective fluorescence sensing platform for nanomolar Hg (II) detection based on cytosine derived quantum dot. Spectrochim. Acta Part A Mol. Biomol. Spectrosc. 2018. 193, 95–101. doi: 10.1016/j.saa.2017.11.044
Mathew, E., Mirza, A., and Menhart, N. (2004). Liquid-chromatography-coupled SAXS for accurate sizing of aggregating proteins. J. Synchrotron Radiat. 11, 314–318. doi: 10.1107/S0909049504014086
Mei, Y., Lu, Y., Polzer, F., Ballauff, M., and Drechsler, M. (2007). Catalytic activity of palladium nanoparticles encapsulated in spherical polyelectrolyte brushes and core-shell microgels. Chem. Mater. 19, 1062–1069. doi: 10.1021/cm062554s
Morris, G. E., Vincent, B., and Snowden, M. J. (1997). Adsorption of lead ions ontoN-Isopropylacrylamide and acrylic acid copolymer microgels. J. Colloid Interface Sci. 190, 198–205. doi: 10.1006/jcis.1997.4843
Niu, J., and Gao, H. (2014). Synthesis and drug detection performance of nitrogen-doped carbon dots. J. Lumin. 149, 159–162. doi: 10.1016/j.jlumin.2014.01.026
Polte, J., Ahner, T. T., Delissen, F., Sokolov, S., Emmerling, F., Thünemann, A. F., et al. (2010). Mechanism of gold nanoparticle formation in the classical citrate synthesis method derived from coupled in situ XANES and SAXS evaluation. J. Am. Chem. Soc. 132, 1296–1301. doi: 10.1021/ja906506j
Qi, B. P., Bao, L., Zhang, Z. L., and Pang, D. W. (2016). Electrochemical methods to study photoluminescent carbon nanodots: Preparation, photoluminescence mechanism and sensing. ACS Appl. Mater. Interfaces 8, 28372–28382. doi: 10.1021/acsami.5b11551
Ray, S. C., Saha, A., Jana, N. R., and Sarkar, R. (2009). Fluorescent carbon nanoparticles: synthesis, characterization, and bioimaging application. J. Phys. Chem. C 113, 18546–18551. doi: 10.1021/jp905912n
Rosenfeldt, S., Wittemann, A., Ballauff, M., Breininger, E., Bolze, J., and Dingenouts, N. (2004). Interaction of proteins with spherical polyelectrolyte brushes in solution as studied by small-angle x-ray scattering. Phys. Rev. E Stat. Nonlin. Softw. Matter. Phys. 70:061403. doi: 10.1103/PhysRevE.70.061403
Sharma, G., and Ballauff, M. (2004). Cationic spherical polyelectrolyte brushes as nanoreactors for the generation of gold particles. Macromol. Rapid Commun. 25, 547–552. doi: 10.1002/marc.200300107
Sharma, V., Tiwari, P., and Mobin, S. M. (2017). Sustainable carbon-dots: recent advances in green carbon dots for sensing and bioimaging. J. Mater. Chem. B 5, 8904–8924. doi: 10.1039/C7TB02484C
Shen, L., Chen, M., Hu, L., Chen, X., and Wang, J. (2013). Growth and stabilization of silver nanoparticles on carbon dots and sensing application. Langmuir 29, 16135–16140. doi: 10.1021/la404270w
Sun, X., He, J., Meng, Y., Zhang, L., Zhang, S., Ma, X., et al. (2016). Microwave-assisted ultrafast and facile synthesis of fluorescent carbon nanoparticles from a single precursor: preparation, characterization and their application for the highly selective detection of explosive picric acid. J. Mater. Chem. A 4, 4161–4171. doi: 10.1039/C5TA10027E
Tabaraki, R., and Sadeghinejad, N. (2018). Microwave assisted synthesis of doped carbon dots and their application as green and simple turn off–on fluorescent sensor for mercury (II) and iodide in environmental samples. Ecotoxicol. Environ. Saf. 153, 101–106. doi: 10.1016/j.ecoenv.2018.01.059
Tangso, K. J., Patel, H.;, Lindberg, S., Hartley, P. G., Knott, R., Spicer, P. T., et al. (2015). Controlling the mesostructure formation within the shell of novel cubic/hexagonal phase cetyltrimethylammonium bromide-poly (acrylamide-acrylic acid) capsules for pH stimulated release. ACS Appl. Mater. Interfaces 7, 24501–24509. doi: 10.1021/acsami.5b05821
Tao, H., Yang, K., Ma, Z., Wan, J., Zhang, Y., Kang, Z., et al. (2012). In vivo NIR fluorescence imaging, biodistribution, and toxicology of photoluminescent carbon dots produced from carbon nanotubes and graphite. Small 8, 281–290. doi: 10.1002/smll.201101706
Tian, Y., Li, L., Han, H., Wang, W., Wang, Y., Ye, Z., et al. (2016). Modification of spherical polyelectrolyte brushes by layer-by-layer self-assembly as observed by small angle X-ray scattering. Polymers 8:145. doi: 10.3390/polym8040145
Wang, C., Jiang, K., Xu, Z., Lin, H., and Zhang, C. (2016). Glutathione modified carbon-dots: from aggregation-induced emission enhancement properties to a “turn-on” sensing of temperature/Fe3+ ions in cells. Inorg. Chem. Front. 3, 514–522. doi: 10.1039/C5QI00273G
Wang, S., Chen, K., Xu, Y., Yu, X., Wang, W., Li, L., et al. (2013). Protein immobilization and separation using anionic/cationic spherical polyelectrolyte brushes based on charge anisotropy. Soft Matter 9, 11276–11287. doi: 10.1039/c3sm51482j
Wang, W., Li, L., Henzler, K., Lu, Y., Wang, J., Han, H., et al. (2017). Protein immobilization onto cationic spherical polyelectrolyte brushes studied by small angle X-ray scattering. Biomacromolecules 18, 1574–1581. doi: 10.1021/acs.biomac.7b00164
Wang, W., Li, L., Tian, Y., Wang, Y., Ye, Z., and Guo, X. (2015). Protein adsorption onto Spherical Polyelectrolyte brushes observed by small angle X-ray scattering. J.East China Univ. Sci. Technol. 41, 277–280. doi: 10.3969/j.issn.1006-3080.2015.03.001
Wang, W., Li, L., Yu, X., Han, H., and Guo, X. (2014). Distribution of magnetic nanoparticles in spherical polyelectrolyte brushes as observed by small-angle X-ray scattering. J. Polym. Sci. Part B Polym. Phys. 52, 1681–1688. doi: 10.1002/polb.23580
Wang, X., Kim, Y. G., Drew, C., Ku, B. C., Kumar, J., and Samuelson, L. A. (2004). Electrostatic assembly of conjugated polymer thin layers on electrospun nanofibrous membranes for biosensors. Nano Lett. 4, 331–334. doi: 10.1021/nl034885z
Wang, Y., and Hu, A. (2014). Carbon quantum dots: synthesis, properties and applications. J. Mater. Chem. C 2, 6921–6939. doi: 10.1039/C4TC00988F
Wee, S. S., Ng, Y. H., and Ng, S. M. (2013). Synthesis of fluorescent carbon dots via simple acid hydrolysis of bovine serum albumin and its potential as sensitive sensing probe for lead (II) ions. Talanta 116, 71–76. doi: 10.1016/j.talanta.2013.04.081
Wei, W., Xu, C., Ren, J., Xu, B., and Qu, X. (2012). Sensing metal ions with ion selectivity of a crown ether and fluorescence resonance energy transfer between carbon dots and graphene. Chem. Commun. 48, 1284–1286. doi: 10.1039/C2CC16481G
Xu, Y., Li, H., Wang, B., Liu, H., Zhao, L., Zhou, T., et al. (2018). Microwave-assisted synthesis of carbon dots for“ turn-on” fluorometric determination of Hg (II) via aggregation-induced emission. Microchim. Acta 185:252. doi: 10.1007/s00604-018-2781-y
Yang, S. T., Cao, L., Luo, P. G., Lu, F., Wang, X., Wang, H., et al. (2009). Carbon dots for optical imaging in vivo. J. Am. Chem. Soc. 131, 11308–11309. doi: 10.1021/ja904843x
Yuan, C., Liu, B., Liu, F., Han, M. Y., and Zhang, Z. (2014). Fluorescence “turn on” detection of mercuric ion based on bis-(dithiocarbamato) copper (II) complex functionalized carbon nanodots. Anal. Chem. 86, 1123–1130. doi: 10.1021/ac402894z
Zeng, Z., Zhang, W., Arvapalli, D. M., Zboril, R., Georgakilas, V., and Giannelis, E. P. (2017). A fluorescence-electrochemical study of carbon nanodots (CNDs) in bio-and photoelectronic applications and energy gap investigation. Phys. Chem. Chem. Phys. 19, 20101–20109. doi: 10.1039/C7CP02875J
Keywords: spherical polyelectrolyte brushes, SAXS, carbon dots, fluorescence sensor, lead ions
Citation: Tian Y, Kelarakis A, Li L, Zhao F, Wang Y, Wang W, Yang Q, Ye Z and Guo X (2018) Facile Fluorescence “Turn on” Sensing of Lead Ions in Water via Carbon Nanodots Immobilized in Spherical Polyelectrolyte Brushes. Front. Chem. 6:470. doi: 10.3389/fchem.2018.00470
Received: 31 July 2018; Accepted: 18 September 2018;
Published: 09 October 2018.
Edited by:
Paul A. Bingham, Sheffield Hallam University, United KingdomReviewed by:
Chih-Ching Huang, National Taiwan Ocean University, TaiwanYang-Wei Lin, National Changhua University of Education, Taiwan
Copyright © 2018 Tian, Kelarakis, Li, Zhao, Wang, Wang, Yang, Ye and Guo. This is an open-access article distributed under the terms of the Creative Commons Attribution License (CC BY). The use, distribution or reproduction in other forums is permitted, provided the original author(s) and the copyright owner(s) are credited and that the original publication in this journal is cited, in accordance with accepted academic practice. No use, distribution or reproduction is permitted which does not comply with these terms.
*Correspondence: Antonios Kelarakis, kelarakis@uclan.ac.uk
Li Li, lili76131@ecust.edu.cn
Xuhong Guo, guoxuhong@ecust.edu.cn