Electrochemical Generation and Detection of Transient Concentration Gradients in Microfluidic Channels. Theoretical and Experimental Investigations
 Thomas Abadie
  Laurent Thouin
- PASTEUR, Département de chimie, École normale supérieure, PSL University, Sorbonne Université, CNRS, Paris, France
Transient concentration gradients generated and detected electrochemically in continuous flow microchannels were investigated by numerical simulations and amperometric measurements. Operating conditions including device geometry and hydrodynamic regime were theoretically delineated for producing gradients of various profiles with tunable characteristics. Experiments were carried out with microfluidic devices incorporating a dual-channel-electrode configuration. Under these conditions, high electrochemical performance was achieved both to generate concentration gradients and to monitor their dynamics along linear microchannels. Good agreement was observed between simulated and experimental data validating predictions between gradient properties and generation conditions. These results demonstrated the capability of electrochemical microdevices to produce in situ tunable concentration gradients with real-time monitoring. This approach is versatile for the active control in microfluidics of microenvironments or chemical gradients with high spatiotemporal resolution.
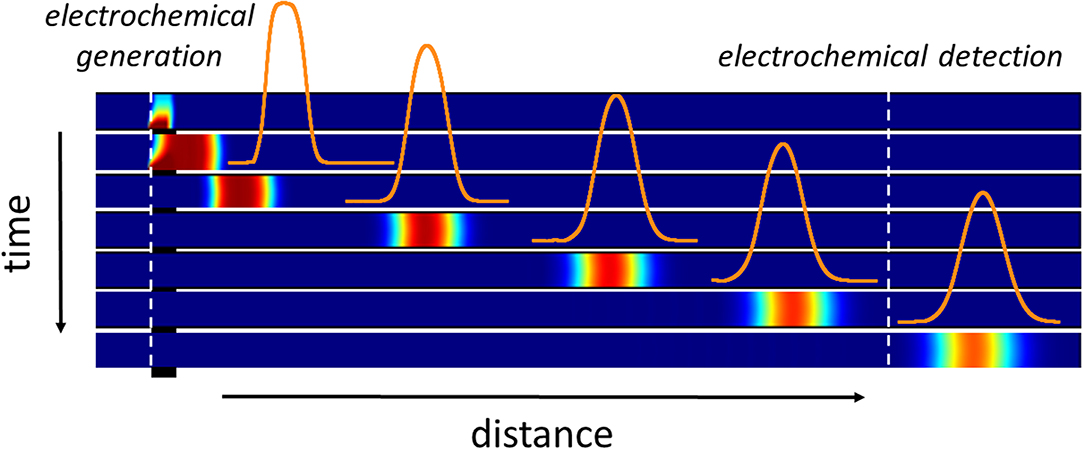
Graphical Abstract. Illustration of the electrochemical generation of a concentration gradient within the microchannel. Variation of the concentration profiles as a function of time and distance from the first working electrode.
Introduction
In recent years, microfluidic devices have been used in biomolecular and chemical gradient generation with special interest. Spatial and temporal concentration gradients play an important role in many biological assays. They reproduce cellular environments at the microscale and stimulate various cell behaviors such as cell growth, embryogenesis, wound healing, and cancer metastasis (Toh et al., 2013; Somaweera et al., 2016). Chemical gradients are applied to other fields such as chemotaxis (Kim et al., 2010; Mahdavifar et al., 2013), drug design (Chen et al., 2012), and chemical synthesis (Abou-Hassan et al., 2009). They are also relevant for sensor calibration and sample quantification (Wojtowicz et al., 2007). Microfluidics is particularly amenable to gradient generation as length scales in fluid processes are considerably reduced (Whitesides, 2006; Chiu et al., 2017). Apart from processes involving serial dilutions (Wan and Yin, 2018; Jeon et al., 2019), microfluidic systems offer alternative strategies to macroscale methods to achieve tailored gradient profiles (Wang, 2009) with unprecedented spatiotemporal resolutions (Weibel and Whitesides, 2006; Mark and Haeberle, 2010; Velve-Casquillas et al., 2010; Wang et al., 2017). However, the capability of microfluidics to produce tunable concentration gradients with real-time probing is still challenging. Laminar flow based generators are limited to the production of arbitrary profiles (Lee et al., 2009) whose reliability relies heavily on fluid replenishment and accurate flow control. Few studies have focused on the generation of controllable concentration gradients combined with concentration monitoring. In this context, electrochemical reactions in microfluidic systems hold considerable promise both for generation (Mitrovski and Nuzzo, 2005; Klauke et al., 2006; Liu and Abbott, 2011; Contento and Bohn, 2014; Xu et al., 2015) and detection (Contento and Bohn, 2014) of concentration gradients. Indeed, electrochemical techniques are suitable for miniaturization and they are easy to implement in microfluidic devices. Moreover, they provide better sensitivity compared to optical techniques (Gencoglu and Minerick, 2014). In parallel, they can be exploited to develop strategies based on the active control of microenvironments. As examples, some electrochemical approaches have demonstrated the dynamic control of pH in constrained volumes (Fomina et al., 2016; Balakrishnan et al., 2018) or the on-demand oxygen generation (Xu et al., 2015). Applications are immediate in biology but these approaches also open new avenues for the implementation of biochemistry and efficient chemistry. They are not only limited in the production of concentration gradients of electroactive species since non-electroactive species can be also generated by fast and homogeneous chemical reactions coupled to electrode reactions. Despite the potential of electrochemistry for exerting precise regulation or local modulation, the majority of electrochemical platforms are used for passive sensing (Li et al., 2013, 2014, 2018; Oliveira et al., 2013, 2018; Bellagha-Chenchah et al., 2015; Horny et al., 2016; Anderson and Crooks, 2017; Wan and Yin, 2018) rather than for active control.
In this work, we investigated through a conceptual approach the electrochemical generation and/or monitoring of transient concentration gradients within microchannels (Graphical Abstract). This concept relies on a dual-channel-electrode configuration operating in generator-collector mode under potentiostatic conditions (Figure 1A). Such systems have been exploited to study homogeneous reaction kinetics (Unwin and Compton, 1989; Fisher and Compton, 1991; Unwin, 1991; Bitziou et al., 2013), catalysis (Dumitrescu et al., 2012), corrosion (Itagaki et al., 1997; Sasaki and Maeda, 2010), and reaction products (Wang et al., 2010). They have also been used for surface titration (Anderson et al., 2017), analyte differentiation (Bitziou et al., 2014; Hu and Fritsch, 2016), and flow velocity determination (Amatore et al., 2004). Operating regimes in these systems can be easily tuned to enhance mass transfer between electrodes and to achieve high collection efficiency with fast kinetics. In combination, numerical modeling facilitates the analysis of experimental results by the identification of key parameters (Amatore et al., 2008a; Holm et al., 2019). Nevertheless, investigations on dual channel-electrodes have been mainly conducted for steady-state processes under conditions similar to those experienced at rotating ring-disk electrodes. They do not exploit the dynamic processes initially established between electrodes. At short time scale, transient gradients can be produced at an electrode with concentration amplitude and length that are a function of the operating conditions and residence time along microchannels (Amatore et al., 2011b). In comparison to generation methods based on microfluidic systems, concentration gradients are produced along the microchannel and not transversally. Concentration gradients of different shapes can be generated temporally to allow for example a sequence of various stimulus patterns at a specific location downstream of the generating electrode. Complex fluidic network with multiple inlets are not required as in microfluidic systems where flowing streams are combined in a gradient chamber after a series of splitting and mixing steps. In these cases, the design of the network defines the shape of concentration gradients and the number of branches determines their spatial resolution (Dertinger et al., 2001; Yang et al., 2002; Lin et al., 2004). The number of splitting steps improves also the stability and accuracy of the gradients but it leads in turn to the design of large networks and greater possibilities of blocking or leakage due to high input driving pressure. Finally, shearing is introduced by increasing the speed of gradient generation within the chamber.
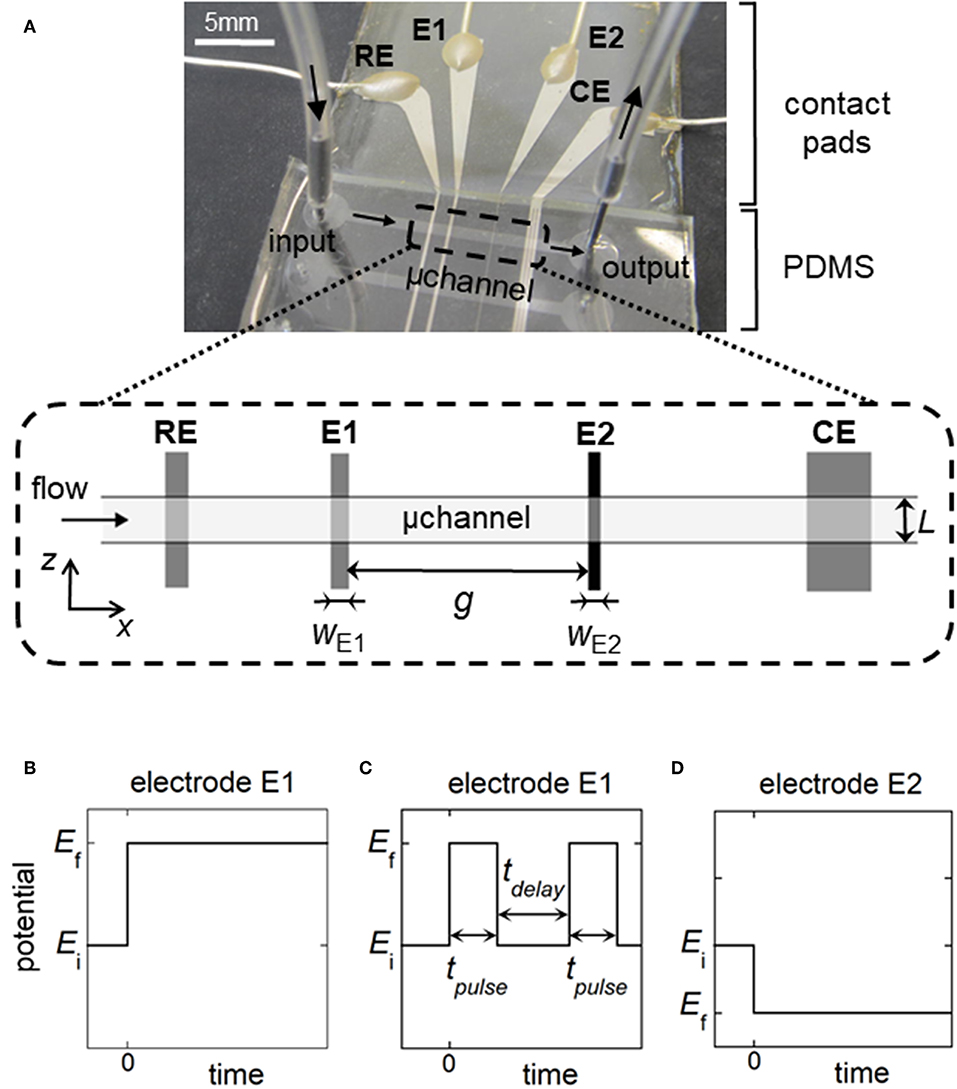
Figure 1. (A) Top view of the microfluidic device showing the relative positions of the reference electrode (RE), working electrodes (E1, E2), and counter electrode (CE) within a rectangular microchannel of width L. wE1 and wE2 are the electrode sizes. g is the gap distance between the working electrodes. (B,C) Potential pulses for generation of concentration gradients at E1: single step of potential for fronts (B), double step of duration tpulse for generation of plugs or peaks (C). tdelay is the time delay between two potential pulses. (D) Potential pulse at E2 for the detection of fronts, plugs, or peaks. In (B–D), Ei is the initial potential and Ef is the final potential.
The first advantage of the dual-channel-electrode configuration is straightforward. Generation of concentration profiles can be fully controlled at the first electrode leading to a precise and tunable regulation of species produced during the electrochemical reaction. The second advantage is that the electrode located downstream can be employed to monitor the gradients and their dynamics, at a given distance or time. The process involved between electrodes depends on the diffusive and convective regimes encountered in microchannels. In the following, the electrochemical generation of transient concentration gradients was examined theoretically and experimentally in linear microfluidic microchannels. Numerical simulations were carried out to predict gradient profiles with specific and tunable characteristics. Overall operating conditions were investigated according to the device geometry, flow velocity, and potential pulses applied to the electrodes. In parallel, experiments were performed using the dual-channel-electrode configuration to electrochemically generate and detect transient concentration gradients. Comparisons between theoretical and experimental data were established to assess the validity of the predictions.
Materials and Methods
Materials and Reagents
Aqueous solutions of 0.5 × 10⁻³ mol L−1 ferrocene methanol (97% Acros organics) were prepared in 0.1 mol L−1 potassium chloride (99% Fluka) used as supporting electrolyte. Water was preliminary purified by a Milli-Q purification system. Under such conditions, the diffusion coefficient of ferrocene methanol and ferricinium methanol was equal to D = 7.6 × 10⁻⁶ cm2 s−1 (Amatore et al., 2011a). The standard potential of the redox couple was estimated to 0.1 V/RE.
Electrochemical Platforms
The microfluidic devices consisted of hybrid PDMS-glass chips. Their design and microfabrication were reported in previous works (Amatore et al., 2004, 2007). Linear channels of 1.5 cm length with rectangular sections (height h = 20 or 24 μm, width L = 510 or 790 μm) were made by casting polydimethylsiloxane (PDMS, RTV-615; Momentive Performance Materials) onto a patterned mold of SU-8 2015 photoresist (Microchem). Inlet and outlet tubes were punched in the PDMS layer. Each device comprised three parallel microchannels. During one experiment, only one microchannel was filled with flowing solutions, the others remaining empty. Platinum microband electrodes (Ti/Pt with 20 nm/40 nm thickness) were patterned on the glass substrate by soft lithography and deposited using a sputtering coater (K675XD; Emitech). The reference electrode (RE) was fabricated by sputtering 50 nm Ag onto the underlying Pt surface. After the lift-off procedure, the PDMS and the glass slide were exposed to air plasma (Harrick) before bonding them together irreversibly. The electrodes being oriented perpendicular to the section of the main channel, the microband lengths were delimited by the channel width L. The reference electrode (RE) and counter electrode (CE) were 200 and 600 μm width, respectively. Before use, RE was oxidized by 5 × 10⁻³ mol L−1 FeCl3 (Sigma) solution. The width of the first working electrode (E1) was 97 or 200 μm. The width of the second working electrode (E2) was 17 or 30 μm. The gap between E1 and E2 ranged from 400 to 2600 μm.
Electrochemical Experiments
All electrochemical experiments were performed at room temperature using a homemade multipotentiostat adapted from an original design (Maisonhaute et al., 2001). The ferrocene methanol solution was flowing continuously within the microchannel. During electrochemical generation, electrode E1 was biased at E = 0.35 V/RE on the oxidation plateau of ferrocene methanol. For electrochemical detection, E2 was biased at E = −0.15 V/RE. The amperometric responses of both electrodes were monitored simultaneously. The flow within the microchannel was pressure driven by means of a syringe pump (Harvard Apparatus, type 11 Pico Plus). The average flow velocities were calibrated following a known procedure (Amatore et al., 2004).
Numerical Simulations
Concentration profiles and current responses of electrodes were numerically evaluated by solving the mass transport equation with appropriate boundary conditions (Amatore et al., 2011b). Flow was considered laminar with a parabolic velocity profile. Since the microchannel width is much larger than the working electrode widths, the diffusional contribution at each end of working electrodes is negligible. The formulation of the problem was thus reduced in a 2D space. COMSOL Multiphysics 5.4 software was used to perform finite element simulations with the introduction of dimensionless parameters.
Results and Discussion
Principle
The electrochemical cell is based on a four-electrode configuration including two working electrodes. The top view of the device is shown in Figure 1A. All the electrodes are positioned on the microchannel floor. The pseudo-reference electrode is located upstream to ensure its potential stability during the electrochemical cell operation. The counter electrode is situated downstream to not influence the two working electrodes. The first working electrode E1 generates concentration gradients by oxidizing or reducing electroactive species initially present in flowing solution. The second electrode E2 detects downstream the generated gradients by scanning their passage. The two working electrodes are separated by a given gap distance and operate in generator-collector mode. In such a situation, E1 and E2 are biased independently at potentials that ensure in chronoamperometry the control of electrochemical reactions by mass transfer. Two types of potential pulses is applied at E1: a single step or a double step of potential (Figures 1B,C). In both cases, E2 is biased at a constant potential (Figure 1D). As illustrated in Figure 2, different profiles of concentration gradient can be produced according to the potential pulses at E1. In the case of a single step (Figure 1B), the ensuing gradient is a front of concentration that propagates along the microchannel with concentrations ranging from an initial to a maximal level. In the case of a double step of duration tpulse (Figure 1C), the gradient is in the form of a concentration pulse having peak shape or plug shape (Figure 2). Peaks are generated at short tpulse over small distances. In contrast to peaks, plugs are established at longer tpulse over larger distances. They display a plateau with a maximal concentration amplitude. The concentration ch reached at maximum for plugs and concentration fronts depends on the average flow velocity and device geometry (i.e., microchannel height and size of E1) (Amatore et al., 2007). ch is lower or equal to the concentration c0 of electroactive species consumed at E1. All parameters including tpulse define the operating conditions to tune the gradient profiles at a given location or residence time along the microchannel. Since the concentration gradients are submitted to Taylor-Aris dispersion, they evolve with time (Taylor, 1953; Aris, 1956; Dutta et al., 2006). Hence, the dynamic of the overall process from generation to propagation is controlled by diffusion and convection. Gradient profiles can be monitored downstream by E2 during detection. Indeed, provided that specific conditions are fulfilled, E2 can operate as a concentration probe (Amatore et al., 2011a). In this case, the current response at E2 strictly reflects the concentration variation at the electrode location without any temporal distortion. This property allows establishing the gradient profiles from the current responses.
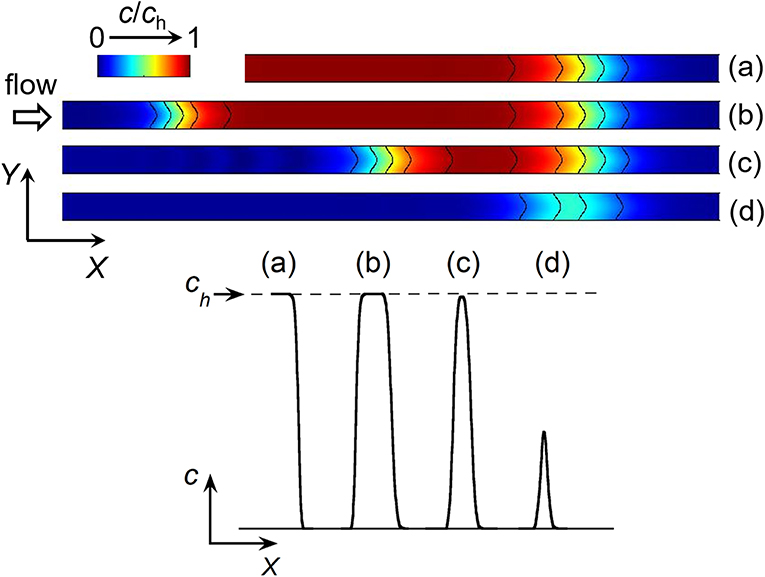
Figure 2. Top: Side view of simulated concentration profiles at a given time between the two working electrodes E1 and E2 in a linear microchannel: front (a), plug (b), and peak (c,d). The black solid curves on the concentration profiles represent isoconcentration lines. Bottom: Concentration variations along X-axis illustrating the different types of concentration gradient. ch is the maximal concentration reached within a front (a) or plug (b).
Theoretical Predictions for Generating Concentration Gradients
In the following, numerical simulations were performed in order to delineate the conditions for generating each type of concentration gradient as a function of the device geometry and hydrodynamic flow. A laminar regime was considered with a parabolic velocity profile. The width of the microchannel was supposed sufficiently large vs. its height to neglect the influence of walls along the flow direction. A two-dimensional system was thus introduced with dimensionless parameters for:
- coordinates and with h the microchannel height,
- concentration of generated species with c0 the initial concentration of species at the entrance of the microchannel,
- size ,
- distance ,
- flow velocity with Pe the Peclet number, uav the average velocity within the microchannel and D the diffusion coefficient of species,
- and time .
The origin of coordinates X and Y is the downstream edge of electrode E1.
Generation of Concentration Fronts
Simulations were performed under operating conditions corresponding to a single step experiment at E1 (Figure 1B). Conditions were first studied to produce well-established concentration fronts, i.e., displaying parallel isoconcentration lines along the gradient width. Figure 3A shows some simulated concentration profiles as a function of time of species generated at E1. As observed, the amplitude of the concentration front is set by the maximal concentration Ch reached under these conditions. Ch is a steady concentration, which depends only on electrode size WE1 and flow velocity Pe. In convective regime and when WE1/Pe < 0.2, Ch is given by the equation (Amatore et al., 2007):
In the following, the front is considered as fully established as soon as two isoconcentration lines characterizing the gradient width become parallel and symmetrical in shape. In Figure 3A, the black lines represent isoconcentration lines monitored for C/Ch = 0.99 (C99) and C/Ch = 0.01 (C01), respectively. In this case, the criterion is fulfilled when C99 displays the same steady shape as C01 located downstream. As shown in Figure 3A, C99 develops at E1 and then splits into two parts (at τ = 0.65). One is a steady-state isoconcentration line C99 originating from the upstream edge of E1. The other is the isoconcentration line C99 corresponding to the propagation of concentration front downstream. This is only after a given residence time τs that this line C99 becomes symmetrical and identical in shape to C01 (Figure 3A, τs = 0.85). Figure 3B illustrates its evolution at different times for a given electrode size WE1 and flow velocity Pe. τs can be estimated when both X coordinates of C99, at Y = 0 (microchannel floor) and Y = 1 (microchannel top), start to coincide. At time τs, the above criterion is met with Gs the X coordinate of C99 and Ws the minimal width of concentration front between C99 and C01 (see also Figure 3A). Note that contrary to the velocity profile of laminar flow, the resulting isoconcentration lines are not parabolic. Indeed, close to the walls (at Y = 0 and Y = 1) the flow velocity is low, leading to the prevalence of transversal diffusion and subsequent adjustment of concentration profile from the parabolic one (Amatore et al., 2008b).
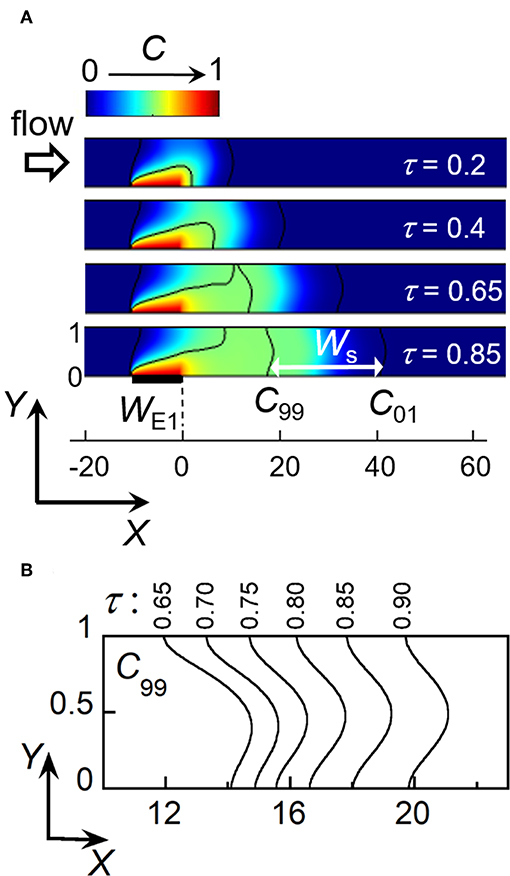
Figure 3. Electrochemical generation of a concentration front and its propagation within a linear microchannel. (A) Simulated concentration profiles as a function of time at location close to electrode E1. Ws is the minimal width between isoconcentration lines C99 (C/Ch = 0.99) and C01 (C/Ch = 0.01) at time τs = 0.85. (B) Evolution downstream of the isoconcentration line C99 for times τ between 0.65 and 0.9. In (A,B), WE1 = 10 and Pe = 40.
Figure 4 reports variations obtained from simulations of τs, Gs and Ws as a function of Pe, for several sizes WE1 of electrode E1 ranging from 0.8 to 10. In convective regimes, when Pe > 30, data show that τs does not depend on WE1. τs is almost constant with an average value close to 0.85 (Figure 4A). Distance Gs varies linearly with Pe (Figure 4B) according to the relation:
The factor 0.6 corresponds here to the average time Gs/Pe required by C99 to reach its steady shape at distance Gs from the downstream edge of E1. This time is lower than τs since it does not include the time delay needed for C99 to develop over the electrode surface. At τs, Ws is almost independent on WE1 (Figure 4C) but depends strongly on Pe. When Pe > 30, a linear relation is clearly noticed with:
Indeed, the generation of concentration front is fully controlled by diffusion and convection. After being established at time τs, concentration gradients propagate under the influence of hydrodynamic dispersion given by Taylor-Aris theory. If Wf is the width of concentration front at times higher than τs, Wf necessarily follows the relation for solute dispersion under pressure-driven flow with (Dutta et al., 2006):
γf is a constant whose value depends on Wf, i.e., on the couple of isoconcentration lines considered to characterize Wf. Simulations were thus performed at times higher than τs to estimate γf from Equations (4) and (5). Figure 4D shows Kf data evaluated from Wf with three couples of isoconcentration lines (C99, C01), (C90, C10), and (C75, C25). As expected in Equation (5), two limiting behaviors are obtained according to Pe with transitions occurring close to the critical value ~ 15. By fitting Kf variations with Equation (5), the constant γf was estimated to γf = 40 for (C99, C01), γf = 13 for (C90, C10), and γf = 3.6 for (C75, C25). Data showed also that when Pe > 30, Equation (4) was equivalent to Equation (3) for (C99, C01) with γf = 40 Under these conditions, it can be assumed that at τs concentration fronts are controlled by Taylor-Aris dispersion.
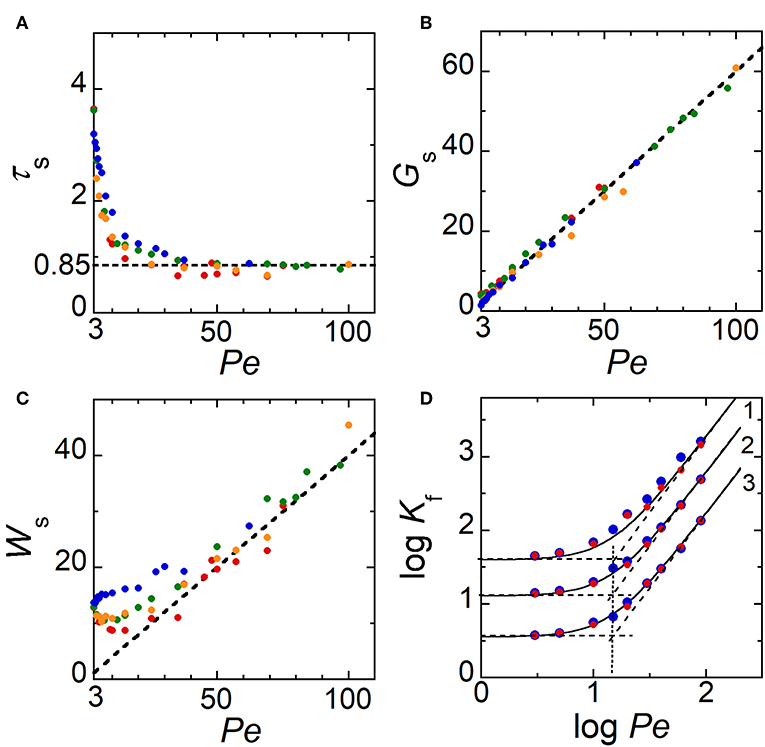
Figure 4. (A–C) Theoretical variations of τs, Gs, and Ws as a function of Pe for several electrode sizes WE1. The dashed lines correspond to τs = 0.85, Gs = 0.6 Pe, and Ws = 0.4 Pe, respectively. (D) Variation of log Kf as a function of log Pe for three couples of isoconcentration lines: 1 (C99, C01); 2 (C90, C10), and 3 (C75, C25). The solid lines correspond to Equation (5) when γf = 40 (C99, C01), γf = 13 (C90, C10), and γf = 3.6 (C75, C25). Dashed lines represent the two limiting cases. In (A–C), symbols correspond to data evaluated from numerical simulations with WE1 = 9.85 (blue), 4.85 (orange), 2.85 (green), and 0.85 (red). In (D), WE1 = 10 (blue) and 1 (red).
Therefore, Equations (1)–(5) and γf values are useful for predicting the positions of the generated concentration fronts, their concentration amplitude Ch and width Wf along the microchannel, according to flow velocity Pe and time. These predictions are independent of the range of electrode width WE1 investigated. Note also that under these operating conditions, the duration of E1 polarization allows establishing and controlling within the microchannel a zone of homogeneous concentration Ch downstream of E1.
Generation of Concentration Pulses
Simulations were performed under operating conditions corresponding to a double step of potential at E1 (Figure 1C). As an example, Figure 5A illustrates the generation of a concentration pulse as a function of time. Concentration pulses are well-established with symmetric shape after a time delay necessarily higher than τs. According to τpulse and Pe, concentration pulses can be observed under the form of peaks or plugs (Figures 5B,C). Each type of concentration gradient is characterized by a position Xmax, concentration amplitude Cmax/Ch, and width Wg at half height. Note that Ch is given by Equation (1) and Cmax/Ch is equal to 1 for plugs only. Since plugs transform to peaks with time due to hydrodynamic dispersion, the objective was to examine the operating conditions governing their production (τpulse and Pe) and characteristics (Xmax, Cmax/Ch, and Wg). Wg is defined here as the width of concentration pulse. Since Taylor-Aris dispersion operates as a function of τ1/2 (see Equation 4), the ratio τpulse/τ1/2 was selected as the parameter to account for the operating conditions. In parallel, the ratio Δτg/τ1/2 is the parameter that was chosen for characterizing the concentration gradients with Δτg = Wg/Pe. Figure 6A gives the variations of Δτg/τ1/2 as a function of τpulse/τ1/2 for various electrode sizes WE1 and velocity Pe. At each Pe, a same trend was noticed whatever WE1. Indeed, at low τpulse/τ1/2 corresponding to peak generation, Δτg/τ1/2 is constant and independent of τpulse/τ1/2. In this case, the influence Taylor-Aris dispersion on the concentration gradient is maximal. Conversely, for higher τpulse/τ1/2 corresponding to plug generation, Δτg/τ1/2 varies linearly with τpulse/τ1/2 with a slope equal to 1, evidencing the equality between Δτg and τpulse. In this case, Taylor-Aris dispersion occurs but is negligible with respect to the large width of plugs. Hence, it is possible from Figure 6A to delineate the conditions leading to the production of peaks or plugs. In Figure 6A (insert), a threshold value of τpulse/τ1/2 was evaluated at each Pe by extrapolating the two limiting behaviors. This investigation is resumed in Figure 6B by plotting data in a zone diagram (Pe, τpulse/τ1/2) in order to delimit conditions for observing either peaks or plugs. In this zone diagram, the upper area corresponds to plugs while the lower area stands for peaks. It is possible to derive the equation of the boundary in Figure 6B by considering the influence of Taylor-Aris dispersion on Wg (Figures 5B,C) with:
γg is the constant defined for concentration pulses.
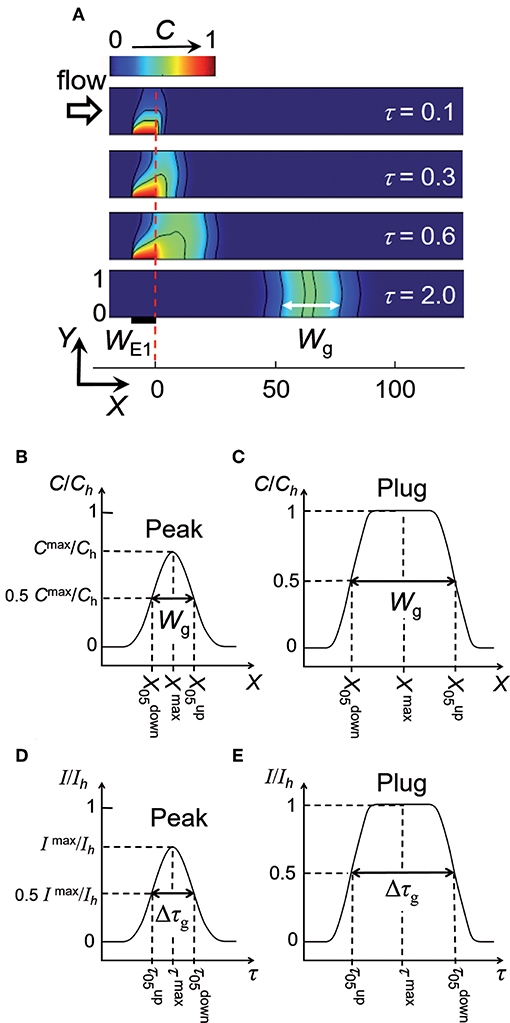
Figure 5. (A) Electrochemical generation of a concentration peak and its propagation within a linear microchannel. Concentration profiles are reported at different times τ. WE1 = 10, Pe = 40 and τpulse = 0.6. Wg is the width defined between the two isoconcentration lines C50. (B,C) Characteristic parameters of peaks and plugs deduced from concentration variations along X-axis. (D,E) Characteristic parameters of peaks and plugs deduced from current responses monitored at electrode E2. Ih is the maximal current reached for fronts or plugs.
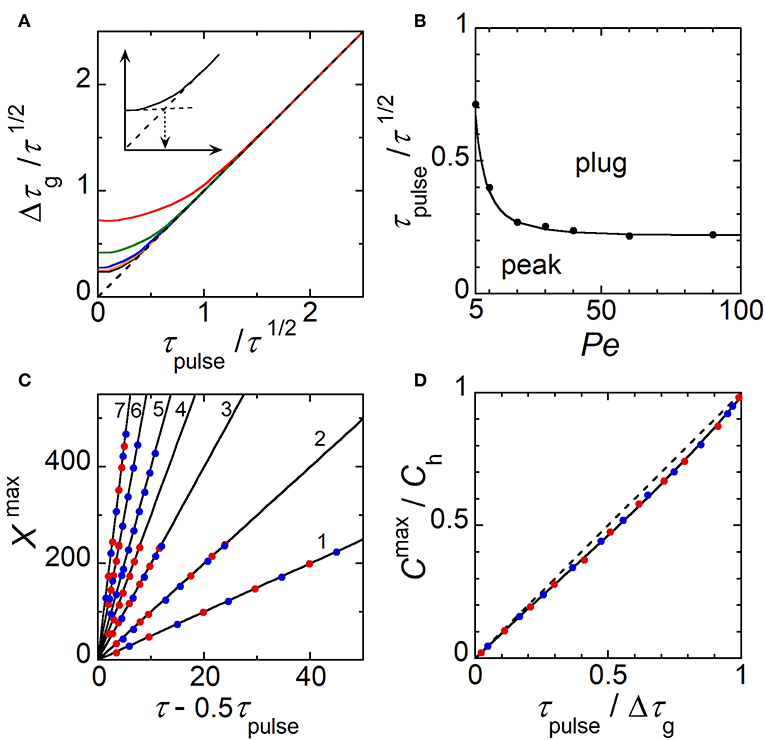
Figure 6. (A) Variations of Δτg/τ 1/2 as a function of τpulse/τ½ for various Pe: Pe ≥ 40 (black), Pe = 30 (orange), Pe = 20 (blue), Pe = 10 (green), and Pe = 5 (red). WE1 ranged from 1 to 10. The dashed line represents the limiting behavior Δτg/τ 1/2 = τpulse/τ½. Insert shows extrapolation from the two limiting behaviors. (B) Zone diagram (Pe, τpulse/τ½) giving the operating conditions for generating peaks and plugs, respectively. The solid line corresponds to Equation (9) with γg = 10. Symbols correspond to evaluations from simulations. (C) Variation of Xmax as a function of τ – 0.5τpulse for Pe = 5 (1), 10 (2), 20 (3), 30 (4), 40 (5), 60 (6), and 90 (7). (D) Variation of Cmax/Ch as a function of τpulse/Δτg. The dashed line is the equation Cmax/Ch = τpulse/Δτg. In (C,D), WE1 = 10 (blue) and 1 (red).
Indeed, the boundary corresponds in Figure 6A to the following equality:
By combining Equations (6) and (8), it leads to:
In order to check Equation (9) and to assess γg, a fit of the boundary in Figure 6B was performed. In this case, γg was found equal to 10. Therefore, at low τpulse/τ1/2 corresponding to peak generation (lower area of the zone diagram), Wg can be evaluated from Equations (6) and (7). At high τpulse/τ1/2 corresponding to plug generation (upper area of the zone diagram), Wg is easily deduced by:
At first glance, the time required for observing a concentration pulse at the position Xmax can be estimated from the velocity Pe and the time difference (τ – 0.5τpulse). Indeed, one expects for plugs the relation:
In Figure 6C, the simulated data show that Xmax varies linearly with (τ – 0.5τpulse) whatever τpulse and WE1. The slope is close to Pe demonstrating the validity of Equation (11), not only for plugs but also for peaks. Indeed, for peaks Xmax tends to Peτ as τpulse tends to zero.
The maximal concentration amplitude Cmax/Ch, which is a property of peaks, is approximatively equal to τpulse/Δτg as noticed in Figure 6D. Note that for plugs Cmax equals to Ch by definition, i.e., Cmax/Ch = 1.
The zone diagram in Figure 6B depicts in dimensionless parameters an infinity of operating conditions to generate electrochemically concentration gradients under the form of peak or plug. According to the electrode size WE1 and duration τpulse, their characteristics (i.e., shape, position Xmax, width Wg, and amplitude Cmax) can be modulated at a given distance X or residence time τ along the microchannel. Conditions and resulting properties of gradients that were delineated are summarized in Table 1.
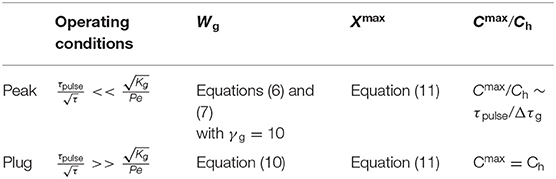
Table 1. Operating conditions and characteristics of concentration gradients generated under the form of peaks and plugs.
Detection of Concentration Gradients
The above predictions were checked experimentally by generating and detecting electrochemically some concentration gradients using a dual-working electrode configuration (Figure 1A). The principle of the detection relies on the fact that the second electrode E2 scans the passage of the concentration gradient over its surface as a function of time. In order to characterize accurately the gradient profile, the electrode must probe the concentration variation without any time delay or kinetic distortion. In a previous study, we demonstrated that some operating conditions at microchannel electrodes fulfill such a criterion (Amatore et al., 2011a). Indeed, when Pe > 15 in convective regime, the size of electrode E2 must be lower than the critical size given by:
Under these conditions, the electrode response in chronoamperometry strictly follows the concentration variation at the upstream edge of E2. Hence, experimental conditions were selected to produce and detect concentration fronts (Figure 7A), plugs (Figure 7B), and peaks (Figures 7C,D). The distance G separating E1 and E2 was sufficiently large to establish concentration gradients with symmetric profiles according to the experimental flow velocities used. In Figures 7A–D are reported the experimental and simulated current responses. The comparison between data led to a very good agreement showing the remarkable accuracy achieved both in predictions and in measurements. Under these conditions, the width of concentration pulses ranged between 446 and 1860 μm. Videos and Figures showing simulated data during the generation, propagation, and detection of a plug (Video S1, Figure S1) and a peak (Video S2, Figure S2) are provided in Supplementary Materials.
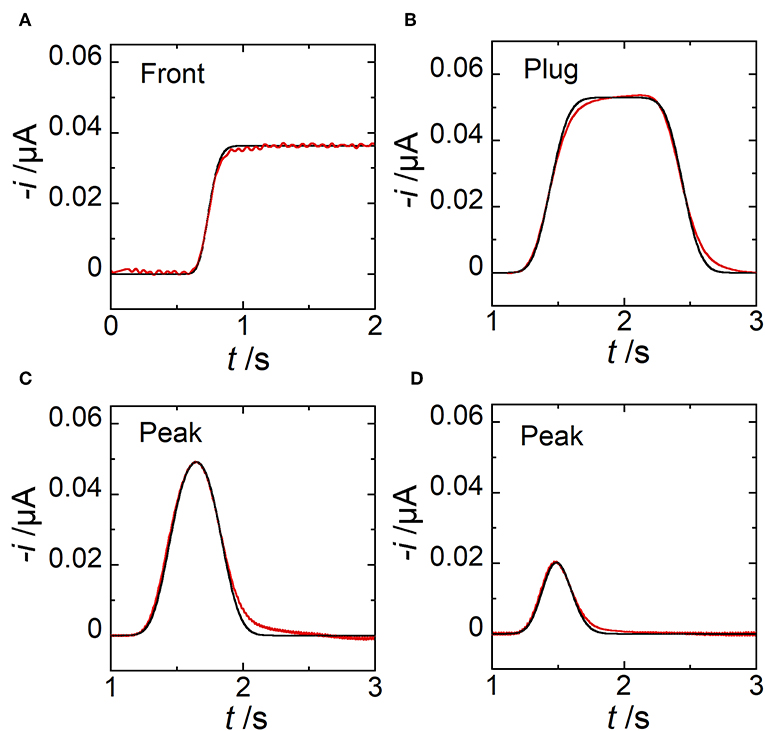
Figure 7. Comparison between simulated (black lines) and experimental (red lines) current responses monitored at electrode E2. (A) Case of a concentration front. (B) Case of a concentration plug with tpulse = 1 s. Estimated wg = 1860 μm. (C) Case of a concentration peak with tpulse = 0.4 s. Estimated wg = 744 μm. (D) Case of a concentration peak with tpulse = 0.1 s. Estimated wg = 446 μm. In (A) wE1 = 97 μm, wE2 = 17 μm, g = 1000 μm, h = 20 μm, l = 510 μm, uav = 0.86 μL min−1, and c0 = 0.63 mM. In (B–D) wE1 = 200 μm, wE2 = 30 μm, g = 2600 μm, h = 24 μm, l = 790 μm, uav = 2.12 μL min−1, and c0 = 0.38 mM. In (A–D), each curve is related to a single experiment.
Extended investigations were thus performed by analyzing the profiles of electrode response (Figures 5D,E) as it was previously realized for concentration profiles (Figures 5B,C). Indeed, like in Figure 6, variations can be established from current responses provided that the concentration gradients do not evolve significantly during their complete detection (i.e., during the time required by E2 to scan the width Wg of concentration gradient). According to the range of conditions investigated below, the ratio ΔWg/Wg did not exceed 0.1 with ΔWg the variation of Wg estimated during detection. Other parameters were considered by introducing the average time G/Pe and the duration Δτg of current curves at half height. Current was normalized by the maximal current Ih reached during plug detection and a corresponding time τmax was defined accordingly (Figures 5D,E). Therefore, similar variations were established from simulated current responses (Figure 8). By plotting Δτg/(G/Pe)1/2 as a function of τpulse/(G/Pe)1/2, a same trend was observed whatever WE1 at Pe higher than 30 (compare Figure 8A with Figure 6A). Similarly, variation of Imax/Ih as a function of τpulse/Δτg was almost linear (Figure 8B). Finally, as for Equation (11) a relationship could be derived between τmax and G/Pe with:
Corresponding data are reported in Figure 8C. Note that this equation is relevant since it provides a mean to estimate with accuracy the average flow velocity inside microchannel. Working curves established in Figure 8 are complementary tools to those given in Figure 6 since they allow performing similar predictions based here on the monitoring of concentration gradients at E2. These variations were assessed experimentally under wide operating conditions leading to the generation of various gradient profiles. According to the experimental conditions, the width wg of concentration pulses ranged from 430 to 1870 μm while tmax ranged from 0.75 to 3 s. In Figures 8A–C are plotted together experimental (symbols) and simulated current responses (lines). A perfect agreement was noticed for every characteristics Δτg, Imax/Ih and τmax of the current responses. Therefore, these results validated the underlying concept, which associates the electrochemical generation and the monitoring of transient concentration gradients. Tunable gradients can be predicted from Table 1 and be produced experimentally under extended operating conditions.
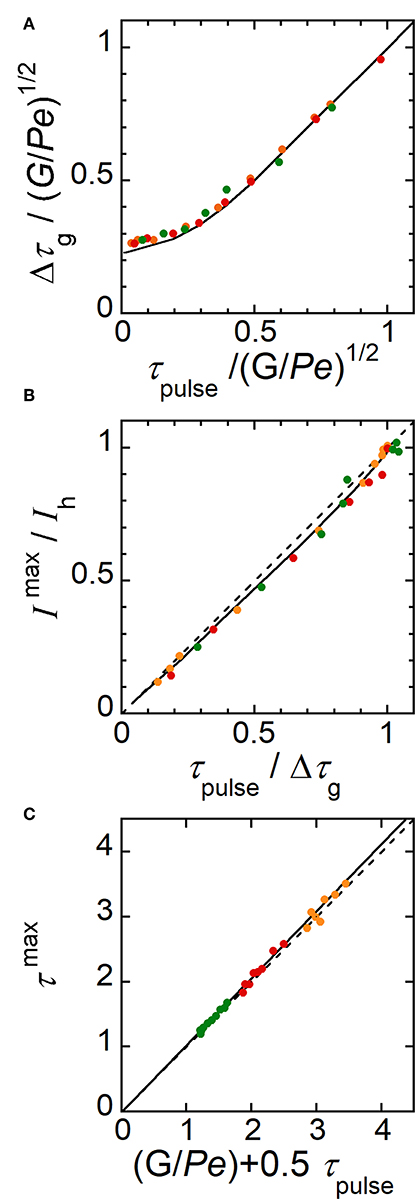
Figure 8. Characteristic parameters evaluated theoretically (solid lines) and experimentally (symbols) from current responses monitored at electrode E2. (A) Plot of Δτg/(G/Pe)1/2 as a function of τpulse/(G/Pe)1/2. (B) Plot of Imax/Ih as a function of τpulse/Δτg. The dashed line is the equation Imax/Ih = τpulse/Δτg. (C) Plot of τmax as a function of (G/Pe + 0.5τpulse). The dashed line is the equation τmax = G/Pe + 0.5τpulse. In (A–C), experimental flow rate uav = 1.40 μL min−1 (green), 2.12 μL min−1 (red), and 3.27 μL min−1 (orange). wE1 = 200 μm, wE2 = 30 μm, g = 2600 μm, h = 24 μm, l = 790 μm, and c0 = 0.38 mM. tpulse ranged from 0.1 to 1 s. In (A–C), each data is related to a single experiment.
The commutation between different types of concentration gradient can be very fast. To demonstrate further the electrochemical performance achieved under these conditions, extra experiments were carried out with two consecutive potential pulses at electrode E1 (Figure 1C). Two concentration peaks were generated within the microchannel by imposing relatively short time delay tdelay vs. tpulse. In this case, peaks may partially overlap or even merge into one single peak. Three different operating conditions were investigated in Figure 9. For comparison, experimental (symbols) and simulated (lines) current responses were reported together. As expected, two peaks were produced and monitored successively. Under these conditions, by decreasing to some extent the time delay tdelay, peaks partially merged, producing intricate patterns. In this situation, the benefit of simulations was to decipher graphically the individual peak contributions from the overall response. As shown in Figure 9, a good agreement was obtained between data, demonstrating the performance in predicting, and generating potentially complex profiles of concentration gradients. In particular, these examples evidenced the high spatiotemporal resolution achieved experimentally that enables to tune and monitor concentration gradients under conditions close to peak convolution.
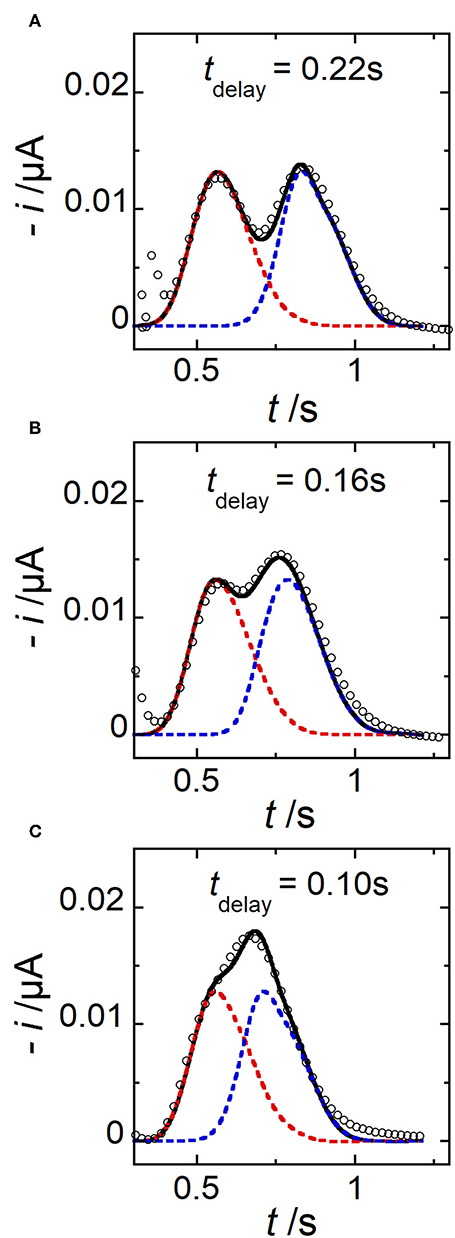
Figure 9. Comparison between simulated (lines) and experimental (symbols) current responses monitored at electrode E2 in the case of two consecutive peaks generated for three different tdelay. (A) tdelay = 0.22 s. (B) tdelay = 0.16 s. (C) tdelay = 0.10 s. In (A–C), tpulse = 0.06 s, wE1 = 200 μm, wE2 = 30 μm, g = 400 μm, h = 20 μm, l = 790 μm, c0 = 0.33 mM, and uav = 1 μL min−1. Each simulated peak is plotted in dashed line (red or blue). The solid line corresponds to the sum of peak contributions. Each current response is related to a single experiment.
Conclusion
A dual-working-electrode configuration was considered to generate and detect by amperometry transient concentration gradients in linear microchannels. Gradients can be produced with adjustable profiles depending on the flow velocity and the duration of potential pulse at a generator electrode. A zone diagram delineating all the operating conditions was established to accurately predict the resulting properties of concentration gradients. In parallel, experiments evidenced the high spatiotemporal resolution achieved for monitoring electrochemically dynamic concentrations. Predictions from numerical simulations associated with experimental validations showed thus the electrochemical performance for generating and controlling in situ concentration gradients. They also demonstrated the underlying concept that combines the generation of tunable concentration gradients in microfluidic channels with real-time monitoring. In comparison to generation methods based on microfluidic systems, complex fluidic networks are not required. The concentration gradients are produced along the microchannel, which allows various and consecutive stimulus patterns to be generated downstream. This investigation will certainly benefit a large number of bioanalytical applications for which physicochemical processes are induced locally by highly resolved concentration gradients.
Data Availability Statement
The datasets generated for this study are available on request to the corresponding author.
Author Contributions
TA and PP were early stage researchers. They contributed to the experimental measurements. CS performed the simulations and contributed with LT to data analysis. LT proposed the study. CS and LT contributed to the writing of the paper.
Funding
This work was supported by CNRS, Université PSL, and Sorbonne Université. TA acknowledges ED388 for a PhD grant. PP acknowledges ENS for a PhD grant.
Conflict of Interest
The authors declare that the research was conducted in the absence of any commercial or financial relationships that could be construed as a potential conflict of interest.
Supplementary Material
The Supplementary Material for this article can be found online at: https://www.frontiersin.org/articles/10.3389/fchem.2019.00704/full#supplementary-material
References
Abou-Hassan, A., Dufrêche, J.-F., Sandre, O., Mériguet, G., Bernard, O., and Cabuil, V. (2009). Fluorescence confocal laser scanning microscopy for pH mapping in a coaxial flow microreactor: application in the synthesis of superparamagnetic nanoparticles. J. Phys. Chem. C 113, 18097–18105. doi: 10.1021/jp9069459
Amatore, C., Belotti, M., Chen, Y., Roy, E., Sella, C., and Thouin, L. (2004). Using electrochemical coupling between parallel microbands for in situ monitoring of flow rates in microfluidic channels. J. Electroanal. Chem. 573, 333–343. doi: 10.1016/j.jelechem.2004.07.020
Amatore, C., Da Mota, N., Lemmer, C., Pebay, C., Sella, C., and Thouin, L. (2008a). Theory and experiments of transport at channel microband electrodes under laminar flows. 2. Electrochemical regimes at double microband assemblies under steady state. Anal. Chem. 80, 9483–9490. doi: 10.1021/ac801605v
Amatore, C., Da Mota, N., Sella, C., and Thouin, L. (2007). Theory and experiments of transport at channel microband electrodes under laminar flows. 1. Steady-state regimes at a single electrode. Anal. Chem. 79, 8502–8510. doi: 10.1021/ac070971y
Amatore, C., Da Mota, N., Sella, C., and Thouin, L. (2008b). General concept of high-performance amperometric detector for microfluidic (bio)analytical chips. Anal. Chem. 80, 4976–4985. doi: 10.1021/ac800227t
Amatore, C., Lemmer, C., Perrodin, P., Sella, C., and Thouin, L. (2011a). Theory and experiments of microelectrodes performing as concentration probes within microfluidic channels with high temporal resolution. Electrochem. commun. 13, 1459–1461. doi: 10.1016/j.elecom.2011.09.019
Amatore, C., Lemmer, C., Sella, C., and Thouin, L. (2011b). Channel microband chronoamperometry: from transient to steady-state regimes. Anal. Chem. 83, 4170–4177. doi: 10.1021/ac2004604
Anderson, M. J., and Crooks, R. M. (2017). Microfluidic surface titrations of electroactive thin films. Langmuir 33, 7053–7061. doi: 10.1021/acs.langmuir.7b01542
Anderson, M. J., Ostojic, N., and Crooks, R. M. (2017). Microelectrochemical flow cell for studying electrocatalytic reactions on oxide-coated electrodes. Anal. Chem. 89, 11027–11035. doi: 10.1021/acs.analchem.7b03016
Aris, R. (1956). On the dispersion of a solute in a fluid flowing through a tube. Proc. R. Soc. Lond. Ser. A 235, 67–77. doi: 10.1098/rspa.1956.0065
Balakrishnan, D., Lamblin, G., Thomann, J. S., Van Den Berg, A., Olthuis, W., and Pascual-Garcia, C. (2018). Electrochemical control of pH in nanoliter volumes. Nano Lett. 18, 2807–2815. doi: 10.1021/acs.nanolett.7b05054
Bellagha-Chenchah, W., Sella, C., Fernandez, F. R., Peroni, E., Lolli, F., Amatore, C., et al. (2015). Interactions between human antibodies and synthetic conformational peptide epitopes: innovative approach for electrochemical detection of biomarkers of multiple sclerosis at platinum electrodes. Electrochim. Acta 176, 1239–1247. doi: 10.1016/j.electacta.2015.07.158
Bitziou, E., Joseph, M. B., Read, T. L., Palmer, N., Mollart, T., Newton, M. E., et al. (2014). In situ optimization of pH for parts-per-billion electrochemical detection of dissolved hydrogen sulfide using boron doped diamond flow electrodes. Anal. Chem. 86, 10834–10840. doi: 10.1021/ac502941h
Bitziou, E., Snowden, M. E., Joseph, M. B., Leigh, S. J., Covington, J. A., Macpherson, J. V., et al. (2013). Dual electrode micro-channel flow cell for redox titrations: kinetics and analysis of homogeneous ascorbic acid oxidation. J. Electroanal. Chem. 692, 72–79. doi: 10.1016/j.jelechem.2012.12.014
Chen, C. Y., Wo, A. M., and Jong, D. S. (2012). A microfluidic concentration generator for dose-response assays on ion channel pharmacology. Lab Chip 12, 794–801. doi: 10.1039/c1lc20548j
Chiu, D. T., Demello, A. J., Di Carlo, D., Doyle, P. S., Hansen, C., Maceiczyk, R. M., et al. (2017). Small but perfectly formed? successes, challenges, and opportunities for microfluidics in the chemical and biological sciences. Chem 2, 201–223. doi: 10.1016/j.chempr.2017.01.009
Contento, N. M., and Bohn, P. W. (2014). Tunable electrochemical pH modulation in a microchannel monitored via the proton-coupled electro-oxidation of hydroquinone. Biomicrofluidics 8:044120. doi: 10.1063/1.4894275
Dertinger, S. K. W., Chiu, D. T., Jeon, N. L., and Whitesides, G. M. (2001). Generation of gradients having complex shapes using microfluidic networks. Anal. Chem. 73, 1240–1246. doi: 10.1021/ac001132d
Dumitrescu, I., Yancey, D. F., and Crooks, R. M. (2012). Dual-electrode microfluidic cell for characterizing electrocatalysts. Lab Chip 12, 986–993. doi: 10.1039/c2lc21181e
Dutta, D., Ramachandran, A., and Leighton, D. T. (2006). Effect of channel geometry on solute dispersion in pressure-driven microfluidic systems. Microfluid. Nanofluidics 2, 275–290. doi: 10.1007/s10404-005-0070-7
Fisher, A. C., and Compton, R. G. (1991). Double-channel electrodes - homogeneous kinetics and collection efficiency measurements. J. Appl. Electrochem. 21, 208–212. doi: 10.1007/BF01052572
Fomina, N., Johnson, C. A., Maruniak, A., Bahrampour, S., Lang, C., Davis, R. W., et al. (2016). An electrochemical platform for localized pH control on demand. Lab Chip 16, 2236–2244. doi: 10.1039/C6LC00421K
Gencoglu, A., and Minerick, A. R. (2014). Electrochemical detection techniques in micro- and nanofluidic devices. Microfluid. Nanofluidics 17, 781–807. doi: 10.1007/s10404-014-1385-z
Holm, T., Diaz Real, J. A., and Mérida, W. (2019). Numerical modeling of complex collection efficiency for double channel electrodes. J. Electroanal. Chem. 842, 115–126. doi: 10.1016/j.jelechem.2019.04.026
Horny, M. C., Lazerges, M., Siaugue, J. M., Pallandre, A., Rose, D., Bedioui, F., et al. (2016). Electrochemical DNA biosensors based on long-range electron transfer: investigating the efficiency of a fluidic channel microelectrode compared to an ultramicroelectrode in a two-electrode setup. Lab Chip 16, 4373–4381. doi: 10.1039/C6LC00869K
Hu, M., and Fritsch, I. (2016). Application of electrochemical redox cycling: toward differentiation of dopamine and norepinephrine. Anal. Chem. 88, 5574–5578. doi: 10.1021/acs.analchem.6b00427
Itagaki, M., Suzuki, T., and Watanabe, K. (1997). Channel flow double electrode study on anodic dissolution of molybdenum in sulfuric acid solution. Electrochim. Acta 42, 1081–1086. doi: 10.1016/S0013-4686(96)00253-8
Jeon, J., Choi, N., Chen, H., Moon, J. I., Chen, L., and Choo, J. (2019). SERS-based droplet microfluidics for high-throughput gradient analysis. Lab Chip 19, 674–681. doi: 10.1039/C8LC01180J
Kim, S., Kim, H. J., and Jeon, N. L. (2010). Biological applications of microfluidic gradient devices. Integr. Biol. 2, 584–603. doi: 10.1039/c0ib00055h
Klauke, N., Monaghan, P., Sinclair, G., Padgett, M., and Cooper, J. (2006). Characterisation of spatial and temporal changes in pH gradients in microfluidic channels using optically trapped fluorescent sensors. Lab Chip 6, 788–793. doi: 10.1039/b517237c
Lee, K., Kim, C., Ahn, B., Panchapakesan, R., Full, A. R., Nordee, L., et al. (2009). Generalized serial dilution module for monotonic and arbitrary microfluidic gradient generators. Lab Chip 9, 709–717. doi: 10.1039/B813582G
Li, Y., Sella, C., Lemaître, F., Guille Collignon, M., Thouin, L., and Amatore, C. (2013). Highly sensitive platinum-black coated platinum electrodes for electrochemical detection of hydrogen peroxide and nitrite in microchannel. Electroanalysis 25, 895–902. doi: 10.1002/elan.201200456
Li, Y., Sella, C., Lemaître, F., Guille-Collignon, M., Thouin, L., and Amatore, C. (2014). Electrochemical detection of nitric oxide and peroxynitrite anion in microchannels at highly sensitive platinum-black coated electrodes. Application to ROS and RNS mixtures prior to biological investigations. Electrochim. Acta 144, 111–118. doi: 10.1016/j.electacta.2014.08.046
Li, Y., Sella, C., Lemaitre, F., Guille-Collignon, M., Amatore, C., and Thouin, L. (2018). Downstream simultaneous electrochemical detection of primary reactive oxygen and nitrogen species released by cell populations in an integrated microfluidic device. Anal. Chem. 90, 9386–9394. doi: 10.1021/acs.analchem.8b02039
Lin, F., Saadi, W., Rhee, S. W., Wang, S. J., Mittal, S., and Jeon, N. L. (2004). Generation of dynamic temporal and spatial concentration gradients using microfluidic devices. Lab Chip 4, 164–167. doi: 10.1039/b313600k
Liu, X., and Abbott, N. L. (2011). Lateral transport of solutes in microfluidic channels using electrochemically generated gradients in redox-active surfactants. Anal. Chem. 83, 3033–3041. doi: 10.1021/ac103058g
Mahdavifar, A., Xu, J., Hovaizi, M., Hesketh, P., Daley, W., and Britton, D. (2013). A nitrocellulose-based microfluidic device for generation of concentration gradients and study of bacterial chemotaxis. J. Electrochem. Soc. 161, B3064–B3070. doi: 10.1149/2.009402jes
Maisonhaute, E., White, P. C., and Compton, R. G. (2001). Surface acoustic cavitation understood via nanosecond electrochemistry. J. Phys. Chem. B 105, 12087–12091. doi: 10.1021/jp012437e
Mark, D., and Haeberle, D. (2010). Microfluidic lab-on-a-chip platforms: requirements, characteristics and applicatons. Chem. Soc. Rev. 39, 1153–1152. doi: 10.1039/b820557b
Mitrovski, S. M., and Nuzzo, R. G. (2005). An electrochemically driven poly(dimethylsiloxane) microfluidic actuator: oxygen sensing and programmable flows and pH gradients. Lab Chip 5, 634–645. doi: 10.1039/b416671j
Oliveira, R., Bento, F., Sella, C., Thouin, L., and Amatore, C. (2013). Direct electroanalytical method for alternative assessment of global antioxidant capacity using microchannel electrodes. Anal. Chem. 85, 9057–9063. doi: 10.1021/ac401566w
Oliveira, R., Sella, C., Souprayen, C., Ait-Yahiatene, E., Slim, C., Griveau, S., et al. (2018). Development of a flow microsensor for selective detection of nitric oxide in the presence of hydrogen peroxide. Electrochim. Acta 286, 365–373. doi: 10.1016/j.electacta.2018.07.158
Sasaki, H., and Maeda, M. (2010). Dissolution rates of Au from Au–Zn compounds measured by channel flow double electrode method. J. Electrochem. Soc. 157, C414–C418. doi: 10.1149/1.3494143
Somaweera, H., Ibraguimov, A., and Pappas, D. (2016). A review of chemical gradient systems for cell analysis. Anal. Chim. Acta 907, 7–17. doi: 10.1016/j.aca.2015.12.008
Taylor, G. (1953). Dispersion of soluble matter in solvent flowing slowly through a tube. Proc. R. Soc. Lond. Ser. A. 219, 186–203. doi: 10.1098/rspa.1953.0139
Toh, A. G. G., Wang, Z. P., Yang, C., and Nguyen, N.-T. (2013). Engineering microfluidic concentration gradient generators for biological applications. Microfluid. Nanofluidics 16, 1–18. doi: 10.1007/s10404-013-1236-3
Unwin, P. R. (1991). The ECE-DISP1 problem: general resolution via double channel electrode collection efficiency measurements. J. Electroanal. Chem. Interfacial Electrochem. 297, 103–124. doi: 10.1016/0022-0728(91)85361-R
Velve-Casquillas, G., Le Berre, M., Piel, M., and Tran, P. T. (2010). Microfluidic tools for cell biological research. Nano Today 5, 28–47. doi: 10.1016/j.nantod.2009.12.001
Wan, H., and Yin, H. (2018). Tunable and quantitative serial dilution on multi-channel miniaturized microfluidic electrochemical platform. Sens. Actuators B Chem. 274, 682–688. doi: 10.1016/j.snb.2018.08.003
Wang, F. (2009). The signaling mechanisms underlying cell polarity and chemotaxis. Cold Spring Harb. Perspect. Biol. 1:a002980. doi: 10.1101/cshperspect.a002980
Wang, H., Rus, E., and Abruna, H. D. (2010). New double-band-electrode channel flow differential electrochemical mass spectrometry cell: application for detecting product formation during methanol electrooxidation. Anal. Chem. 82, 4319–4324. doi: 10.1021/ac100320a
Wang, X., Liu, Z., and Pang, Y. (2017). Concentration gradient generation methods based on microfluidic systems. RSC Adv. 7, 29966–29984. doi: 10.1039/C7RA04494A
Weibel, D. B., and Whitesides, G. M. (2006). Applications of microfluidics in chemical biology. Curr. Opin. Chem. Biol. 10, 584–591. doi: 10.1016/j.cbpa.2006.10.016
Whitesides, G. M. (2006). The origins and the future of microfluidics. Nature 442, 368–373. doi: 10.1038/nature05058
Wojtowicz, M., Kozak, J., and Koscielniak, P. (2007). Novel approaches to analysis by flow injection gradient titration. Anal. Chim. Acta 600, 78–83. doi: 10.1016/j.aca.2007.04.005
Xu, W., Foster, E., Ma, C., and Bohn, P. W. (2015). On-demand in situ generation of oxygen in a nanofluidic embedded planar microband electrochemical reactor. Microfluid. Nanofluidics 19, 1181–1189. doi: 10.1007/s10404-015-1636-7
Keywords: microfluidics, electrochemistry, concentration gradient, diffusion, convection, Taylor-Aris
Citation: Abadie T, Sella C, Perrodin P and Thouin L (2019) Electrochemical Generation and Detection of Transient Concentration Gradients in Microfluidic Channels. Theoretical and Experimental Investigations. Front. Chem. 7:704. doi: 10.3389/fchem.2019.00704
Received: 21 June 2019; Accepted: 08 October 2019;
Published: 24 October 2019.
Edited by:
Klaus Mathwig, University of Groningen, NetherlandsReviewed by:
Lingxin Chen, Yantai Institute of Coastal Zone Research (CAS), ChinaThiagarajan Soundappan, Navajo Technical University, United States
Copyright © 2019 Abadie, Sella, Perrodin and Thouin. This is an open-access article distributed under the terms of the Creative Commons Attribution License (CC BY). The use, distribution or reproduction in other forums is permitted, provided the original author(s) and the copyright owner(s) are credited and that the original publication in this journal is cited, in accordance with accepted academic practice. No use, distribution or reproduction is permitted which does not comply with these terms.
*Correspondence: Laurent Thouin, laurent.thouin@ens.fr