Synthesis of Graphene Oxide Interspersed in Hexagonal WO3 Nanorods for High-Efficiency Visible-Light Driven Photocatalysis and NH3 Gas Sensing
 Tarek M. Salama1
  Mohamed Mokhtar Mohamed
- 1Department of Chemistry, Faculty of Science, Al-Azhar University, Cairo, Egypt
- 2Building Physics and Environment Institute, Housing and Building National Research Center (HBRC), Giza, Egypt
- 3Department of Chemistry, Faculty of Science (Girls Branch), Al-Azhar University, Cairo, Egypt
- 4Chemistry Department, Faculty of Science, Benha University, Benha, Egypt
WO3 nanorods and GO (at 1 wt% loading) doped WO3 were synthesized using a template free deposition-hydrothermal route and thoroughly characterized by various techniques including XRD, FTIR, Raman, TEM-SAED, PL, UV-Vis, XPS, and N2 adsorption. The nano-materials performance was investigated toward photocatalytic degradation of methylene blue dye (20 ppm) under visible light illumination (160 W, λ> 420) and gas sensing ability for ammonia gas (10–100 ppm) at 200°C. HRTEM investigation of the 1%GO.WO3 composite revealed WO3 nanorods of a major d-spacing value of 0.16 nm indexed to the crystal plane (221). That relevant plane was absent in pure WO3 establishing the intercalation with GO. The MB degradation activity was considerably enhanced over the 1%GO.WO3 catalyst with a rate constant of 0.0154 min−1 exceeding that of WO3 by 15 times. The reaction mechanism was justified dependent on electrons, holes and •OH reactive species as determined via scavenger examination tests and characterization techniques. The drop in both band gap (2.49 eV) and PL intensity was the main reason responsible for enhancing the photo-degradation activity of the 1%GO.WO3 catalyst. The later catalyst initiated the two electron O2 reduction forming H2O2, that contributed in the photoactivity improvement via forming •OH moieties. The hexagonal structure of 1%GO.WO3 showed a better gas sensing performance for ammonia gas at 100 ppm (Ra-Rg/Rg = 17.6) exceeding that of pure WO3 nanorods (1.27). The superiority of the gas-sensing property of the 1%GO.WO3 catalyst was mainly ascribed to the high dispersity of GO onto WO3 surfaces by which different carbon species served as mediators to hinder the recombination rate of photo-generated electron-hole pairs and therefore facilitated the electron transition. The dominancy of the lattice plane (221) in 1%GO.WO3 formed between GO and WO3 improved the electron transport in the gas-sensing process.
Introduction
The nanoscience and nanotechnology have allowed the development of nanosized materials of unique electronic and optical properties quite different from those of their bulk states (Pang et al., 2010). Metal nanoparticles were recognized to reveal sum of unique optical and electronic properties, which result largely from surface plasmon resonance phenomenon. However, the high cost and low stability following annealing usually limits their applications. Nevertheless, composite materials including metal oxide nanoparticles have drawn great attention due to their unique chemical and physical properties, which make them applicable for use in photocatalysis and gas sensing (Bittencourt et al., 2006; Guo et al., 2012; Chen et al., 2013). Among the existing metal oxides, tungsten oxide (WO3) as an n-type semiconductor of a band gap of 2.5–2.8 eV owns important applications in numerous fields (Zeng et al., 2012; Gui et al., 2015; Behera and Chandra, 2018). WO3-based nanomaterials with various morphologies have been widely investigated for chemical gas sensors (Chu et al., 2017; Kaur et al., 2018; Gao et al., 2019) such as for detecting NH3, H2, and ethanol (Tsai et al., 2017; Chen et al., 2018; Morsy et al., 2018, 2019). Besides, it has attracted a lot of interest in photocatalysis theme because of its strong adsorption, manipulated energy band gap and visible light absorption (Zhang et al., 2017). However, the application of WO3 as gas sensors is reduced by the bad selectivity, long response time, low sensitivity and high resistivity (Urasinska-Wojcik et al., 2016). Generally, nanocrystalline semiconductors have poor charge mobility and thus produce very limited photocurrent. This regards as one of the biggest obstacle that hinder the usage of WO3 as practical photocatalysts. Thus, many attempts have been made to improve the behavior of WO3 such as morphology control, surface hybridization and forming hybrid composites (Li et al., 2015; Galstyan et al., 2016; Shendage et al., 2017). Improved photocatalytic activities and gas sensing performances have been demonstrated for WO3-graphene composite. Recently, graphene-based composites have received considerable attention due to their potential applications in many useful fields including photocatalysis (Zhang et al., 2015; Luna et al., 2018) and gas sensors (Behera and Chandra, 2018). The enhanced performance was based on the composite high conductivity, large surface area and the P-type conductivity created due to adsorbed oxygen molecules localized on graphene structure. With attaching an n-type semiconductor, it might be feasible to boost the reaction activity based on the facile charge transfer via the p-n junction interface. Expectedly, graphene not only can facilitate the nucleation and growth of the nanocrystals but also help achieving its stability and size beside it can orientate the oxide crystal growth (Zhang et al., 2015; Quan et al., 2017).
For the purpose of optimizing WO3 nanoparticles for improving ammonia gas sensing and MB photocatalytic degradation, the surface hybridization of WO3 with a small loading of GO was carried out. Thus, GO at 1 wt% loading was successfully dispersed in the matrix of WO3 hexagonal structure as synthesized by the in-situ deposition hydrothermal technique. The 1%GO.WO3 and WO3 free GO catalysts were well-characterized using various techniques including XRD, TEM-SAED, UV-Vis, PL, FTIR, Raman, XPS, and N2 sorptiometry. The catalysts were then tested as visible light photocatalysts toward methylene blue (MB) degradation and as gas sensors for NH3 gas.
Experimental
Materials and Methods
Sodium tungstate dihydrate (Nice Chemicals, India), hydrochloric acid (Fisher Scientific, UK), oxalic acid (Adwic, Egypt), potassium permanganate, and sulfuric acid (Sigma-Aldrich, Germany), sodium nitrite (BDH Prolabo chemicals, USA), graphite (Merck, Germany), hydrogen peroxide (GFS Chemicals, USA), and methylene blue dye (S.D. Fine-Chem Limited, India) were used as obtained.
Synthesis of WO3 Nanorods
Sodium tungstate (6.6 g, 0.2 mol) was dissolved in 100 ml distilled water and then acidified with HCl till pH 1, to form an immediate white precipitate. This precipitate was dissolved in 30 ml distilled water containing 0.4 g oxalic acid to obtain clear and transparent solution. The final solution was transferred to 40 ml Teflon stainless steel autoclave and maintained at 180°C for 26 h. After reaction, the product was washed several times with distilled water and ethanol to remove any unreacted residuals and finally dried at 100°C for 1 h.
Synthesis of Graphene Oxide-Loaded Tungsten Oxide Nanorods
A typical synthesis procedure of GO loaded onto WO3 nanorods with a GO loading of 1% by weight was as follows. A definite amount of GO was dissolved in 50 ml distilled water to form a pasty brownish color solution. To this solution, a proper sodium tungstate (6.6 g, 0.2 mol) solution was slowly added and the pH of the mixture was adjusted to 1 by addition of aqueous HCl. Then, 0.4 g of oxalic acid dissolved in 30 ml water was added and stirred continuously at room temperature for 3 h. The latter mixture was transferred into a 250 ml Teflon stainless steel autoclave and maintained at 180°C for 26 h to get the final product. This catalyst is denoted as 1%GO.WO3.
Physical Methods and Analysis
The powder X-ray diffraction (XRD) patterns were recorded, on Ni-filtered copper radiation (λ = 1.5404 Å) at 45 kV and 40 mA with a scanning speed of 2θ = 2.5°/min, on a Bruker diffractometer, type D8 ADVANCE (Germany). The TEM micrographs were measured with a FEI Tecnai G20 Super-Twin microscope (USA), at an accelerating voltage of 200 kV. The powder samples were put on carbon foils with a microgrid and the TEM images were measured with minimum electron irradiation to prevent the samples damage, together with the selected area electron diffraction patterns. Fourier transform infrared (FT-IR) spectra were recorded via a single beam Perkin-Elmer Spectrometer (RXI, USA) with a resolution of 2 cm−1 in the region 4,000–400 cm−1. Raman spectra were obtained with a Bruker Senterra Raman spectrometer (Germany), using the 532 nm line as the excitation beam. The incident laser power and resolution were 5 mW and 2 cm−1, respectively. The surface properties namely BET surface area, total pore volume (Vp) and mean pore radius (r−) were determined from the nitrogen adsorption isotherms measured at −196°C using a Nova 3200 porosimeter, USA. The solid samples were out-gassed at 473 K for 2 h under a reduced pressure of 10−4 Torr before starting the measurements. Diffuse Reflectance UV–Vis spectra (UV–Vis DRS) were recorded using a UV–Vis JASCO spectrophotometer (V-570, Japan) in the range of 200–1,000 nm. The edge energy (Eg) was determined by finding the intercept of the straight line in the low-energy rise of the plot of [F(R∞)hν]2, for the direct allowed transition vs. hν, where hν is the incident photon energy. The photoluminescence (PL) excitation and emission spectra were measured on a FL/FS 900 time resolved fluorescence spectrometer. The measurements were conducted at room temperature using a He-Cd laser (310 nm), as an excitation source. X-ray photoelectron spectroscopy (XPS) equipped with an Al-Kα x-ray source at energy of 1486.6 eV was utilized to distinguish the surface chemical composition of the catalysts. Electrochemical measurements were determined using Digi-Ivy 2116 B, USA, in 6.0 M KOH aqueous solution for determining either ND or NA concentration using the Mott-schottky plot. More details information about the measurement conditions can be found elsewhere (Mohamed et al., 2017).
Photocatalytic Degradation Experiments
The photocatalyst (100 mg) was suspended in 100 mL aqueous solution containing 20 mg L−1 methylene blue (MB). For each experiment, the suspension was stirred in dark for 60 min to establish the adsorption–desorption equilibrium between the MB and the catalyst, followed by irradiation with a high-pressure Philips lamp of 160 W with an average light intensity of 60 mWcm−2, emitting only visible light (400–700 nm) via using a cut-off filter. Three ml aliquot containing dye and catalyst powder was taken out followed by centrifuging at 3,000 rpm for 5 min. After the catalyst separation, the change in MB concentration was determined through the absorbance variation at the wavelength of 664 nm. The absorption spectra of the aqueous solution of the MB after adsorption and degradation were measured using a Shimadzu UV-2350 spectrophotometer, Japan. The reactive species were also determined to stand on the degradation mechanism via employing various scavengers.
Sensor Fabrication and Evaluation
Fluorinated tin oxide (FTO) glass substrate has been used for sensors fabrication. In a typical procedure, 1 mm gap was created on the conductive FTO substrate using an electric arc followed by washing/cleaning processes via soaking in a soap solution for 10 min, flowed by distilled water and acetone. Finally, the FTO substrate was dried under N2 flux. The electrical contacts were established via attaching two copper foils with conductive adhesive onto the FTO substrate. A proper amount of the GO.WO3 composite was mixed with deionized water in a mortar forming a paste. The paste was then applied onto the FTO substrate and annealed at 80°C for 4 h. The sensor was aged at 5 V for 36 h to enhance its stability. Following stabilization of the sensor resistance, a known concentration of ammonia gas was generated by injection into a fixed volume chamber supplied with heater. The ammonia gas concentration in ppm was calculated using the following equation: Vi = C.V.MW/22.45 D, Where MW is the molecular weight of ammonia, D is the density of ammonia, V is the chamber volume, C is the concentration of ammonia in ppm, and Vi is the injected volume of ammonia. The real time resistance variation was recorded every 3 s by a digital precision pico-ammeter type keithley-6487 interfaced to a computer. The response of the sensor (Ra- Rg/Rg) * 100 was defined as the ratio of the resistances of the sensor in air (Ra) to that in ammonia (Rg). The response time was defined as the time taken by the sensor to achieve 90% of the total resistance changes.
Results and Discussion
X-Ray Diffractometry (XRD)
Figure 1 illustrates the XRD patterns of the WO3 nanorods, graphene oxide (GO) and WO3 nanorods doped with 1% GO. As for GO, an intense reflection related to GO appears at 2θ = 10.64° diffracted from the (002) plane. By applying Bragg's law, the calculated interlayer spacing of GO is 0.83 nm, providing an expansion than graphite analog depicted at 0.34 nm. This is interpreted in terms of elongation of the c-axis during graphite oxidation to GO via creation of oxygen-containing functional groups. The pure WO3 sample is well-crystallized in a single phase with exposing diffraction peaks at 2θ equal 24.68°, 28.17°, 36.52°, 49.85°, and 55.43°, indexed to hexagonal WO3 (JCPDS 85-2459). The average crystallite size of WO3 determined via Scherer's equation is 20 nm. All reflections due to the 1%GO.WO3 pattern are associated with a single phase hexagonal WO3. This sample exhibits more intense reflections when compared with the GO free WO3 sample, endorsing an average crystallite size of 25 nm. Besides, the peak of GO disappears in the 1%GO.WO3 pattern, which is likely due to the thimbleful of GO in the composite. However, the revealed broadness in the latter pattern for the peak at 24.68°, along with the expansion in d values is indicative of the dispersion of GO into the WO3 hexagonal structure.

Figure 1. XRD patterns of GO, WO3, 1%GO.WO3 catalysts.
High-Resolution Transmission Electron Microscopy (HRTEM)
Particle morphology, crystallinity and selected area electron diffraction (SAED) analyses of the synthesized samples are studied by means of HRTEM (Figure 2). The HRTEM image of WO3 shows that it owns nanorods shape with an average diameter of 4.11 nm. The magnified HRTEM image in the inset of the WO3 Figure shows good crystallinity and spacing's of well-resolved lattice fringes at ~0.35 nm, coincidently matching the (110) diffraction plane of WO3 (JCPDS 85-2459). On the other hand, the SAED pattern of this sample shows a distorted hexagon with d = 0.24 nm corresponding to the (201) plane of WO3 nanorods. The HRTEM image of the 1%GO.WO3 composite shows clear nanorods with an average diameter of 17.6 nm and lattice spacing's equal 0.16 nm due to the (221) plane. This plane is not apparent in pure WO3 nanorods. The SAED pattern in the inset of the latter Figure shows six-fold symmetry diffraction bright spots appears as well-defined diffraction hexagonal form, unlike that of pure WO3 nanorods, emphasizing the interaction of GO with WO3.
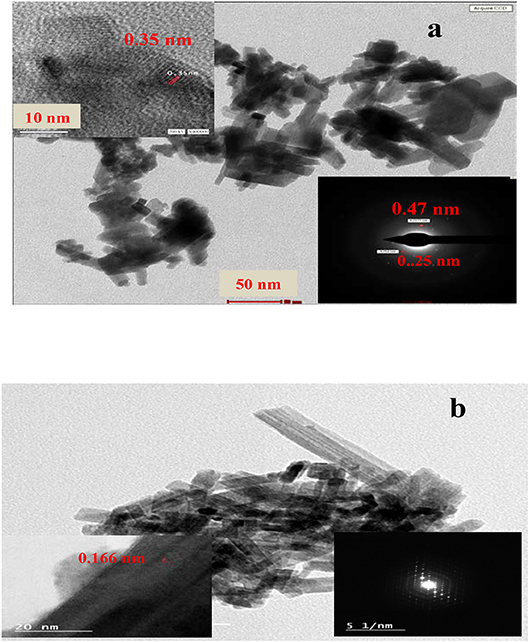
Figure 2. TEM, HREM, and SAED (inset) images of GO inset in (a) WO3 (a) 1%GO.WO3 (b) catalysts.
FTIR Spectra
The interaction between WO3 and GO is confirmed by the FTIR spectroscopy as exemplified in Figure 3A. The FTIR spectrum of GO exhibits a broad band with a maximum at 3,424 cm−1 corresponding to the OH stretching vibration (νOH). The substantial OH band broadening is a result of the strong hydrogen bonding interaction of hydroxyl containing groups, while the small band at 1,719 cm−1 is due to the C=O stretching vibration from the residual COOH groups on the GO surfaces. The sp2 carbon network revealed from the band at 1,623 cm−1 is assigned to the C=C skeletal asymmetric vibration of unoxidized graphitic domains (Poongodi et al., 2017). The bands at 1,423 and 1,054 cm−1 correspond to the stretching vibrations of the C-OH and C-O groups, respectively (Shendage et al., 2017). For WO3 nanorods, the small broad band observed at 3,417 cm−1 corresponds to the OH stretching, and the strong bands at 808 and 639 cm−1 to the stretching vibration of O-Wb-O and O-Wc-O links in the WO3 structure, respectively (Han et al., 2018). The peak related to the W=O stretching vibration, proposed for dangling oxygen bonds, is obscured by the strong absorption of the former peak. The 1%GO.WO3 composite shows a band at 3,436 cm−1 ascribed to the OH stretching vibration. By comparing with that of GO, this band becomes stronger, narrower and shifts to a higher frequency in the spectrum of 1%GO.WO3 composite, i.e., from 3,424 to 3,436 cm−1. This reflects the interspersion of GO matrix within the WO3 structure (Zhang et al., 2010). In addition, the carbonyl C=O band at 1,719 cm−1 is disappeared in the spectrum of 1%GO.WO3. This result implies that the carboxylic functional groups of GO are involved in the GO.WO3 interactions (Saidi et al., 2018). The peaks due to O–W–O stretching vibrations are decreased in intensity and red shifted to 707 and 611 cm−1, inferring the GO dispersion into the WO3 hexagonal structure (Saidi et al., 2018). A small band at 877 cm−1 characteristics of the stretching W=O vibration is noticed, which never seen in the GO free WO3 (Saidi et al., 2018). This indeed confirms the strong interaction between the two-component forming composite in which GO contributes in the formation of W=O bonds. The GO doping is rather confirmed from the presence of peaks assignable to C=C and C-OH stretching vibrations at 1,604 and 1,434 cm−1, respectively. In this case, it is observed that the shift of bands at 1,604 and 1,434 cm−1 in 1%GO.WO3 toward higher and lower values when compared with those for individual GO (1,623 and 1,423 cm−1), respectively, reflects the strong interaction between the components forming the composite. In addition, there is almost no change in the peak at 1,052 cm−1 both in GO and 1%GO.WO3 confirming that C-O groups did not take part in the reaction between GO and WO3, unlike COOH and C-OH functional groups.
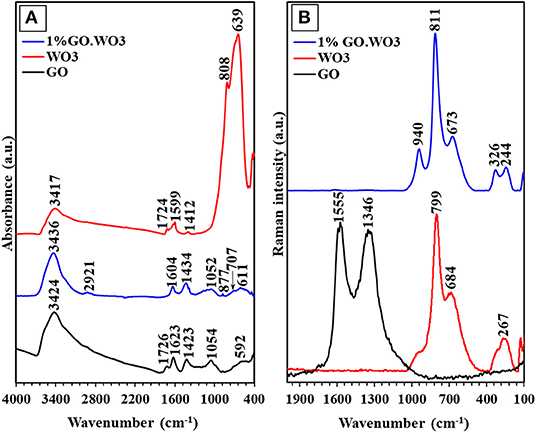
Figure 3. FTIR spectra (A) and Raman spectra (B) of GO, WO3, 1%GO.WO3 catalysts.
Raman Spectra
Figure 3B shows the Raman spectra of GO, WO3 nanorods and 1%GO.WO3. The GO spectrum exhibits two intense bands at 1,346 and 1,559 cm−1; the former D-band represents the disordering sp2-hybridized C atoms of GO, while the latter G-band corresponds to the structural integrity of the sp2-hybridized C atoms of GO (Zeng et al., 2012). The Raman spectrum of pure WO3 nanorods is characterized by two bands at 799 and 684 cm−1 assigned to the W-O-W stretching vibrations, which according to previous reports signified to the distances of the W-O bonds in pure WO3 (Gao et al., 2019). The shoulder near 920 cm−1 is assigned to the stretching frequency of the terminal W=O on the nanostructural boundaries of WO3 (Kaur et al., 2018), whereas Raman frequencies at 326 and 267 cm−1 are most likely due to the O-W-O deformation modes. The Raman spectrum of 1%GO.WO3 is only dominated by the W-O-W stretching modes at 799 and 684 cm−1 (Figure 3B), and their relevant deformation ones occurred at 326 and 244 cm−1. It is observed that the molecular structure of GO (D- and G-bands) is vanished after inclusion of GO onto the WO3 nanorods. This agrees with the low content of GO (1 %) in the sample. The Raman peaks of 1%GO.WO3 at 940 and 811 cm−1 are weakened and rather shifted to higher frequencies as compared to 920 and 799 cm−1 for WO3, advocating strong interaction between WO3 and GO matrix. Similarly, developing of two peaks at 244 and 326 cm−1 in 1%GO.WO3 contrary to only one peak at 267 cm−1 in WO3, features a distortion in the nanostructured WO3 (shortening O-W-O bonds) revealing its strong bonding with GO, as typically confirmed from the XRD analysis of 1%GO.WO3.
N2 Sorptiometry
Figure 4 shows the adsorption-desorption isotherms and pore size distribution curves (inset) of all the samples. The WO3 nanorods isotherm fits type IV of mesoporous materials, in agreement with the IUPAC assembling. The adsorption-desorption coincides at P/Po of 0.5, revealing the existence of wide pores with H4 type. Where in 1%GO.WO3 the adsorption-desorption isotherm coincides at P/Po of 0.46 indicating narrowing of the pores as a result of GO incorporation within the WO3 pores. In concordance, the pore radius of WO3 nanorods indicates a value of 6.5 nm where it becomes narrower for 1%GO.WO3 at 3.9 nm. The pore size distribution (PSD) of WO3 nanorods in the inset of Figure 4 manifests a monomodal type of pore maximized at 7.5 Å that extends to 20 Å. Contrarily, the 1%GO.WO3 indicates PSD at 4.0 Å, proposing the evolution of more narrow pores, to comprehend the role of GO in narrowing the pore mouth of the WO3 hexagonal array. The surface area of WO3 nanorods (54.3 m2/g) exceeds that of the 1%GO.WO3 composite (14.2 m2/g); a concurrent trend involving a lager pore volume for the former (0.084 cm3/g) than for the latter (0.024 cm3/g). This result emphasizes the inclusion of GO precursor into the WO3 nanorods.
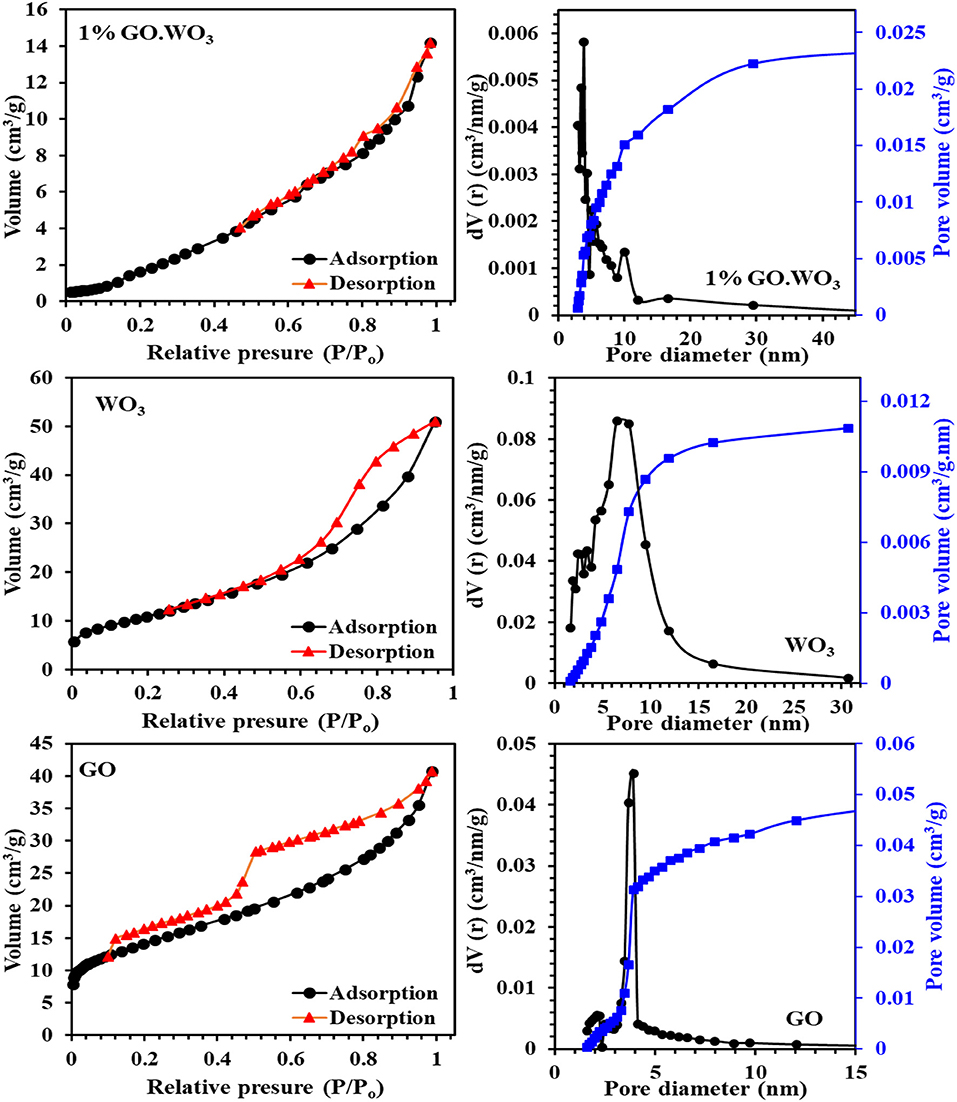
Figure 4. Adsorption-desorption isotherms and pore size distribution curves (in-set) of GO, WO3, 1%GO.WO3 catalysts.
Optical Characteristics
Figures 5A,B present the PL emission spectra of WO3 NRs and 1%GO.WO3 excited at 320 nm at different wavelengths margin. A clear main broad emission peak at 447 nm is observed in the PL spectra of both samples. Based on previous investigations in literature (Jung et al., 2010; Chu et al., 2017), this peak may originate from the presence of oxygen vacancies or defects in WO3 NRs. The decrease in PL emission intensity at 447 nm for 1%GO.WO3 compared to that for WO3 NPs (Figure 5B) is likely a consequence of an electron transfer from the WO3 conduction band to GO networks. Such quenching of PL emission of 1%GO.WO3 discloses that GO could acts as an electron transfer channel in the GO-encompassed semiconductor materials, as indicated in previous studies (Min et al., 2012; Dong et al., 2014). GO can thus virtually lower the rate of the electron-hole recombination, leading to maximizing charge separations and conserving more reactive species for high photocatalytic activity. Another emission peak at 560 nm is seen in Figure 5B for both samples however, the peak of 1%GO.WO3 was of lower intensity reflecting the decrease in the electron-hole recombination.
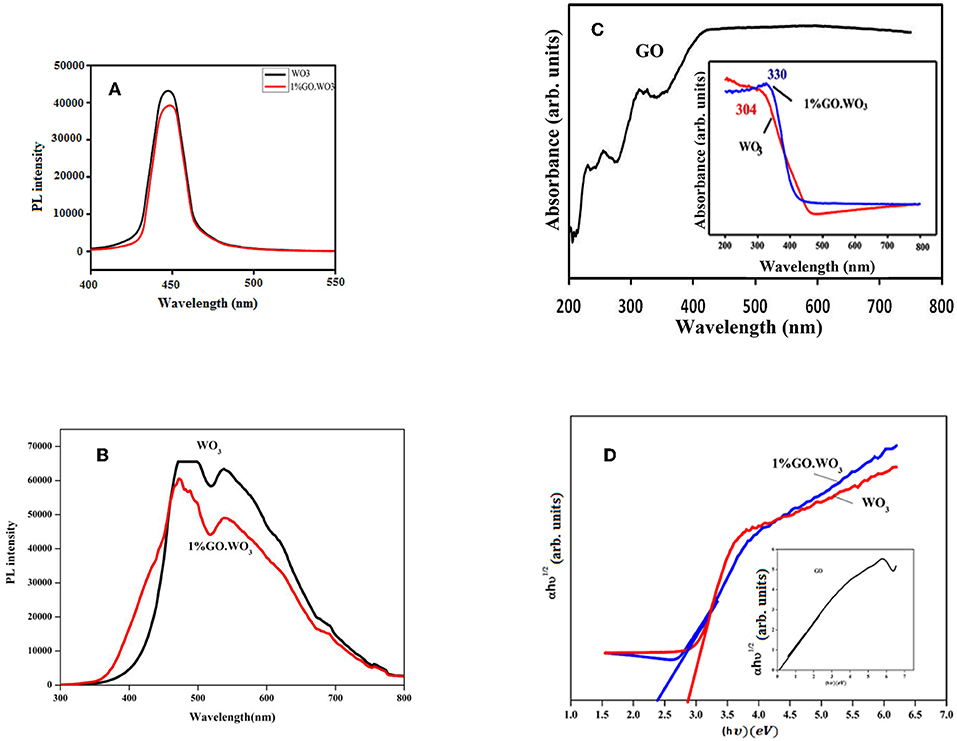
Figure 5. Photoluminescence (PL) emission spectra of WO3 and 1%GO.WO3 in the margin of 400–550 nm (A), WO3 and 1%GO.WO3 in the margin of 300–800 nm all excited at 320 nm (B), beside UV-visible spectra (C), and gap energy plots (D) of the GO (inset), WO3, 1%GO.WO3 catalysts.
Figure 5C shows the UV–Vis absorption spectra of WO3 NRs and 1%GO.WO3 (inset) in comparison with GO spectrum. The latter spectrum indicates bands at 250, 280 and 320 nm comprehending the presence of π-π* and n-π*(C=O), respectively. This indeed indicates the presence of both graphene and graphene oxide structures. The WO3 NRs, and 1%GO.WO3 samples exhibit wide absorption bands at 304 and 330 nm, respectively. Meanwhile, the latter reveals an absorption edge at 430 nm, which is lower in energy than the relevant of 1%GO.WO3 at 480 nm. This could give an indication of decreasing the oxygen deficiencies on WO3 NRs as consequence of GO incorporation. Besides, the 1%GO.WO3 catalyst displays absorption in the visible region from 400 to 700 nm stronger than that of free WO3, signifying the presence of W-O-C linkages in the composite. This manifests the expected photocatalytic capability of 1%GO.WO3 under visible light irradiation. The band gaps of the catalysts calculated from the absorption spectra using the Tauc draw (Figure 5D) are 2.49, 2.8, and 0.55 eV for 1%GO.WO3, WO3 NRs, and GO, respectively. Indeed, the incorporation of GO might led to the decrease in the bond length of W=O and/or O-W-O, possibly due to the strong interaction between WO3 and GO and via elaborating bonds such as C-O-W and C-W.
XPS Study
XPS, illustrated in Figure 6, is used to have an idea about WO3 chemical composition as well as tracing the changes in WO3 chemical states following GO incorporation. XPS survey scan (not shown) verifies the presence of W, C and O elements in both pure WO3 nanorods and 1%GO.WO3 samples. The core-level W4f XPS of WO3 nanorods (Figure 6A) shows the presence of strong two peaks at 35.92 and 38.09 eV together with their satellite band at 41.88 eV due to the spin-orbit split levels of W(4f7/2) and W(4f5/2), respectively. The spectral deconvolution indicates two subpeaks at 35.4 and 37.3 eV due to W5+ state. The high-resolution W4f spectrum of 1%GO.WO3 (Figure 6B) shows two well-defined feature peaks located at 36.6 and 38.8 eV to fit W4f7/2 and W4f5/2, consistent with W6+ state in the form of WO3 together with a loss feature at 42.6 eV of W(4f3/2) (Naseri et al., 2011). The latter confirms the successful incorporation of GO into WO3 structure, manifested by the exhibited shift of all W4f peaks into higher binding energies. Also, this shift indicates that the low valence W5+ state seen in WO3 nanorods is no longer detectable in 1%GO.WO3 featuring the absence of substoichiometric WO3−x following the GO incorporation.
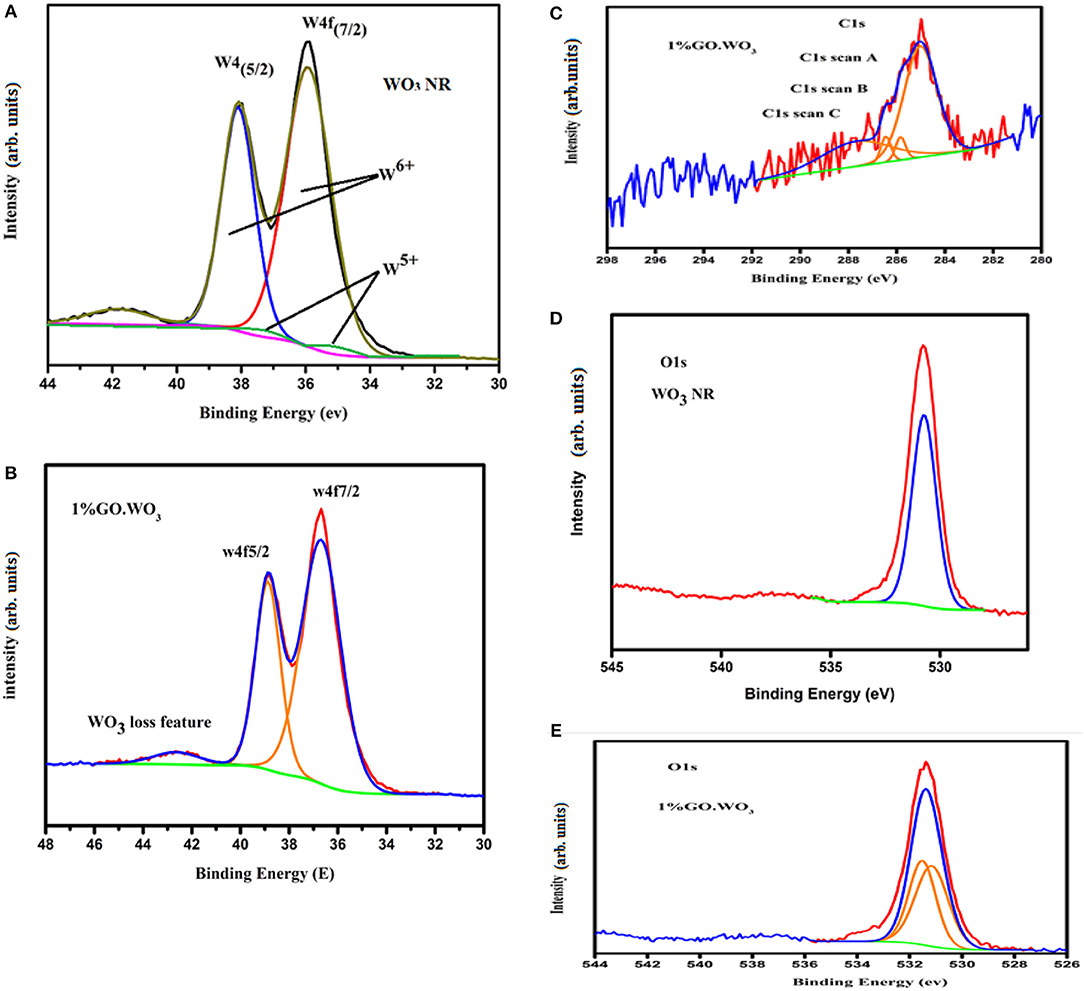
Figure 6. W 4f XPS spectra of WO3 (A) and 1%GO.WO3 (B), beside the C1S of 1%GO.WO3 (C), and O1S of WO3 (D) and 1% GO.WO3 (E) catalysts.
The high-resolution C 1 s spectrum (Figure 6C) of 1%GO.WO3 owns a strong peak of C=C species positioned at 285.2 eV. This spectrum is also divided into three bands at 285.84, 286.45, and 287.69 eV attributed to C-C, C-O, and C=O groups, respectively. The surface atomic percentages show that C=C represents the highest ratio (62.2%) reflecting a reduction in the oxygen content of GO in 1%GO.WO3. The latter deduction is justified by ratios of C=O (29.46%), C-C (3.93%) and C-O (4.39%). This result verifies the successful formation of a hybridized structure of GO.WO3.
The normalized XPS O 1 s spectrum shown in Figure 6D of WO3 NRs shows one peak at BE of 530.73 eV, assigned to the 1s ion (lattice oxygen). The XPS spectrum of the O 1 s of 1%GO.WO3 (Figure 6E) is splitted into two component peaks localized at 531.51 and 531. 15 eV ascribed, respectively, to O1s O-C and states, which represent a total surface oxygen moiety of 53.89 vs. 100% at the surfaces of WO3 NRs. This indeed advocates the GO involvement in the WO3 structure. Conclusively, the majority of GO is reduced to graphene (62.2%) with exposing residual oxides correlated to C=O (29.46%) and C-O (4.39%) moieties on GO amounted to the promotion of P-type conducting nature. This is capable of forming conducting transition when amalgamated with WO3 (n-type) to boost the charge transfer via the p-n junction interface and thus the reaction activity.
Photocatalytic Degradation of MB
The photocatalytic activities of WO3 NRs and 1%GO.WO3 toward the degradation of methylene blue dye (MB; 20 ppm) under visible light illumination are shown in Figure 7A. Prior irradiation, the suspension formed between the catalyst and the dye is stirred in dark for 1 h to ensure diffusion from the bulk of dye to the interfacial zone and to accomplish adsorption-desorption equilibrium between them. The MB adsorption ability of 1%GO.WO3 increases over 17% above WO3 NRs, elaborating that GO-doping of WO3 with small amount as 1% does not effectively improve the electrostatic attraction between MB and the catalyst. The result in Figure 7A shows an enhanced degradation of the MB dye over 1%WO3.GO under visible light irradiation through a complete degradation (100%) in 180 min at a rate constant of 0.0154 min−1; as shown in Figure 7B, in front of 34% degradation with a rate of 0.001 min−1 for WO3 NRs. Figure 7C shows the UV-vis spectra of the MB photodegradation over 1%GO.WO3 as a function of elapsed time elucidating the consequences of the MB degradation. These results indicate that the marked increase in activity of the 1%GO.WO3 catalyst is explained by the slight increase in the visible light absorption beside lowering both the band gap and the PL intensity; reflecting the slow recombination between electrons and holes. Also, the high dispersity of GO in WO3 NRs; as emphasized by the FTIR, Raman and XPS data, evokes the involvement of carbons via hindering the recombination rate of photo-generated electron-hole pairs within the WO3 hexagonal structure, facilitating the electron transition. Performing the MB degradation over WO3 incorporated higher GO weight percentages (such as 5 and 10%) indicates adsorption behavior rather than photocatalysis trend (not shown). That is why we were only restricted to the 1%GO ratio. Executing the MB degradation (20 ppm) over 1%GO.WO3 in presence of various scavengers under visible light illumination (Figure 7D) results in a significant decrease in the rate constant, compared to 0.0124 min−1; evaluated in the absence of any scavenger. From Figure 7D, the maximum decease in the rate constant is for that depicted for the CCl4 scavenger (0.0008 min−1), implying that electrons are the most reactive species affecting the MB degradation, followed by triethanolamine (0.0029 min−1) and isopropanol (0.0053 min−1), configuring in sequence the importance of holes and •OH after electrons. Figure 7E depicts the UV-Vis spectra of the MB dye as a function of time in the presence of the 1%GO.WO3 photocatalyst. A magnificent decrease after 180 min is well-illustrated. Interestingly, the enhanced photocatalytic activity for photodegradation of MB is acquired over WO3 modified low conc. of GO (1%) of eco-friendly synthesis conditions. To identify the extent of MB mineralization, Figure 7F shows the reduction in TOC in comparison to the dye degradation curve. Apparently, the TOC curve decreases significantly to 77% in 180 min confirming the presence of none degradable products and rather affirming the high mineralization capability of the catalyst.
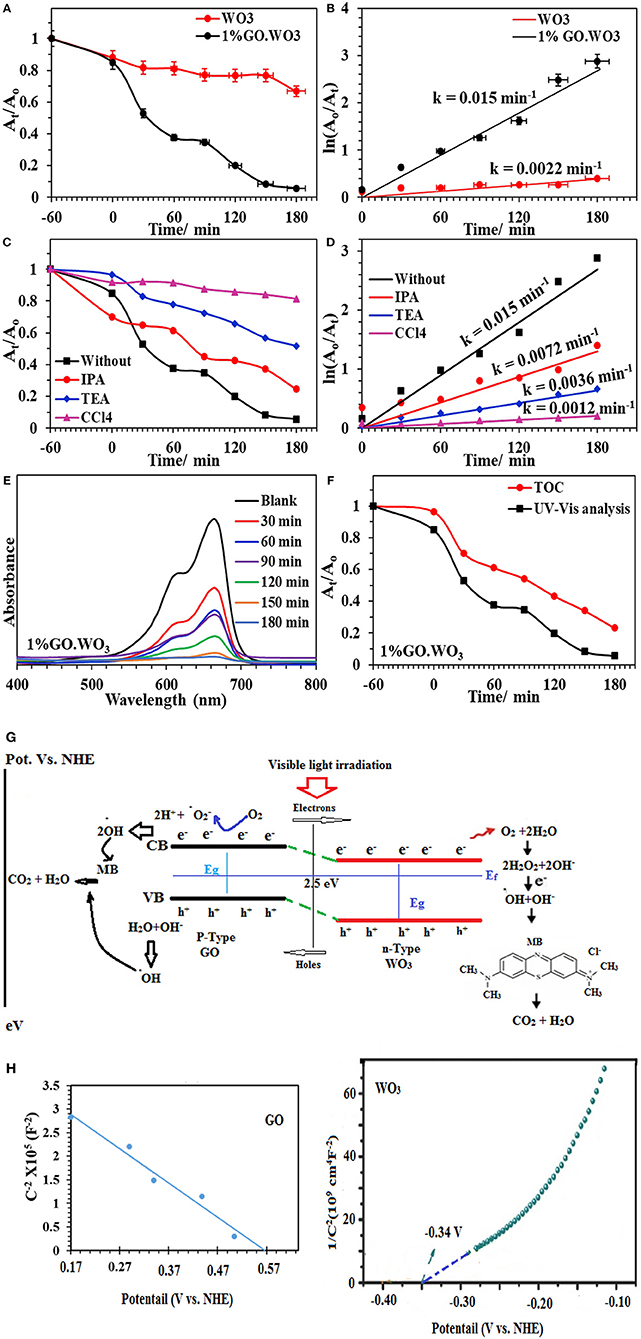
Figure 7. At/Ao plot of the MB (20 ppm) degradation over WO3 and 1%GO.WO3 catalysts at the dose of 1.0 g/l under visible light illumination (160 W, λ > 420) (A) and their kinetic curves of ln Ao/At vs. time (B) Effect of scavengers on the catalytic degradation of MB over 1%GO.WO3 with time (C) and their kinetic curves with time (D) beside UV-Vis. absorbance spectra of the MB over 1wt% GO.WO3 with time (E), Decrease in TOC and change in absorbance as function of irradiation time for the MB dye (F), the expected reaction mechanism of the MB degradation over 1%GO.WO3 (G) and Mott–Schottky plots of WO3 and GO (H).
The above mentioned results suggest that electrons, holes and •OH are the main reactive species in the process of MB photodegradation over the 1%GO.WO3 catalyst. This is not mean the insignificant effect of holes but it works as an indirect way as elaborated in the mechanism to deliver •OH. Based on the above outcomes, a suggested mechanism for the photocatalytic reaction is depicted as in the scheme shown in Figure 7G. Under visible light irradiation, the valence band (VB) electrons are excited to the conduction band (CB) of the WO3 semiconductor, creating holes (h+) in the VB. The conduction band (CB) edge and valence band (VB) edge can be calculated by the following equations (Sadakane et al., 2010):
Where EVB and ECB are the valence band and conduction band edge potentials respectively where χ is the geometric mean of electronegativity of the constituent atoms semiconductor. The values of χ for GO.WO3 and WO3 are calculated as 6.39 eV and 6.59 eV according to the literature (Pearson, 1988). Ee is the energy of free electrons vs. hydrogen (4.5 eV) scale and Eg is the band gap energy of the semiconductor. A Mott-Schottky analysis is constructed to examine the carrier density and flat band potential for both WO3 and GO. The Efb is estimated by extrapolating each Mott–Schottky plot to the x-axis to obtain the intercept value and the Nd is estimated by the slope following Equations 3 and 4 (Mohamed et al., 2018a,b);
Where C is the capacitance of the space charge layer, Nd is the number of donors, e (1.602 × 10⁻¹⁹ C) is the electron charge, ε (20 for WO3) is the dielectric constant, and ε0 (8.85 × 10⁻¹⁴ F cm−1) is the vacuum permittivity, and κ (1.38 × 10⁻²³ J K−1) is the Boltzmann constant. First, the positive slopes indicate the n-type nature of the WO3 samples (Figure 7H). Moreover, the calculated Nd is 1.30 × 1020 cm−3, thus enormously promoting the charge transport efficiency. In the meantime, the flat band potential equal −0.34 V. The flat band potential of GO is measured at 0.57 V. Assuming that majority of the depletion width is located in GO film, the depletion width in the 1%GO.WO3 interface is estimated according to following equation:
Where NA, ε and εGO are acceptor concentration and absolute permittivities of WO3 and GO respectively. Of particular interest, GO shows a negative slope corresponding to p-type conductivity manifesting the presence of high oxygen vacant defects with carrier concentration (NA-holes) of 1.6 × 1018 cm−3. Apparently, GO shows a positive shift of the flat-band potential as compared to the WO3 electrode and rather indicates a lower concentration as compared to the N donor.
The band potential alignment of the as prepared GO.WO3 vs. NHE shown in Figure 7G illustrates higher activity since its CB edge potential is more active than that of WO3 indicating that photogenerated electrons from GO.WO3 are easily transferrable than that of WO3 via the former formed interface. Alike, the VB edge potential of GO.WO3 is less positive than WO3, specifying that the lower potential of the former facilitates its holes energetics. Accordingly, sticking a large number of electrons in the conduction band of GO.WO3 as well as holes in its valence band increases the life time of e−-h+ and slow down their recombination to markedly enhance the photocatalytic performance of GO.WO3. The electrons may transport into the carbons of GO rather than recombined with the holes in the prevented band. The rest of the electrons on the WO3 nanorods surface can react to form reactive oxygen moieties (·); of reduced lifetime, which react accordingly with 2H+ to form •OH. The latter reactive species can also be formed from the reaction of holes with the OH−/H2O species, to degrade the MB dye more efficiently (Zhang and Yi-Jun, 2016). The two-electron reduction of O2 to form H2O2; as a common role of RGO-constructed composite photocatalysts (Weng et al., 2014), is augmented on the 1%GO.WO3 surface. Here, the presence of H2O2 is determined via using the Ghormley triiodide method (Björkbacka et al., 2015), by which an electron acceptor is donated to form ·OH species. Based on the difference in work function of the GO in favors of that of WO3 an electron transfer into the latter from the former is expected, and thus increases the electron density. Rendering the n-type conductivity to WO3 surface in front of the p-type of the residual oxygen in GO facilitates the n–p semiconducting boundary interface that causes an enhanced photocatalysis. Accordingly, the electron transfer is found to be efficient in 1%GO.WO3 rather than in GO free WO3 catalyst. The latter showed high recombination rates of charge carriers of revealed insignificant lifetime, leading to a lower photocatalytic performance. Apparently, our catalyst shows higher photocatalytic efficiency compared with some WO3-based graphene composites toward the degradation of the MB dye (Fan et al., 2012; Azimirad and Safa, 2015; Sun et al., 2015; Dinari et al., 2016; Liu et al., 2017). As revealed, their photocatalytic efficiencies are found to be in the range 65–95% within 56–180 min as well as with lower rates than ours.
Gas Sensing Behavior
The I-V characteristic curves of bare WO3 NRs and 1%GO.WO3 catalysts shown in Figure 8A indicate an Ohmic contact to ensure the sensing performance of the composite itself and not due to the contact between the composite and the electrode (Morsy et al., 2018). It is obvious that the electrical conductivity of the 1%GO.WO3 catalyst is much higher than that of bare WO3 NRs. Generally, metal oxides exhibit very poor electrical conductivity, and many strategies are devoted to overcome such poor conductivity. In order to investigate the gas-sensing effect of WO3 NRs, and 1%GO.WO3, these materials are subjected to different ammonia concentrations (10-100 ppm) at 200°C and the relationship between the sensor's response/recovery and ammonia gas is summarized in Figures 8B,C. The WO3 NRs sensor shows no response at room temperature, while 1%GO.WO3 shows a moderate sensitivity at room temperature (not shown). For comparison, the response/recovery of WO3 NRs and 1%GO.WO3 sensors toward ammonia gas evaluated at 200°C is performed as similarly depicted in some literatures (Bittencourt et al., 2006; Guo et al., 2012; Zeng et al., 2012; Chen et al., 2013; Gui et al., 2015; Zhang et al., 2017). The sensitivity of 1%GO.WO3 to ammonia gas is estimated to be 2, 2.6, 5.1, 7.9, and 17.6 at 10, 20, 50, 70, and 100 ppm, respectively. For GO free WO3, the sensitivity was 0.2, 0.4, 0.89, 1.02, and 1.27 at 10, 20, 50, 70, and 100 ppm, respectively. Therefore, the sensitivity to ammonia processed preferentially on 1%GO.WO3 is ~14 times higher than that on WO3 NRs sensor. This could be due to the conductivity enhancement as a result of the strong interaction exhibited between partially reduced GO and WO3 NRs, which is in accordant with the analysis data of TEM, XPS and Raman. It is also observed that the response increase with increasing ammonia concentration. The sensors response curves show that the resistance of sensors recovers its initial value after ammonia gas interruption, indicating a good reversibility. As a general trend for both sensors, the sensors interact directly with ammonia gas, which may lead to the reduction in the electrical resistivity. Rendering the n–p conductivity enhances the sensing response. Apparently, the numbers of oxygen vacancies formed on the WO3 surfaces provide many active sites for the gas sensing reactions. In addition, the formed heterojunction is effectively accelerated the electron transfer and helps reducing the activation energy and enthalpy of the adsorbed gas molecules and thus enhances the sensing response; as shown in Figure 8D. The formed hetero-junction also accelerates the sensing response with the target gas that passes through the interface leading to electronic sensitization via modulation of depletion layers at the heterojunction area.
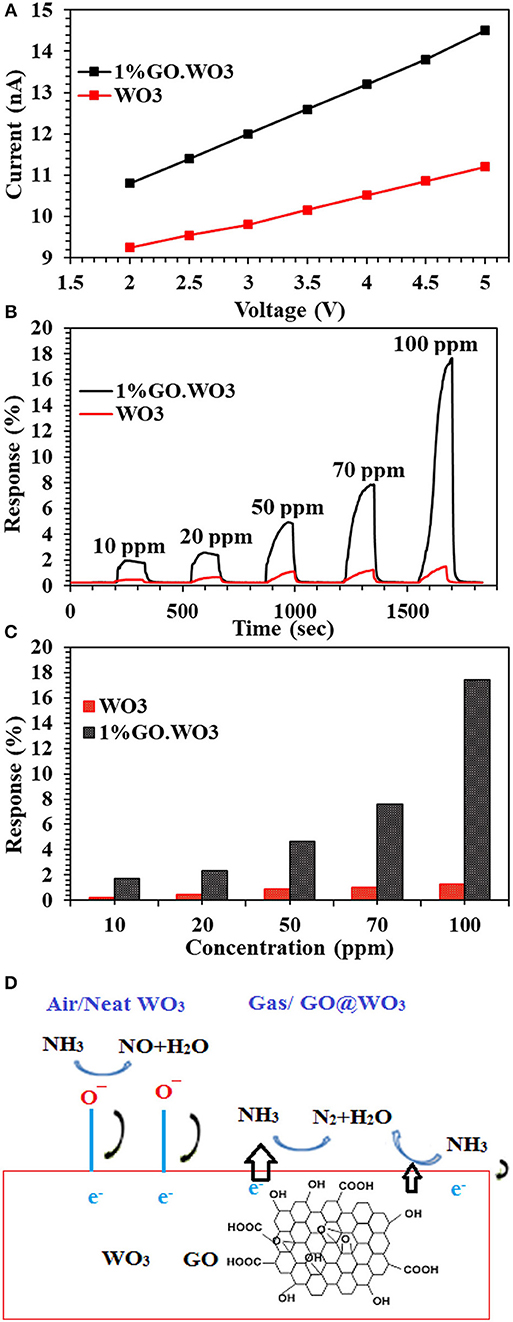
Figure 8. I-V characteristic curves of WO3 and 1%GO.WO3 catalysts (A), and their response transient to different ammonia concentration (10–100 ppm) at 200oC (B) response Vs. NH3 concentration for WO3 and 1 % GO.WO3 (C) beside the mechanism of NH3 gas sensing on the 1%GO.WO3 catalyst (D).
The principal of semiconductor metal oxide gas sensors depends on the material change in electrical resistance due to the interaction between the target gas and the material. When the sensor subjected to air, the oxygen molecules adsorbed on the conduction band of WO3 get ionized to oxygen ions such as , O−, and O2− through capturing free electrons from the surface of the WO3 and result in an electron depletion layer at the WO3 surface.
The chemical reaction can be composed as follows;
These forms of the absorbed oxygen species are function in the operating temperature. The first form, as evidenced by XPS and represents major species, ( Equation 1) onsets at room temperature and rests at ~100°C. The second form (O−, Equation 2) is acquired in the temperature range of 100–225°C. The third form of adsorbed oxygen species (O2−, Equation 3) is excited between 225 and 400°C (Chen et al., 2018). This may explain why the optimum working condition for WO3 is approximately around 200°C. During ammonia (reducing gas) exposure, the pre-adsorbed oxygen ions release electrons to the WO3 surface, causing a decrease in the depletion layer, thereby decreases the electrical resistance (Urasinska-Wojcik et al., 2016).
When 1%GO.WO3 sensor is exposed to NH3 atmosphere, the electron transfer occurs through the formed 1%GO.WO3 interface (Figure 8D), whereby both of which can provide effective adsorption sites. Rendering the n-type conductivity to WO3 surface in front of the p-type of the residual oxygen in GO facilitates the n-p sensing for enhancing the response. GO acts as a catalytic promoter favoring surface reactions between ammonia gas and the adsorbed oxygen species on the sensor surface. Our results exhibited higher response toward ammonia gas sensing (see Table 1) in a relatively shorter time when compared with some various structural WO3 catalysts, GO.WO3 composites and when WO3 forms heterojunction with other oxides (Wang et al., 2006; Hieu et al., 2011, 2012; Toan et al., 2017; Behera and Chandra, 2018; Prabhu et al., 2018).
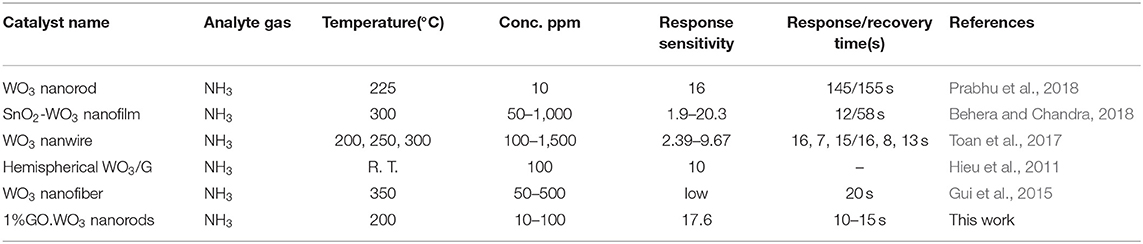
Table 1. Comparison of ammonia gas sensing on some WO3 based catalysts.
Conclusion
The highly dispersed 1% GO in WO3 hexagonal array heterojunction is successfully synthesized using a template free deposition-hydrothermal route for photocatalytic remediation of the MB (20 ppm) dye and for NH3 gas sensing (10–100 ppm). The characterization results conducted using various physicochemical techniques show that the high dispersity of GO onto WO3 nanorods surface causes an increase in the observed visible light absorptivity for the 1%GO.WO3 composite and consequently decreases both energy band gap and PL intensity. The latter two factors are chiefly responsible for enhancing the MB degradation under visible illumination (in 180 min; 0.0154 min−1) via freeing electrons of expanded lifetime, as well as played a role in promotion and enhancing the ammonia gas sensing sensitivity to 17.6%.
Data Availability Statement
The raw data supporting the conclusions of this manuscript will be made available by the authors, without undue reservation, to any qualified researcher.
Author Contributions
All authors listed have made a substantial, direct and intellectual contribution to the work, and approved it for publication.
Conflict of Interest
The authors declare that the research was conducted in the absence of any commercial or financial relationships that could be construed as a potential conflict of interest.
References
Azimirad, R., and Safa, S. (2015). Preparation of three dimensional graphene foam WO3 nanocomposite with enhanced visible light photocatalytic activity. Mater. Chem. Phys. 162, 686–691. doi: 10.1016/j.matchemphys.2015.06.043
Behera, B., and Chandra, S. (2018). Synthesis of WO3 nanorods by thermal oxidation technique for NO2 gas sensing application. Mater. Sci. Semi. Process. 86, 79–84. doi: 10.1016/j.mssp.2018.06.022
Bittencourt, C., Felten, A., Espinosa, E. H., Ioneescu, R., Liobetr, E., Pireaux, J. J, et al. (2006). WO3 films modified with functionalized multi-wall carbon nanotubes: morphological, compositional and gas response studies. Sens. Actuators B Chem. 115, 33–41. doi: 10.1016/j.snb.2005.07.067
Björkbacka, A., Yang, M., Gasparrini, C., Leygraf, C., and Jonsson, M. (2015). Kinetics and mechanisms of reactions between H2O2 and copper and copper oxides. Dalton Trans. 44, 16045–11651. doi: 10.1039/C5DT02024G
Chen, D., Yin, L., Ge, L., Fan, B., Zhang, R., Sun, J., et al. (2013). Low temperature and highly selective NO-Sensing performance of WO3 nanoplates decorated with silver nanoparticles. Sens. Actuator. B Chem. 185, 445–455. doi: 10.1016/j.snb.2013.05.006
Chen, L., Huang, L., Lin, Y., Sai, L., hong, Q., Wang, C., et al. (2018). Chemical Fully gravure-printed WO3/Pt-decorated rGO nanosheets composite film for detection of acetone. Sens. Actuators B. Chem. 255, 1482–1490. doi: 10.1016/j.snb.2017.08.158
Chu, J., Lu, D., Wang, X., Wang, X., and Xiong, S. (2017). WO3 nanoflower coated with graphene nanosheet: synergetic energy storage composite electrode for supercapacitor application. J. Alloys. Compd. 702, 568–572. doi: 10.1016/j.jallcom.2017.01.226
Dinari, M., Momeni, M. M., and Ahangarpour, M. (2016). Efficient degradation of methylene blue dye over tungsten trioxide/multi-walled carbon nanotube system as a novel photocatalyst. Appl. Phys. A 2122, 876–882. doi: 10.1007/s00339-016-0403-2
Dong, S., Cui, Y., Wang, Y., Li, Y., Hu, L., Sun, J., et al. (2014). Designing three-dimensional acicular sheaf shaped BiVO4/reduced graphene oxide composites for efficient sunlight-driven photocatalytic degradation of dye wastewater. Chem. Eng. J. 249, 102–110. doi: 10.1016/j.cej.2014.03.071
Fan, H., Zhao, X., Yang, J., Shan, X., Yang, L., Zhang, Y., et al. (2012). ZnO-graphene composite for photocatalytic degradation of methylene blue dye. Catal. Commun. 29, 29–34. doi: 10.1016/j.catcom.2012.09.013
Galstyan, V., Comini, E., Kholmanov, I., Faglia, G., and Sberveglieri, G. (2016). Reduced graphene oxide/ZnO nanocomposite for application in chemical gas sensors. RSC Adv. 6, 34225–34232. doi: 10.1039/C6RA01913G
Gao, H., Yu, Q., Chen, K., Sun, P., Liu, F., Yan, X., et al. (2019). Ultrasensitive gas sensor based on hollow tungsten trioxide-nickel oxide (WO3-NiO) nanoflowers for fast and selective xylene detection. J. Colloid Interf. Sci. 535, 458–468. doi: 10.1016/j.jcis.2018.10.010
Gui, Y., Zhao, J., Wang, W., Tian, J., and Zhao, M. (2015). Synthesis of hemispherical WO3/graphene nanocomposite by a microwave-assisted hydrothermal method and the gas-sensing properties to trimethylamine. Mater. Lett. 155, 4–7. doi: 10.1016/j.matlet.2015.04.100
Guo, J. J., Li, Y., Zhu, S., Chen, Z., Liu, Q., Zhang, D., et al. (2012). Synthesis of WO3 Graphene composite for enhanced photocatalytic Oxygen evolution from water. RSC Adv. 2, 1356–1363. doi: 10.1039/C1RA00621E
Han, L., Chen, J., Zhang, Y., Liu, Y., Zhang, L., and Cao, S. (2018). Facile synthesis of hierarchical carpet-like WO3 Micro flowers for high NO2 gas sensing performance. Mater. Lett. 210, 8–11. doi: 10.1016/j.matlet.2017.08.065
Hieu, N. V., Hoang, V., Day, N. V., and Hoa, N. D. (2012). A morphological control of tungsten oxide nanowires by thermal evaporation method for sub-ppm NO2 gas sensor application. Sens. Actuators B Chem. 171-172, 760–768. doi: 10.1016/j.snb.2012.05.069
Hieu, N. V., Quang, V. V., Hoa, N. D., and Kim, D. (2011). Preparing large-scale WO3 nanowire-like structure for high sensitivity NH3 gas sensor through a simple route. Curr. Appl. Phys. 11, 657–661. doi: 10.1016/j.cap.2010.11.002
Jung, J. H., Cheon, D. S., Liu, F., Lee, K. B., and Seo, T. S. (2010). A graphene oxide based immuno-biosensor for pathogen detection. Angew. Chem. Int. Ed. Engl. 49, 5708–5711. doi: 10.1002/anie.201001428
Kaur, J., Anand, K., Kaur, A., and Singh, R. C. (2018). Sensitive and selective acetone sensor based on Gd doped WO3/reduced graphene oxide nanocomposite. Sens. Actuators B Chem. 258, 1022–1035. doi: 10.1016/j.snb.2017.11.159
Li, X., Wang, J., Xie, D., Xu, J., Dai, R., Xiang, L., et al. (2015). Reduced graphene oxide/hierarchical flower-like zinc oxide hybrid films for room temperature formaldehyde detection. Sens. Actuators B Chem. 221, 1290–1298. doi: 10.1016/j.snb.2015.07.102
Liu, X., Jin, A., Jia, Y., Xia, T., Deng, C., Zhu, M., et al. (2017). Synergy of adsorption and visible-light photocatalytic degradation of methylene blue by a bifunctional Z-scheme heterojunction of WO3/g-C3N4. Appl. Surface Sci. 405 359–371. doi: 10.1016/j.apsusc.2017.02.025
Luna, T., Chongfei, Y., Yinlan, Z., Hui, C., Siyu, Y., Jingyu, S., et al. (2018). Fabrication of WO3 nanorods on reduced graphene oxide sheets with augmented visible light photocatalytic activity for efficient mineralization of dye. J. Alloys Comp. 769, 83–91. doi: 10.1016/j.jallcom.2018.07.176
Min, Y.-L., Zhang, K., Chen, Y.-C., and Zhang, Y.-G. (2012). Enhanced photocatalytic performance of Bi2WO6 by graphene supporter as charge transfer channel. Sep. Purif. Technol. 86, 98–105. doi: 10.1016/j.seppur.2011.10.025
Mohamed, M. M., Khairy, M., and Eid, S. (2017). Surfactant-assited formation of silver titanates as active catalysts for methanol electro-oxidation. Appl. Catal. A 547, 205–213. doi: 10.1016/j.apcata.2017.08.031
Mohamed, M. M., Khairy, M., and Eid, S. (2018b). Polyethylene glycol assisted one-pot hydrothermal synthesis of NiWO4/WO3 heterojunction for direct Methanol fuel cells. Electrochim. Acta. 263, 286–298. doi: 10.1016/j.electacta.2018.01.063
Mohamed, M. M., Khairy, M., and Ibrahem, A. (2018a). Dispersed Ag2O/Ag on CNT-graphene composite: an implication for magnificent photoreduction and energy storage applications. Front. Chem. 6:250. doi: 10.3389/fchem.2018.00250
Morsy, M., Yahia, I. S., and Zahran, H. Y. (2018). Low cost alcoholic breath sensor based on SnO2 modified with CNTs. J. Korean Phys. Soc. 73, 1437–1443. doi: 10.3938/jkps.73.1437
Morsy, M., Yahia, I. S., Zahran, H. Y., and Ibrahim, M. (2019). Hydrothermal synthesis of CNTs/Co3O4@rGO mesoporous nanocomposite for enhanced VOCs. J. Inorg Organomet. Polym. 29, 416–422. doi: 10.1007/s10904-018-1011-8
Naseri, N., Yousefzadeh, S., Daryaei, E., and Moshfegh, A. Z. (2011). Photoresponse and H2 production of topographically controlled PEG assisted Sol-gel WO3 nanocrystalline thin films. Int. J. Hydrogen Energy. 36, 13461–13472. doi: 10.1016/j.ijhydene.2011.07.129
Pang, Y., Chen, Q., Shen, X., Tang, L., and Qian, H. (2010). Size-Controlled Ag nanoparticle modified WO3 composite films for adjustment of electrochromic properties. Thin Solid Films. 518, 1920–1924. doi: 10.1016/j.tsf.2009.07.138
Pearson, R. G. (1988). Absolute electronegativity and hardness: application to inorganic chemistry. Inorg. Chem. 27, 734–740. doi: 10.1021/ic00277a030
Poongodi, S., Kumar, P. S., Mangalaraj, D., Ponpandian, N., Meena, P., Masuda, Y., et al. (2017). Electrodeposition of WO3 nanostructured thinfilms for electrochromic and H2S gas sensor applications. J. Alloys. Compd. 719, 71–81. doi: 10.1016/j.jallcom.2017.05.122
Prabhu, S., Manikumar, S., Cindrella, L., and Kwon, O. J. (2018). Charge transfer and intrinsic electronic properties of rGO-WO3 nanostructures for efficient photoelectrochemical and photocatalytic applications. Mater. Sci. Semicond. Process. 74, 136–146. doi: 10.1016/j.mssp.2017.10.041
Quan, Q., Xin, L., Zhang, N., and Yi-Jun, X. (2017). Graphene and its derivatives as versatile templates for materials synthesis and functional applications, Nanoscale 9, 2398–2416. doi: 10.1039/C6NR09439B
Sadakane, M., Sasaki, K., Kunioku, H., Ohtani, B., Abe, R., and Ueda, W. (2010). Preparation of 3-D ordered macroporous tungsten oxides and nano-crystalline particulate tungsten oxides using a colloidal crystal template method, and their structural characterization and application as photocatalysts under visible light irradiation. J. Mater. Chem. 20, 1811–1818. doi: 10.1039/b922416e
Saidi, T., Palmowski, D., Kiewlicz, S. B., Welearegay, T. G., El Bari, N., Ionescu, R., et al. (2018). Exhaled breath gas sensing using pristine and functionalized WO3 nanowire sensors enhanced by UV-light irradiation. Sens. Actuators B Chem. 273 1719–1729. doi: 10.1016/j.snb.2018.07.098
Shendage, S. S., Patil, V. L., Vanalakar, S. A., Patil, S. P., and Harale, N. S. (2017). Sensitive and selective NO2 gas sensor based on WO3 nanoplates. Sens. Actuators B Chem. 240, 426–433. doi: 10.1016/j.snb.2016.08.177
Sun, M., Li, W., Sun, S., He, J., Zhang, Q., and Shi, Y. (2015). One-step in situ synthesis of graphene-TiO2 nanorod hybrid composites with enhanced photocatalytic activity. Mater. Res. Bull. 61, 280–286. doi: 10.1016/j.materresbull.2014.10.040
Toan, N. V., Hung, C. M., Duy, N. V., Hoa, N. D., Le, D. T. T., and Hieu, N. V. (2017). Bilayer SnO2-WO3 nanofilms for enhanced NH3 gas sensing performance. Mater. Sci. Eng. B 224, 163–170. doi: 10.1016/j.mseb.2017.08.004
Tsai, M., Lu, C., and Su, P. (2017). One-pot synthesis of AuNPs/RGO/WO3 nanocomposite for simultaneously sensing hydroquinone and catechol. Mater. Chem. Phys. 215, 293–298. doi: 10.1016/j.matchemphys.2018.05.058
Urasinska-Wojcik, B., Vincent, T. A., Chowdhury, M. F., and Gardner, J. W. (2016). Ultrasensitive WO3 as sensors for NO2 detection in air and low oxygen environment. Sens. Actuators. B Chem. 239, 1051–1059. doi: 10.1016/j.snb.2016.08.080
Wang, G., Ji, Y., Huang, X., Yang, X., Gouma, P. I., and Dudley, M. (2006). Fabrication and characterization of polycrystalline WO3 nanofibers and their application for ammonia sensing. J. Phys. Chem. B 110, 23777–23782. doi: 10.1021/jp0635819
Weng, B., Wu, J., Zhang, N., and Xu, Y.-J. (2014). Observing the role of graphene in boosting the two-electron reduction of oxygen in graphene–WO3 nanorod photocatalysts. Langmuir 30, 5574–5584. doi: 10.1021/la4048566
Zeng, J., Hu, M., Wang, W., Chen, H., and Qin, Y. (2012). NO2-sensing properties of porous WO3 gas sensor based on anodized sputtered tungsten thin film. Sens. Actuators B Chem. 161, 447–452. doi: 10.1016/j.snb.2011.10.059
Zhang, D., Sun, Y., Jiang, C., and Zhang, Y. (2017). Room temperature hydrogen gas sensor based on palladium decorated tin oxide/molybdenum disulfide ternary hybrid via hydrothermal route. Sen. Actuators. B Chem. 242, 15–24. doi: 10.1016/j.snb.2016.11.005
Zhang, N., Min-Quan, Y., Siqi, L., Yugang, S., and Yi-Jun, X. (2015). Waltzing with the versatile platform of graphene to synthesize composite photocatalysts. Chem. Rev. 115, 10307–10377. doi: 10.1021/acs.chemrev.5b00267
Zhang, N., and Yi-Jun, X. (2016). The endeavour to advance graphene–semiconductor composite-based photocatalysis. Cryst. Eng. Comm. 18, 24–37. doi: 10.1039/C5CE01712B
Keywords: hexagonal WO3, graphene oxide, hydrothermal method, gas sensing, MB photocatalysis, visible light irradiation
Citation: Salama TM, Morsy M, Abou Shahba RM, Mohamed SH and Mohamed MM (2019) Synthesis of Graphene Oxide Interspersed in Hexagonal WO3 Nanorods for High-Efficiency Visible-Light Driven Photocatalysis and NH3 Gas Sensing. Front. Chem. 7:722. doi: 10.3389/fchem.2019.00722
Received: 20 April 2019; Accepted: 10 October 2019;
Published: 01 November 2019.
Edited by:
Min-Cherl Jung, Nara Institute of Science and Technology (NAIST), JapanReviewed by:
Jianhui Sun, Henan Normal University, ChinaJung Ho Yun, University of Queensland, Australia
Copyright © 2019 Salama, Morsy, Abou Shahba, Mohamed and Mohamed. This is an open-access article distributed under the terms of the Creative Commons Attribution License (CC BY). The use, distribution or reproduction in other forums is permitted, provided the original author(s) and the copyright owner(s) are credited and that the original publication in this journal is cited, in accordance with accepted academic practice. No use, distribution or reproduction is permitted which does not comply with these terms.
*Correspondence: Mohamed Mokhtar Mohamed, mohmok2000@yahoo.com