Green Synthesis of Luminescent Gold-Zinc Oxide Nanocomposites: Cell Imaging and Visible Light–Induced Dye Degradation
 Kanika Bharti1
  Partha Roy
 Kalyan K. Sadhu
- 1Department of Chemistry, Indian Institution of Technology Roorkee, Roorkee, India
- 2Department of Biotechnology, Indian Institution of Technology Roorkee, Roorkee, India
Green synthesis of gold-zinc oxide (Au-ZnO) nanocomposite was successfully attempted under organic solvent–free conditions at room temperature. Prolonged stirring of the reaction mixture introduced crystallinity in the ZnO phase of Au-ZnO nanocomposites. Luminescence properties were observed in these crystalline Au-ZnO nanocomposites due to in situ embedding of gold nanoparticles (AuNP) of 5–6 nm diameter on the surface. This efficient strategy involved the reduction of Au(III) by Zn(0) powder in aqueous medium, where sodium citrate (NaCt) was the stabilizing agent. Reaction time and variation of reagent concentrations were investigated to control the Au:Zn ratio within the nanocomposites. The reaction with the least amount of NaCt for a long duration resulted in Au-ZnO/Zn(OH)2 nanocomposite. X-ray photoelectron spectroscopy (XPS) confirmed the formation of Zn(OH)2 and ZnO in the same nanocomposite. These nanocomposites were reconnoitered as bioimaging materials in human cells and applied for visible light–induced photodegradation of rhodamine-B dye.
Introduction
The development of luminescent AuNP has been an active area of material research over the past decade due to its potential applications from bench to clinical settings (Liu et al., 2013; Yu et al., 2019). Luminescent AuNP with 3 nm diameter showed a pH-dependent membrane adsorption property (Yu et al., 2011). Gold nanoclusters with small diameters and aggregated AuNP have also found to be luminescent in nature (Gan et al., 2016; Goswami et al., 2016; Saini et al., 2017; J. Wang et al., 2018a; Y. Wang et al., 2018b; Wu et al., 2019). In addition to imaging applications, deposition of gold nanoclusters or nanoparticles was successfully attempted on Ag@SiO2 or covalent organic framework for important functional activities such as circulating miRNA in human serum (Zhang Q. et al., 2019) or surface-enhanced Raman scattering (He et al., 2017), respectively. Building upon this past research, the present study developed a method to deposit luminescent AuNP with 5–6 nm diameter on the surface of Au-ZnO nanocomposites.
Au-metal oxide nanocomposites are known not only for their high surface-area-to-volume ratio but also for enhanced stability during their catalytic activity (Li et al., 2011; Ray and Pal, 2017; Wei et al., 2017; Cyganowski et al., 2019; Kauffman et al., 2019; Mageed et al., 2019). These hybrid nanomaterials possess unique optical, electronic, and magnetic properties, which are governed by their structural features, size, and compositional heterogeneities (Zu et al., 2015; Chamorro et al., 2016; Dutta Chowdhury et al., 2017; Lee et al., 2017; Song et al., 2017; Hu et al., 2018; Liu F. et al., 2019). A handful of synthetic methods of Au-metal oxide nanocomposites such as chemical vapor deposition, physical vapor deposition, hydrothermal method, spray pyrolysis, electrophoretic deposition, microwave-assisted thermal decomposition, magnetron sputtering, and spin coating are described in the literature (He et al., 2010; Shingange et al., 2016; Klug et al., 2017; Y. Wang et al., 2017a).
Considering the growing demand for Au-metal oxide–based nanocomposites for industrial and biomedical applications (Chen D. et al., 2015; Chen et al., 2017; Liu et al., 2018; Zhou et al., 2018; Gao et al., 2019; Jia et al., 2019; Zhang M. et al., 2019), there is a critical need to design a more facile and well-regulated synthetic route. Synthesis of metal-based nanocomposites by organic solvent–free conditions has drawn a lot of attention in the current decade (Li et al., 2013; Yao et al., 2013; Zhang et al., 2016; Qi et al., 2019; Ritchie et al., 2019). Au-ZnO nanocomposites, which are well known for a variety of applications, have been synthesized at high temperature in the presence of organic solvent (Yao et al., 2011; Tahir et al., 2013; Hang et al., 2016; Chang et al., 2017; Lupan et al., 2019). There are two reports, where AuNP was decorated on the crystalline ZnO nanorod surface at high temperature (Unlu et al., 2015; Ning et al., 2019). However, there is a lacuna of AuNP on the surface of Au-ZnO nanocomposites due to the synthetic challenges involving the two gold nanostructures simultaneously on the same material. In our synthetic methodology, the occlusion of AuNP of 5–6 nm diameter was successful for the first time on the surface of Au-ZnO nanocomposites in aqueous medium and at room temperature by the reduction of Au(III) salt with Zn(0) powder in the presence of AuNP as seed and NaCt as the stabilizing agent.
Au-ZnO nanocomposites with different Au:Zn compositions were prepared by varying the amount of AuNP seed, NaCt, and Zn metal powder. The reaction mixture in solution or the isolated nanocomposite materials in solid state were characterized by electronic absorption, XPS, FE-SEM (field emission scanning electron microscopy), energy dispersive X-ray (EDX), TEM (transmission electron microscopy), PXRD (powder X-ray diffraction), and surface charge analysis. All these characterizations of nanocomposites confirmed the key roles of AuNP seed, NaCt, and Zn metal in controlling Au:Zn ratio.
The redox reaction between Au(III) and Zn(0) was initially performed for 75 min, and this led to development of Au-ZnO nanocomposites (Au-aZnO, aZn1-aZn8) with ZnO in the amorphous phase (Scheme 1). However, when the same reaction was continued for 150 min, both Au and ZnO were found to be in crystalline phase without much variation in Au:Zn ratio. Interestingly, AuNP of 5–6 nm diameter was occluded on the surface of crystalline Au-ZnO nanocomposites (AuNP-Au-cZnO, cZn1-cZn4) during 150 min stirring of the reaction mixture (Scheme 1). Introduction of AuNP in AuNP-Au-cZnO showed a luminescent property with maximum emission at 496 nm after excitation of the samples at 436 nm. In comparison, Au-aZnO did not show any luminescence properties. This method opens up new avenues for fabricating Au-ZnO nanocomposites with different compositions under mild conditions. The excitation wavelength of the luminescent AuNP-Au-cZnO nanocomposites helped in the photodegradation of rhodamine-B in the presence of 455 nm light.
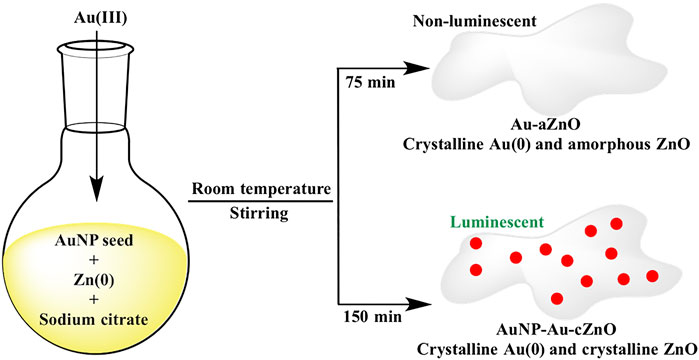
SCHEME 1. Synthetic route of Au-aZnO (aZn1-aZn8) and AuNP-Au-cZnO (cZn1-cZn4) nanocomposites in aqueous medium.
Materials and Methods
Materials. The chemicals gold (III) chloride trihydrate and rhodamine-B were purchased from Sigma-Aldrich, and trisodium citrate dihydrate was purchased from Merck chemicals. Zinc powder was purchased from SISCO Research Laboratory. All glassware and stirrer bars were washed with freshly prepared aqua regia (mixture of 1:3 volume ratio of nitric acid:hydrochloric acid) and then with Millipore water and dried in an oven before use.
Synthesis of gold nanoparticle seed. AuNP seed (average size 19 ± 3 nm) solution with surface plasmon resonance (SPR) peak at 524 nm was prepared by the NaCt-based reduction method (Wuithschick et al., 2015). The concentration in terms of nanoparticle per ml was calculated as per methods given in the literature (Johonston, 2002; Lewis et al., 2006).
Preparation of seed stock. Seed solution was prepared by taking 200 µL as-synthesized gold nanoparticle and adding to it 19.8 ml of 1% (w/v) trisodium citrate dihydrate solution to make final volume to 20 ml.
Synthetic schemes and brief characteristics of all nanocomposites have been summarized in Supplementary Schemes S1, S2.
Syntheses of the nanocomposites aZn1 to aZn5. For zinc-gold nanocomposites, five different solutions were prepared. Each solution contained 20 mg (0.05 mmol) HAuCl4 in 200 ml of Millipore water. To these solutions, five different nanoparticles per mL (22.4 × 10⁴, 45 × 104, 90 × 104, 180 × 104, and 900 × 104) as seed were added, respectively, to produce aZn1 to aZn5. In each of these five solutions, additional 2 ml 1% (w/v) solution of trisodium citrate dihydrate (0.07 mmol) and 20 mg zinc powder (0.3 mmol) were added. All these reaction mixtures were stirred for 75 min at room temperature followed by filtration.
Syntheses of nanocomposites aZn6 and aZn7. Two solutions contained 20 mg (0.05 mmol) HAuCl4 in 200 ml of Millipore water. In both the solutions, 2 ml 1% (w/v) solution of trisodium citrate dihydrate (0.07 mmol) and 200 mg (3 mmol) of zinc were added. Two different seeds, 900 × 104/ml and 22.4 × 10⁴/ml (nanoparticle/ml), were added to produce aZn6 and aZn7, respectively. The reaction mixtures were stirred at room temperature for 75 min and filtered.
Syntheses of gold-zinc nanocomposites using variable citrate concentration. Five different solutions were prepared. Each solution contained 20 mg (0.05 mmol) HAuCl4 in 200 ml of Millipore water. The addition of seed (nanoparticle/ml) was restricted to 22.4 × 10⁴/ml in each solution, and the reaction was stirred for 75 min. Five different amounts (0.2, 0.4, 0.6, 0.8, and 1.0 ml) of 1% (w/v) solution of trisodium citrate dihydrate were added followed by addition of 20 mg zinc powder (0.3 mmol). The reaction mixtures were stirred for 75 min and filtered. The filtered solutions were characterized by UV-visible spectroscopy.
Synthesis of nanocomposite aZn8. One solution contained 20 mg (0.05 mmol) HAuCl4 in 200 ml of Millipore water. To this were added seed (nanoparticle/ml) of 900 × 104/ml and 0.021 mmol of trisodium citrate dihydrate followed by addition of zinc (3.0 mmol) powder to obtain aZn8. The reaction mixture was stirred at room temperature for 75 min and filtered.
Synthesis of cZn1. 20 mg (0.05 mmol) HAuCl4 was added to 200 ml of Millipore water. To the solution, seed of 900 × 104/ml (nanoparticle/ml) was added during stirring followed by 2 ml 1% (w/v) solution of trisodium citrate dihydrate (0.07 mmol) and 20 mg zinc powder (0.3 mmol) to obtain cZn1. Reaction mixture was stirred for 150 min at room temperature followed by filtration.
Synthesis of cZn2. 20 mg (0.05 mmol) HAuCl4 was added to 200 ml of Millipore water. Then, during stirring, seed of 900 × 104/ml (nanoparticle/ml) was added followed by 2 ml 1% (w/v) solution of trisodium citrate dihydrate (0.07 mmol) and 200 mg (3 mmol) of zinc metal powder to obtain cZn2. The reaction mixtures were stirred at room temperature for 150 min and filtered.
Synthesis of cZn3. 20 mg (0.05 mmol) HAuCl4 was added to 200 ml of Millipore water. Then, during stirring, seed of 22.4 × 10⁴/ml (nanoparticle/ml) was added followed by 2 ml 1% (w/v) solution of trisodium citrate dihydrate (0.07 mmol) and 200 mg (3 mmol) of zinc metal powder to obtain cZn3. The reaction mixtures were stirred at room temperature for 150 min and filtered.
Synthesis of cZn4. 20 mg (0.05 mmol) HAuCl4 was added to 200 ml of Millipore water. Then, during stirring, seed of 900 × 104/ml (nanoparticle/ml) was added followed by 600 μL 1% (w/v) solution of trisodium citrate dihydrate (0.021 mmol) and 200 mg (3 mmol) of zinc metal powder to obtain cZn4. The reaction mixtures were stirred at room temperature for 150 min and filtered.
Yield of cZn1 to cZn4. The bulk scale reactions were carried out with 100 mg (0.25 mmol) HAuCl4 in one batch. The other reagents were taken in the same ratio mentioned in the syntheses. After the filtration process, the filtrate was centrifuged and finally dried under vacuum to isolate the solid cZn1 to cZn4. The yields of cZn1, cZn2, cZn3, and cZn4 were 45, 57, 54, and 43 mg, respectively. These solids were stored at room temperature in dark for further application and characterization.
Synthesis of ZnO. ZnO was prepared by the reported method of (Pourrahimi et al., 2014). 250 ml of 0.1 M zinc sulfate salt was stirred for 15 min at 60°C. After 15 min, 250 ml 0.25 M NaOH solution was heated separately at 60°C and added to the zinc sulfate solution during stirring. The reaction was continued with stirring for 60 min. The white precipitate obtained was kept for calcination at 400°C for 3 h in a muffle furnace.
Methods
Absorption spectroscopy. Nanocomposite solutions were characterized using a UV-Vis spectrometer (UV-1601, Shimadzu). Absorbance measurement was taken over 400–800 nm wavelength range.
Transmission electron microscopy (TEM). The TEM images of nanocomposites and SAED patterns were obtained using FEI, Technai G2 20 S-TWIN. Image J software was used to analyze the average diameter of GNPs.
Field emission scanning electron microscopy (FE-SEM). The FE-SEM (Carl ZEISS Ultra plus Gemini, Germany) images were employed to analyze the morphological features. Energy-dispersive X-ray (EDX) and EDX-mapping of the nanocomposites were performed to find the composition.
X-ray photoelectron spectroscopy (XPS). XPS experiments were performed with PHI 5000 Versa Prob II, FEI Inc., and a C60 sputter gun has been used for characterization. The chemical states of the gold nanoparticles were characterized by XPS with monochromatized Al K(α) excitation (h = 1486.6 eV). The C 1s (284.8 eV) was used as a reference to calibrate the peak X-ray photoelectron spectroscopy (XPS) with Auger electron spectroscopy (AES) module positions of the elements.
Powder X-ray diffraction (PXRD). PXRD was performed using Bruker-D8 advance with an X-ray source, a 2.2 kW Cu anode, and an accelerating voltage of 40 kV.
Luminescence measurement. Luminescence of nanocomposites cZn1, cZn2, cZn3, and cZn4 was measured using a Synergy microplate reader (Biotek United States) instrument, within the range of 470–700 nm with λex = 436 nm. The relative quantum yield was calculated with respect to fluorescein in 0.1 M NaOH (Q.Y. = 0.95) as reference (Brouwer, 2011) for comparison. The excitation spectra were measured using the same instrument within the range of 380–460 nm with λem = 496 nm.
Surface charge measurement. Surface charge measurements were obtained using a Zetasizer Nano ZS90 (Malvern Instruments). DTS applications 7.03 software was used to analyze the data.
Time-resolved fluorescence measurement. Fluorescence decay of fluorescein was estimated using the TCSPC system from Horiba Jobin Yvon FluoroHub Instrument, with λex = 435 nm and λem = 496 nm. Data analysis was performed with DAS6 software. The decay time data were analyzed using exponential sum, employing a nonlinear least squares reconvolution analysis. Average fluorescence lifetimes were calculated as Σαiτi2/Σαiτi with normalized αI (Lakowicz, 2006).
Photocatalytic degradation of rhodamine-B using 455 nm LED or 254 nm UV light. Nanocomposites cZn1, cZn2, cZn3, and cZn4 (10 mg) were dispersed in 18 ml deionized water, separately sonicating them for 10 min. To these, 2.0 ml of 1.0 × 10⁻⁴ M rhodamine-B stock solution was added and stirred in dark for 30 min before irradiation in 455 nm LED light or 254 nm UV light. The samples were then kept under light; absorption spectra were recorded at regular intervals of time. The photocatalysis experiments were carried out at pH 7 and at room temperature. A decrease in absorption maximum at 556 nm was observed with photocatalytic degradation of the rhodamine-B dye.
Cell viability assay. To determine the cytotoxic effect of the test materials, MTT (3-(4,5-dimethylthiazol-2-yl)-2,S- diphenyltetrazolium bromide) assay was carried out according to the protocol reported elsewhere. In brief, the cells (5000 cells/200 µL/well) were seeded in a 96-well plate. Nanocomposite suspension at 50 μg/ml concentrations was added to the monolayer in triplicate and incubated for 2, 4, 8, 12, and 24 h. Then, after the addition of 20 μL of 5 mg/ml MTT (Sigma-Aldrich, MO, United States) reagent, the cells were allowed to incubate for another 4 h at 37°C. The formazan crystals formed inside the cells were then solubilized by adding 200 μL of DMSO (HiMedia, Mumbai, India) to each well. The viable cells that showed the formation of violet crystals were quantified at 570 nm using a microplate reader (Omega fluostar, BMG Labtech Ltd., Germany). The cell cytotoxicity was expressed as percentage cell viability in comparison to the control group.
Fluorescence microscopy. The internalization of nanocomposites was monitored at 2 h, and the images were captured using a fluorescence microscope (Evos Floid cell imaging station, Invitrogen, United States) under ×200 magnification. In brief, HEK293 cells (5000 cells/200 µL/well) were seeded in a 96-well plate and allowed to adhere for 24 h. Then, nanocomposites (50 μg/ml) were incubated with the cells for 2 h, and the images were captured after washing with PBS.
Results and Discussion
Synthesis of optimized materials of amorphous and crystalline Au-ZnO nanocomposites (Au-aZnO, aZn5-aZn8, and AuNP-Au-cZnO, cZn1-cZn4). Two different types of nanocomposites on the basis of Zn powder as reducing agent were synthesized from aqueous solution of HAuCl4 by variation of AuNP seed, Zn powder, and NaCt as stabilizing agents as mentioned in Table 1. In order to develop the crystalline nature in the ZnO part of the newly synthesized nanocomposites (cZn1-cZn4) by maintaining green synthetic methodology (Ning et al., 2019), we focused on the reaction time duration instead of introducing organic solvent or high temperature. The crystallinity in the nanocomposites was obtained by increasing the reaction time twice to that of the initial reactions. During all the syntheses, a reducing agent was added at last. The pH of the solution before the addition of Zn powder varied within the range of 6.8–7.0, while the pH of the solution increased within the range of 7.3–7.8 after stirring for either 75 min or 150 min. This pH range helped in the stabilization of the basic Au-ZnO nanocomposite in the aqueous medium. The procedure was adapted on the basis of redox reaction between Au(III) and Zn(0), which does not require a basic or acidic medium. As ZnO is amphoteric in nature, there is a chance that zinc salt will form at a pH that is too low and that zinc hydroxide will form at a high pH (Degen and Kosec, 2000).

TABLE 1. Summary of Au-ZnO nanocomposites based on EDX analysis from FE-SEM.
The concentration of seed was varied within the range of 22.4 × 10⁴ per ml to 900 × 104 per ml. There is a blueshift in the absorbance (marked with an arrow in Supplementary Figure S1) from aZn1 to aZn5. However, all these redshifted absorbance peaks with respect to seed are either due to the growth of seed aZn1 or due to the incorporation of ZnO layer in the Au-ZnO composite aZn5 (Viter et al., 2015). We performed a series of experiments (Supplementary Figure S1) to generate the SPR peaks for gold nanomaterials by varying the zinc amount. We have noticed that a minimum of 6 equivalents of zinc is required to produce stable SPR peak and the peak intensity gets saturated in presence of 60 equivalents. The presence of 60 equivalents of reducing agent with respect to HAuCl4 did not show much difference in Zn amount among the synthesized nanocomposites (aZn6, aZn7, cZn2, and cZn3). Lowering down the concentration of reducing agent from 60 equivalents to 6 equivalents drastically decreased the incorporated Zn amount (vide infra) within the nanocomposites aZn5 or cZn1. The treatment of 30% stabilizing agent with respect to the synthesis of aZn6 or cZn2 showed a 50% decrease in the incorporated Zn amount in the nanocomposites aZn8 or cZn4.
Synthesis of remaining Au-ZnO nanocomposites (Au-aZnO, aZn1-aZn4) and characterization of aZn1-aZn8. Room temperature reaction in aqueous medium with variable AuNP seed concentration in the presence of NaCt (0.07 mmol) as stabilizing agent and Zn (0.3 mmol) as reducing agent for HAuCl4 (0.05 mmol) produced a violet color in different solutions (Supplementary Figure S1) within 75 min. The redshift observed in the SPR band of aZn1 (λmax = 575 nm) formed using 22.5 × 10⁴ particles/ml in comparison to seed is due to formation of ZnO. This type of shift due to the formation of the ZnO layer on Au-film was reported in the literature (Viter et al., 2015). Reaction with 900 × 104/ml seed concentration showed aZn5 with enhanced coloration with blueshift (λmax = 555 nm) compared to aZn1. However, this absorption exhibited clear redshift with respect to seed particle (Yu et al., 2005). In absence of AuNP seed, there was no SPR absorbance in the reaction mixture even after 3 h of reactions between HAuCl4 and Zn powder in the presence of NaCt.
The formations of Au-ZnO nanocomposites were confirmed with TEM, FE-SEM images, and EDX analysis of aZn1 to aZn5 (Supplementary Figures S2, S3). In the synthesis process, the metal powder was engaged in redox reaction between Au(III)/Au(0) and Zn(II)/Zn(0) couple, in addition to playing the role of simple metal source, thereby leading to the formation of Au-ZnO nanocomposites. Although the incorporation of Zn in the respective nanocomposite aZn1 was sparse, we were successful in increasing the Au:Zn ratio up to 1:0.1 (weight percentage) in aZn5.
An increase in the concentration of Zn (3 mmol) led to rapid (∼1 min) appearance of violet color in the reaction mixture for aZn6 (Supplementary Figure S4). In PXRD (Supplementary Figure S5), only the characteristic peaks of Au(0) were observed for aZn6, suggesting the amorphous (X. Wang et al., 2017b) nature of ZnO in Au-aZnO nanocomposites. An enhancement of approximately 10 times the Zn content in aZn6 (Au:Zn = 1:1) was confirmed by FE-SEM and EDX analysis (Supplementary Figure S6). No visible color generation in the absence of Zn powder (Supplementary Figure S4) affirmed the role of the metal powder in the redox process. The variation of seed concentration involving higher amount of Zn powder did not show any appreciable shift in the plasmonic bands (Supplementary Figure S4). Nanocomposite aZn7 synthesized using 3 mmol Zn powder with 22.4 × 10⁴/ml seed concentration resulted in Au:Zn = 1:0.9 (Supplementary Figure S7).
In order to rule out the competitive reduction of Au(III) by NaCt, the amount of the same was decreased from 0.035 to 0.007 mmol for Au-aZnO nanocomposites preparation at a constant seed concentration of 22.4 × 10⁴/ml and Zn powder of 0.3 mmol (Supplementary Figure S8). We performed the synthesis of nanocomposites with different concentrations of sodium citrate. We observed that a stable SPR peak was generated in the presence of 0.021 mmol of sodium citrate. This result suggested that a threshold amount of NaCt (0.021 mmol) was essential as the stabilizing agent in the reduction process to synthesize the Au-aZnO nanocomposites. Lowering the NaCt concentration from 0.07 to 0.021 mmol with 900 × 104/ml led to the lowering of Zn incorporation in Au-ZnO nanocomposites, Au:Zn = 1:0.5 in aZn8 (Supplementary Figures S9, S10). The chemical compositions of the Au-aZnO nanocomposites obtained from EDX analysis were further confirmed by XPS analysis. This also reveals the oxidation states of different elemental species present in Au-aZnO nanocomposites (Supplementary Figure S11). Binding energy studies confirmed the peaks of Au 4f7/2 (Fuggle et al., 1977), Zn 2p3/2 (Strohmeier and Hercules, 1984), and O 1s (Tan et al., 1990) at 83.0, 1021.4, and 530 eV, respectively, in these nanocomposites. These Au-aZnO nanocomposites were found to be nonluminescent in nature unlike the previously reported emissive ZnO nanoparticles (Tang et al., 2010; Jangir et al., 2017; Raji and Gopchandran, 2017).
Characterization of crystalline Au-ZnO nanocomposites (AuNP-Au-cZnO, cZn1-cZn4). EDX analyses of the samples after the reaction with a longer duration resulted in a similar amount of ZnO incorporation in the nanocomposites (Supplementary Figures S12–S15). However, crystallinity was introduced (Figure 1A; Supplementary Figure S16) in both the Au and ZnO components of the cZn2, cZn3, and cZn4 nanocomposites. In the case of cZn1, the amount of ZnO was very less, which restricted visualization of the crystallinity of ZnO in this sample by PXRD. The distinct difference in the PXRD data for the samples cZn2 to cZn4 confirmed the additional peaks due to crystalline ZnO in these nanocomposites. XRD peak positions (in degrees) and their corresponding FWHM values (in degrees) are shown in Supplementary Table S1. In XRD patterns (Figure 1; Supplementary Figure S16), there is a small redshift as compared to ZnO (JCPDS no. 00-021-1486 and Caglar et al., 2009) due to the inclusion of gold in nanocomposites. This interaction of gold and zinc oxide in our nanocomposites has been further supported with more FWHM values compared to bare ZnO.
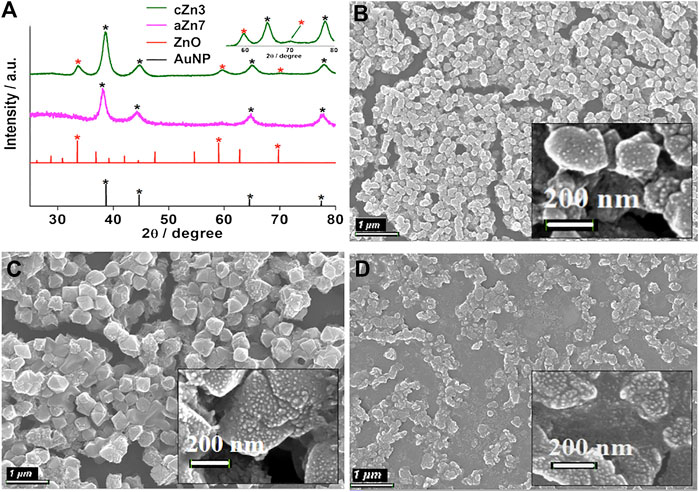
FIGURE 1. (A) XRD of aZn7 and cZn3 compared with the AuNP (JCPDS no. 00–004–0784) and ZnO (JCPDS no. 00–021–1486); FE-SEM images of AuNP-Au-cZnO nanocomposites: (B) cZn2, (C) cZn3, and (D) cZn4. The scale bar for B–D: 1 µM and the scale bar for inset images: 200 nm.
In the case of absorption studies, the nanocomposites cZn1 to cZn4 showed redshift in SPR peak (λmax at ∼565 nm, Supplementary Figure S17) with respect to AuNP seed solution. The absorption peak at 565 nm was observed in the case of cZn1. However, in the case of cZn4, a broad flat peak was observed around a wide range of 500–700 nm. The changes in absorbance spectra with respect to cZn2 are due to variation of seed nanoparticle/ml (cZn3), reducing agent (cZn1), and stabilizing agent (cZn4). These variations in the experimental conditions result in the different compositions of zinc to gold ratio in cZn1 to cZn4 (Table 1). There is strong interface damping of the surface plasmon due to the interaction with ZnO. The broadening and decrease of the peak intensity of the plasmonic band from cZn1 to cZn2 are due to an increase in ZnO layers as compared to gold seed. It indicates a strong charge carrier interaction at the interface between Au and ZnO (Gogurla et al., 2020). The slight variation in the absorbance in cZn2 and cZn3 is due to difference in the seed nanoparticle/ml for these syntheses. The broad and low intense SPR peak in cZn4 is due to the less amount of stabilizing agent, which is essential to stabilize the AuNP and its SPR absorbance. The FE-SEM image of cZn1 exhibited octahedral shape nanostructure (Supplementary Figure S18). The other FE-SEM images (Figures 1B–D) demonstrated that structure and shape morphologies were tuned in all four cases cZn1 to cZn4 with respect to aZn5, aZn6, aZn7, and aZn8. Interesting surface morphologies with clear appearances of dots were observed in FE-SEM images for the nanocomposites cZn2 to cZn4. These dots were further clarified in the focused surfaces (Figures 1B–D insets) of the nanocomposites. The overall particle size of the AuNP-cZnO composite was increased up to 200 nm (Figure 1B) and to 400 nm (Figure 1D) due to the growth reaction between HAuCl4 and Zn powder at the edge of the AuNP seed as support and NaCt as a stabilizing agent.
In order to clarify the crystalline nature of both Au and ZnO in the nanocomposites, selected area electron diffraction (SAED) pattern was recorded. In the case of cZn4, the SAED patterns confirmed the presence of crystalline Au and ZnO in the same sample (Figure 2A). The diffraction patterns for Au planes were similar in cZn1 to cZn4. The difference in the diffraction pattern is due to ZnO. The calculated distances between ZnO planes from diffraction SAED pattern are 0.29, 0.34, 0.30, and 0.28 nm for cZn1, cZn2, cZn3, and cZn4, respectively. This change in the ZnO plane from cZn2 to cZn4 is due to the additional incorporation of gold nanoparticles in these nanocomposites. Furthermore, the TEM image of cZn4 (Figure 2B) corroborated the formation of small size AuNPs on the surface of AuNP-Au-cZnO nanocomposites. The aforementioned result confirmed the generation of AuNP on the nanocomposite surface via the reduction of Au(III) by Zn(0) powder. The high-resolution TEM (HR-TEM) image of the surface confirmed the occlusion of AuNP of 5–6 nm diameter (Figure 2C) on the cZn4 nanocomposite surface. This type of Au-ZnO nanocomposite surfaces (Supplementary Figure S19) was also observed for cZn1-cZn3. From Williamson Hall plot (Supplementary Figure S20) analysis, lattice strains are calculated, and values are 0.00253, 0.00224, 0.00418, and 0.00808 for cZn1, cZn2, cZn3, and cZn4, respectively. This trend in lattice strain is due to the change in crystal packing (confirmed from HR-TEM and SAED patterns) associated with the degree of disorders (Gogurla et al., 2018).
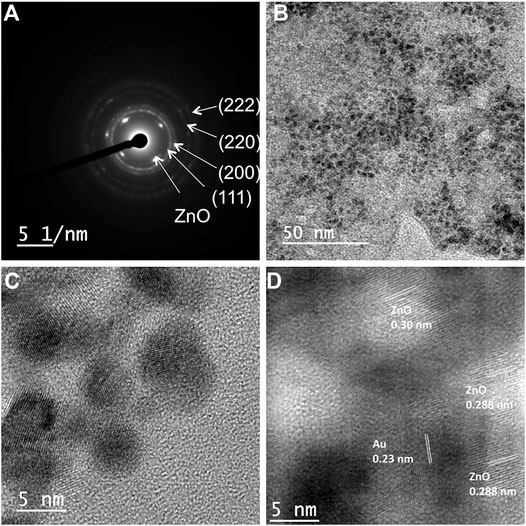
FIGURE 2. (A) SAED image of cZn4; (B) TEM image and (C) HR-TEM showing 5–6 nm AuNPs on nanocomposite cZn4, (D) HR-TEM image showing fringe lines corresponding to both Au and ZnO in cZn4.
During the synthesis of nanocomposites, 19 nm AuNP seeds did not convert to 5–6 nm AuNP, which was occluded in situ on the Au-ZnO surface. These 5–6 nm Au nanoparticles were obtained directly during the reduction of HAuCl4 by Zn powder in the synthetic process. This generation of 5–6 nm AuNP was not even due to Ostwald ripening as this type of ripening process was involved in the postsynthetic step (Jang et al., 2012). Moreover, Ostwald ripening showed very less enhancement with higher particle size such as 15 nm AuNP (Pattadar and Zamborini, 2019).
Another HR-TEM image of the cZn4 surface, on which AuNP occlusion was observed, confirmed lattice fringes corresponding to both Au and ZnO. The d-spacing of 0.23 and 0.20 nm (Figure 2D; Supplementary Figure S21) revealed the presence of Au (111) and Au (200) planes (Guo et al., 2017). The interplanar spacings of 0.288 and 0.30 nm were found consistent with ZnO, which is in agreement with the XRD spectral peaks according to Joint Committee on Powder Diffraction and Standards (JCPDS no. 00-021-1486; Pradhan and Leung, 2008). Lattice mismatches between Au and ZnO were also observed in this HR-TEM image.
In order to find the detailed composition of cZn1-cZn4, the XPS survey scans for all the samples were performed (Figure 3A; Supplementary Figures S22–S24). These survey scans indicated the presence of Au, C, O, and Zn in the nanocomposites. For nanocomposite cZn1 (Supplementary Figure S22), carbon 1s spectra showed two peaks at 284.8 and 288.7 eV due to aliphatic carbon of –COO group (Di Mauro et al., 2017). The high-resolution scan XPS spectra of Zn illustrated Zn 2p3/2 and Zn 2p1/2 peak at 1021 and 1044.8 eV, which were reported for the ZnO system. The O 1s spectrum shows a peak at 531.68 eV due to O2- species present in oxygen deficient regions of ZnO and 531.68 eV for C=O bond. Deconvulating high-resolution XPS spectra of Au showed a peak at 83.2, 86.9, 88.8, and 91.67 eV, which corresponded to Au 4f7/2, Au 4f5/2, Zn 3p3/2, and Zn 3p1/2, respectively. The binding energies for Au 4f7/2 and Au 4f5/2 were shifted slightly in comparison to Au(0) at 84 and 88 eV due to electron transfer from ZnO to Au (Gogurla et al., 2014). The XPS analyses for cZn2 and cZn3 (Supplementary Figures S23, S24) showed similar characteristics.
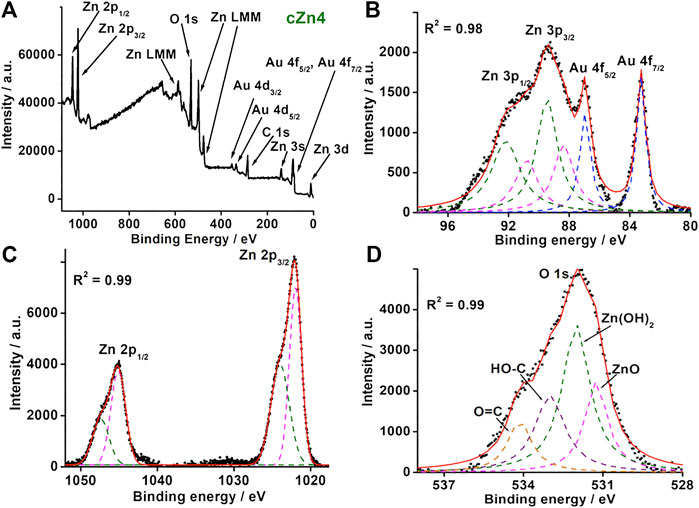
FIGURE 3. (A) Survey XPS spectrum and (B–D) high-resolution XPS spectra for Au 4f, Zn 3p, Zn 2p, and O 1s of nanocomposite cZn4.
For nanocomposite cZn4 (Supplementary Figure S25), carbon 1s spectra showed a similar trend to that of cZn1. The high-resolution XPS spectrum of Au (Figure 3B) was resolved into six peaks and out of these two corresponded to Au 4f7/2 (83.19 eV) and Au 4f5/2 (86.98 eV). The other four peaks at 88.35, 89.40, 90.80, and 92.18 eV were due to Zn 3p3/2 and 3p1/2 from ZnO and Zn(OH)2. High-resolution XPS spectrum for Zn (Figure 3C) was resolved into four peaks at Zn 2p3/2 (1022.9 eV) and Zn 2p1/2 (1045.12 eV) which correspond to ZnO and XPS peak at Zn 2p3/2 (1023.9 eV) and Zn 2p1/2 (1047.44 eV) contributing to Zn(OH)2 (Klug et al., 2017). The O 1s spectrum (Figure 3D) showed four peaks at 531.2, 532.0, 533.0, and 534.14 eV due to oxygen vacancies in ZnO and Zn(OH)2 and the oxygen atom of C-O, C=O bonds (Geng et al., 2018). The band gap due to zinc hydroxide compares to the band gap of ZnO (Karakawa et al., 2018). The ratio of two XPS peak areas of bare ZnO (Supplementary Figure S26) with nanocomposites suggests the maximum interaction between Au and ZnO in cZn2 and cZn4 (Supplementary Table S2).
FE-SEM, HR-TEM, and XPS together confirmed the occlusion of AuNP on the surface of Au-ZnO nanocomposites in the cases of cZn2 and cZn3. In the case of cZn4, synthesized with the threshold amount of NaCt, AuNP occlusion took place on the surface of Au-ZnO/Zn(OH)2. The surface charges of cZn1 and cZn2 were found to be –3.78 and –0.33 mV (SupplementaryTable S3). These differences were due to the variation of electron transfer from ZnO to Au (Gogurla et al., 2014). In the case of cZn3, highly negative charge surface (-24.4 mV) was obtained due to the presence of less amount of seeds (nanoparticle/ml) in comparison to cZn2. For cZn4, the electron transfer from ZnO to Au was less due to the presence of Zn(OH)2 in the nanocomposite. This reflected in the slightly positive surface of cZn4 (0.36 mV) nanocomposites.
Luminescent properties of crystalline Au-ZnO nanocomposites (cZn1-cZn4) and their applications. The absorbance spectra of these nanocomposites showed peaks at 358 nm (Supplementary Figure S17). The excitation of sample cZn2 at 350 nm produced dual emission peaks at 398 and 448 nm (Supplementary Figure S27A) with a broad tail up to 700 nm. The excitation spectra for 398 and 448 nm showed a peak at 358 nm (Supplementary Figure S27B), which was similar to the absorption peak. In order to find out the origin of the broadening, the deconvolution of the emission spectra was performed. This resulted in the emission of three additional peaks at 496, 547, and 590 nm. The emission around 398 nm was due to band-to-band transition of ZnO nanomaterial (Kuiri and Pramanik 2018). The excitation spectrum (Supplementary Figure S27B) for the emission at 448 nm showed a peak at 358 nm, which was due to the presence of ZnO in the nanocomposite (Liu et al., 2019). The last two emissions at 547 and 590 nm were due to oxygen vacancies in the ZnO nanocomposites. Reported ZnO nanostructures exhibited visible emissions within 420–569 nm by exciting at 370 nm (Khokhra et al., 2017) due to the zinc defects such as interstitials, natural and singly and doubly ionized interstitials. The emission peaks at 448, 547, and 590 nm by exciting the sample at 358 nm in our case are due to the point defect of ZnO. The remaining emission at 496 nm by excitation at 436 nm is due to the formation of 5–6 nm AuNP. The time-resolved fluorescence study (Supplementary Figure S28) in our case showed the similar trend of three decay components, which were similar to the previously reported emission from gold nanoclusters (Chattoraj and Bhattacharyya 2014). The quantum yields at 398, 448, 496, 547, and 590 nm wavelengths for cZn2 were found to be 4.23, 3.48, 2.00, 0.81, and 0.56%, respectively. The excitation spectra for the other three emission peaks showed a peak at 436 nm (Figure 4A). The origin of this excitation peak at 436 nm was probably due to the energy transfer from the initial dual emission for in situ stabilized AuNP on Au-ZnO nanocomposites. The maximum emission from cZn2 was observed at 496 nm by exciting the aqueous suspension at 436 nm (Figure 4B). In order to avoid excitation in the UV region at 358 nm, we chose 436 nm as excitation wavelength for our further studies. We checked the luminescence property of cZn1 to cZn4 by measuring the emission and excitation spectra (Figures 4A,B) in aqueous suspension. The quantum yields of these broad emissions for cZn1, cZn3, and cZn4 were found to be 0.27, 0.67, and 0.95%, respectively. The poor quantum yield was due to the mixing of emission from ZnO nanocomponent with the excitation peak due to 5–6 nm AuNP on the AuNP-cZnO surface. The difference in emission behavior is mostly due to the formation of small size AuNP and this type of emission is highly dependent on the size and shape of gold nanoparticles (Chen et al., 2015). The emission maxima vary with Zn powder, AuNP seed, and NaCt concentration as reflected by cZn1, cZn3, and cZn4, respectively for cZn2.
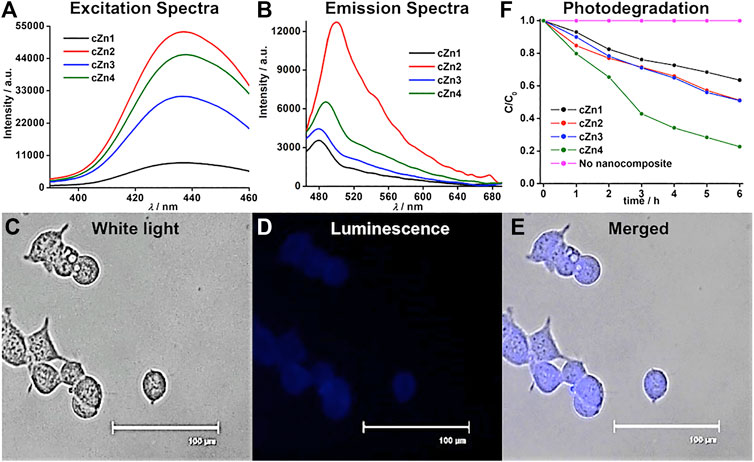
FIGURE 4. (A) Excitation, (B) emission spectra of nanocomposites cZn1-cZn4, (C–E) imaging of cZn2 in HEK293 cells, where cells were excited at 390/40 nm and emissions were monitored with 446/33 blue filter for luminescence image, scale bar: 100 μm, (F) photodegradation of rhodamine-B in presence of nanocomposites cZn1-cZn4.
We tested the fluorescence imaging of cZn1-cZn4 nanocomposites in HEK293 cells. The cells were treated with cZn1-cZn4 (50 μg/ml) for 2 h (at a cell viability of almost 85%) and fixed on a glass slide with paraformaldehyde reagent. The HEK293 cell nuclei and cytoplasm showed bright emission (Figures 4C–E; Supplementary Figures S29, S30, blue color for visualization) for cZn2-cZn4. cZn1 did not show any prominent luminescent image due to poor quantum yield. The MTT assays were performed with cZn1-cZn4 on the test cell line after incubation for up to 24 h and found to be nontoxic up to 2 h at a concentration of 50 μg/ml (p < 0.5, Supplementary Figure S31).
These excitation spectra in the visible region for the nanocomposites triggered the photodegradation of rhodamine-B in presence of visible light (Figure 4F; Supplementary Figure S32) unlike the recent report with 254 nm light for Au-ZnO nanocomposites. We carried out the photodegradation of rhodamine-B in presence of 455 nm LED. This wavelength was close to the excitation spectrum (Supplementary Figure S27B) from 5–6 nm AuNP in the AuNP-cZnO nanocomposites. This emission at 496 nm was stable even after 455 nm LED light illumination for 1 h. cZn4 showed the best degradation performance with the rate constant 0.25 h−1 (Table 2). The nonradiative decay rate constants (Supplementary Figure S28) were in a similar range for all the four samples. However, the radiative decay rate constant for cZn4 was maximum and at least two times compared to the nearest radiative decay rate constant for cZn3. The photodegradation studies with visible 455 nm light were dependent on the emission properties originating from 5–6 nm AuNP. The control experiments with aZn5-aZn8 nanocomposites without 5–6 nm AuNP showed no photodegradation of the dye in the presence of 455 nm light. The dye degradation rate constants (Table 2) in the presence of 254 nm light were much less in comparison to 455 nm LED probably due to the inherent excitation maxima at 436 nm in these nanocomposites. ZnO-based rate constants (Supplementary Figure S32; Table 2) for rhodamine dye degradation are 0.02 h−1 and 0.04 h−1 by irradiation at 455 and 254 nm light, respectively. These rate constants were less in comparison to the rate constants with Au-ZnO nanocomposites.
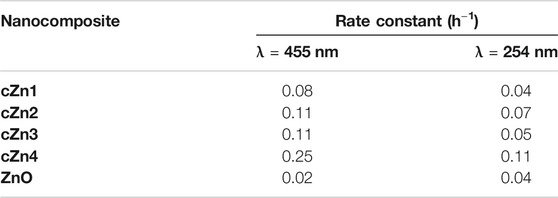
TABLE 2. Rate constants for photodegradation of rhodamine-B.
Conclusion
In conclusion, we demonstrated facile room temperature synthesis of crystalline Au-ZnO nanocomposites by metal mediated redox reaction using water as a solvent. The synthetic modification successfully helped in the development of luminescent properties via the occlusion of AuNP on the crystalline Au-ZnO/Zn(OH)2 nanocomposite surface. These luminescent nanocomposites were successfully applied in the visible light–induced photodegradation of rhodamine-B dye. Currently, we are working on the occlusion of other luminescent materials on the nanocomposite surface.
Data Availability Statement
The original contributions presented in the study are included in the article/Supplementary Material; further inquiries can be directed to the corresponding author.
Author Contributions
KB synthesized cZn1–cZn4 in bulk scale, characterized the materials, and performed dye degradation experiments. SL synthesized aZn1–aZn8 and characterized the materials. AS synthesized cZn1 and differentiated it from aZn1. SN and PR undertook cell culture studies and analysis of the imaging data. KS conceived the idea, participated in data analysis, and wrote the manuscript.
Funding
KKS was funded by CSIR Grant No. 01(2989)/19/EMR-II.
Conflict of Interest
The authors declare that the research was conducted in the absence of any commercial or financial relationships that could be construed as a potential conflict of interest.
Supplementary Material
The Supplementary Material for this article can be found online at: https://www.frontiersin.org/articles/10.3389/fchem.2021.639090/full#supplementary-material.
References
Brouwer, A. M. (2011). Standards for photoluminescence quantum yield measurements in solution (IUPAC Technical Report). Pure Appl. Chem. 83, 2213–2228. doi:10.1351/pac-rep-10-09-31
Caglar, Y., Ilican, S., Caglar, M., Yakuphanoglu, F., Wu, J., Gao, K., et al. (2009). Influence of heat treatment on the nanocrystalline structure of ZnO film deposited on p-Si. J. Alloys Compd. 481, 885–889. doi:10.1016/j.jallcom.2009.03.140
Chamorro, W., Ghanbaja, J., Battie, Y., Naciri, A. E., Soldera, F., Mücklich, F., et al. (2016). Local structure-driven localized surface plasmon absorption and enhanced photoluminescence in ZnO-Au thin films. J. Phys. Chem. C 120, 29405–29413. doi:10.1021/acs.jpcc.6b09974
Chang, Y. M., Lin, M. L., Lai, T. Y., Chen, C. H., Lee, H. Y., Lin, C. M., et al. (2017). Broadband omnidirectional light trapping in gold-decorated ZnO nanopillar arrays. ACS Appl. Mater. Interfaces 9, 11985–11992. doi:10.1021/acsami.6b16412
Chattoraj, S., and Bhattacharyya, K. (2014). Fluorescent gold nanocluster inside a live breast cell: etching and higher uptake in cancer cell. J. Phys. Chem. C 118, 22339–22346. doi:10.1021/jp506745p
Chen, D., Zhang, X., and Lee, A. F. (2015). Synthetic strategies to nanostructured photocatalysts for CO2 reduction to solar fuels and chemicals. J. Mater. Chem. A 3, 14487–14516. doi:10.1039/c5ta01592h
Chen, J., Chen, Q., Liang, C., Yang, Z., Zhang, L., Yi, X., et al. (2017). Albumin-templated biomineralizing growth of composite nanoparticles as smart nano-theranostics for enhanced radiotherapy of tumors. Nanoscale 9, 14826–14835. doi:10.1039/c7nr05316a
Chen, L. Y., Wang, C. W., Yuan, Z., and Chang, H. T. (2015). Fluorescent gold nanoclusters: recent advances in sensing and imaging. Anal. Chem. 87, 216–229. doi:10.1021/ac503636j
Cyganowski, P., Lesniewicz, A., Dzimitrowicz, A., Wolska, J., Pohl, P., and Jermakowicz-Bartkowiak, D. (2019). Molecular reactors for synthesis of polymeric nanocomposites with noble metal nanoparticles for catalytic decomposition of 4-nitrophenol. J. Colloid Interface Sci. 541, 226–233. doi:10.1016/j.jcis.2019.01.097
Degen, A., and Kosec, M. (2000). Effect of pH and impurities on the surface charge of zinc oxide in aqueous solution. J. Eur. Ceram. Soc. 20, 667–673. doi:10.1016/s0955-2219(99)00203-4
Di Mauro, A., Cantarella, M., Nicotra, G., Pellegrino, G., Gulino, A., Brundo, M. V., et al. (2017). Novel synthesis of ZnO/PMMA nanocomposites for photocatalytic applications. Sci. Rep. 7, 40895. doi:10.1038/srep40895
Dutta Chowdhury, A., Agnihotri, N., Doong, R. A., and De, A. (2017). Label-free and nondestructive separation technique for isolation of targeted DNA from DNA-protein mixture using magnetic Au-Fe3O4 nanoprobes. Anal. Chem. 89, 12244–12251. doi:10.1021/acs.analchem.7b03095
Fuggle, J. C., Källne, E., Watson, L. M., and Fabian, D. J. (1977). Electronic structure of aluminum and aluminum-noble-metal alloys studied by soft-x-ray and x-ray photoelectron spectroscopies. Phys. Rev. B 16, 750–761. doi:10.1103/physrevb.16.750
Gan, Z., Lin, Y., Luo, L., Han, G., Liu, W., Liu, Z., et al. (2016). Fluorescent gold nanoclusters with interlocked staples and a fully thiolate-bound kernel. Angew. Chem. Int. Ed. 55, 11567–11571. doi:10.1002/anie.201606661
Gao, Z., Li, Y., Zhang, C., Zhang, S., Jia, Y., Li, F., et al. (2019). AuCuXO-embedded mesoporous CeO2 nanocomposites as a signal probe for electrochemical sensitive detection of amyloid-beta protein. ACS Appl. Mater. Interfaces 11, 12335–12341. doi:10.1021/acsami.9b01445
Geng, Z., Kong, X., Chen, W., Su, H., Liu, Y., Cai, F., et al. (2018). Oxygen vacancies in ZnO nanosheets enhance CO2 electrochemical reduction to CO. Angew. Chem. Int. Ed. 57, 6054–6059. doi:10.1002/anie.201711255
Gogurla, N., Bayan, S., Chakrabarty, P., and Ray, S. K. (2018). Plasmon mediated enhancement of visible light emission of Au-ZnO nanocomposites. J. Lumin. 194, 15–21. doi:10.1016/j.jlumin.2017.09.044
Gogurla, N., Chowdhury, R. K., Battacharya, S., Datta, P. K., and Ray, S. K. (2020). Plasmon charge transfer dynamics in layered Au–ZnO nanocomposites. J. Appl. Phys. 127, 053105. doi:10.1063/1.5134892
Gogurla, N., Sinha, A. K., Santra, S., Manna, S., and Ray, S. K. (2014). Multifunctional Au-ZnO plasmonic nanostructures for enhanced UV photodetector and room temperature NO sensing devices. Sci. Rep. 4, 6483. doi:10.1038/srep06483
Goswami, N., Lin, F., Liu, Y., Leong, D. T., and Xie, J. (2016). Highly luminescent thiolated gold nanoclusters impregnated in nanogel. Chem. Mater. 28, 4009–4016. doi:10.1021/acs.chemmater.6b01431
Guo, J., Zhang, Y., Shi, L., Zhu, Y., Mideksa, M. F., Hou, K., et al. (2017). Boosting hot electrons in hetero-superstructures for plasmon-enhanced catalysis. J. Am. Chem. Soc. 139, 17964–17972. doi:10.1021/jacs.7b08903
Hang, D. R., Islam, S. E., Chen, C. H., and Sharma, K. H. (2016). Full solution-processed synthesis and mechanisms of a recyclable and bifunctional Au/ZnO plasmonic platform for enhanced UV/vis photocatalysis and optical properties. Chemistry 22, 14950–14961. doi:10.1002/chem.201602578
He, H., Cai, W., Lin, Y., and Chen, B. (2010). Surface decoration of ZnO nanorod arrays by electrophoresis in the Au colloidal solution prepared by laser ablation in water. Langmuir 26 (11), 8925–8932. doi:10.1021/la904723a
He, J., Xu, F., Chen, Z., Hou, X., Liu, Q., and Long, Z. (2017). AuNPs/COFs as a new type of SERS substrate for sensitive recognition of polyaromatic hydrocarbons. Chem. Commun. 53, 11044–11047. doi:10.1039/c7cc06440c
Hu, Y., Liu, Y., Xie, X., Bao, W., and Hao, J. (2018). Surfactant-regulated fabrication of gold nanostars in magnetic core/shell hybrid nanoparticles for controlled release of drug. J. Colloid Interface Sci. 529, 547–555. doi:10.1016/j.jcis.2018.06.027
Jang, E., Lim, E.-K., Choi, J., Park, J., Huh, Y.-J., Suh, J.-S., et al. (2012). Br-assisted Ostwald ripening of Au nanoparticles under H2O2 redox. Cryst. Growth Des. 12, 37–39. doi:10.1021/cg201243n
Jangir, L. K., Kumari, Y., Kumar, A., Kumar, M., and Awasthi, K. (2017). Investigation of luminescence and structural properties of ZnO nanoparticles, synthesized with different precursors. Mater. Chem. Front. 1, 1413–1421. doi:10.1039/C7QM00058H
Jia, H., Du, A., Zhang, H., Yang, J., Jiang, R., Wang, J., et al. (2019). Site-selective growth of crystalline ceria with oxygen vacancies on gold nanocrystals for near-infrared nitrogen photofixation. J. Am. Chem. Soc. 141, 5083–5086. doi:10.1021/jacs.8b13062
Karakawa, M., Sugahara, T., Hirose, Y., Suganuma, K., and Aso, Y. (2018). Thin film of amorphous zinc hydroxide semiconductor for optical devices with an energy-efficient beneficial coating by metal organic decomposition process. Sci. Rep. 8, 10839. doi:10.1038/s41598-018-27953-6
Kauffman, D. R., Deng, X., Sorescu, D. C., Nguyen-Phan, T.-D., Wang, C., Marin, C. M., et al. (2019). Edge-enhanced oxygen evolution reactivity at ultrathin, Au-supported Fe2O3 electrocatalysts. ACS Catal. 9, 5375–5382. doi:10.1021/acscatal.9b01093
Khokhra, R., Bharti, B., Lee, H. N., and Kumar, R. (2017). Visible and UV photo-detection in ZnO nanostructured thin films via simple tuning of solution method. Sci. Rep. 7, 15032. doi:10.1038/s41598-017-15125-x
Klug, M. T., Dorval Courchesne, N.-M., Lee, Y. E., Yun, D. S., Qi, J., Heldman, N. C., et al. (2017). Mediated growth of zinc chalcogen shells on gold nanoparticles by free-base amino acids. Chem. Mater. 29, 6993–7001. doi:10.1021/acs.chemmater.7b02571
Kuiri, P. K., and Pramanik, S. (2018). Large enhancement of UV luminescence emission of ZnO nanoparticles by coupling excitons with Ag surface plasmons. J. Appl. Phys. 123, 54302. doi:10.1063/1.5021387
Lakowicz, J. R. (2006). Principles of fluorescence spectroscopy. 3rd Edn. Berlin, Germany: Springer Science + Business Media, LLC..
Lee, D. K., Song, Y., Tran, V. T., Kim, J., Park, E. Y., and Lee, J. (2017). Preparation of concave magnetoplasmonic core-shell supraparticles of gold-coated iron oxide via ion-reducible layer-by-layer method for surface enhanced Raman scattering. J. Colloid Interface Sci. 499, 54–61. doi:10.1016/j.jcis.2017.03.098
Lewis, D. J., Day, T. M., Macpherson, J. V., and Pikramenou, Z. (2006). Luminescent nanobeads: attachment of surface reactive Eu(III) complexes to gold nanoparticles. Chem. Commun., 1433–1435. doi:10.1039/b518091k
Li, C., Bolisetty, S., and Mezzenga, R. (2013). Hybrid nanocomposites of gold single-crystal platelets and amyloid fibrils with tunable fluorescence, conductivity, and sensing properties. Adv. Mater. 25, 3694–3700. doi:10.1002/adma.201300904
Li, P., Wei, Z., Wu, T., Peng, Q., and Li, Y. (2011). Au-ZnO hybrid nanopyramids and their photocatalytic properties. J. Am. Chem. Soc. 133, 5660–5663. doi:10.1021/ja111102u
Liu, F., Goyal, S., Forrester, M., Ma, T., Miller, K., Mansoorieh, Y., et al. (2019). Self-assembly of Janus dumbbell nanocrystals and their enhanced surface plasmon resonance. Nano Lett. 19, 1587–1594. doi:10.1021/acs.nanolett.8b04464
Liu, J., Li, J., Wei, F., Zhao, X., Su, Y., and Han, X. (2019). Ag-ZnO submicrometer rod arrays for high-efficiency photocatalytic degradation of congo red and disinfection. ACS Sustainable Chem. Eng. 7, 11258–11266. doi:10.1021/acssuschemeng.9b00610
Liu, J., Yu, M., Zhou, C., Yang, S., Ning, X., and Zheng, J. (2013). Passive tumor targeting of renal-clearable luminescent gold nanoparticles: long tumor retention and fast normal tissue clearance. J. Am. Chem. Soc. 135, 4978–4981. doi:10.1021/ja401612x
Liu, Y., Lv, X., Liu, H., Zhou, Z., Huang, J., Lei, S., et al. (2018). Porous gold nanocluster-decorated manganese monoxide nanocomposites for microenvironment-activatable MR/photoacoustic/CT tumor imaging. Nanoscale 10, 3631–3638. doi:10.1039/c7nr08535d
Lupan, O., Postica, V., Wolff, N., Su, J., Labat, F., Ciofini, I., et al. (2019). Low-temperature solution synthesis of Au-modified ZnO nanowires for highly efficient hydrogen nanosensors. ACS Appl. Mater. Interfaces 11, 32115–32126. doi:10.1021/acsami.9b08598
Mageed, A. M., Klyushin, A., Rezvani, A., Gericke, A. K., Schlogl, R., and Behm, R. J. (2019). Negative charging of Au nanoparticles during methanol synthesis from CO2/H2 on a Au/ZnO catalyst: insights from operando IR and near‐ambient‐pressure XPS and XAS measurements. Angew. Chem. Int. Ed. 58, 10325–10329. doi:10.1002/anie.201900150
Ning, Y., Fielding, L. A., Nutter, J., Kulak, A. N., Meldrum, F. C., and Armes, S. P. (2019). Spatially controlled occlusion of polymer-stabilized gold nanoparticles within ZnO. Angew. Chem. Int. Ed. 58, 4302–4307. doi:10.1002/anie.201814492
Pattadar, D. K., and Zamborini, F. P. (2019). Effect of size, coverage, and dispersity on the potential-controlled Ostwald ripening of metal nanoparticles. Langmuir 35, 16416–16426. doi:10.1021/acs.langmuir.9b02421
Pourrahimi, A. M., Liu, D., Pallon, L. K. H., Andersson, R. L., Martínez Abad, A., Lagarón, J.-M., et al. (2014). Water-based synthesis and cleaning methods for high purity ZnO nanoparticles—comparing acetate, chloride, sulphate and nitrate zinc salt precursors. RSC Adv. 4, 35568–35577. doi:10.1039/c4ra06651k
Pradhan, D., and Leung, K. T. (2008). Vertical growth of two-dimensional zinc oxide nanostructures on ITO-coated glass: effects of deposition temperature and deposition time. J. Phys. Chem. C 112, 1357–1364. doi:10.1021/jp076890n
Qi, C., Musetti, S., Fu, L. H., Zhu, Y. J., and Huang, L. (2019). Biomolecule-assisted green synthesis of nanostructured calcium phosphates and their biomedical applications. Chem. Soc. Rev. 48, 2698–2737. doi:10.1039/c8cs00489g
Raji, R., and Gopchandran, K. G. (2017). ZnO nanostructures with tunable visible luminescence: effects of kinetics of chemical reduction and annealing. J. Sci. Adv. Mater. Devices 2, 51–58. doi:10.1016/j.jsamd.2017.02.002
Ray, C., and Pal, T. (2017). Retracted Article: recent advances of metal-metal oxide nanocomposites and their tailored nanostructures in numerous catalytic applications. J. Mater. Chem. A 5, 9465–9487. doi:10.1039/c7ta02116j
Ritchie, C., Chesman, A. S. R., Jasieniak, J., and Mulvaney, P. (2019). Aqueous synthesis of Cu2ZnSnSe4 nanocrystals. Chem. Mater. 31, 2138–2150. doi:10.1021/acs.chemmater.9b00100
Saini, M., Masirkar, Y., Varshney, R., Roy, P., and Sadhu, K. K. (2017). Fluorogen-free aggregation induced NIR emission from gold nanoparticles. Chem. Commun. 53, 6199–6202. doi:10.1039/c7cc00641a
Shingange, K., Tshabalala, Z. P., Ntwaeaborwa, O. M., Motaung, D. E., and Mhlongo, G. H. (2016). Highly selective NH3 gas sensor based on Au loaded ZnO nanostructures prepared using microwave-assisted method. J. Colloid Interface Sci. 479, 127–138. doi:10.1016/j.jcis.2016.06.046
Song, J., Wu, B., Zhou, Z., Zhu, G., Liu, Y., Yang, Z., et al. (2017). Double-layered plasmonic-magnetic vesicles by self-assembly of Janus amphiphilic gold-iron(II,III) oxide nanoparticles. Angew. Chem. Int. Ed. 56, 8110–8114. doi:10.1002/anie.201702572
Strohmeier, B. R, and Hercules, D. M. (1984). Surface spectroscopic characterization of the interaction between zinc ions and γ-alumina. J. Catal. 86, 266–279. doi:10.1016/0021-9517(84)90372-5
Tahir, M. N., Natalio, F., Cambaz, M. A., Panthöfer, M., Branscheid, R., Kolb, U., et al. (2013). Controlled synthesis of linear and branched Au@ZnO hybrid nanocrystals and their photocatalytic properties. Nanoscale 5, 9944–9949. doi:10.1039/c3nr02817h
Tan, B. J., Klabunde, K. J., and Sherwood, P. M. A. (1990). X-ray photoelectron spectroscopy studies of solvated metal atom dispersed catalysts, monometallic iron and bimetallic iron-cobalt particles on alumina. Chem. Mater. 2, 186–191. doi:10.1021/cm00008a021
Tang, X., Choo, E. S. G., Li, L., Ding, J., and Xue, J. (2010). Synthesis of ZnO nanoparticles with tunable emission colors and their cell labeling applications. Chem. Mater. 22, 3383–3388. doi:10.1021/cm903869r
Unlu, I., Soares, J. W., Steeves, D. M., and Whitten, J. E. (2015). Photocatalytic activity and fluorescence of gold/zinc oxide nanoparticles formed by dithiol linking. Langmuir 31, 8718–8725. doi:10.1021/acs.langmuir.5b01632
Viter, R., Balevicius, Z., Abou Chaaya, A., Baleviciute, I., Tumenas, S., Mikoliunaite, L., et al. (2015). The influence of localized plasmons on the optical properties of Au/ZnO nanostructures. J. Mater. Chem. C 3, 6815–6821. doi:10.1039/c5tc00964b
Wang, J., Ma, S., Ren, J., Yang, J., Qu, Y., Ding, D., et al. (2018). Fluorescence enhancement of cysteine-rich protein-templated gold nanoclusters using silver(I) ions and its sensing application for mercury(II). Sens. Actuators B 267, 342–350. doi:10.1016/j.snb.2018.04.034
Wang, X., Shi, W., Jin, Z., Huang, W., Lin, J., Ma, G., et al. (2017b). Remarkable SERS activity observed from amorphous ZnO nanocages. Angew. Chem. Int. Ed. 56, 9851–9855. doi:10.1002/anie.201705187
Wang, Y., Guo, H., Zhang, Y., Tai, F., Wang, Y., Dong, Q., et al. (2018b). Achieving highly water-soluble and luminescent gold nanoclusters modified by β-cyclodextrin as multifunctional nanoprobe for biological applications. Dyes Pigm. 157, 359–368. doi:10.1016/j.dyepig.2018.05.015
Wang, Y., Wang, S. S., Lu, Y., Jiang, J., Yang, S. A., Cui, Y., et al. (2017). Strain-induced isostructural and magnetic phase transitions in monolayer MoN2. Nano Lett. 16, 4576–4582. doi:10.1021/acs.nanolett.6b01841
Wei, R.-B., Kuang, P.-Y., Cheng, H., Chen, Y.-B., Long, J.-Y., Zhang, M.-Y., et al. (2017). Plasmon-enhanced photoelectrochemical water splitting on gold nanoparticle decorated ZnO/CdS nanotube arrays. ACS Sustainable Chem. Eng. 5, 4249–4257. doi:10.1021/acssuschemeng.7b00242
Wu, Z., Du, Y., Liu, J., Yao, Q., Chen, T., Cao, Y., et al. (2019). Aurophilic interactions in the self-assembly of gold nanoclusters into nanoribbons with enhanced luminescence. Angew. Chem. Int. Ed. 58, 8139–8144. doi:10.1002/anie.201903584
Wuithschick, M., Birnbaum, A., Witte, S., Sztucki, M., Vainio, U., Pinna, N., et al. (2015). Turkevich in new robes: key questions answered for the most common gold nanoparticle synthesis. ACS Nano 9, 7052–7071. doi:10.1021/acsnano.5b01579
Yao, K. X., Liu, X., Zhao, L., Zeng, H. C., and Han, Y. (2011). Site-specific growth of Au particles on ZnO nanopyramids under ultraviolet illumination. Nanoscale 3, 4195–4200. doi:10.1039/c1nr10685f
Yao, Y., Xue, M., Zhang, Z., Zhang, M., Wang, Y., and Huang, F. (2013). Gold nanoparticles stabilized by an amphiphilic pillar[5]arene: preparation, self-assembly into composite microtubes in water and application in green catalysis. Chem. Sci. 4, 3667–3672. doi:10.1039/c3sc51547h
Yu, H., Chen, M., Rice, P. M., Wang, S. X., White, R. L., and Sun, S. (2005). Dumbbell-like bifunctional Au−Fe3O4 nanoparticles. Nano Lett. 5, 379–382. doi:10.1021/nl047955q
Yu, M., Xu, J., and Zheng, J. (2019). Renal clearable luminescent gold nanoparticles: from the bench to the clinic. Angew. Chem. Int. Ed. 58, 4112–4128. doi:10.1002/anie.201807847
Yu, M., Zhou, C., Liu, J., Hankins, J. D., and Zheng, J. (2011). Luminescent gold nanoparticles with pH-dependent membrane adsorption. J. Am. Chem. Soc. 133, 11014–11017. doi:10.1021/ja201930p
Zhang, L., Rajagopalan, R., Guo, H., Hu, X., Dou, S., and Liu, H. (2016). A green and facile way to prepare granadilla-like silicon-based anode materials for Li-ion batteries. Adv. Funct. Mater. 26, 440–446. doi:10.1002/adfm.201503777
Zhang, M., Wu, F., Wang, W., Shen, J., Zhou, N., and Wu, C. (2019). Multifunctional nanocomposites for targeted, photothermal, and chemotherapy. Chem. Mater. 31, 1847–1859. doi:10.1021/acs.chemmater.8b00934
Zhang, Q., Liu, J., Dong, Y., Li, W., Xing, R., Ma, Y., et al. (2019). Gold nanoparticle-decorated Ag@SiO2 nanocomposite-based plasmonic affinity sandwich assay of circulating microRNAs in human serum. ACS Appl. Nano Mater. 2, 3960–3970. doi:10.1021/acsanm.9b00855
Zhou, X., Zhao, G., Chen, M., Gao, W., Zhou, X., Xie, X., et al. (2018). Facile and green approach to prepare nanostructured Au@MnO2 and its applications for catalysis and fluorescence sensing of glutathione in human blood. ACS Sustainable Chem. Eng. 6, 3948–3956. doi:10.1021/acssuschemeng.7b04313
Keywords: nanocomposites, green synthesis, luminescence, photodegradation, redox chemistry
Citation: Bharti K, Lone SA, Singh A, Nathani S, Roy P and Sadhu KK (2021) Green Synthesis of Luminescent Gold-Zinc Oxide Nanocomposites: Cell Imaging and Visible Light–Induced Dye Degradation. Front. Chem. 9:639090. doi: 10.3389/fchem.2021.639090
Received: 08 December 2020; Accepted: 08 February 2021;
Published: 14 April 2021.
Edited by:
Jyotirmayee Mohanty, Bhabha Atomic Research Centre (BARC), IndiaReviewed by:
Padmaja Prasad Mishra, Saha Institute of Nuclear Physics (SINP), IndiaBeena G Singh, Bhabha Atomic Research Centre (BARC), India
Copyright © 2021 Bharti, Lone, Singh, Nathani, Roy and Sadhu. This is an open-access article distributed under the terms of the Creative Commons Attribution License (CC BY). The use, distribution or reproduction in other forums is permitted, provided the original author(s) and the copyright owner(s) are credited and that the original publication in this journal is cited, in accordance with accepted academic practice. No use, distribution or reproduction is permitted which does not comply with these terms.
*Correspondence: Kalyan K. Sadhu, sadhu@cy.iitr.ac.in