An ultra-sensitive biosensor based on surface plasmon resonance and weak value amplification
 Lizhong Zhang
 Mingyi He2†
  Yang Xu
 Cuixia Guo
 Tian Guan
- 1Institute of Optical Imaging and Sensing, Shenzhen Key Laboratory for Minimal Invasive Medical Technologies, Shenzhen International Graduate School, Tsinghua University, Shenzhen, China
- 2School of International Education, Beijing University of Chemical Technology, Beijing, China
- 3School of Mechanical Engineering and Automation, Fuzhou University, Fuzhou, Fujian Province, China
- 4Department of Physics, Tsinghua University, Beijing, China
An ultra-sensitive phase plasmonic sensor combined with weak value amplification is proposed for the detection of IgG, as a model analyte. Phase detection is accomplished by self-interference between the p-polarization and the s-polarization of the light. With the principles of weak value amplification, a phase compensator is used to modulate the coupling strength and enhance the refractive index sensitivity of the system. On a simple Au-coated prism-coupled surface plasmon resonance (SPR) structure, the scheme, called WMSPR, achieves a refractive index sensitivity of 4.737 × 10⁴ nm/RIU, which is about three times higher than that of the conventional phase-based approach. The proposed WMSPR biosensor gives great characteristics with a high resolution of 6.333 × 10⁻⁸ RIU and a low limit of detection (LOD) of 5.3 ng/mL. The results yield a great scope to promote the optimization of other SPR biosensors for high sensitivity.
1 Introduction
Surface plasmon resonance (SPR) is widely used as a refractive index sensor in biomedical detection with the advantages of label-free and real-time sensing capabilities (Nelson et al., 2001; Wu et al., 2004; Beseničar et al., 2006; Dudak and Boyacı, 2009). Due to the enhanced interaction between the incident light and the surface plasmon, SPR sensors can obtain higher sensitivity and detection capability than other optical sensors. As the sensor’s sensitivity is one of the main parameters for sensor design, many works have proposed different structures of SPR sensors to improve the system’s sensitivity (Xu et al., 2019). In 2001, Neenniger et al. proposed a long-range SPR sensor with an additional layer of Teflon dielectric film between the Au film and the prism (Nenninger et al., 2001). This system has achieved a refractive index sensitivity of 5.7 × 10⁴ nm/RIU. In 2021, Satyendra et al. achieved a refractive index sensitivity of 1.03 × 10⁴ nm/RIU by coating the fiber surface with indium tin oxide and a polymer layer (Mishra and Mishra, 2021). Recently, many works have used nanomaterials to enhance the sensitivity by increasing the surface-to-volume ratio, such as graphene, transition metal dichalcogenides, and hexagonal boron nitride (Szunerits et al., 2013; Lin et al., 2016; Zhou et al., 2020; Divya et al., 2022). The sensitivities of these sensors are highly dependent on the material and structure of the sensors, and it is difficult to further optimize the existing sensor structure. On the other hand, these sophisticated nanomaterials are not convenient for the fabrication and application of the sensor. Therefore, it is necessary to propose a simple and universal method to enhance the sensitivity of SPR sensors. So far, several types of SPR techniques have been developed, like intensity (Prabowo et al., 2018), angular (Jang et al., 2015), wavelength (Homola et al., 2002), and phase (Shao et al., 2013) interrogation. For intensity, angular, and wavelength interrogation SPR sensors, the energy of the incident light is strongly coupled to the surface plasmon. In this case, the reflection minimum represents the resonance angle or resonance wavelength, which is called SPR dip. SPR dip position is related to the refractive index of the dielectric medium, which forms the basic principle of refractive index sensors. Meanwhile, the phase of p-polarized light also changes with the interaction of the incident light with the surface plasmon, while the s-polarized light remains unchanged. Therefore, a phase difference is generated between p, s polarized light, which introduces the principle of the phase interrogation SPR sensor. In the phase interrogation SPR sensor, the energy coupling between the incident light and the surface plasmon is weak, which can be applied to weak measurement systems.
Weak measurement (WM) and weak value amplification (WVA) have a wide range of applications for high-precision measurements (Alves et al., 2015; Zhang et al., 2015; Magaña-Loaiza et al., 2016). By introducing post-selection, the weak value amplification technique can improve the sensitivity of the weakly coupled system by more than two orders of magnitude. In 2008, Hosten et al. used weak value amplification to directly observe lateral shift between polarized light caused by the photon spin Hall effect (Hosten and Kwiat, 2008). With weak value amplification, they have observed a displacement of 1Å using a charge-coupled device (CCD), which is far below the resolution capability of CCD. Since then, the weak value amplification has been applied to various techniques, such as interferometer (Fang et al., 2018), fiber Bragg grating sensor (Salazar-Serrano et al., 2015), and ellipsometer (Zhou et al., 2023). Among them, the refractive index sensitivity of the ellipsometer-based weak measurement system is improved to 1.36 × 10⁴ nm/RIU, and its refractive index resolution is 4 × 10⁻⁷ RIU, which is close to the performance of the conventional SPR sensor (Ma et al., 2019). Luo and Xu et al. have combined the weak value amplification technique with the SPR sensor for the refractive index sensor (Luo et al., 2017; Xu et al., 2020). This scheme is optimized to obtain a higher optical intensity contrast with a refractive index resolution of 2.9 × 10⁻⁷ RIU. Although weak value amplification techniques have been applied to SPR sensors, systems to enhance the sensitivity of sensors have not been proposed.
In this work, we propose an approach that combines the phase interrogation SPR sensing principle with the weak value amplification technique, which is called a WMSPR system. WMSPR system uses a phase compensator to modulate the coupling strength and a post-selection process to enhance the sensitivity. The sensitivity of the system increases as the coupling strength decreases. For a simple Au-coated prism-coupled SPR, the WMSPR system achieves an ultra-high refractive index sensitivity of 4.737 × 10⁴ nm/RIU. Compared with the conventional phase interrogation SPR system, the sensitivity is amplified by a factor of about 3. In the WMSPR system, we achieve a refractive index resolution of 6.333 × 10⁻⁸ RIU. We used this system to detect IgG and Anti-IgG binding interaction as a demonstration experiment. The principles of the WMSPR system can be applied to various SPR sensors.
2 Materials and methods
2.1 Materials
Phosphate buffered solution (PBS, powder) is purchased from Solarbio Science & Technology Company (Beijing, China). The goat anti-rabbit IgG and rabbit IgG are purchased from Bioss (Beijing, China). Dopamine (Aladdin, Shanghai, China) is dissolved in Tris (Aladdin, Shanghai, China) solution at pH 8.5 to prepare 0.01 g/L of dopamine solution. 2% no protein blocking solution is purchased from Sangon Biotech, Shanghai, China.
2.2 Methods
In Figure 1, we depict the WMSPR system of combining phase interrogation with weak value amplification. Here, we adopt the Kretschmann configuration as an example to illustrate the principles of our scheme. It consists of a ZF6 prism with high refractive index np = 1.75, a thin Au layer with relative permittivity ɛm, and a dielectric layer with low refractive index nd = 1.333. To excite SPPs that propagate along the metal-dielectric interface, the phase-matching condition needs to be fulfilled
where θ is the incident angle. The light source is a broadband superluminescent diode (SLD) which is centered at 830 nm. According to Eq. 1, the SPPs would be excited at the incident angle of θ = 53.4°. By applying the Fresnel theory, we can obtain the reflection coefficient rp(s) for the p and s polarized incident light as follows (Kihm et al., 2012)
in which d is the thickness of the metal layer. In Eq. 2, we label the metal layer, prism, and dielectric medium with 1, 2, and 3.
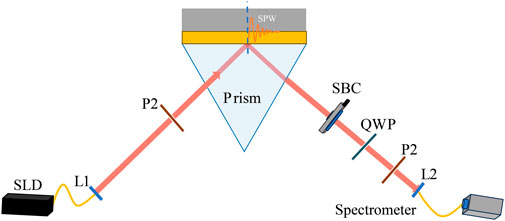
FIGURE 1. Scheme of the WMSPR sensor. Light source: superluminescent diodes (SLD); L1 and L2, achromatic lens; P1 and P2, Polarizer; SBC, Soleil-Babinet compensator.
In our scheme, the light beam is first selected in the linear polarization state
where |p⟩ and |s⟩ represent the TM mode (p-polarization) and TE (s-polarization) polarized light, respectively. The angle between the polarizer’s polarization axis and horizontal direction is α.
As SPPs can be only excited by p-polarized light, p and s-polarized light are endowed with different reflection coefficient
where |rp(s)|, φp(s) (λ, nd) reveal the amplitude and phase of reflection coefficient rp(s), respectively. The value of rp(s) is affected by the refractive index nd of the dielectric layer. Conventional SPR mainly focuses on the amplitude shift, as shown in Figure 2A. When d = 45 nm, the p-polarized incident light is strongly coupled with the surface plasmon and causes an SPR dip in the reflectivity curve, which can be observed for wavelength or angular interrogation SPR sensor. Here, we focus on the variation of φp (λ, nd). As shown in Figure 2B, when d = 25 nm is far from the optimal resonance thickness, the SPR is quite weak, and the reflectance curves are flat. At this time, the phase rather than the amplitude varies significantly with the refractive index of the dielectric medium. Therefore, as shown in Figure 2B, there is a linear relationship between phase and wavelength. We make the approximations: φp (λ, nd) = k1λ + k2 (nd). And |rp| and k1 are constants, k2 (nd) varies with nd. The reflectivity of s-polarization remains unchanged: φs (λ, nd) = φs. Hence, Eq. 4 can be written as
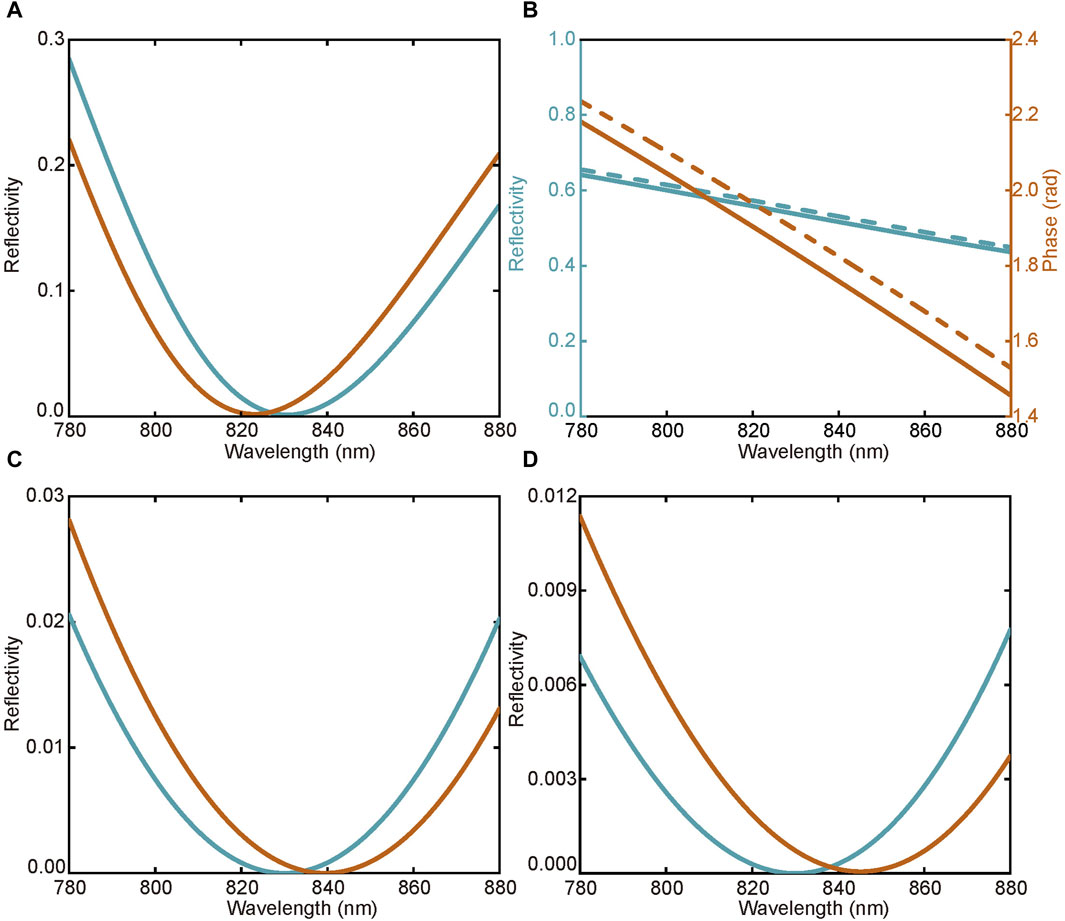
FIGURE 2. Simulational results. (A) Reflectivity curves for wavelength interrogation SPR. The red and blue curves represent the conditions of nd = 1.333 and nd = 1.334, respectively. (B) The reflectivity and phase for Au-coated SPR when d = 25 nm. (C) Reflectivity curves for phase interrogation SPR. (D) Reflectivity curves for WMSPR.
After that, a Soleil-Babinet compensator (SBC) introduces an additional phase difference φ ≃ lλ between the p and s polarizations. After that, the system is involved in
By adding a quarter-wave plate (QWP) after the SBC, we can convert the p-polarized light and s-polarized light into right-handed circularly polarized light
where
In the WVA protocol, a post-selection procedure is required, which is completed by the polarizer P2 in Figure 2. The postselected state can be expressed as
where β is the angle between the polarizer’s polarization axis and horizontal direction.
Therefore, the spectral distribution ∫p(λ)dλ after post-selection can be written as (without normalization)
And the relative reflectivity curve R (λ, nd) can be obtained
In this scheme, the values of α and β are chosen to satisfy: |rp|cosα = −|rs|sinα = A, (k1 − l)λ0 + k2 (nd) − φs + 2β = 0. Hence, we have
Similar to conventional SPR sensors, there is an SPR dip in the reflectivity curve in this system, as shown in Figures 2C,D. When l = 0, the WMSPR scheme is equivalent to the conventional phase interrogation SPR. As shown in Figure 2C, the SPR dip’s position varies with the dielectric medium’s refractive index. However, the sensitivity of the WMSPR scheme can be controlled by modulating the value of l. In Figure 2D, we choose l = 3 × 10⁻³ rad/nm. The shift of SPR dip is now greater than conventional phase interrogation SPR.
According to Eq. 12, the refractive index sensitivity SRI of WMSPR can be calculated as
which is amplified with a coefficient of 1/(k1 − l). We define the coupling strength as τ = k1 − l. Similar to rotatory biased weak measurement (Zhou et al., 2023), the system’s sensitivity is amplified by the factor of 1/τ. Therefore, the sensitivity of the WMSPR scheme can be enhanced by introducing an approximate value of l. Figure 3 depicts the relationship between the sensitivity SRI of the system and l.
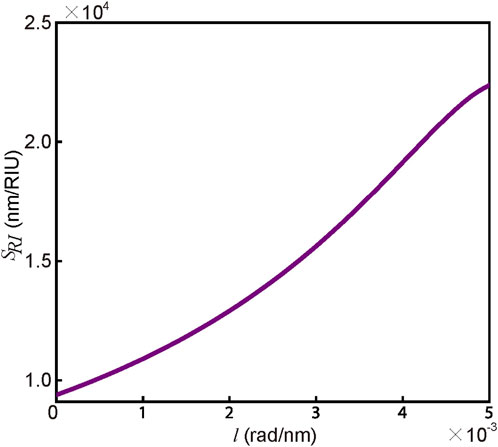
FIGURE 3. The relationship between the system’s sensitivity and before in the WMSPR scheme.
Figure 1 shows the structure of the WMSPR system, which consists of an SLD (IPSDD0805, λ0 = 830 nm, σ0 = 28 nm, 10 mW, Inphenix), an equilateral prism (made of ZF6 glass) and a spectrometer (Ocean Optics HR4000) to detect wavelength spectrum. The sensing surface of the prism is vaporized with a thin film of 5 nm chromium and 35 nm Au using an electron beam. The role of the cadmium film is to make the Au film more firmly attached to the surface of the prism. A 3D-printed resin chip is glued to the Au film using epoxy resin. The normal angle between the detecting light and the Au film is about 52°. To demonstrate the enhancement of sensitivity and resolution of the WMSPR system, this work performs experiments on both phase SPR system and WMSPR system.
3 Results and discussion
3.1 Calibration of the sensor system
Sodium chloride solution is usually considered a solution with a uniform refractive index and is used to measure the refractive index sensitivity and resolution of the optical sensing system. In the phase SPR sensors, deionized water is passed into the flow channel, and the front polarizer is adjusted to π/4, the rear polarizer is ϵ + 3π/4. By fine-tuning the quarter-wave plate and the rear polarizer, the spectrum of the detection point shows a double-peaked state, like the inset of Figure 5B. Subsequently, the syringe pump is used to pass different concentrations of sodium chloride solution. The correspondence between the concentration of sodium chloride solution (C, g/L) and its refractive index (nRI) is nRI = 1.3305 + 1.47 × 10⁻⁴ ×C. We used the fixed boundary (the lower boundary is 780 nm, the upper boundary is 880 nm) spectrum to get the fitting curve of Eq. 11, from which we can get the shift of the SPR dip with the change of the refractive index. And the refractive index sensitivity and resolution can be obtained from SRI = δλ/δn and Res = 3σ/SRI, σ is the standard deviation of the sensor.
In WMSPR, the adjustment of the coupling strength τ needs to be realized by SBC based on the phase SPR’s double-peak spectrum. After the adjustment, the phase SPR’s double-peak spectrum is destroyed. It is necessary to adjust the polarizers P1 and P2 until the spectrum appears double peaks, i.e., after adjusting the coupling strength, the system must reach the weak measurement state again. The exact calculation of sensitivity and resolution was also performed on the WMSPR.
Sodium chloride solutions at 0.5, 1, 1.5, 2, 2.5, and 3 g/L were used for optical properties determination. In Figure 4A, the spectral offsets of the two systems are shown for sodium chloride solution with a gradient of concentration. As shown in Figure 4B, the refractive index sensitivity of phase SPR is 1.680 × 10⁴ nm/RIU, and the refractive index sensitivity of WMSPR is 4.737 × 10⁴ nm/RIU, which is about three times that of phase SPR. The calculated resolution is 6.333 × 10⁻⁸ RIU. The resolution of the sensor after adjusting the coupling strength is much better for the amount of refractive index change on the surface of the Au film. This means that we adjust the coupling strength to further amplify the signal while the amplification of the system noise is much lower than the amplified value of the signal.
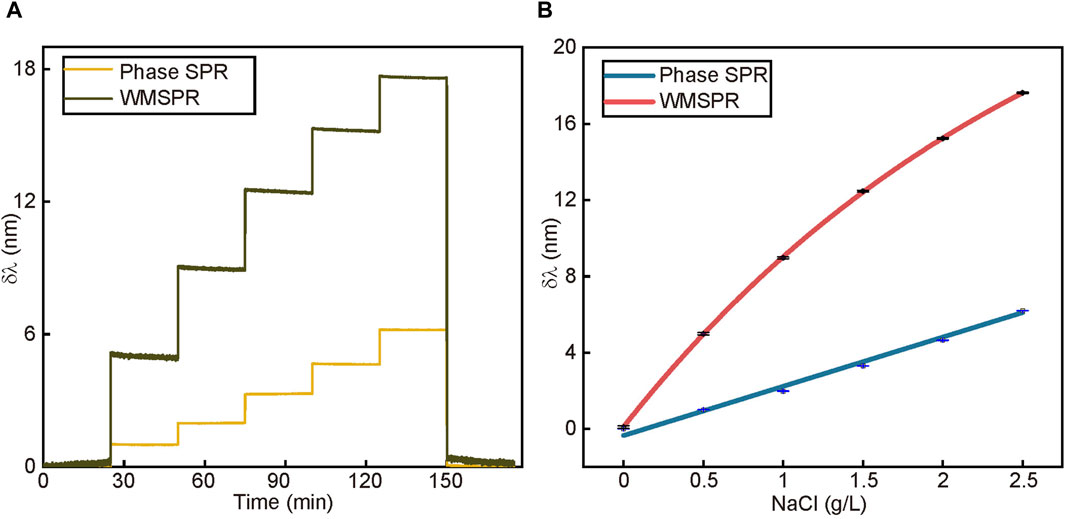
FIGURE 4. (A) The resonance wavelength change process caused by different concentrations of sodium chloride solution which are 0, 0.5, 1, 1.5, 2, 2.5 g/L from left step to right. The green line belongs to WMSPR and the yellow belongs to phase SPR. (B) The linear fitting curves of response to solution. Their slope is proportional to the sensor’s sensitivity. The red line and the blue line belong to WMSPR and phase SPR, respectively.
3.2 Performance comparison of sensors
Interfacial sensor parameters usually are obtained using homogeneous standard solutions, which might is not suitable for measuring the performance in biological applications. This is because the biomolecular behavior cannot be regarded as a homogeneous process in the same way as replacing the sodium chloride solution. For general immunoassay analytes, specific behavior occurs within a few nanometers to tens of nanometers from the sensing surface. We will view the overall refractive index change within the penetration depth as the surface refractive index with respect to the sensing interface, often referred to as the bulk refractive index. Molecular interactions trigger a change in the bulk refractive index, which in turn triggers a change in the phase of the reflected photons. Our immune molecule-specific recognition experiments well validated the enhanced performance of WMSPR on molecular interactions.
In the specific recognition experiment of antigen and antibody, we give a schematic diagram of the chip functionalization and the response signals in each process in Figure 5A. The first stage is the self-assembly of dopamine molecules into a polydopamine layer on the surface of the Au film. A very obvious change in the signal can be seen, followed by the adsorption of 10 μg/mL goat anti-rabbit IgG molecules to the polydopamine layer. In the third stage, the closure of the surface completes the chip functionalization. The last stage shows the specific binding stage. The inset of Figure 5B shows the spectra in both phase SPR and WMSPR sensing systems for the same detection point, which exhibits the spectral change from Point A to Point B, allowing obtaining the spectral offset. We can clearly see the change in the spectrum with time. This demonstrates the real-time, in situ detection capability of the WMSPR sensing system for molecular interactions. Figure 5B, (c) shows the total process of phase SPR and WMSPR for the specific recognition of goat anti-rabbit IgG and rabbit IgG. We recorded the amount of spectral change caused by 1, 2, 4, 8, and 16 μg/mL rabbit IgG captured by goat anti-rabbit IgG within 30 min using PBS as the starting baseline. Each specific binding procedure was followed by PBS for approximately 15 min to clear the channel and provide a new reference baseline. The fluctuation in the curve is due to the vibration caused by the replacement of the solution. In Figure 5D, the sensitivity of WMSPR was distinctly higher than that of phase SPR at low concentrations. The limit of detection of WMSPR and phase SPR can be calculated based on the 3σ principle of 5.301 ng/mL and 17.44 ng/mL, respectively. As such, it is clear that WMSPR has a superior detection limit. Since we limit the molecular interaction time to 30 min, the specific binding does not reach equilibrium, and the resulting calculated detection limit is larger than the actual performance. In practical application, if we wait until equilibrium, WMSPR could perform better than the detection limit given above.
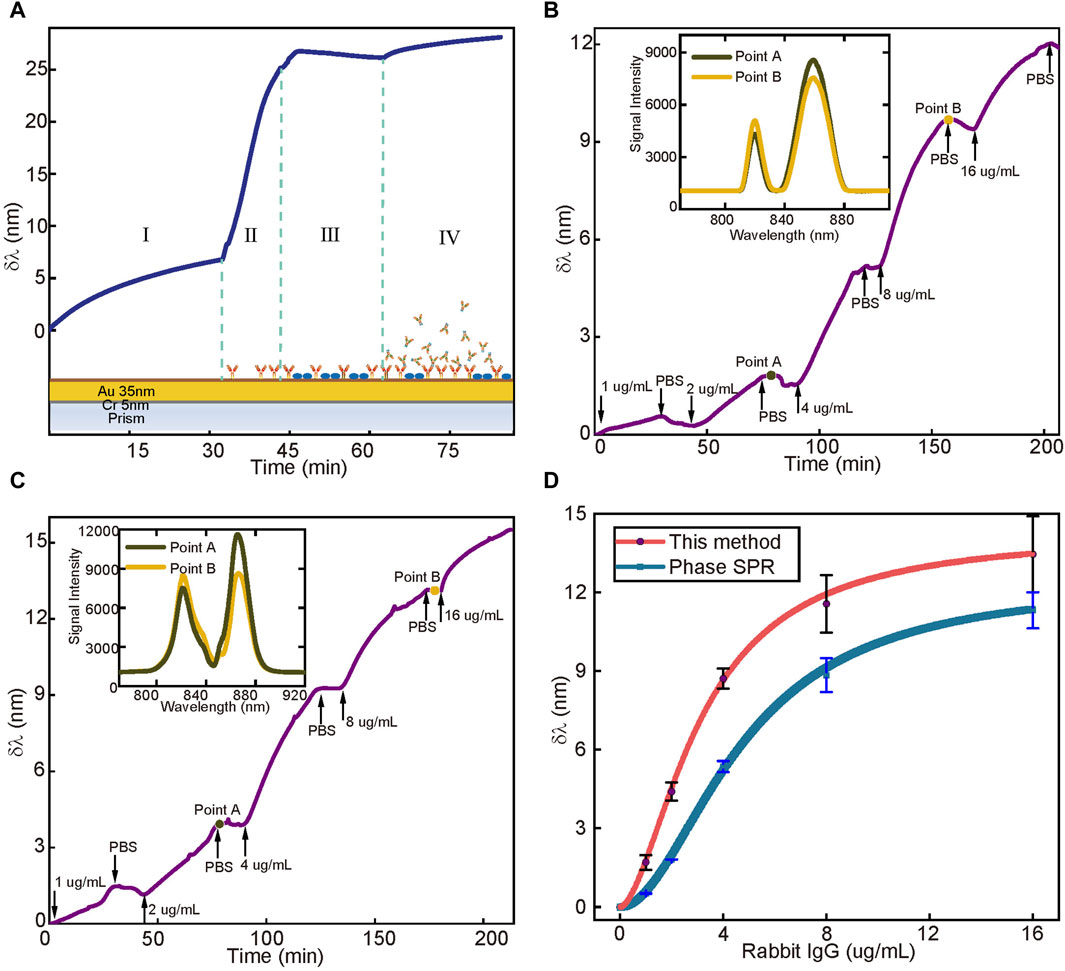
FIGURE 5. (A) The process of the functionalization of the WMSPR’s sensing surface, which happens in phase SPR as well. I is the process of self-polymerization of the Au film to form a polydopamine membrane. II is the process of the non-specific adsorption of goat anti-rabbit IgG on the polydopamine membrane. III is the process of blocking non-specific sites of the polydopamine membrane. IV is the process of specific binding between goat anti-rabbit IgG and rabbit IgG. (B) The real-time process of phase SPR sensor’s response to different concentrations of Rabbit IgG. The inset shows obvious variations of the spectra of point A and point (B, C) The real-time process of the WMSPR sensor’s response to different concentrations of Rabbit IgG. The inset shows more obvious variations than phase SPR’s (D) The total response value of each concentration of rabbit IgG, and the first three concentrations well demonstrate the enhancement sensitivity of WMSPR.
4 Conclusion
In this work, a biosensor based on the weak value amplification technique and surface plasmon resonance is proposed. Based on the principle of the weak value amplification technique, an SBC is introduced to modulate the coupling strength of the system, and the sensitivity of the sensor is proportional to the inverse of the coupling strength. Our proposed scheme achieves a refractive index sensitivity of 4.737 × 10⁴ nm/RIU and a refractive index resolution of 6.333 × 10⁻⁸ RIU, which is three times higher than the conventional phase SPR. The sensor is also validated by IgG detection with a detection limit of 5.3 ng/mL. The results can be applied to the development of various highly sensitive plasmonic sensors.
Author contributions
LZ: Conceptualization, Formal Analysis, Investigation, Methodology, Validation, Visualization, Writing–original draft, Writing–review and editing. MH: Data curation, Formal Analysis, Investigation, Software, Validation, Visualization, Writing–original draft, Writing–review and editing. YX: Data curation, Formal Analysis, Investigation, Methodology, Project administration, Validation, Writing–review and editing. CG: Data curation, Investigation, Methodology, Project administration, Resources, Software, Supervision, Validation, Writing–review and editing. CZ: Conceptualization, Data curation, Formal Analysis, Investigation, Methodology, Project administration, Resources, Validation, Visualization, Writing–original draft, Writing–review and editing. TG: Conceptualization, Formal Analysis, Funding acquisition, Investigation, Methodology, Project administration, Resources, Supervision, Writing–review and editing.
Funding
The author(s) declare financial support was received for the research, authorship, and/or publication of this article. This work was financially supported by the Science, Technology and Innovation Commission of Shenzhen Municipality, China (Funding Number: KCXFZ20201221173207022) and the Development and Reform Commission of Shenzhen Municipality, China (Funding Number: XMHT20230115004).
Acknowledgments
The authors would like to acknowledge support from the Jilin Fuyuan Guan Food Group Co., Ltd.
Conflict of interest
The authors declare that the research was conducted in the absence of any commercial or financial relationships that could be construed as a potential conflict of interest.
Publisher’s note
All claims expressed in this article are solely those of the authors and do not necessarily represent those of their affiliated organizations, or those of the publisher, the editors and the reviewers. Any product that may be evaluated in this article, or claim that may be made by its manufacturer, is not guaranteed or endorsed by the publisher.
Supplementary material
The Supplementary Material for this article can be found online at: https://www.frontiersin.org/articles/10.3389/fchem.2024.1382251/full#supplementary-material
References
Alves, G. B., Escher, B., de Matos Filho, R., Zagury, N., and Davidovich, L. (2015). Weak-value amplification as an optimal metrological protocol. Phys. Rev. A 91, 062107. doi:10.1103/physreva.91.062107
Beseničar, M., Maček, P., Lakey, J. H., and Anderluh, G. (2006). Surface plasmon resonance in protein–membrane interactions. Chem. Phys. lipids 141, 169–178. doi:10.1016/j.chemphyslip.2006.02.010
Divya, J., Selvendran, S., Raja, A. S., and Sivasubramanian, A. (2022). Surface plasmon based plasmonic sensors: a review on their past, present and future. Biosens. Bioelectron. X, 100175. doi:10.1016/j.biosx.2022.100175
Dudak, F. C., and Boyacı, İ. H. (2009). Rapid and label-free bacteria detection by surface plasmon resonance (spr) biosensors. Biotechnol. J. Healthc. Nutr. Technol. 4, 1003–1011. doi:10.1002/biot.200800316
Fang, C., Huang, J.-Z., and Zeng, G. (2018). Robust interferometry against imperfections based on weak value amplification. Phys. Rev. A 97, 063818. doi:10.1103/physreva.97.063818
Homola, J., Dostalek, J., Chen, S., Rasooly, A., Jiang, S., and Yee, S. S. (2002). Spectral surface plasmon resonance biosensor for detection of staphylococcal enterotoxin b in milk. Int. J. food Microbiol. 75, 61–69. doi:10.1016/s0168-1605(02)00010-7
Hosten, O., and Kwiat, P. (2008). Observation of the spin hall effect of light via weak measurements. Science 319, 787–790. doi:10.1126/science.1152697
Jang, D., Chae, G., and Shin, S. (2015). Analysis of surface plasmon resonance curves with a novel sigmoid-asymmetric fitting algorithm. Sensors 15, 25385–25398. doi:10.3390/s151025385
Kihm, K., Cheon, S., Park, J., Kim, H., Lee, J., Kim, I., et al. (2012). Surface plasmon resonance (spr) reflectance imaging: far-field recognition of near-field phenomena. Opt. lasers Eng. 50, 64–73. doi:10.1016/j.optlaseng.2011.07.003
Lin, Z., Jiang, L., Wu, L., Guo, J., Dai, X., Xiang, Y., et al. (2016). Tuning and sensitivity enhancement of surface plasmon resonance biosensor with graphene covered au-mos 2-au films. IEEE Photonics J. 8, 1–8. doi:10.1109/jphot.2016.2631407
Luo, L., Qiu, X., Xie, L., Liu, X., Li, Z., Zhang, Z., et al. (2017). Precision improvement of surface plasmon resonance sensors based on weak-value amplification. Opt. Express 25, 21107–21114. doi:10.1364/oe.25.021107
Ma, K., Liu, L., Zhang, P., He, Y., and Peng, Q. (2019). Optimization of angle-pixel resolution for angular plasmonic biosensors. Sensors Actuators B Chem. 283, 188–197. doi:10.1016/j.snb.2018.12.023
Magaña-Loaiza, O. S., Harris, J., Lundeen, J. S., and Boyd, R. W. (2016). Weak-value measurements can outperform conventional measurements. Phys. Scr. 92, 023001. doi:10.1088/1402-4896/92/2/023001
Mishra, S. K., and Mishra, A. K. (2021). Ito/polymer matrix assisted surface plasmon resonance based fiber optic sensor. Results Opt. 5, 100173. doi:10.1016/j.rio.2021.100173
Nelson, B. P., Grimsrud, T. E., Liles, M. R., Goodman, R. M., and Corn, R. M. (2001). Surface plasmon resonance imaging measurements of dna and rna hybridization adsorption onto dna microarrays. Anal. Chem. 73, 1–7. doi:10.1021/ac0010431
Nenninger, G., Tobiška, P., Homola, J., and Yee, S. (2001). Long-range surface plasmons for high-resolution surface plasmon resonance sensors. Sensors Actuators B Chem. 74, 145–151. doi:10.1016/s0925-4005(00)00724-3
Prabowo, B. A., Purwidyantri, A., and Liu, K.-C. (2018). Surface plasmon resonance optical sensor: a review on light source technology. Biosensors 8, 80. doi:10.3390/bios8030080
Salazar-Serrano, L., Barrera, D., Amaya, W., Sales, S., Pruneri, V., Capmany, J., et al. (2015). Enhancement of the sensitivity of a temperature sensor based on fiber bragg gratings via weak value amplification. Opt. Lett. 40, 3962–3965. doi:10.1364/ol.40.003962
Shao, Y., Li, Y., Gu, D., Zhang, K., Qu, J., He, J., et al. (2013). Wavelength-multiplexing phase-sensitive surface plasmon imaging sensor. Opt. Lett. 38, 1370–1372. doi:10.1364/ol.38.001370
Szunerits, S., Maalouli, N., Wijaya, E., Vilcot, J.-P., and Boukherroub, R. (2013). Recent advances in the development of graphene-based surface plasmon resonance (spr) interfaces. Anal. Bioanal. Chem. 405, 1435–1443. doi:10.1007/s00216-012-6624-0
Wu, S., Ho, H., Law, W. C., Lin, C., and Kong, S. (2004). Highly sensitive differential phase-sensitive surface plasmon resonance biosensor based on the mach–zehnder configuration. Opt. Lett. 29, 2378–2380. doi:10.1364/ol.29.002378
Xu, L., Luo, L., Wu, H., Luo, Z., Zhang, Z., Shi, H., et al. (2020). Measurement of chiral molecular parameters based on a combination of surface plasmon resonance and weak value amplification. ACS sensors 5, 2398–2407. doi:10.1021/acssensors.0c00346
Xu, Y., Bai, P., Zhou, X., Akimov, Y., Png, C. E., Ang, L.-K., et al. (2019). Optical refractive index sensors with plasmonic and photonic structures: promising and inconvenient truth. Adv. Opt. Mater. 7, 1801433. doi:10.1002/adom.201801433
Zhang, L., Datta, A., and Walmsley, I. A. (2015). Precision metrology using weak measurements. Phys. Rev. Lett. 114, 210801. doi:10.1103/physrevlett.114.210801
Zhou, C., Xu, Y., Zhang, X., Li, Z., Guan, T., He, Y., et al. (2023). Ultrasensitive total internal reflection sensor with rotatory biased weak measurement. Sensors Actuators B Chem. 377, 133055. doi:10.1016/j.snb.2022.133055
Keywords: weak value amplification, surface plasmon resonance, refractive index sensor, biosensor, biomolecular interaction
Citation: Zhang L, He M, Xu Y, Guo C, Zhou C and Guan T (2024) An ultra-sensitive biosensor based on surface plasmon resonance and weak value amplification. Front. Chem. 12:1382251. doi: 10.3389/fchem.2024.1382251
Received: 05 February 2024; Accepted: 22 February 2024;
Published: 08 March 2024.
Edited by:
Chao He, University of Oxford, United KingdomCopyright © 2024 Zhang, He, Xu, Guo, Zhou and Guan. This is an open-access article distributed under the terms of the Creative Commons Attribution License (CC BY). The use, distribution or reproduction in other forums is permitted, provided the original author(s) and the copyright owner(s) are credited and that the original publication in this journal is cited, in accordance with accepted academic practice. No use, distribution or reproduction is permitted which does not comply with these terms.
*Correspondence: Chongqi Zhou, zcq18@mails.tsinghua.org.cn; Tian Guan, guantian@sz.tsinghua.edu.cn
†These authors have contributed equally to this work and share first authorship