Toward a molecular pathogenic pathway for Yersinia pestis YopM
- 1Department of Microbiology, Immunology, and Molecular Genetics, University of Kentucky, Lexington, KY, USA
- 2Lineberger Comprehensive Cancer Center, University of North Carolina, Chapel Hill, NC, USA
YopM is one of the six “effector Yops” of the human-pathogenic Yersinia, but its mechanism has not been defined. After delivery to J774A.1 monocyte-like cells, YopM can rapidly bind and activate the serine/threonine kinases RSK1 and PRK2. However, in infected mice, effects of Y. pestis YopM have been seen only after 24–48 h post-infection (p.i.). To identify potential direct effects of YopM in-vivo we tested for effects of YopM at 1 h and 16–18 h p.i. in mice infected systemically with 106 bacteria. At 16 h p.i., there was a robust host response to both parent and ΔyopM-1 Y. pestis KIM5. Compared to cells from non-infected mice, CD11b+ cells from spleens of infected mice produced more than 100-fold greater IFNγ. In the corresponding sera there were more than 100-fold greater amounts of IFNγ, G-CSF, and CXCL9, as well as more than 10-fold greater amounts of IL-6, CXCL10, and CXCL1. The only YopM-related differences were slightly lower CXCL10 and IL-6 in sera from mice infected 16 h with parent compared to ΔyopM-1 Y. pestis. Microarray analysis of the CD11b+ cells did not identify consistent transcriptional differences of ≥4-fold at 18 h p.i. However, at 1 h p.i. mRNA for early growth response transcription factor 1 (Egr1) was decreased when YopM was present. Bone marrow-derived macrophages infected for 1 h also expressed lower Egr1 message when YopM was present. Infected J774A.1 cells showed greater expression of Egr1 at 1 h p.i. when YopM was present, but this pattern reversed at 3 h. At 6 h p.i., Cxcl10 mRNA was lower in parent-strain infected cells. We conclude that decreased Egr1 expression is a very early transcriptional effect of YopM and speculate that a pathway may exist from RSK1 through Egr1. These studies revealed novel early transcriptional effects of YopM but point to a time after 18 h of infection when critical transitional events lead to later major effects on cytokine gene transcription.
Introduction
The human-pathogenic Yersinia possess highly similar virulence plasmids that encode a type 3 secretion system (T3SS) for delivery of proteins into mammalian cells (Perry and Fetherston, 1997). Six of these, termed effector Yersinia outer proteins (Yops), function to undermine innate defenses by inhibiting cell signaling necessary for phagocytosis, activation of macrophages (MΦs) and effective anti-bacterial responses by polymorphonuclear leukocytes (PMNs) (Viboud and Bliska, 2011). Enzymatic functions and molecular targets are known for five of the effector Yops; but the mechanism for YopM has not been readily revealed. YopM consists almost entirely of leucine-rich repeats (LRRs) that assemble into a curved parallel beta-sheet structure (Evdokimov et al., 2001). The YopM proteins of the three human-pathogenic Yersinia species differ in the number of internal repeats and in the sequences of the internal LRRs but have high homology in the N- and C-terminal LRRs as well as the leader sequence recognized by the T3SS and a short C-terminal tail sequence. The pathogenic significance of the variations is not yet known. YopM of Y. pestis and some Y. pseudotuberculosis is a 46 kDa highly acidic protein with 15 LRRs (Evdokimov et al., 2001). After infection of HeLa epithelioid cells or J774A.1 monocyte (MO)-MΦ-like cells by Y. pestis, YopM was shown to traffic to the perinuclear region of the cell via a vesicular pathway, and variable amounts subsequently were found in the nucleus by 3–4 h post-infection (p.i.) (Skrzypek et al., 1998). YopM possesses at least one non-canonical nuclear localization sequence, but no importin could be identified for its uptake mechanism (Skrzypek et al., 2003; Benabdillah et al., 2004); it could enter the nucleus in association with a host molecule to which it binds in the cytosol (Skrzypek et al., 2003).
Pure YopM has been found to spontaneously penetrate eukaryotic cells due to sequences within the N-terminal leader region (Rüter et al., 2010). Although YopM is delivered to mammalian cells by the T3SS, an intriguing hypothesis has been put forth that type 3 secretion involves an extracellular stage for the Yops in which they are located at the bacterial surface between the bacterium and the host cell (Akopyan et al., 2011). Accordingly YopM might enter the cell from this surface-located compartment by using its spontaneous cell-penetration mechanism that triggers uptake at lipid rafts via caveolae (Rüter et al., 2010). Trafficking of pure YopM in HeLa cells follows a timecourse similar to that after infection: it was found in early endosomes after 15–30 min, late endosomes by 30–60 min, and a perinuclear localization by 60 min (Rüter et al., 2010). At 3 h, small amounts also were found in the nucleus (Rüter et al., 2010). The molecules that YopM binds during its trafficking have not been identified, and the extent to which YopM is exposed to the cytosol or partitions into the cytosol is not known. However, it does bind to all known isoforms of two cytosolic serine/threonine kinases, ribosomal protein S6 kinase (RSK or p90RSK) and protein kinase C-like (PRK or PKN) (McDonald et al., 2003; Hentschke et al., 2010); and YopM-associated complexes were found to contain combinations of the various RSK and PRK family members (Hentschke et al., 2010). In association with YopM, the two types of kinases were sequentially activated, with initial activation of RSK1 which in turn activated PRK2 (McDonald et al., 2003). RSK family members lie down-stream of ERK1/2 in the Ras-MAPK pathway. However, YopM did not affect activation of ERK but instead prevented dephophosphorylation of all RSK isoforms, perhaps by shielding them from phosphatases (Hentschke et al., 2010). YopM-RSK1 complexes were obtained within 30 min of infection of RAW 267.4 MO-MΦ-like cells by Y. pseudotuberculosis (McCoy et al., 2010), suggesting that such complexes form rapidly in the cytosol after contact between Yersinia and a host cell. Although RSK1 does shuttle between cytosol and nucleus, it was found that binding to RSK1 was not required for YopM to localize to the nucleus (McCoy et al., 2010). RSK and PRK do not normally function together; accordingly YopM was proposed to provide a scaffold for assembling a novel complex with novel substrate specificity, because several tested normal targets of these kinases (Bad, Jun, CREB, Akt) were found not to be activated by the presence of YopM (McDonald et al., 2003).
At present, it is not understood how these in-vitro observations underlie the effect YopM has in disease. The effect of the absence of YopM on lethality varies considerably with the route of infection and strain of mice that are used. YopM is required for full virulence of wildtype Y. pestis CO92 in bubonic plague in C57BL/6 mice, but it is not required for lethality in pneumonic plague (Ye et al., 2011). It is a major virulence determinant for systemic plague caused by conditionally virulent Y. pestis KIM5, a popular model strain for studies of plague in BSL2 containment. The KIM5 strain lacks a chromosomally encoded iron-acquisition system needed for virulence from an intradermal route of infection but is fully virulent after intravenous infection of mice (Une and Brubaker, 1984; Perry and Fetherston, 1997). In this model, the absence of YopM results in a modest loss of virulence in outbred Swiss Webster mice (Nemeth and Straley, 1997), whereas virulence is decreased by 4 orders of magnitude in C57BL/6 mice (Kerschen et al., 2004). Accordingly, these mice provide a powerful experimental system in which to dissect the molecular basis of YopM's pathogenic effect. In C57BL/6 mice infected intravenously with doses that were above the LD50 of the parent Y. pestis KIM5 but below that of ΔyopM-1 Y. pestis KIM5-3002, growth of the mutant was curbed in liver and spleen starting at day 2 p.i. (Kerschen et al., 2004; Ye et al., 2009, 2011). This was accompanied by a robust acute inflammatory response involving PMNs and inflammatory dendritic cells (iDCs) that eventually cleared the bacteria (Kerschen et al., 2004; Ye et al., 2009, 2011). In mice infected with the YopM+ strain, numbers of iDCs and natural killer (NK) cells began to decline from spleens starting at day 2 p.i., the bacteria continued growing, and the mice ultimately died (Kerschen et al., 2004; Ye et al., 2009, 2011). Concomitantly, levels of mRNA for pro-inflammatory cytokines remained low in spleens of mice infected with YopM+ Y. pestis but increased strongly in spleens of mice infected with the ΔyopM-1 strain (Kerschen et al., 2004). Depletion studies implicated iDCs as major cells responsible for controlling growth of ΔyopM-1 Y. pestis in spleen and showed that YopM was associated with inhibition of their recruitment (Ye et al., 2009, 2011). These findings prompted the hypothesis that in spleen YopM delivery to MΦs causes downregulated production of chemokines for inflammatory MOs, the cell type that gives rise to iDCs in organs (Ye et al., 2011).
These effects of YopM likely began earlier than day 2 p.i.: data pooled from multiple experiments indicated that the growth deficit of ΔyopM-1 Y. pestis was beginning at day 1 p.i. (Ye et al., 2011). We wanted to determine effects of YopM at earlier times to bridge the gap between the first hours of infection studied using in-vitro cell models and the previous in-vivo studies. The present study was designed to probe for YopM effects on chemokine/cytokine gene expression and protein production in this period, 1 h to 16–18 h p.i.
Materials and Methods
Bacterial Strains and Culture
The bacterial strains and plasmids used in this study are listed in Table 1. Escherichia coli was used for propagating plasmids that were transferred to Y. pestis KIM8-3003.12 as previously described (Forman et al., 2008). All Y. pestis strains lacked the ca. 102 bp pgm locus specifying the Ybt siderophore-based iron acquisition system that is needed for virulence of Y. pestis in peripheral tissues such as skin (Perry and Fetherston, 1997). A strain lacking the pgm locus (Δpgm) is conditionally virulent: avirulent in peripheral tissues but essentially fully virulent from an intravenous route of infection. Y. pestis was grown at 28°C in supplemented Heart Infusion Broth as described previously (Forman et al., 2008) and was transferred to 37°C for 1 or 3 h, as indicated. Where appropriate, carbenicillin (Cb) was added to cultures to ensure plasmid maintenance.
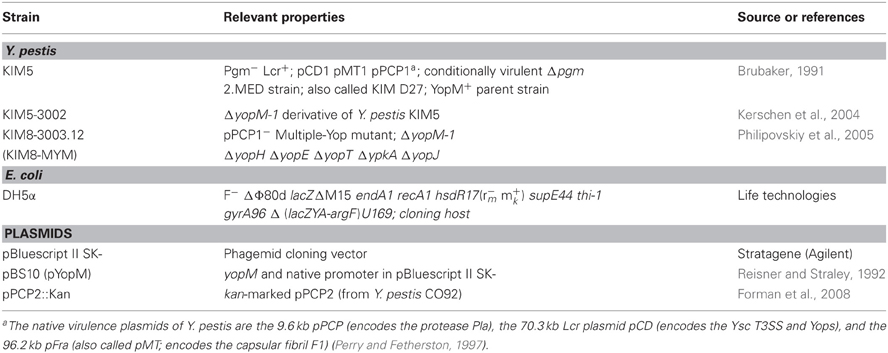
Table 1. Bacterial strains and plasmids used in this study.
Infection of Mice
All experiments with mice were reviewed and approved by the University of Kentucky Institutional Animal Care and Use Committee. Groups of four 6–8 week old female C57BL/6N.HSD mice (Harlan Sprague Dawley, Inc) were anaesthetized with isoflurane using a rodent anaesthesia machine and infected intravenously in the retro-orbital plexus (RO) with indicated doses as described (Ye et al., 2011). The bacterial doses were confirmed and bacterial burdens in liver and spleen determined by plating serially diluted samples, and splenic leukocytes were isolated, all as done previously (Ye et al., 2011). Two tissue-dissociation methods were used for experiments to obtain CD11b+ cells, a Stomacher 80 Lab blender as in previous work (e.g., Ye et al., 2011), and a GentleMACS dissociator (Miltenyi Biotec, Inc.) by using the manufacturer's protocol. The cell populations recovered by these methods were not identical; accordingly, the method used will be specified. In some experiments, livers and spleens from infected mice were fixed in buffered formalin, and paraffin-embedded sections were stained with hematoxylin and eosin. Sections were examined with a Nikon Eclipse E800 microscope and representative areas photographed with a Photometrics CoolSNAP cf camera.
Isolation of CD11b+ Cells
Splenic leukocytes were depleted of T cells, B cells, and PMNs by immunomagnetic beads (Miltenyi), with amounts and procedures as recommended by the manufacturer's protocol. This process also removed dead cells, which bind non-specifically to the beads. CD11b+ cells were then recovered on anti-CD11b antibody-coupled immunomagnetic beads. The manufacturer has verified that these beads will recover macrophages from spleen. Briefly, leukocytes from four spleens per infecting bacterial strain were pooled in ice-cold cell-column buffer (PBS pH 7.2, 0.5% BSA, 2 mM EDTA). The cells were pelleted and resuspended in the buffer, and biotinylated anti-Ly6G was added. After gentle mixing by inversion on a tube rotator for 10 min at 4–8°C, microbeads conjugated with anti-CD5, anti-CD19, or anti-biotin antibodies were added, the cell suspensions were mixed on the rotator for 15 min at 4–8°C, washed by centrifugation, and resuspended in 1 mL cell-column buffer. The suspensions were applied to LS separation columns (Miltenyi) at room temperature, and flowthrough cells (containing CD11b+ cells) were collected through a 20 gauge needle into tubes on ice. The columns were washed with cold buffer, giving a total effluent of 13 mL. The collected cells were centrifuged and resuspended in 0.1 mL buffer per column. Samples of diluted cells were stained with trypan blue for viability assessment and were counted in a hemocytometer. The cells were then positively selected for CD11b+ cells with anti-CD11b-conjugated microbeads in combination with a MACS Separator to retain anti-CD11b bead-labeled cells prior to flushing the cells off the column. This process typically yielded 1–2 × 10⁷ cells per pool from four mice, consistent with CD11b+ cells constituting ca. 5% of the splenic leukocytes (Ye et al., 2011), and the preparations consistently contained >95% viable cells. After removal of samples for differential cell counting and flow cytometry, the remaining cells were suspended in RLT/BME (Qiagen) following the manufacturer's protocol. They were snap-frozen in liquid N2 and stored at −80°C.
Analysis of Cell Populations
Differential counts for major leukocyte types were made for cell populations that were recovered following immune-magnetic bead treatment. Slides were prepared with a cytocentrifuge, stained with Giemsa, and cells scored from randomly selected fields. For the RNA microarray experiments, between 140 and 611 cells were scored per sample; for the multiplex chemokine experiments, between 570 and 972 cells were scored. The cells analyzed by RNA microarray also were analyzed for presence of Ly6G, Cd11b, Gr1, and CD11c (the 1-h infections) or Gr1 and F4/80 (the 18-h infections) by flow cytometry. Cell preparation for flow cytometry was done as previously described (Ye et al., 2011), and the analysis was carried out using a BD Biosciences LSRII flow cytometer. Dead cells and debris were gated using ethidium monoazide (EMA, Sigma) viability staining. The data were analyzed by FlowJo software (Version 7.6.1; Tree Star). Antibodies used were from BD Pharmingen, Inc.: fluorescein isothiocyanate (FITC)-conjugated anti-CD11b, allophycocyanin (APC)-conjugated F4/80, phycoerythrin (PE)-conjugated anti-Ly6G, peridinin chlorophyll protein-cyanine tandem dye (PerCP-Cy5.5)-conjugated anti-Gr1, PE-cyanine tandem dye (PE-Cy7)-conjugated anti-CD11c, and Fc Block™ (Rat Anti-Mouse CD16/CD32).
Multiplex MAP Cytokine/Chemokine Analysis
This set of experiments used the Miltenyi GentleMACS dissociator to dissociate spleens. Chemokines and cytokines made in response to 1 or 16 h infection with parent and ΔyopM-1 Y. pestis were analyzed by Milliplex MAP chemokine array that assays 22 inflammation-related cytokines and chemokines. The experimental series included several control and reference treatments as well as serum samples from some mice. (1) The CD11b+ cells from mice infected for 1 or 16 h and from non-infected control mice were made to 2 × 10⁶ cells ml−1 in RPMI + 10% FBS and cultured for 6 h in 12-well dishes at 37°C, 5%CO2. Culture supernatants containing secreted proteins were filtered through a 0.45 μm pore-size low-protein-binding filter and snap-frozen. (2) Serum was collected from all 16 h-infected mice and from non-infected mice, pooled in equal ratio from the four mice per group, filtered, and snap-frozen. (3) Non-fractionated splenic leukocytes from mice infected 1 h and from non-infected mice were cultured, filtered, and frozen as above. For the non-infected splenocytes, duplicate sets of wells contained 20 ng ml−1 phorbol myristyl acetate (PMA). (4) Non-fractionated splenic leukocytes from mice given 25 μg E. coli O111:B4 LPS (Sigma) by the RO route were obtained 1 h later and cultured, filtered, and frozen as for the CD11b+ cells. All of these experiments were carried out in triplicate on different days, using 108 mice total. The chemokine array analysis was performed by Millipore/Merck Biomarker Services (EMD Millipore, a division of Merck KGaA).
RNA Microarray Analysis
This set of experiments used the Stomacher 80 Lab blender to dissociate spleens. Total RNA was obtained from CD11b+ cells stored in RNAlater (Qiagen) by using the RNeasy mini-prep kit per the manufacturer's instructions (Qiagen). RNA integrity was assessed by comparing 18S and 28S rRNA species using gel electrophoresis on a Bioanalyzer (Agilent Technologies, Inc.). RNAs from duplicate experiments (each using four mice per infecting Y. pestis strain) were pooled 1:1 (except for 1-h infection with ΔyopM-1 Y. pestis, where triplicate experiments were used and the RNAs were pooled in equal ratios), and the pools were divided into three aliquots which were handled independently to generate three hybridization data sets. Fluorescent-labeled Cy5 (red) aRNA sample probes were prepared by reverse transcription with SuperScriptIII reverse transcriptase (Invitrogen), 1-round of amplification with amino-allyl nucleotides according to manufacturer's protocol (Epicentre Biotechnologies) and coupling to Cy5 (red) dye (GE Healthcare). Likewise Cy3 (green) labeled aRNA probe was prepared using the Universal mouse reference RNA comprised of RNA pooled from 11 mouse cell lines (Stratagene). Each Cy5 sample aRNA probe was paired with Cy3 reference aRNA probe and hybridized to microarrays in formamide-containing buffer overnight at 42°C using a Maui Hybridization System (BioMicro Systems Inc.). The custom-designed microarray consisted of 70-mer oligonucleotides representing 1555 immune response gene targets. Commercially available and custom-designed oligos were purchased from Operon Biotechnologies, Inc. and printed onto glass slides by the Duke Microarray Facility (Duke University, Durham, NC). Each microarray contained replicate targets spotted four times. The gene target pool also included housekeeping genes (i.e., Actb, Gapd, Tuba, ribosomal proteins Rpl13a, Rpl18, Rps9) used as internal references, negative background controls and known “spiked-in” RNA oligos (Applied Biosystems). The hybridized spot intensities were acquired using a GenePix 4000B scanner (Molecular Devices Corp) and assessed using GenePix Pro 6.0 software. Median pixel intensities (with background subtracted) were uploaded in the GeneSpring X software package (Agilent Technologies, Inc), normalized by global LOWESS fit (Cleveland, 1979), log base 2 transformed, filtered such that probes exceeding the background and spot quality criteria (i.e., “absent” probes) were not included and merged into datasets. Gene lists and hierarchical clusters of differentially expressed genes were generated. R software through Bioconductor (http://CRAN.R-project.org) was employed as another approach to analyze hybridization signal intensities (Becker et al., 1988; Zhang et al., 2009). The normalized log ratio expression data from the GeneSpring X analysis for all the genes in any sample that met the filtering criteria of “flags” on the microarray called present or marginal, but not absent, and for which the signal was above background in at least 3 of the 12 samples have been deposited in NCBI's Gene Expression Omnibus (Edgar et al., 2002) and are accessible through GEO Series accession number GSE41564 (http://www.ncbi.nlm.nih.gov/geo/query/acc.cgi?acc=GSE41564).
Quantitative RT-PCR Confirmation and Evaluation
Several gene targets were analyzed on the RNA used for microarray as well as from additional replicate experiments by two-step quantitative RT-PCR (qRT-PCR) using SYBR Green detection and quantification in a LightCycler 2.0 instrument equipped with version 4.0 software (Roche). Primer sequences were obtained from the RTPrimer Database (www.rtprimerdb.org).
Tissue-Culture Infection Models
Bone marrow-derived macrophages (BMMs) were used after 7–10 days culture of femoral bone marrow in 12-well dishes in medium comprised of 60% Dulbecco's Modified Eagle Medium (high glucose supplemented with glutamine and HEPES; GIBCO 11960: Life Technologies, Inc.) 20% heat-inactivated FBS (GIBCO 26140-079: Life Technologies), 20% filtered L929 cell-conditioned medium, and 1% penicillin-streptomycin-neomycin mixture (GIBCO 15640: Life Technologies). J774A.1 mouse macrophage-like cells (ATCC) were cultured in 24-well dishes in RPMI 1640 (supplemented with glutamine and HEPES: Mediatech, Inc. 10-041-CV: Corning Life Sciences) + 10% heat-inactivated FBS. Both cell types were grown to ~95% confluence and rested for 3 h in medium without FBS prior to infection. Y. pestis that had been grown to an OD620 of ca. 1.0 were pelleted and resuspended to give the desired MOI (10–40) in the appropriate tissue-culture medium without FBS and incubated, 1 ml per well, in 12-well plates at 37°C + 5% CO2. Medium for uninfected control wells was similarly incubated. After 1–3 h, the medium over the BMMs or J774A.1 cells was replaced by bacteria-containing or control medium, and the infection was initiated by a 5-min centrifugation. After infection for 1–6 h, the medium was replaced by 1 mL RNAlater (Qiagen) per well, and RNA was isolated by following the protocol for Qiagen RNeasy Mini Kit for adherent cells.
Statistics
For genomic analyses, a right-tailed Fisher's Exact Test was employed to produce a significance p-value that described how likely genes from a specific dataset participated in a desired function. For other assays, significance of differences was evaluated with the two-tailed unpaired Student's t test.
Results
High-Dose Systemic Plague Model
This project was undertaken to characterize early mRNA and cytokine responses that lead to the transcriptional and cellular recruitment differences seen at 2 days p.i. (Kerschen et al., 2004; Ye et al., 2011). We developed a high-dose intravenous infection model to provide a detectable host response at these early times. This route gives a synchronous infection in which the bacteria seed spleen and liver within 30 min (Conlan, 1997; Burnett et al., 2004). The dose of 106 potentially would provide immediate interactions with a significant fraction of immune cells known to be targeted by Y. pestis: MΦs, MOs, PMNs, and DCs (Lukaszewski et al., 2005; Marketon et al., 2005). Prior to infection, the bacteria were given a 3-h incubation at 37°C to induce thermally-upregulated genes such as those for the T3SS and Yops, because during the natural infection yersiniae that reach internal organs would have been pre-exposed to mammalian body temperature.
Figure 1A shows that the YopM-associated growth difference was manifested as a 10-fold difference in bacterial burden at 30 h p.i., demonstrating that a YopM-related host-response phenotype was present in this infection model. Up to 16 h p.i., the two Y. pestis strains grew at the same rate. This absence of a difference in bacterial burden at 16 h has important implications which will be discussed later. By 16 h, the host response to infection had clearly initiated, based on the presence of inflammatory foci in spleens of mice infected with either Y. pestis strain (Figure 2). These were located at the periphery of the follicles and adjacent red pulp. The live inflammatory cells in infected spleens were characterized by flow cytometry. Figure 1B illustrates the gating strategy used to define and quantify these cells, and Figure 1C shows the dynamics of three populations during the development of disease: Ly6G+ F4/80− mature PMNs, Ly6G− F4/80+ Gr1+ MOs, and Ly6G− F4/80− Gr1+ cells, comprised of iDCs, plasmacytoid DCs, some CD8+ T cells, and myeloid-derived suppressor cells (MDSCs) (Kung et al., 1991; Egan et al., 2008; Auffray et al., 2009). By 8 h p.i., all three populations had markedly increased in prevalence over the levels present in non-infected mice (open squares on the ordinates). However, by 16 h p.i., and further at 30 h, the PMNs and MOs had declined in prevalence in both infections. In contrast, the net percentages of the heterogeneous Ly6G− F4/80− Gr1+ population remained the same at 16 h as at 8 h p.i.. By 30 h the mice were clearly sick, and the decreases in other populations resulted in an apparent increase in percentage of Ly6G− F4/80− Gr1+ cells. We did not investigate the basis of inflammatory cell loss but note that it is well known that initially acute inflammatory foci evolve into cell-poor lesions at later times in systemic plague even for ΔyopM-1 Y. pestis when the bacterial numbers are similar to those in our study Ye et al. (2011). Based on these observations, we elected to restrict our studies to around 16 h p.i., and earlier, when there were no differences in bacterial burdens between infecting strains that could influence the host response in a non-YopM-related manner. At 16 h, the bacteria were replicating, and a robust host cellular response was underway. This time point would be long enough after infection that the influence of YopM on gene expression in inflammatory cells as well as resident cells could be manifested. As a very early point in infection we chose 1 h p.i., when inflammatory foci were not detected (data for liver not shown) and the bacteria likely were interacting mainly with resident cells.
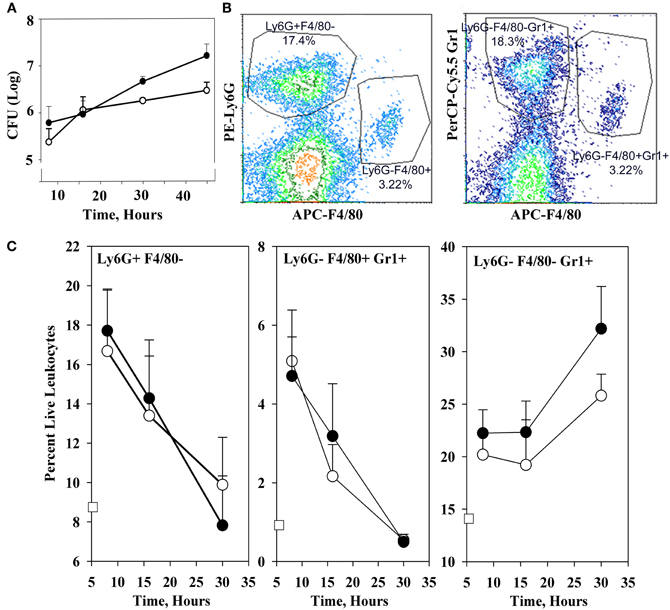
Figure 1. Infection dynamics and host cellular responses in spleen in the high-dose systemic plague model. C57BL/6 mice were infected intravenously with a dose of 106 of the parent Y. pestis KIM5 (closed circles) or the ΔyopM-1Y. pestis KIM5-3002 (open circles) that had been induced for expression of thermally-upregulated properties for 3 h at 37°C. Bacterial burdens were determined as CFU Panel (A). Bacterial numbers differed significantly for parent and ΔyopM-1 Y. pestis at 30 and 45 h p.i. (P <10−4 and P < 10−2, respectively). Splenic leukocytes were stained with fluorochrome-conjugated antibodies against the surface markers Ly6G, F4/80, and Gr1 as well as the dye EMA which stains cells that have lost membrane integrity, and analyzed by flow cytometry. Panel (B) illustrates the gating strategy used to define and quantify several host cell populations as percent live leukocytes. Panel (C) shows how the percent of EMA− (i.e., “live”) leukocytes changed over 30 h of infection for three inflammatory cell types of relevance to the host response to Y. pestis. Values for non-infected mice are given by the open squares on the ordinates. Percentages of Ly6G+ F4/80− PMNs at 16 h were significantly different from those at 8 h for mice infected with the ΔyopM-1 strain (P < 0.05 by student's t-test); those at 30 h differed significantly from 8 h for infections by both Y. pestis strains (P < 10−2 for parent and P < 10−4 for ΔyopM-1). For Ly6G− F4/80+ Gr1+ MOs, percentages at both 16 and 30 h differed significantly from those at 8 h for both infections (parent: P < 0.05 for 16 h, P < 10−5 for 30 h; ΔyopM-1: P < 10−2 for 16 h, P < 10−5 for 30 h). For the Ly6G− F4/80− Gr1+ population, percentages differed only for 30 compared to 8 h p.i. (P < 10−2 for parent Y. pestis and P < 10−3 for ΔyopM-1). Each datum point gives the averages ± standard deviation (SD) for pooled data from six mice in two independent experiments.
Figure 2. Histopathology of spleen at 16 h p.i. C57BL/6 mice were infected for 16 h as in the experiments of Figure 1, and spleens were fixed in formalin and stained with hematoxylin and eosin. Representative sections are shown. Left panel, spleen from a mouse infected with parent Y. pestis; Right panels, spleen from a mouse infected with ΔyopM-1 Y. pestis. In each panel the surround indicates an inflammatory focus at the edge of a lymphoid follicle.
Cytokines and Chemokines in Splenic Cells and Sera of Mice Infected with YopM+ and YopM− Y. pestis
Putative target cells for YopM in spleens of mice infected for 1 or 16 h were characterized for their release of 22 chemokines and cytokines after a 6-h incubation in-vitro. We wanted to remove non-critical cells from the analysis in an effort to focus on cells that mediate the pathogenic effect of YopM and thereby increase the signal-to-noise ratio. Because mice lacking T cells and B cells or depleted of Ly6G+ PMNs still control growth of ΔyopM-1 Y. pestis in spleen as efficiently as wild-type mice (Kerschen et al., 2004; Ye et al., 2011), these cells are not critical cells for the pathogenic effect of YopM (or their absence would allow the ΔyopM-1 strain to grow like the YopM+ parent strain). Accordingly, we removed B cells, T cells, and Ly6G+ PMNs from splenic leukocytes of infected mice and selectively recovered CD11b+ cells for chemokine assays. These included resident MΦs and myeloid DCs (mDCs), MOs, any iDCs present at 16 h, and MDSCs as well as immature PMNs not removed by the anti-Ly6G-coupled beads (Frazer et al., 2011). In addition, cytokine production by total splenic leukocytes was assayed for mice infected 1 h, and sera were analyzed from mice infected for 16 h. Two classic stimulatory treatments were included as systems controls: mice were treated with LPS for 1 h and their total splenic leukocytes were assayed for production of chemokines, and total splenic leukocytes from non-infected mice were treated with PMA during the 6-h in-vitro culture period. These assays were needed to validate the duration of culturing for chemokine/cytokine production and the ability to detect host responses after only 1 h of stimulus.
Table 2 gives the percentage of cell types recovered from the anti-CD11b-conjugated beads after 1 or 16 h infection with parent or ΔyopM-1 Y. pestis. Surprisingly, the recovered populations were dominated by comparable numbers of MO/MΦs and immature PMNs (ring forms, band cells, and intermediate stages between these). It cannot be ruled out that some of these were MDSCs, which also are CD11b+ Gr1+ cells present in spleens of healthy mice (Ribechini et al., 2010). These cells have been documented to function in suppression of T cell responses (Ribechini et al., 2010) and, in one case, resolution of infection (Poe et al., 2012). In the present study the cells were obtained during the early phase of acute inflammation and most likely were immature PMNs.
Table 2. Distribution of cell types among splenic CD11b+ cells analyzed by multiplex chemokine/cytokine array.
There were no significant differences in prevalence of cell types between mice infected with YopM+ and ΔyopM-1 Y. pestis for either infection time. Although there was a trend toward increased prevalence of PMNs at 16 h compared to cells from 1 h p.i., and non-infected mice, this effect was not statistically significant. These findings are consistent with our previous observations that MOs accumulate in Y. pestis-infected spleens alongside or even before the PMNs and that up to day 1 p.i. the numbers of both cell types (as assayed by flow cytometry) do not differ between mice infected with the two Y. pestis strains (Ye et al., 2009).
Table 3 shows that non-infected splenocytes cultured for 6 h with PMA produced detectable amounts of nine chemokines in all three experiments, in contrast to ones cultured with medium alone, which produced small amounts only of CCL5 and, in two experiments, of CXCL9 and CXCL10. Splenocytes from mice treated with LPS for 1 h consistently produced twelve of the chemokines/cytokines during subsequent culture with medium alone, and these generally were present in significantly greater amounts than from splenocytes stimulated in-vitro with PMA. These reference tests showed that the test system functioned well and had the potential to provide meaningful results with cells from infected mice.
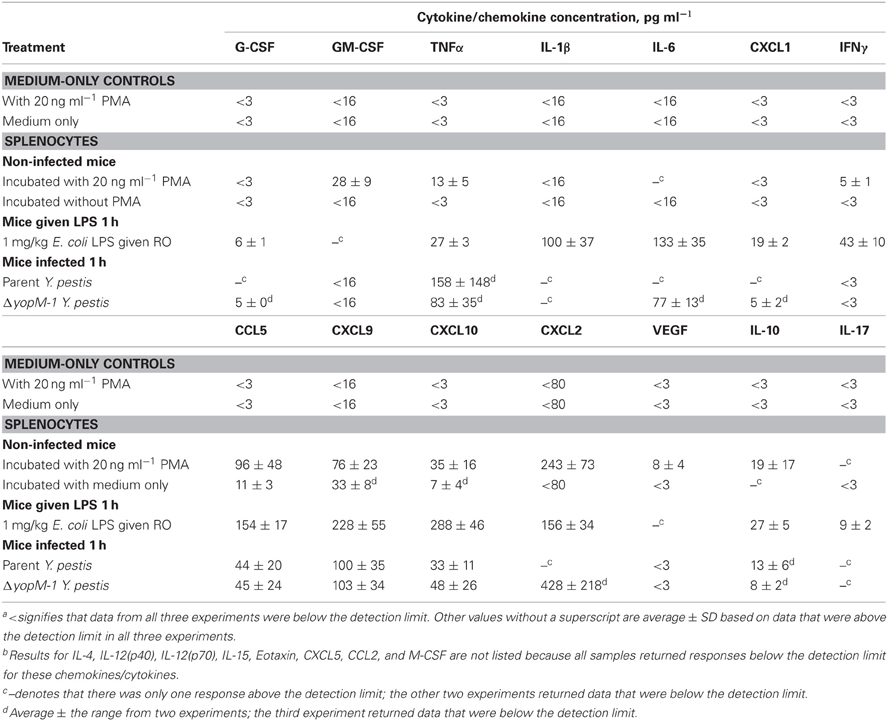
Table 3. Control tests for multiplex analysis of chemokines and cytokinesa,b.
Table 4 shows the chemokine/cytokine profiles for sera and CD11b+ cells from these experiments. The analyses of sera from mice infected with both YopM+ and ΔyopM-1 Y. pestis confirmed that a robust cytokine/chemokine response was underway by 16 h p.i., with levels of G-CSF and CXCL9 greater than 100-fold above those in non-infected mice, and high levels of IL-6, CXCL1, CCL2, CXCL10, and IFNγ. Curiously, GM-CSF and IL-1β were not detectable in sera. Six chemokines (including TNFα) were present at levels less than 5-fold above those in non-infected mice, and amounts of five others, including IL-4 and IL-10, were comparable to those in non-infected mice. Of the 22 chemokines and cytokines assayed in sera, two differed between mice infected with the two Y. pestis strains: CXCL10 (significant at P = 0.0423) and IL-6 (not quite significant at P = 0.066), but the differences were less than 2-fold. Overall, these experiments revealed that mice infected with a large dose of Y. pestis produced only a marginal systemic cytokine response at 1 h p.i., but a strong and selective systemic response that was independent of the presence of YopM in the infecting strain by 16 h p.i.
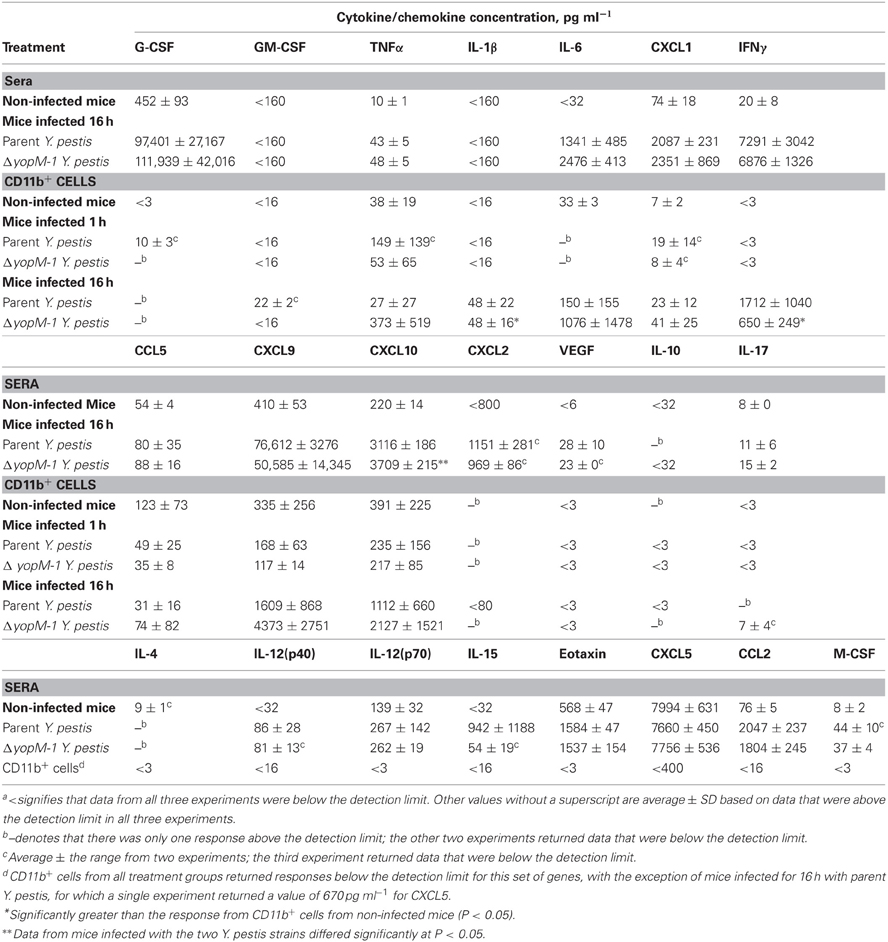
Table 4. Chemokines and cytokines from sera and splenic CD11b+ cells of mice infected with YopM+ and ΔyopM-1 Y. pestisa.
At 1 h p.i., CD11b+ cells produced detectable amounts of 7 chemokines/cytokines, but none of these was consistently found at levels above those for cells from non-infected mice. At 16 h p.i., the CD11b+ cells produced these same chemokines/cytokines more consistently; but due to the range of responses in the three experiments, only IL-1β and IFNγ (for ΔyopM-1 Y. pestis) levels were significantly higher than for CD11b+ cell responses from non-infected mice (at P < 0.05). There were no significant YopM-related differences in chemokine/cytokine production by CD11b+ cells at 16 h p.i.
Transcriptional Profiling of Splenic CD11b+ Cells from Mice Infected with YopM+ and ΔYopM Y. pestis
Levels of mRNAs for a custom panel of immune response genes were measured for CD11b+ cells obtained from spleens of infected mice and compared to transcript levels in a commercially produced “Universal mouse reference RNA.” In these experiments, spleens were dissociated with a Stomacher lab blender, producing a cell population skewed toward MOs/MΦs rather than immature PMNs (see Table 5). Figure 3 shows that the majority of these cells were in fact CD11b+.
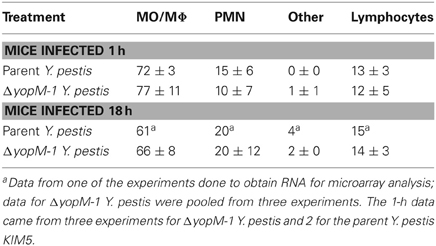
Table 5. Distribution of morphological types among the CD11b+ cells used for transcriptional analysis.
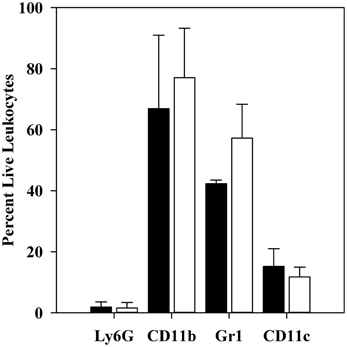
Figure 3. Flow cytometric analysis of CD11b+ cell populations after 1 h infection. C57BL/6 mice were infected for 1 h with 106 thermally-induced parent or ΔyopM-1 Y. pestis, and CD11b+ cells were obtained from spleens as described in the legend to Figure 2. Samples were analyzed by flow cytometry for the presence of Ly6G, CD11b, Gr1, CD11c, and for staining by EMA. The bars represent the averages ± SD of the percent live leukocytes. Solid bars, mice infected with parent Y. pestis (pooled data from two experiments and 8 mice); open bars, mice infected with ΔyopM-1 Y. pestis (pooled data from three experiments and 12 mice).
Also as expected, very few were positive for the Ly6G marker on mature PMNs. The majority (40–60%) of the population was also positive for Gr1 (not significantly different for mice infected by YopM+ vs. ΔyopM-1Y. pestis). Similar percentages of Gr1+ cells were present among the CD11b+ cells obtained at 18 h p.i. [53 ± 7 and 63 ± 10% for mice infected with parent and ΔyopM-1 Y. pestis, respectively (determined by flow cytometric analysis for Gr1 and F4/80)]. These cells likely were mainly MOs, iDCs, mDCs, and possibly MDSCs, based on the magnetic bead selections that produced them. About 10% of the cells were positive for the DC marker CD11c.
Table 6 gives the microarray findings for genes expressed ≥2-fold higher or lower by splenic CD11b+ cells from mice infected 1 h with parent vs. ΔyopM-1 Y. pestis. As expected for this very early time of infection, not many transcriptional differences were found. However, one gene was present as a large difference in both of the analyses: early growth response transcription factor 1 (Egr1), which encodes a transcription factor that mediates the immediate early response of cells to many stresses (Sukhatme, 1990). This gene is a likely candidate for upregulation by 1 h of infection, as Egr1 is regulated at the transcriptional level, with message levels increasing within 30 min to 2 h after a stimulus (Yan et al., 2000). Interestingly, the gene for the chemokine CCL2 also was differentially expressed sufficiently to pass the criteria in the GeneSpring X analysis. It is a known transcriptional target of Egr1 (e.g., Yan et al., 2000). These findings represent the earliest transcriptional effects associated with YopM and point to a possible direct effect of YopM in cells that may interact directly with Y. pestis.
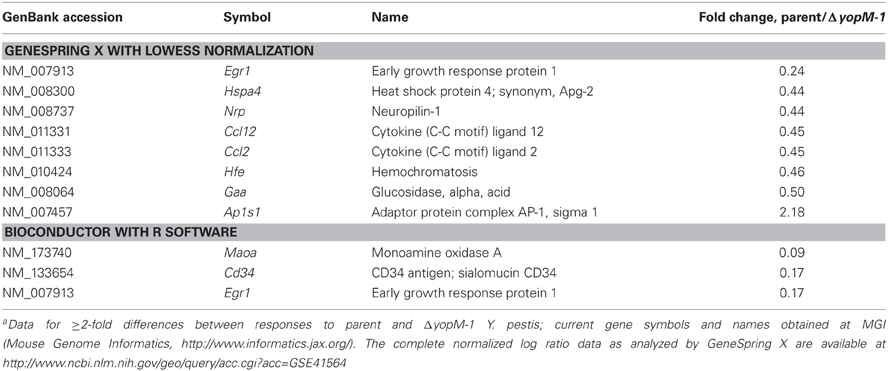
Table 6. Microarray results for 1-h infection, analyzed two waysa.
The transcriptional response by splenic CD11b+ cells infected for 18 h was remarkably restricted: only 176 of the 1561 gene targets on the chips showed changes in expression ≥2-fold compared to expression at 1 h p.i. 55 of these genes were in common between mice infected with the two Y. pestis strains, 97 were unique to mice infected with the YopM+ strain, and 24 were unique to mice infected with ΔyopM-1 Y. pestis (see full dataset at http://www.ncbi.nlm.nih.gov/geo/query/acc.cgi?acc=GSE41564). Table 7 shows those transcriptional responses that differed by ≥2-fold between mice infected with the two Y. pestis strains at 18 h. There was no agreement by the two data analyses, even for apparently strong differences (e.g., Chi3l3). Nonetheless, because the presence of YopM appeared to affect a few genes very strongly we repeated the 18-h infections and measured message abundance relative to the control gene Ubc for Chi3l3 and Cxcl2 and also the potentially relevant p47 Phox gene Ncf1 in splenic CD11b+ cells by qRT-PCR. None differed by ≥2-fold for cells from mice infected with the two Y. pestis strains (data not shown). Taken together, these findings signify that there were no major transcriptional differences between CD11b+ cells from the two groups of mice at 18 h p.i.
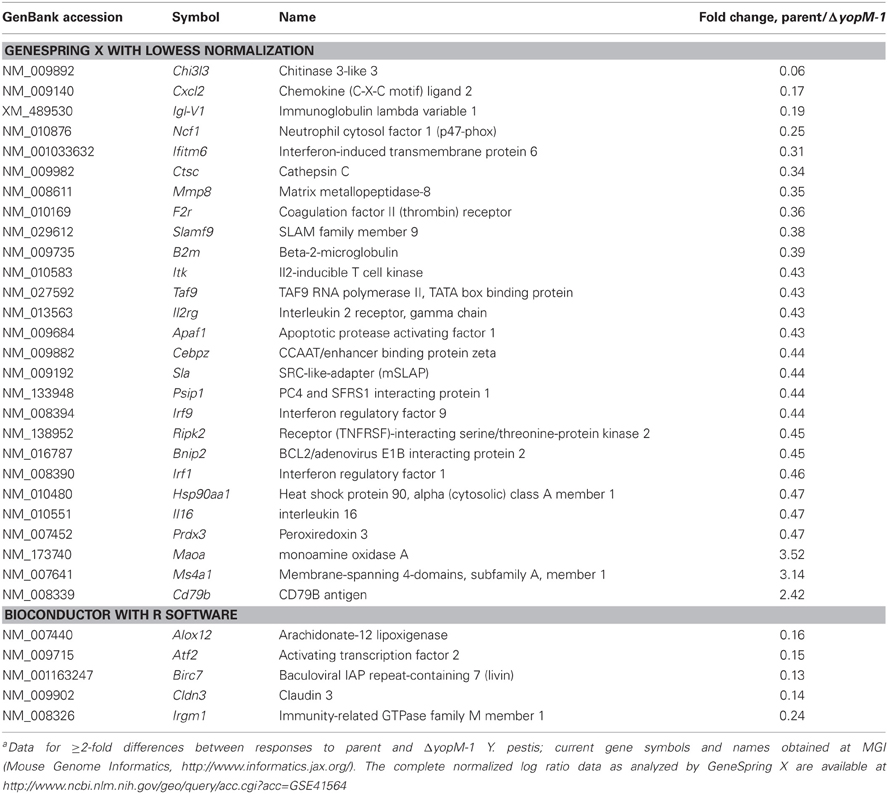
Table 7. Microarray results for 18-h infection, analyzed two waysa.
Table 8 shows that the microarray findings for Egr1 and Ccl2 at 1 h p.i. were reproduced in confirmation tests by qRT-PCR. The YopM-related effect on Egr1 expression was a downregulation compared to the level in CD11b+ cells from non-infected mice. We also tested genes for three other proinflammatory chemokines/cytokines and found a small upregulation of Il1β in the absence of YopM. There were no significant differences in expression of these genes between CD11b+ cells from mice infected for 18 h with the two Y. pestis strains, consistent with the hypothesis that no major transcriptional changes related to YopM were occurring in this cell population at this time. However, these cells clearly were responding to the infection, as Ccl2, Ccl3, and Il1β were upregulated in expression compared to cells from non-infected mice.
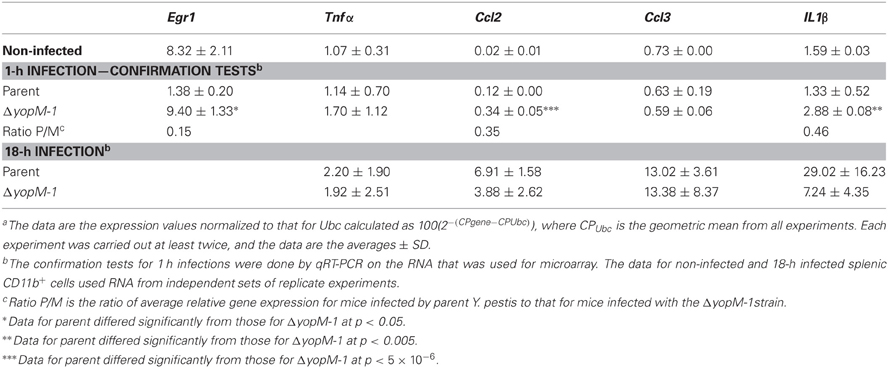
Table 8. Relative transcript levelsa for a set of inflammation-related genes in splenic CD11b+ cells from infected mice.
Inflammatory Gene Expression using in-vitro Infection Models
In the interest of identifying a system to extend the studies to the biochemical level with a pure cell population, we tested whether BMMs infected in-vitro for 2 h would show YopM-related transcript differences at 6 h for the same genes examined in the experiments of Table 8. Table 9 shows that the BMMs responded to infection by upregulating expression of all five genes tested; but there were no YopM-related differences, even for Ccl2. Egr1 in infected BMMs showed no difference from non-infected cells, as expected for this transiently expressed gene after 6 h infection.
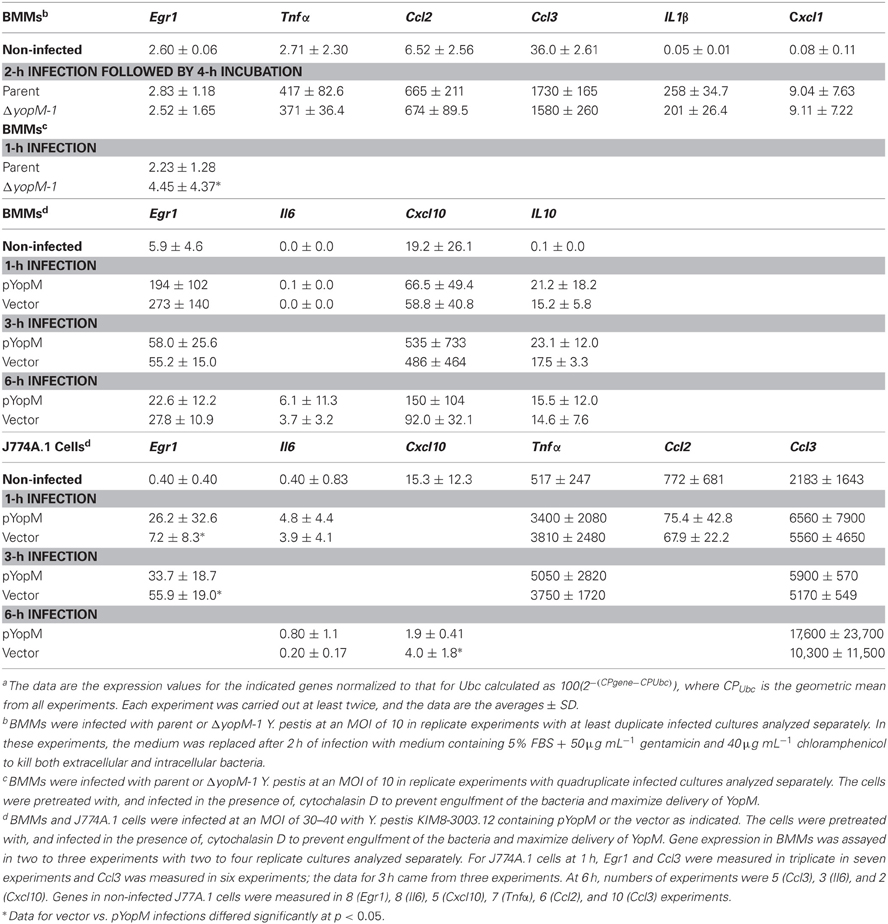
Table 9. Relative gene expressiona in cultured MΦs.
To test for a YopM-related difference in Egr1 expression, BMMs were infected for 1 h (Table 9). In these experiments, the cultured macrophages were pretreated and infected in the presence of 2.5 μM cytochalasin D, which has been used previously in experiments to measure Yops delivery to J774A.1 cells (Cowan et al., 2005). This refinement in the protocol was made to prevent phagocytosis of some yersiniae and their loss from the population delivering YopM, since YopM is believed to be delivered primarily by extracellular bacteria (e.g., Skrzypek et al., 1998). These tests revealed a statistically significant 2-fold lower Egr1 expression when YopM was present in the infecting Y. pestis and extended our transcriptional findings from infected mice to an in-vitro infection model.
In an attempt to elicit a stronger in-vitro transcriptional phenotype for YopM that could be pursued biochemically, we infected BMMs and also J774A.1 monocyte-like cells at a higher MOI (30–40) with Y. pestis KIM8-3003.12, which lacks all 6 effector Yops and also the surface protease Pla that can degrade Yops (Sodeinde et al., 1988). yopM was overexpressed in trans on pYopM, or the yersiniae contained only the empty vector. The bacteria were given a 1-h induction at 37°C to prime for rapid delivery of YopM upon cell contact while retaining most of the reactogenic lipid A form characteristic of growth at ambient temperature (Rebeil et al., 2004). This was to provide a proinflammatory stimulus against which the effect of YopM might be revealed, because YopM would normally be functioning in a proinflammatory environment in-vivo. In these experiments the use of cytochalasin D to prevent engulfment of the bacteria was crucial, because these yersiniae lacked the antiphagocytic Yops.
Table 9 shows the results. BMMs infected for 1 h showed strongly upregulated expression of Egr1 and a trend toward lower expression when infected with the pYopM-containing Y. pestis KIM8-3003.12 compared to the vector-only control strain, but the effect was less than 2-fold and not statistically significant. As expected, Egr1 expression had declined by 3 h and further by 6 h of infection. No YopM-related differences were found for the other genes tested.
In J774A.1 cells infected for 1 h with either Y. pestis strain, all genes tested except Ccl2 were expressed at levels significantly greater than those in non-infected cells (highest P by t-test was <0.005) (Table 9). Ccl2 expression was downregulated by infection with both YopM-expressing and control Y. pestis strains (P < 0.05). Interestingly, there were significant YopM-related differences in Egr1 expression, with 3.6-fold greater expression when YopM was present at 1 h compared to cells infected with the vector-only strain (P < 0.05). This pattern had reversed by 3 h p.i. (P < 0.05), and expression was still strong, indicating that in these cells YopM can have both early and delayed effects on Egr1. No other genes tested showed YopM-related differences in expression at either 1 or 3 h. Cxcl10, which was assayed only after 6 h, was downregulated in expression by infection (P < 0.05 for both Y. pestis strains) but showed greater downregulation when YopM was present (P < 0.05).
Discussion
In this study we sought to identify early effects of Y. pestis YopM in-vivo and characterize potential molecular pathways that YopM modulates. We used a high-dose infection model to influence as many of the direct target cells for Y. pestis as possible in their natural context while retaining the phenotype of the ΔyopM strain. The synchronous infection due to the intravenous route was then exploited in a series of molecular discovery assays. We chose 1 and 16 h p.i. for analysis as times when the two bacterial strains were present in the same numbers, but the ΔyopM strain had reached its peak and would not significantly increase thereafter due to the host response that normally is counteracted by YopM (Figure 1A). The spleens of the mice at 16 h p.i. had similar acute inflammatory foci at the periphery of many follicles. The numbers of live PMNs and inflammatory MOs were declining but still elevated, and cells obtained by immunomagnetic beads were viable.
CD11b+ Cells Participate in the Early Host Response to Systemic Plague
Although this model was not intended to replicate systemic plague that occurs following low-dose peripheral infection, it did provide the earliest available picture of host responses to systemic plague and important new findings. A recent study of the systemic phase of bubonic plague due to fully virulent Y. pestis CO92 showed high levels of the PMN maturation factor G-CSF, chemokines CXCL1 and CCL2, as well as cytokines IL-6 and Il-1α in plasma (Demeure et al., 2012). These responses occurred by day 2 after subcutaneous infection of rapid-responding plague-resistant SEG mice but were delayed in susceptible C57BL/6 mice. Systemic bacterial numbers were distinctively higher on day 2 in the SEG strain, and chemokine/cytokine response correlated with bacterial burden. In our study with a high dose given intravenously, we also obtained high levels of G-CSF, CXCL1, CCL2, and IL-6 in serum at 16 h p.i. in C57BL/6 mice (IL-1α was not tested) and this agreement indicated that findings from this model were not artifactual. Despite very high amounts of G-CSF in serum at 16 h p.i., GM-CSF, a maturation factor for MOs, DCs, and PMNs, was not detectable, and the MO maturation factor M-CSF was present only at low levels. The CSFs are produced by many cell types, including T cells, endothelial cells and stromal cells in addition to MΦs, and a circuit of amplification is hypothesized in which stimulated MΦs produce cytokines that in turn stimulate CSF production from surrounding cells (Hamilton, 2008). The basis of selective expression of G-CSF in infection is not fully understood, but it is part of the response to sepsis (e.g., Cebon et al., 1994) and is not unique to plague. A striking feature of our findings for sera at 16 h p.i. was the absence of the pro-inflammatory cytokine IL-1β, which also was not elevated in plasma or organs at any time in the study by Demeure et al. (2012). Y. pestis has been found to stimulate caspase-1 activation and IL-1β production in MΦs (e.g., Bergsbaken and Cookson, 2007; Lilo et al., 2008); however, this effect apparently was not dominant early in systemic plague.
We found a high level of the T helper 1 (Th1)-biasing cytokine IFNγ and very high levels of two chemokines that are involved in type 1 immune responses: CXCL9 and CXCL10 [not tested by Demeure et al. (2012)]. These observations could indicate that an early response to high numbers of Y. pestis includes mobilization of a Th1-biased host response in addition to innate defenses, consistent with the absence of elevated levels of the Th2 cytokines IL-4 and IL-10 in sera. However, these chemokines increasingly are being recognized as part of the early response to acute microbial infections. Similarly to defensins, they can serve direct anti-microbial roles against Gram-negative pathogens (Cole et al., 2001), they are expressed early and promote bacterial clearance of Klebsiella pneumoniae in experimental pneumonia (Zeng et al., 2005), and they can promote survival against sepsis by stimulating enhanced PMN recruitment and phagocytic activity (Kelly-Scumpia et al., 2010). They may have protective potential against systemic plague.
The chemokines/cytokines in sera represent the pooled output of leukocytes and tissue cells in both liver and spleen, and there were no large differences between sera of mice infected with YopM+ compared to ΔyopM-1 Y. pestis. To focus on the direct effects of YopM on cells to which Y. pestis delivers Yops, we measured chemokines/cytokines produced by a subpopulation of splenic leukocytes. Y. pestis KIM5 was previously found to deliver a tagged YopM selectively to CD11b+ CD11c− MΦs, CD11c+ CD11b− DCs, and Gr1+ cells (PMNs, MOs, and iDCs), but not to CD4+ or CD8+ T cells or CD19+ B cells in spleens of C57BL/6 mice (Marketon et al., 2005). We previously showed that Ly6G+ PMNs are not required for the pathogenic effect of YopM in spleens of C57Bl/6 mice infected with parent Y. pestis KIM5 compared to the ΔyopM-1 strain (Ye et al., 2011). Accordingly, we removed B, T, and dead cells along with Ly6G+ PMNs from the splenic homogenates prepared from mice infected for a short time with YopM+ or ΔyopM-1Y. pestis, and recovered CD11b+ cells for analysis. Surprisingly, a third of the resulting cells, even from non-infected mice, had the appearance of immature PMNs. These cells were released by the Miltenyi dissociator protocol used in these experiments: fewer such cells were present in the populations that we obtained for studies of gene expression with what may be a gentler homogenization method. Nonetheless, they were present in all of the mice and could have participated in cytokine production. At 16 h p.i. the CD11b+ cell population likely did contribute to the high levels of CXCL9, CXCL10, and IFNγ that were present in mice infected with either YopM+ or ΔyopM-1 Y. pestis. Further, the gene for CXCL10 was strongly induced after 6 h p.i. in total splenic leukocytes from SCID mice infected with a high but non-lethal dose of Y. pestis lacking effector Yops or expressing only YopM (R. L. Chelvarajan and S. C. Straley, unpublished data). These findings provided additional support to the idea that mice with systemic plague mobilize a Th1-biased innate response early in infection. The data also indicated that CD11b+ cells contribute to this response; but they did not point to a major role for YopM in early chemokine/cytokine production.
The Early Transcriptional Response by CD11b+ Cells in Systemic Plague
Our microarray experiments tested whether the presence of YopM affects expression of more than 1500 genes early in CD11b+ cells from infected spleens. In these tests MOs/MΦs constituted more than two thirds of the CD11b+ population that we obtained. Overall, the transcriptomic response was limited in scope, reflecting the remarkably stealthy character of even high numbers of Y. pestis. This phenomenon was noted in the microarray study of gene expression in lymph nodes of rats with bubonic plague (Comer et al., 2010). We found no genes with YopM-associated significant changes in expression at 18 h p.i. There was, however, a YopM-associated downregulation of the gene for Egr1, at 1 h p.i. This is the earliest time examined so far for Y. pestis infection in-vivo and was possible because of the synchronous infection used in this work. Egr1 is expressed in response to a wide range of cellular stresses, including bacterial and parasitic infection (De Grado et al., 2001; Wiley et al., 2011), and its product contributes to the regulation of hundreds of genes. It was identified as a member of a “core response module” in macrophages consisting of 38 genes that all show differential responses to stimuli and that tend to be targeted by pathogens (McDermott et al., 2011). Proinflammatory genes that are upregulated by the binding of Egr1 to their promoters encode TNFα, tissue factor, ICAM-1, CCL2, IL-8, and IL-6 (Guha et al., 2001; Shi et al., 2002; Hoffmann et al., 2008). Accordingly, we included Tnfα, Ccl2, and Il6 among the genes evaluated with in-vitro infection models.
YopM-Associated Gene Expression in BMMs and J774A.1 Cells
We wanted to determine if altered gene expression due to the presence of YopM could be detected in an in-vitro infection model with a single host cell type. Macrophages were chosen because of their predominance in the populations studied by microarray and because of the predicted central role of Egr1 in their responses. Recent studies have found that YopM can spontaneously penetrate cells and cause ca. 2-fold downregulation of Tnfα expression in HL60-derived macrophages by 6 h following exposure to a high concentration (25 μg ml−1) of pure protein (Rüter et al., 2010). YopM also could significantly counteract the stimulatory effect of LPS on mRNA levels for Tnfα and several other cytokine genes in these cells (assayed after 16 h; Rüter et al., 2010). Therefore, we revisited macrophage cell-culture infection models to determine if delivery of YopM by infection was downregulatory on gene expression. Despite using multicopy expression of yopM, a high MOI, inhibition of phagocytosis to retain strong T3SS delivery by extracellular bacteria, and the absence of other Yops that would compete for the T3SS channel or downregulate NF-κB and MAP kinase signaling, we found only small downregulatory effects of YopM on Egr1 expression in BMMs. However, J774A.1 cells did show significant YopM-related early transcriptional responses. BMMs have a mature macrophage phenotype, whereas J774A.1 cells are intermediate MO-MΦ-like cells (Chamberlain et al., 2009), so it was reasonable to test them as a model for cells from an early inflammatory focus. These cells showed a biphasic response by Egr1 to the presence of YopM, being initially upregulated compared to cells infected without YopM delivery and then comparatively downregulated at 3 h p.i. This is intriguing and raises the possibility that YopM has distinct effects depending on its state of trafficking in the cell, as little YopM is observed in the nucleus by 1 h p.i., but a significant amount can be there by 3 h (Skrzypek et al., 1998). We found no significant YopM-related differences in Tnfα message levels at 3 h p.i., perhaps because of the opposing effects on Egr1. It is meaningful to test for Tnfα message this early in infection, because it can be induced within an hour in response to stimuli (Espel et al., 1996; Raabe et al., 1998), and a significant downregulating effect was observed at 3 h by Rüter et al. (2010) in HL60-derived macrophages treated with pure YopM. The other tested gene that was differentially affected by the presence of YopM was Cxcl10 at 6 h p.i. This gene is not known to be directly regulated by Egr1; however, a potential effect of YopM on Cxcl10 expression could be real and worthy of further investigation, because CXCL10 levels in serum were slightly lower at 16 h p.i. in mice infected by the YopM+ strain. Our findings from J774A.1 cells are consistent with an effect of YopM at the level of transcription early in infection.
Integration of These Findings with the Growing Picture of YopM Function at the Biochemical Level
Egr1 transcription is activated in response to MAPK pathways that lead to activation of the transcription factor Elk-1, such as the Ras-Raf-MEK-ERK1/2 pathway (Guha et al., 2001). For example, in response to LPS, ERK1/2-activated Elk-1, along with serum response factor (SRF), bind and activate the Egr1 promoter in THP-1 human monocytic leukemia cells (Guha et al., 2001). The nuclear-localized transcription factor SRF is a substrate of RSK1, and phosphorylation of SRF by activated RSK1 increases the affinity of SRF for serum response elements in promoters (Romeo et al., 2012) such as that for Egr1. YopM's interaction with RSK1 might downregulate Egr1 indirectly by forming large complexes with RSK1 in the cytosol, thereby sequestering this kinase there, and effectively preventing its access to the nucleus and to SRF. Decreased levels of Egr1 could result in reduced transcription of Egr1 target genes such as Tnfα, as seen by Rüter et al. (2010). RSK1 is also involved in regulation of IFNγ-dependent translation (Kroczynska et al., 2011); however, such a role was not evident at 16 h of infection, when we characterized chemokines/cytokines present in serum and produced by CD11b+ cells. We believe that our findings link YopM's binding of RSK1 to indirect early effects on transcription.
However, binding to RSK1 does not account for all of YopM's pathogenic effect, because a YopM that was unable to bind RSK1 still endowed Y. pseudotuberculosis with more pathogenic potential than that of a strain without YopM (McCoy et al., 2010). PRK2 binds at a more internal site on YopM than does RSK1 and could be involved (McPhee et al., 2010). Further, YopM might interact with numerous cellular components during its trafficking, with potential pathogenic consequences (Skrzypek et al., 1998); and YopM does go to the nucleus and likely does function there.
The Larger Picture of YopM Function
YopM is a major virulence factor in systemic plague due to Δpgm Y. pestis in C57BL/6 mice; yet its phenotype in-vivo is not manifested until between days 1 and 2 after intravenous infection. Even in the present study with a dose of Y. pestis that was more than a 1000-fold higher than used previously, there was a delay in appearance of the growth-related phenotype. These observations suggest that YopM's target may be a component of the host response that requires time to develop, and that until this response occurs, YopM does not have a major role at the level of transcription. YopM's potential early effects such as subtle downregulation of Tnfα in resident cells are not likely to be YopM's major function, due to redundancy to other Yops that downregulate NF-κ B and MAP kinase pathways as well as the activity of the Y. pestis anti-inflammatory modified lipid A.
The difficulty in establishing in-vitro models for dissecting YopM's major effects could in part arise from failure to replicate the inflammatory character of the environment and/or cells in which YopM functions. Perhaps that is why we obtained a greater YopM-related response in immortalized monocyte-like cells rather than BMMs, and why Rüter et al. (2010), by using LPS stimulation of immortalized HL60-derived MΦs and waiting 16 h, found downregulatory effects on cytokine genes as diverse as TNFα, IL18, IL12p35, and Il15. The transcriptional effects seen by Rüter et al. (2010) were relatively small, of the order of 2-fold or less. However, other stimulations of MO/MΦ-lineage cells might create target cells in which YopM shows a strong effect.
Infection of mice with YopM-producing Y. pestis caused a global effect in spleen that could protect the ΔyopM-1 strain in trans by preventing the stable accumulation of iDCs recruited through CCR2 (Ye et al., 2011). There was an initial influx of monocytes during the first 24 h in spleens of mice infected with YopM+ Y. pestis, but by day 2 p.i. these cells as well as NK cells were disappearing (Kerschen et al., 2004; Ye et al., 2011). This means that at days 2 and 4 p.i. when RNA levels were measured previously (Kerschen et al., 2004), the spleens infected with the two Y. pestis strains contained qualitatively different cell populations, and whether YopM caused the differences in transcription is not known. In contrast, in liver there was no YopM-associated recruitment effect, the YopM+ strain did not protect in trans, and PMN function was implicated as being targeted directly or indirectly by YopM (Ye et al., 2011). Nonetheless, the YopM-associated growth difference between parent and ΔyopM-1 strains occurs simultaneously in liver and in spleen. We hypothesize that YopM's molecular targets are the same in the two organs even though there are organ-specific cellular responses. YopM may have its primary role on activated cells or may drive a local MDSC response (Haverkamp, 2011), and transcriptional effects in these cells may be downregulated directly or indirectly.
Conflict of Interest Statement
The authors declare that the research was conducted in the absence of any commercial or financial relationships that could be construed as a potential conflict of interest.
Acknowledgments
This study was supported by funds from Public Health Services NIAID grant 5R01AI67869 to SCS, DAC, and AMK with a subcontract to Jenny P.-Y. Ting and W. June Brickey at UNC-CH. Flow cytometry was conducted by the University of Kentucky Flow Cytometry and Cell Sorting Core Facility, which is supported in part by the Office of the Vice President for Research, the Markey Cancer Center and a grant from the NIH Shared Instrument Program (S10 RR026827-01A1). Cynthia Long of the University of Kentucky Imaging Core Facility sectioned and stained the infected spleens illustrated in this paper. The R software through Bioconductor was employed to analyze hybridization signal intensities with the assistance of Drs. Haibo Zhou and Baiming Zhou (UNC-CH). This work was conducted without financial conflict of interest by any of the authors.
References
Akopyan, K., Edgren, T., Wang-Edgren, H., Rosqvist, R., Fahlgren, A., Wolf-Watz, H., et al. (2011). Translocation of surface-localized effectors in type III secretion. Proc. Natl. Acad. Sci. U.S.A. 108, 1639–1644.
Auffray, C., Sieweke, M. H., and Geissmann, F. (2009). Blood monocytes; development, heterogeneity, and relationship with dendritic cells. Annu. Rev. Immunol. 27, 669–692.
Becker, R. A., Chambers, J. M., and Wilks, A. R. (1988). The New S Language. New York, NY: Chapman and Hall.
Benabdillah, R., Mota, L. J., Lütelschwab, S., Demoinet, E., and Cornelis, G. R. (2004). Identification of a nuclear localization signal in YopM from Yersinia spp. Microb. Pathog. 36, 247–261.
Bergsbaken, T., and Cookson, B. T. (2007). Macrophage activation redirects yersinia-infected host cell death from apoptosis to caspase-1-dependent pyroptosis. PLoS Pathog. 3:e161. doi: 10.1371/journal.ppat.0030161
Brubaker, R. R. (1991). Factors promoting acute and chronic diseases caused by yersiniae. Clin. Microbiol. Rev. 4, 309–324.
Burnett, S. H., Kerschen, E. J., Zhang, J., Zeng, L., Straley, S. C., Kaplan, A. M., et al. (2004). Conditional macrophage ablation in transgenic mice expressing a Fas-based suicide gene. J. Leukoc. Biol. 75, 612–623.
Cebon, J., Layton, J. E., Maher, D., and Morstyn, G. (1994). Endogenous haemopoietic growth factors in peutropenia and infection. Br. J. Haematol. 86, 265–274.
Chamberlain, L. M., Godek, M. L., Gonzales-Juarrero, M., and Grainger, D. W. (2009). Phenotypic non-equivalence of murine (monocyte-) macrophage in biomaterial and inflammatory models. J. Biomed. Mater. Res. A 88A, 858–871.
Cleveland, W. S. (1979). Robust locally weighted regression and smoothing scatterplots. J. Am. Stat. Assoc. 74, 829–836.
Cole, A. M., Ganz, T., Liese, A. M., Burdick, M. D., Liu, L., and Strieter, R. M. (2001). Interferon-induced CXC chemokines display defensin-like anti-microbial activity. J. Immunol. 167, 623–627.
Comer, J. E., Sturdevant, D. E., Carmody, A. B., Virtaneva, K., Gardner, D., Long, D., et al. (2010). Transcriptomic and innate immune responses to Yersinia pestis in the lymph node during bubonic plague. Infect. Immun. 78, 5086–5098.
Conlan, J. W. (1997). Critical roles of neutrophils in host defense against experimental systemic infections of mice by Listeria monocytogenes, Salmonella typhimurium, and Yersinia enterocolitica. Infect. Immun. 2, 630–635.
Cowan, C., Philipovskiy, A. V., Wulff-Strobel, C. R., Ye, Z., and Straley, S. C. (2005). Anti-LcrV antibody inhibits delivery of Yops by Yersinia pestis KIM5 by directly promoting phagocytosis. Infect. Immun. 73, 6127–6137.
De Grado, M., Rosenberger, C. M., Gauthier, A., Vallance, B. A., and Finlay, B. B. (2001). Enteropathogenic Escherichia coli infection induces expression of the early growth response factor by activating mitogen-activated protein kinase cascades in epithelial cells. Infect. Immun. 69, 6217–6224.
Demeure, C. E., Blanchet, C., Fitting, C., Fayolle, C., Khun, H., Szatanik, M., et al. (2012). Early systemic bacterial dissemination and a rapid innate immune response characterize genetic resistance to plague of SEG mice. J. Infect. Dis. 205, 134–143.
Edgar, R., Domrachev, M., and Lash, A. E. (2002). Gene expression omnibus: NCBI gene expression and hybridization array data repository. Nucleic Acids Res. 30, 207–210.
Egan, C. E., Sukhumavasi, W., Bierly, A. L., and Denkers, E. Y. (2008). Understanding the multiple functions of Gr-1+ cell populations during microbial infection. Immunol. Res. 40, 35–48.
Espel, E., Garcia-Sanz, J., Aubert, V., Menoud, V., Sperisen, P., Fernandez, N., et al. (1996). Transcriptional and translational control of TNF-α gene expression in human monocytes by major histocompatibility complex II ligands. Eur. J. Immunol. 26, 2417–2424.
Evdokimov, A. G., Anderson, D. E., Routzahn, K. M., and Waugh, D. S. (2001). Unusual molecular architecture of the Yersinia pestis cytotoxin YopM: a leucine-rich repeat protein with the shortest repeating unit. J. Mol. Biol. 312, 807–821.
Forman, S., Wulff, C. R., Myers-Morales, T., Cowan, C., Perry, R. D., and Straley, S. C. (2008). yadBC of Yersinia pestis, a new virulence determinant for bubonic plague. Infect. Immun. 76, 578–587.
Frazer, L. C., O'Connell, C. M., Andrews, C. W. Jr., Zurenski, M. A., and Darville, T. (2011). Enhanced neutrophil longevity and recruitment contribute to the severity of oviduct pathology during Chlamydia muridarum infection. Infect. Immun. 79, 4029–4041.
Guha, M., O'Connell, M. A., Pawlinski, R., Hollis, A., McGovern, P., Yan, S.-F., et al. (2001). Lipopolysaccharide activation of the MEK-ERK1/2 pathway in human monocytic cells mediates tissue factor and tumor necrosis factor α expression by inducing Elk-1 phosphorylation and Egr-1 expression. Blood 98, 1429–1439.
Hamilton, J. A. (2008). Colony-stimulating factors in inflammation and autoimmunity. Nat. Rev. Immunol. 8, 533–544.
Haverkamp, J. M. (2011). In-vivo function of myeloid-derived suppressor cells is limited to the inflammatory site. Eur. J. Immunol. 41, 749–759.
Hentschke, M., Berneking, L., Campos, C. B., Buck, F., Ruckdeschel, K., and Aepfelbacher, M. (2010). Yersinia virulence factor YopM induces sustained RSK activation by interfering with dephosphorylation. PLoS ONE 5:e13165. doi: 10.1371/journal.pone.0013165
Hoffmann, E., Ashouri, J., Wolter, S., Doerrie, A., Dittrich-Brelholz, O., Schneider, H., et al. (2008). Transcriptional regulation of egr-1 by the interleukin-1-JNK-MKK7-c-Jun pathway. J. Biol. Chem. 283, 12120–12128.
Kelly-Scumpia, K. M., Scumpia, P. O., Delano, M. J., Weinstein, J. S., Cuenca, A. G., Wynn, J. L., et al. (2010). Type I signaling in hematopoietic cells is required for survival in mouse polymicrobial sepsis by regulating CXCL10. J. Exp. Med. 207, 319–326.
Kerschen, E. J., Cohen, D. A., Kaplan, A. M., and Straley, S. C. (2004). The plague virulence protein YopM targets the innate immune response by causing a global depletion of NK cells. Infect. Immun. 72, 4589–4602.
Kroczynska, B., Joshi, S., Eklund, E. A., Verma, A., Kotenko, S. V., Fish, E. N., et al. (2011). Regulatory effects of ribosomal S6 kinase 1 (RSK1) in IFNγ signaling. J. Biol. Chem. 286, 1147–1156.
Kung, J. T., Castillo, M., Kerbacher, K., and Thomas, C. A. 3rd. (1991). Subpopulations of CD8+ cytotoxic T cell precursors collaborate in the absence of conventional CD4+ helper T cells. J. Immunol. 146, 1783–1790.
Lilo, S., Zheng, Y., and Bliska, J. B. (2008). Caspase-1 activation in macrophages infected with Yersinia pestis KIM requires the type III secretion system effector YopJ. Infect. Immun. 76, 3911–3923.
Lukaszewski, R. A., Kenny, D. J., Taylor, R., Rees, D. G., Hartley, M. G., and Oyston, P. C. (2005). Pathogenesis of Yersinia pestis infection in BALB/c mice: effects on host macrophages and neutrophils. Infect. Immun. 73, 7142–7150.
Marketon, M. M., DePaolo, R. W., DeBord, K. L., Jabri, B., and Schneewind, O. (2005). Plague bacteria target immune cells during infection. Science 309, 1739–1741.
McCoy, M. W., Marre, M. L., Lesser, C. F., and Mecsas, J. (2010). The C-terminal tail of Yersinia YopM is critical for interacting with RSK1 and for virulence. Infect. Immun. 78, 2594–2598.
McDermott, J. E., Archuleta, M., Thrall, B. D., Adkins, J. N., and Waters, K. M. (2011). Controlling the response: predictive modeling of a highly central, pathogen-targeted core response module in macrophage activation. PLoS ONE 6:e14673. doi: 10.1371/journal.pone.0014673
McDonald, C., Vacratsis, P. O., Bliska, J. B., and Dixon, J. E. (2003). The yersinia virulence factor YopM forms a novel protein complex with two cellular kinases. J. Biol. Chem. 278, 18514–18523.
McPhee, J. B., Mena, P., and Bliska, J. B. (2010). Delineation of regions of the Yersinia pestis YopM protein required for interaction with the RSK1 and PRK2 host kinases and their requirement for interleukin-10 production and virulence. Infect. Immun. 78, 3529–3539.
Nemeth, J., and Straley, S. C. (1997). Effect of Yersinia pestis YopM on experimental plague. Infect. Immun. 65, 924–930.
Perry, R. D., and Fetherston, J. D. (1997). Yersinia pestis–etiologic agent of plague. Clin. Microbiol. Rev. 10, 35–66.
Philipovskiy, A. V., Cowan, C., Wulff-Strobel, C. R., Burnett, S. H., Kerschen, E. J., Cohen, D. A., et al. (2005). Antibody against V antigen prevents Yop-dependent growth of Yersinia pestis. Infect. Immun. 73, 1532–1542.
Poe, S. L., Arora, M., Oriss, T. B., Yarlagadda, M., Isse, K., Khare, A., et al. (2012). STAT1-regulated lung MDSC-like cells produce IL-10 and efferocytose apoptotic neutrophils with relevance in resolution of bacterial pneumonia. Mucosal Immunol. doi: 10.1038/mi.2012.62. [Epub ahead of print].
Raabe, T., Bukrinsky, M., and Currie, R. A. (1998). Relative contribution of transcription and translation to the induction of tumor necrosis factor-α by lipopolysaccharide. J. Biol. Chem. 273, 974–980.
Rebeil, R., Ernst, R. K., Gowen, B. B., Miller, S. I., and Hinnebusch, B. J. (2004). Variation in lipid A structure in the pathogenic yersiniae. Mol. Microbiol. 52, 1363–1373.
Reisner, B. S., and Straley, S. C. (1992). Yersinia pestis YopM: thrombin binding and overexpression. Infect. Immun. 60, 5242–5252.
Ribechini, E., Greifenberg, V., Sandwick, S., and Lutz, M. B. (2010). Subsets, expansion and activation of myeloid-derived suppressor cells. Med. Microbiol. Immunol. 199, 273–281.
Romeo, Y., Zhang, X., and Roux, P. P. (2012). Regulation and function of the RSK family of protein kinases. Biochem. J. 441, 553–569.
Rüter, C., Buss, C., Scharnert, J., Heusipp, G., and Schmidt, M. A. (2010). A newly identified bacterial cell-penetrating peptide that reduces the transcription of pro-inflammatory cytokines. J. Cell Sci. 123, 2190–2198.
Shi, L., Kishore, R., McMullen, M. R., and Nagy, L. E. (2002). Lopopolysaccharide stimulation of ERK1/2 increases TNF-α production via Egr-1. Am. J. Physiol. Cell Physiol. 282, C1205–C1211.
Skrzypek, E., Cowan, C., and Straley, S. C. (1998). Targeting of the Yersinia pestis YopM protein into HeLa cells and intracellular trafficking to the nucleus. Mol. Microbiol. 30, 1051–1065.
Skrzypek, E., Myers-Morales, T., Whiteheart, S. W., and Straley, S. C. (2003). Application of a Saccharomyces cerevisiae model to study requirements for trafficking of Yersinia pestis YopM in eucarotic cells. Infect. Immun. 71, 937–947.
Sodeinde, O. A., Sample, A. K., Brubaker, R. R., and Goguen, J. D. (1988). Plasminogen activator/coagulase gene of Yersinia pestis is responsible for the degradation of plasmid-encoded outer membrane proteins. Infect. Immun. 56, 2749–2752.
Sukhatme, V. P. (1990). Early transcriptional events in cell growth: the Egr family. J. Am. Soc. Nephrol. 1, 859–866.
Une, T., and Brubaker, R. R. (1984). In vivo comparison of avirulent Vwa- and Pgm- or Pstr phenotypes of yersiniae. Infect. Immun. 43, 895–900.
Viboud, G. E., and Bliska, J. B. (2011). Yersinia outer proteins: role in modulating host cell signaling responses and pathogenesis. Annu. Rev. Microbiol. 59, 69–89.
Wiley, M., Teygong, C., Phelps, E., Radke, J., and Blader, I. J. (2011). Serum response factor regulates immediate early host gene expression in Toxoplasma gondii-infected host cells. PLoS ONE 6:e18335. doi: 10.1371/journal.pone.0018335
Yan, S.-F., Fujita, T., Lu, J., Okada, K., Zou, Y. S., Mackman, N., et al. (2000). Egr-1. A master switch coordinating upregulation of divergent gene families underlying ischemic stress. Nat. Med. 6, 1355–1361.
Ye, Z., Kerschen, E. J., Cohen, D. A., Kaplan, A. M., van Rooijen, N., and Straley, S. C. (2009). Gr1+ cells control growth of YopM-negative Yersinia pestis during systemic plague. Infect. Immun. 77, 3791–3806.
Ye, Z., Uittenbogaard, A. M., Cohen, D. A., Kaplan, A. M., Ambati, J., and Straley, S. C. (2011). Distinct CCR2+ Gr1+ cells control growth of the Yersinia pestis ΔyopM mutant in liver and spleen during systemic plague. Infect. Immun. 79, 674–687.
Zeng, X., Moore, T. A., Newstead, M. W., Deng, J. C., Kunkel, S. L., Luster, A. D., et al. (2005). Interferon-inducible protein 10 but not monokine induced by gamma interferon, promotes protective type I immunity in murine Klebsiella pneumonia pneumonia. Infect. Immun. 73, 8226–8236.
Keywords: YopM, plague, Yersinia, chemokine, microarray
Citation: Uittenbogaard AM, Chelvarajan RL, Myers-Morales T, Gorman AA, Brickey WJ, Ye Z, Kaplan AM, Cohen DA, Ting JP-Y and Straley SC (2012) Toward a molecular pathogenic pathway for Yersinia pestis YopM. Front. Cell. Inf. Microbio. 2:155. doi: 10.3389/fcimb.2012.00155
Received: 14 September 2012; Accepted: 22 November 2012;
Published online: 11 December 2012.
Edited by:
Matthew Francis, Umeå University, SwedenCopyright © 2012 Uittenbogaard, Chelvarajan, Myers-Morales, Gorman, Brickey, Ye, Kaplan, Cohen, Ting and Straley. This is an open-access article distributed under the terms of the Creative Commons Attribution License, which permits use, distribution and reproduction in other forums, provided the original authors and source are credited and subject to any copyright notices concerning any third-party graphics etc.
*Correspondence: Susan C. Straley, Department of Microbiology, Immunology, and Molecular Genetics, University of Kentucky, Lexington, KY 40536-0298, USA. e-mail: scstra01@uky.edu