Helicobacter pylori CagA Protein Negatively Regulates Autophagy and Promotes Inflammatory Response via c-Met-PI3K/Akt-mTOR Signaling Pathway
 Na Li1,2,3† Bin Tang1,2,4† Yin-ping Jia1 Pan Zhu1 Yuan Zhuang2 Yao Fang1,2 Qian Li1 Kun Wang1,2 Wei-jun Zhang2
  Gang Guo2 Tong-jian Wang3 You-jun Feng5 Bin Qiao3*
  Xu-hu Mao1*
  Quan-ming Zou2*
- 1Department of Clinical Microbiology and Immunology, Southwest Hospital & College of Medical Laboratory Science, Third Military Medical University, Chongqing, China
- 2Department of Microbiology and Biochemical Pharmacy, National Engineering Research Center for Immunobiological Products, College of Pharmacy, Third Military Medical University, Chongqing, China
- 3Institute of Cardiovascular Disease, General Hospital of Jinan Military Region, Jinan, China
- 4Emei Sanatorium of PLA Rocket Force, Emeishan, China
- 5Department of Medical Microbiology and Parasitology, Zhejiang University School of Medicine, Hangzhou, China
Cytotoxin-associated-gene A (CagA) of Helicobacter pylori (H. pylori) is a virulence factor that plays critical roles in H. pylori-induced gastric inflammation. In the present study, gastric biopsies were used for genotyping cagA and vacA genes, determining the autophagic activity, and the severity of gastric inflammation response. It was revealed that autophagy in gastric mucosal tissues infected with cagA+ H. pylori strains was lower than the levels produced by cagA− H. pylori strains, accompanied with accumulation of SQSTM1 and decreased LAMP1 expression. In vitro, deletion mutant of cagA gene resulted in increased autophagic activity, and decreased expression of SQSTM1 and cytokines, whereas over-expression of CagA down-regulated the starvation-induced autophagy, and induced more production of the cytokines. Moreover, the production of the cytokines was increased by inhibition of autophagy, but decreased by enhancement of autophagy. Deletion of CagA decreased the ability to activate Akt kinase at Ser-473 site and increased autophagy. c-Met siRNA significantly affected CagA-mediated autophagy, and decreased the level of p-Akt, p-mTOR, and p-S6. Both c-Met siRNA and MK-2206 could reverse inflammatory response. H. pylori CagA protein negatively regulates autophagy and promotes the inflammation in H. pylori infection, which is regulated by c-Met-PI3K/Akt-mTOR signaling pathway activation.
Introduction
Helicobacter pylori (H. pylori) is a Gram-negative bacterium causing gastritis, peptic ulcer disease and gastric adenocarcinoma (Suerbaum and Michetti, 2002). Although H. pylori could induce strong inflammation, it is not able to clear the bacterium, resulting in persistent infection. Cytotoxin-associated gene A (CagA), one of H. pylori virulence factors, is an effector secreted by the type IV secretion system into gastric epithelial cells, and undergoes tyrosine phosphorylation, and activates a series of intracellular signal transduction reactions, resulting in severe tissue inflammation and damage (Gunn et al., 1998). Generally, H. pylori strains expressing CagA protein is more virulent, and leading to severe gastritis (Fischer et al., 2001). CagA is able to activate the transcription factor, NF-κB, and translocate it into the nucleus, where it up-regulates transcription of interlukin-8 (IL-8), a chemotactic and inflammatory cytokine (Brandt et al., 2005). However, the specific mechanism that CagA-positive strains induce inflammation remains unclear.
Macroautophagy (hereafter autophagy) has an important role in controlling intracellular environment. The damaged cell organelles, proteins, or invading microorganisms are sequestered into autophagosomes, and finally delivered into autolysosomes for degradation (Shintani and Klionsky, 2004). In the case of infection of pathogenic microorganism, the final consequence of the infection was decided by the evolving struggle between the host cells and invading microbes, and autophagy plays a critical role in the struggle. A number of important pathogens could be degraded by autolysosomes, such as, Listeria monocytogenes (Py et al., 2007), group A Streptococcus (Nakagawa et al., 2004), and Francisella tularensis (Cremer et al., 2009). However, some pathogenic bacteria also develop some mechanisms to subvert autophagy to survive in cells, eventually leading to the occurrence of various diseases, such as, Shigella (Kayath et al., 2010) and Mycobacterium tuberculosis (Shin et al., 2010).
It has been demonstrated that the induction of autophagosome formation or autophagy depends on the vacuolating cytotoxin (VacA), which is another virulent factor of H. pylori (Terebiznik et al., 2009). In turn, autophagy can eliminate intracellular H. pylori and may decrease the stability of intracellular VacA and ameliorate toxin-mediated cellular vacuolation (Terebiznik et al., 2009), despite the fact that autophagy is not sufficient to block vacuole biogenesis and pathogenesis (Zavros and Rogler, 2012). Recently, Tsugawa et al. showed that intracellular CagA is degraded by autophagy and short lived in AGS cells (Tsugawa et al., 2012), but whether or not autophagy regulated by CagA in H. pylori-induced gastric inflammation have never been explored.
Therefore, the purpose of this article was to determine the effect of CagA on autophagy of gastric epithelial cells and the production of autophagy-regulated proinflammatory cytokines in H. pylori infection.
Materials and Methods
Patients and Specimens
Consecutive patients who underwent upper endoscopy due to dyspeptic symptoms at Southwest Hospital, Chongqing, China during January 2013 and December 2014, were recruited. One hundred and six (49 women and 57 men with age of 43 ± 20 years) patients were eligible for enrollment into the H. pylori positive group if they had a positive [13C] urea breath test, a positive rapid urease test, and H. pylori culture. Eleven (six women and five men with age of 35 ± 20 years) with normal gastric mucosa were eligible for enrollment into the H. pylori negative group, and the clinical characteristics are shown in Supplementary Table 2. The study was approved by the Institutional Review Board at Third Military Medical University, and all patients signed informed consent before participation. All experiments were performed in accordance with relevant guidelines and regulations.
H. pylori was successfully isolated from 106 patients, and genotyping for cagA and vacA was performed for 106 isolates. All H. pylori strains carry the vacA gene. To exclude the effect of VacA, the toxigenic vacA genotype (vacAs1m1, 42 cases), expressing a functional VacA toxic, were excluded from the study. The rest of the cases include: normal control (11 cases), cagA−/vacAs1m2 (7 cases), cagA+/vacAs1m2 (57 cases). To ensure that approximately equal numbers of each group, 23 selective patients were chosen randomly for analyzing autophagy and inflammation, dividing into normal control (8 cases), cagA−/vacAs1m2 (7 cases), cagA+/vacAs1m2 (8 cases).
Evaluation of Inflammation Score for Gastric Biopsy Samples
The selected gastric biopsy samples among the genotype subgroups were obtained to perform H&E staining. The intensity of inflammation was evaluated independently by two pathologists according to previously established criteria. The degree of neutrophil infiltration, mononuclear cell infiltration, atrophy, and metaplasia was assessed according to the updated Sydney classification as follows: 0, absent; 1, minimal; 2, mild; 3, moderate; 4, marked. So the biopsies were from different stages of gastritis (Dixon et al., 1996).
Genotyping for cagA and vacA Genes
H. pylori infection status was detected by rapid urease test, bacterial culture, 13C-urea breath test, and histological examination (Vaira et al., 1999). In patients with positive culture, H. pylori isolates were subcultured for a maximum of five passages, and genomic DNA was extracted to genotype for the cagA and vacA genes, as previously described (Argent et al., 2008). The primers used for PCR amplification and nucleotide sequencing are listed in Supplementary Table 1.
Cell Line and H. pylori Strains
AGS (a human gastric cancer cell line) purchased from the cell bank of Chinese Academy of Sciences, were cultured in F12 cell culture medium (Gibco, Grand Island, NY, USA, #11765-054) supplemented with 10% FBS (Gibco, #10099-141) in a humidified incubator (5% CO2) at 37°C. The starvation condition was established by culturing the cells with serum-free medium for 4 h.
The wide-type cagA+/vacA+ H. pylori strain, NCTC11637 (Hp-WT, obtained from ATCC), cagA-knockout H. pylori with NCTC11637 background (Hp-ΔcagA, kindly provided by Dr. Sasakawa (Asahi et al., 2000; Suzuki et al., 2009) and H. pylori cagA-knockout complementation mutant (Hp-c-cagA, constructed by our group), were cultured on brain-heart infusion medium (10% rabbit blood) under microaerophilic conditions (5% O2, 10% CO2, and 85% N2) at 37°C. Hp-c-cagA mutant was obtained by amplifying the cDNA fragments of cagA gene from the gene of NCTC11637 by polymerase chain reaction (PCR), and the primers of PCR is following: forward: 5′-GCGCTCGAGATGACTAACGAACC-3′; reverse: 5′-GCGCTGCAGTTAAGATTTTTGG-3′. The product of PCR was digested with XhoI and PstI, and then ligating the cDNA fragments of cagA gene between cagA-upstream and -downstream sequences cloned on the pHel3 shuttle vector. The pHel3 shuttle vector with cagA gene was electroporated into Hp-ΔcagA cells carrying the kanamycin resistance. Hp-c-cagA clones were cultured in brain-heart infusion medium as previous described.
AGS cells transfected with plasmids and/or siRNAs were infected with Hp-WT, Hp-ΔcagA, or Hp-c-cagA, respectively, with different multiplicity of infection (MOI = 10, 50, 100, 200), for 6 h. Cells without infection served as controls.
Reagents and Antibodies
Rapamycin (Rapa, R8781), 3-methyladenine (3-MA, M9281), bafilomycin A1 (Baf-A1, B1793), antibodies against ATG12 (WH0009140M1), MAP1LC3B (L7543), and ATG5 (WH0009474M1) were purchased from Sigma-Aldrich (Shanghai, CHINA), and MK-2206 2HCL (S1078) purchased from Selleckchem (Houston, TX, USA). Antibodies against Akt (9272), mTOR (2972), AMPK (2532), phospho-Akt (Ser473) (4060), LAMP1 (9091), phospho-mTOR (Ser2448) (5536), phospho-S6 ribosomal protein (Ser235/236) (2211), ribosomal protein (2217), phospho-c-Met (Y1234/Y1235) (4033), and c-Met (4560) were obtained from Cell Signaling Technology (Beverly, MA, USA), whereas antibodies against β-actin (sc-10731), VacA (sc-25790), CagA (sc-17450), phospho-tyrosine (PY99) (sc-7020) and SQSTM1 (sc-28359), and siRNAs specific for SQSTM1 (human, sc-29679), ATG12 (human, sc-72578), c-Met (human, sc-29397), and ATG5 (human, sc-41445), along with a control siRNA (sc-44230) were obtained from Santa Cruz Biotechnology (CA, USA).
Immunohistochemistry for SQSTM1
Gastric biopsy sections from patients infected with different genotypes of H. pylori were stained using SQSTM1 antibody (Enzo Life Sciences, BML-PW9860-0025) by the DAB reagent technique. SQSTM1 staining was assessed by three pathologists with no prior knowledge of the different groups, and scored as 0 (no staining), 1 (< 10% of SQSTM1 staining), 2 (10–50% of SQSTM1 staining), or 3 (>50% of SQSTM1 staining).
Western Blotting, Quantitative RT-PCR, NF-κB Activity, and ELISA
The protein level of SQSTM1, LAMP1, phospho-mTOR (Ser2448), MAP1LC3B, ATG12, ATG5, AMPK, phospho-Akt (Ser473), Akt, mTOR, ribosomal protein, phospho-c-Met (Y1234/Y1235), c-Met, phospho-S6 ribosomal protein (Ser235/236), VacA, CagA, and phospho-tyrosine (PY99) were performed to determine by Western blotting in gastric tissues or AGS cells as described previously (Tang et al., 2015).
Trizol reagent (Invitrogen, 15596-026) was used to extract total RNA from gastric biopsy sections. qRT-PCR analysis of gastric biopsy sections from patients for the mRNA of SQSTM1, BECN1, IL-8, TNF-α, β-actin, and IL-1β were performed by using PrimeScript RT-PCR kits (Takara, Tokyo, Japan, DRR037), and run on a Bio-Rad IQ5 thermocycler (Bio-Rad Laboratories, Inc., Hercules, USA), β-actin as an internal control. The conditions for PCR were as follows: 1 cycle of 95°C for 30 s, 40 cycles of 95°C for 6 s, 60°C for 6 s, and 72°C for 31 s, and the primer sequences used are shown in Supplementary Table 1.
AGS cells were cotransfected with Renilla control vector (pRL-TK, Promega, #2241) and luciferase reporter vector pNF-κB-TA-Luc (Clontech, #631904) with lipofectamine 2000 (the ratio of 20:1) for 1 day, followed with H. pylori infection. The Dual-Luciferase Reporter Assay System (Promega, E1910) detected firefly luciferase activity and Renilla luciferase activity according to the manufacture's protocol.
The supernatant of AGS cells with different treatment were detected by DuoSet ELISA Development System (IL-8, IL-1β, and TNF-α; R&D, Minneapolis, USA) as our previous study (Tang et al., 2016).
Transfection of AGS With Plasmids and/or siRNAs
The GFP-MAP1LC3B plasmid and RFP-MAP1LC3B expression plasmid were kindly provided by Dr. Tamotsu Yoshimori (Department of Cell Biology, National Institute for Basic Biology, Presto, Japan) and Dr. Maria Colombo (Universidad Nacional de Cuyo, Mendoza, Argentina), respectively. The CagA expression plasmid, pEGFP-C1-CagA (GFP-CagA) (Asahi et al., 2000; Suzuki et al., 2009), was kindly provided by Dr. Chihiro Sasakawa. The cagA mutant plasmid, pEGFP-C1-CagA-Mut (GFP-CagA-Mut) was constructed by Life Technologies, Shanghai, China, and a series of CagA mutants with the Tyr residues of 899, 918, and 972 being substituted by Ala were generated from a plasmid-encoding fragment of cagA gene of H. pylori ATCC 26695 on pBluescript (Promega, Madison, USA) using a Gene Editor in vitro Site-Directed Mutagenesis System (Promega). These mutants were at the sites 2,695–2,697, 2,752–2,754, and 2,914–2,915 bp, respectively, started from the sequence ATG. Lipofectamine 2000 (Invitrogen, #11668019) was used to transfect plasmids and/or siRNAs into AGS cells. 3 × 10⁶ AGS cells were seeded into a 100-mm dish and incubated with transfection complexes containing 100 nM siRNA for 24 h.
Immunoprecipitation Assays
AGS cells were harvested in RIPA buffer on crushed ice, and centrifuged at 6,000 rpm for 5 min, and commercial Lowry Assay (Bio-Rad DC) detected the concentration of protein. Five milligrams per milliliter of protein and 1 μg/μL anti-CagA (sc-17450, Santa Cruz Biotechnology) was incubated overnight at 4°C, then added 50 μL 50% protein A/G-sepharose bead suspension for 2 h, and washed three times with pre-cold RIPA buffer, and added 50 μL protein sample buffer to collect in each tube, and proteins detected by western blotting analysis.
Puncta Formation Assays
AGS cells were transfected with GFP-MAP1LC3B or RFP-MAP1LC3B plasmid for 24 h, following H. pylori infection for another 24 h. Radiance 2000 laser scanning confocal microscope detected the images of the cells, and image analysis with LaserSharp 2000 software (Bio-Rad, San Francisco, CA) as our previous study (Tang et al., 2016). According to methods for monitoring GFP-LC3 and mRFP-GFP-LC3 puncta formation assays (Klionsky et al., 2007; Mizushima et al., 2010), the average number of MAP1LC3B puncta per cell in GFP-MAP1LC3B or RFP-MAP1LC3B-positive cells (200 cells per sample) was determined (Pattingre et al., 2005).
Cell Viability
AGS cell viability was assessed using an MTT assay (Sigma) according to the manufacturer's instructions. Five milligrams per liter of MTT was added to each wells of AGS cells for 1–2 h, and dissolved in MTT solubilization solution. The absorbance at 590 nm (A590) was determined for each well using a microplate reader (Bio-Rad). After subtracting the background absorbance, the A590 value of the treated cells was divided by that of the untreated cells to determine the percentage of viable cells.
MDC and AO Staining Assays
Monodansylcadaverine (MDC) and acridine orange (AO) staining was used to quantify the number of autolysosomes in AGS cells. Following treatment with H. pylori or transfection with plasmids/siRNAs, cells were stained with 10 mM MDC (sigma, 30432) and 1 mg/mL AO solution (sigma, A8097) at 37°C for 10 min, and fixed in 3% paraformaldehyde in PBS for 30 min. Photographs were obtained with a Radiance 2000 laser scanning confocal microscope (MDC, excitation wave length about 380 nm and emission filter 525 nm; AO, emission peak at 650 nm). The cells were then trypsinised and quantified by flow cytometry using a FACScan cytometer and CellQuest software (BD, New Jersey, USA). The percentage of cells with characteristic MDC or AO staining over the total cells was assessed.
Transmission Electron Microscopy
AGS cells or gastric biopsy sections were collected and fixed in 2% paraformaldehyde, 0.1% glutaraldehyde and 0.1 M sodium cacodylate buffer (pH 7.4) for 2 h, then post-fixed in 1% OsO4, 0.5% potassium ferricyanide in cacodylate buffer for 1.5 h, then dehydrated with graded alcohol, and embedded in straight resin. Ultrathin sections were counterstained with 0.3% lead citrate and detected by Philips EM420 electron microscope. The method of counting autophagosomes' numbers was followed as described previously by Yla-Anttila et al. (2009). Data obtained by scoring for the presence of autophagic vacuoles (autophagosomes, autolysosomes) profiles per cell profile on the sections, and a total of 35 cells were recorded for triplicate samples per condition per experiment.
Statistical Analyses
The Student t-test was used to analyze between two groups, and one-way analysis of variance (ANOVA) was used to analyze among multiple group data, and expressed as mean ± standard error (SEM). GraphPad Prism software (GraphPad, San Diego, CA) was used for all statistical analyses. For all inferential statistics a P < 0.05 was considered significant.
Results
Autophagy Is Down-Regulated in Human Gastric Mucosa With CagA Positive H. pylori
The clinical characteristics of 117 patients with (106) and those without (11) H. pylori infection are shown in Supplementary Table 2. H. pylori was successfully isolated from 106 patients, and genotyping for cagA and vacA. All H. pylori strains carry the vacA gene. To exclude the effect of VacA, the toxigenic vacA genotype (vacAs1m1), expressing a functional VacA toxic, were excluded from the study. In order to ensure that approximately equal numbers of each group, three equal groups were created for analyzing via random sampling methods, including normal control (8 cases), cagA−/vacAs1m2 (7 cases), cagA+/vacAs1m2 (8 cases).
To verify the effect of CagA in severe tissue inflammation, we evaluated the level of inflammation in gastric mucosa. Firstly, the degree of gastric inflammation was higher in patients infected with cagA+/vacAs1m2 strains than in those infected with cagA−/vacAs1m2 strains (Figure 1A). Notably, the mRNA levels of IL-8, TNF-α, and IL-1β in the gastric epithelial cells were significantly higher in patients infected with cagA+/vacAs1m2 strains than in patients without H. pylori infection or those infected with cag−/vacAs1m2 strains (Figure 1B).
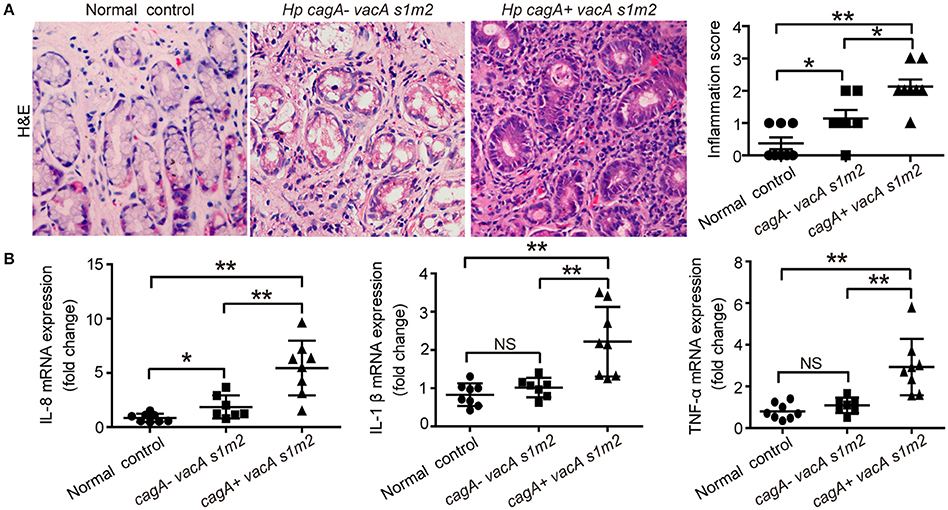
Figure 1. The inflammatory response on gastric biopsies from patients infected with cagA−/vacAs1m2 or cagA+/vacAs1m2 strains of H. pylori. (A) Histological scores of inflammation (H&E staining) in the gastric mucosa of patients without H. pylori infection and those infected with cagA−/vacAs1m2 or cagA+/vacAs1m2 strains of H. pylori. The intensity of staining is shown in the right graph and the data are expressed as mean±SEM. (B) mRNA expression of proinflammatory cytokines in gastric mucosa of patients without H. pylori (n = 8), patients infected with cagA−/vacAs1m2 (n = 7), and those infected with cagA+/vacAs1m2 (n = 8). All real-time PCR data are normalized to β-actin and expressed as fold change. Experiments performed in triplicate showed consistent results. *P < 0.05, or **P < 0.01.
Furthermore, we evaluate the autophagic activity in gastric mucosal tissues from patients infected with different genotypes H. pylori. The SQSTM1/p62 (sequestosome1) protein serves as a link between LC3 and ubiquitinated substrates (Wang et al., 2010). Dysfunctional autophagy could result in an accumulation of SQSTM1, which has been involved in promoting inflammation (Raju et al., 2012). Therefore, we detected the levels of SQSTM1 in human gastric biopsies. As shown in Figure 2A, accumulation of SQSTM1 in the gastric biospy with H. pylori infection was significantly higher than those uninfected normal control, and the accumulation of SQSTM1 was significantly higher in the gastric epithelium cells in patients infected with cagA+/vacAs1m2 strains than in those infected with cagA−/vacAs1m2 strains (P < 0.001) as determined by immunohistochemistry. Moreover, in patients infected with cagA−/vacAs1m2 strains, the ratio of microtubule-associated protein 1 light chain 3 beta-II (MAP1LC3B-II) to β-actin and the lysosomal-associated membrane protein 1 (LAMP1, the late endosomal lysosomal marker) protein levels was higher than that in patients infected with cagA+/vacAs1m2 strains, and the SQSTM1 protein levels increased in patients infected with CagA-positive H. pylori (Figure 2B). In addition, infection of cagA+/vacAs1m2 strains was significantly associated with increased levels of mRNA expression of SQSTM1 (Supplementary Figure 1A), but not of BECN1 (Supplementary Figure 1B). Furthermore, it was also revealed an increase in the number of autophagosomes in patients infected with cagA−/vacAs1m2 strains compared with that in cagA+/vacAs1m2 group in TEM analysis (Figure 2C). Both cagA+/vacAs1m2 and cagA−/vacAs1m2 groups displayed high autophagy activity than the normal control group. These findings indicate that H. pylori infection could induce inflammation response and autophagy activity in the gastric epithelium cells in vivo, but CagA-positive H. pylori are associated with more severe inflammation, and down-regulates autophagic response in vivo.
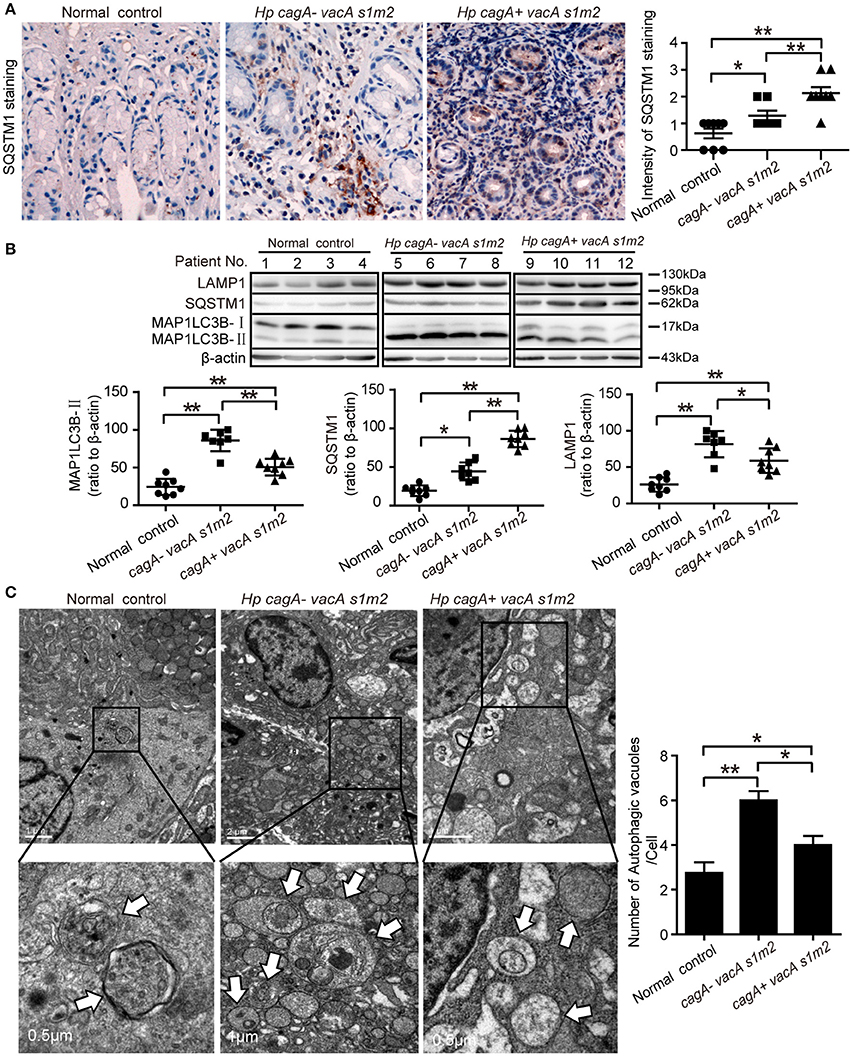
Figure 2. Autophagy is down-regulated in human gastric mucosa of patients infected with CagA positive H. pylori strains. (A) Immunohistochemistry showing SQSTM1 expression in the gastric mucosa of patients without H. pylori infection and those infected with cagA−/vacAs1m2 or cagA+/vacAs1m2 strains of H. pylori. The intensity of staining is shown in the right graph and the data are expressed as mean ± SEM. (B) Western blot assay showing the protein levels of MAP1LC3B-II, SQSTM1 and LAMP1 in the gastric mucosa of patients of normal control (patients 1–4), cagA−/vacAs1m2(patients 5–8), and cagA+/vacAs1m2 (patients 9–12) with the rates to β-actin being illustrated in the graphs in which the data are expressed as mean ± SEM. (C) Transmission electron microscopy showing autophagosomes in gastric biopsy sections of patients without H. pylori infection and those infected with cagA−/vacAs1m2 or cagA+/vacAs1m2 strains of H. pylori. Normal controls are patients without H. pylori infection. The white arrows indicate the autophagosomes. The numbers of autophagic vacuoles per cell in each TEM section (n = 35 cells) are shown in the right graph and the data are expressed as mean ± SEM. Experiments performed in triplicate showed consistent results. *P < 0.05, or **P < 0.01.
CagA Could Inhibit the Generation of Autophagosomes in AGS Cells
To further validate the role of CagA in autophagy regulation, we next infected AGS cells with the H. pylori wide-type (Hp-WT), H. pylori cagA-knockout mutant (Hp-ΔcagA) or H. pylori cagA-knockout complementation (Hp-c-cagA) (MOI = 100:1), which strains the expression of VacA is similar during infection (Supplementary Figure 2A), and evaluated the kinetics of autophagosome formation by a GFP-MAP1LC3B puncta formation assay. Formation of MAP1LC3B puncta, peaked at 12 h and decreased at 24 h (Figure 3A and Supplementary Figure 2B). And compared with cells infected with Hp-WT or Hp-c-cagA, there was a significantly increased percentage of cells with formation of MAP1LC3B puncta for cells infected with Hp-ΔcagA (Figure 3A). TEM revealed an increase in the number of autophagic vacuoles (autophagosomes and autolysosomes) in AGS cells infected with Hp-ΔcagA-infected cells, compared with cells infected with Hp-WT or Hp-c-cagA (Figure 3B). Similar results were obtained in MDC (Figure 3C and Supplementary Figure 2D) and AO (Figure 3D and Supplementary Figure 2D) staining. Additionally, Hp-ΔcagA induced MAP1LC3B-II formation, and decreased SQSTM1 protein expression at a higher level, compared with Hp-WT or Hp-c-cagA, at 6, 12, and 24 h (Figure 3E and Supplementary Figure 2C). Furthermore, inhibition of autophagy by Baf-A1 challenge resulted in further accumulation of both MAP1LC3B-II and SQSTM1 in AGS cells after 6 h of Hp-WT or Hp-ΔcagA infection (Figure 3F), suggesting that H. pylori CagA did not inhibit the fusion of autophagosomes with lysosomes. Furthermore, under Hp-WT or Hp-ΔcagA infection, the levels of MAP1LC3B-II in AGS cells transfected with the CagA expression plasmid (GFP-CagA) were decreased in comparison to that in transfected-control cells (Figure 3G), suggesting that over-expression of CagA lead to further reduction of autophagic flux. Collectively, these data suggest that H. pylori CagA may inhibit the generation of autophagosomes in AGS cells.
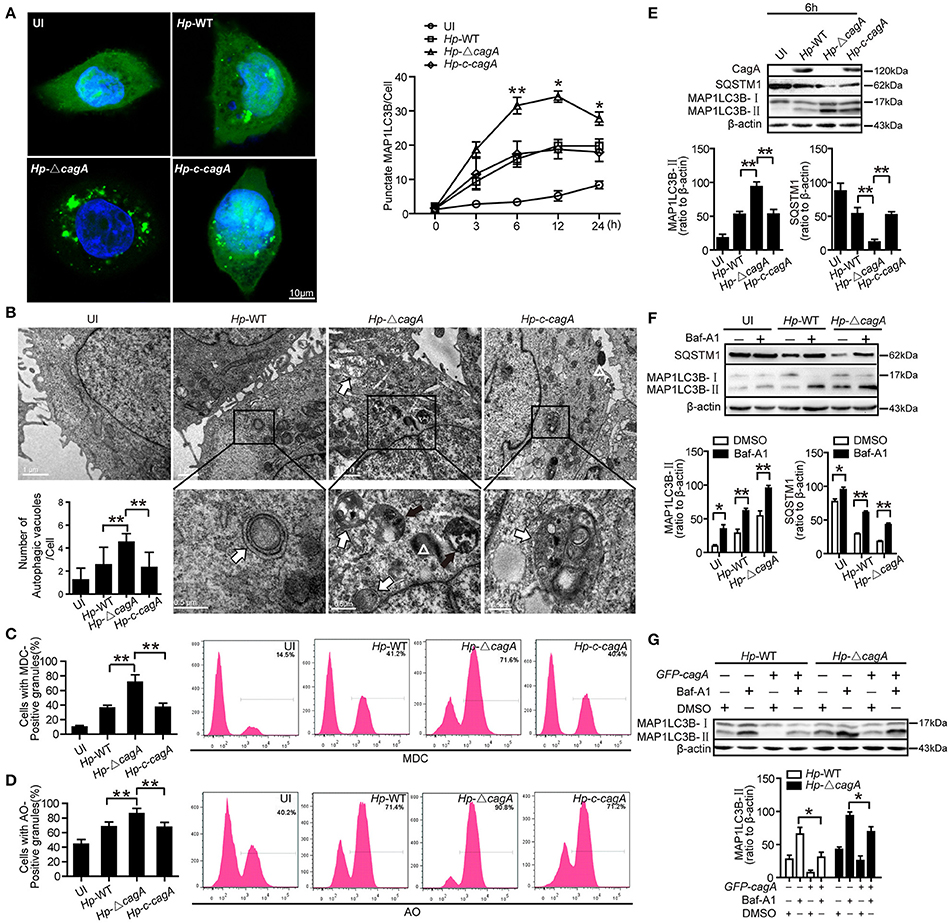
Figure 3. CagA could inhibit the generation of autophagosomes in AGS cells. (A) Confocal microscopy showing AGS cells transfected with GFP-MAP1LC3B without H. pylori infection (UI), and transfected AGS cells with the wild type H. pylori (Hp-WT), the cagA-knockout H. pylori (Hp-ΔcagA) or the cagA-knockout complementation mutant H. pylori (Hp-c-cagA) (MOI = 100:1) infection for 6 h (left) and the indicated periods of time (right). Scale bars: 10 μm. The number of GFP-MAP1LC3B puncta in each cell (n ≥ 200 cells) was counted. (B) Representative transmission electron microscopy showing AGS cells without H. pylori infection and those infected with Hp-WT, Hp-ΔcagA, or Hp-c-cagA (MOI = 100:1) for 6 h. The white arrows indicate autophagosomes, and the black arrows indicate autolysosomes, and the white triangle indicate H. pylori. The numbers of autophagic vacuoles per cell in each TEM section (n = 35 cells) are shown in the lower left graph and the data are expressed as mean ± SEM. (C,D) Flow cytometry showing MDC and AO staining of AGS cells 6 h after infection with Hp-WT, Hp-ΔcagA, or Hp-c-cagA (MOI = 100:1). (E) Western blotting showing the protein levels of CagA, SQSTM1, and MAP1LC3B-II with the rates of SQSTM1 and MAP1LC3B-II to β-actin in AGS cells infected with Hp-WT, Hp-ΔcagA, or Hp-c-cagA (MOI = 100:1) for 6 h. (F) Measurement of MAP1LC3B-II conversion and SQSTM1 in AGS cells infected with Hp-WT or Hp-ΔcagA (MOI = 100:1) for 6 h in the presence of Baf-A1 (10 nM). (G) AGS cells were transfected with GFP-CagA, and then infected with Hp-WT or Hp-ΔcagA (MOI = 100:1) for 6 h in the presence of Baf-A1 (10 nM). Results shown are representative of three independent experiments. *P < 0.05, **P < 0.01.
CagA Down-Regulates Starvation-Induced Autophagy in AGS Cells
In order to eliminate the influence of H. pylori itself on autophagy, starvation-triggered autophagy was performed in AGS cells after transfecting the CagA expression plasmid (GFP-CagA) or tyrosine phosphorylation point mutant of CagA plasmid (GFP-CagA-Mut). At least 50% transfection efficiency was achieved for transfection of GFP-CagA and GFP-CagA-Mut in AGS (Supplementary Figure 3A). Although cell viability was influenced by starvation to a certain extent during the first 4 h, it appears not to be significantly influenced afterwards (Supplementary Figure 3B). During nutrient starvation, in the AGS cells transfected with GFP-CagA or GFP-CagA-Mut, there was a significant decrease in the number of autophagosomes as determined by TEM, compared with cells transfected with control plasmid (P < 0.05, Figure 4A). The ratio of MAP1LC3B-II to β-actin was also significantly decreased in cells transfected with GFP-CagA or GFP-CagA-Mut following starvation treatment (P < 0.05, Figure 4B). Similarly, SQSTM1 expression was increased in cells transfected with GFP-CagA or GFP-CagA-Mut following starvation treatment (P < 0.05, Figure 4B). Interestingly, we observed that transfection with GFP-CagA or GFP-CagA-Mut had no effect on the expression of the AMP activated protein kinase (AMPK, an energy sensor; Figure 4B), indicating that CagA suppressed starvation-induced autophagy may not via the AMPK signal pathway. Furthermore, as shown in Figure 4C, the number of RFP-MAP1LC3B puncta in AGS cells co-transfected with RFP-MAP1LC3B and GFP-CagA was decreased after starvation treatment (P < 0.05). Taken together, these results suggest that CagA suppressed starvation-induced autophagy, which may not be dependent on tyrosine phosphorylation of CagA.
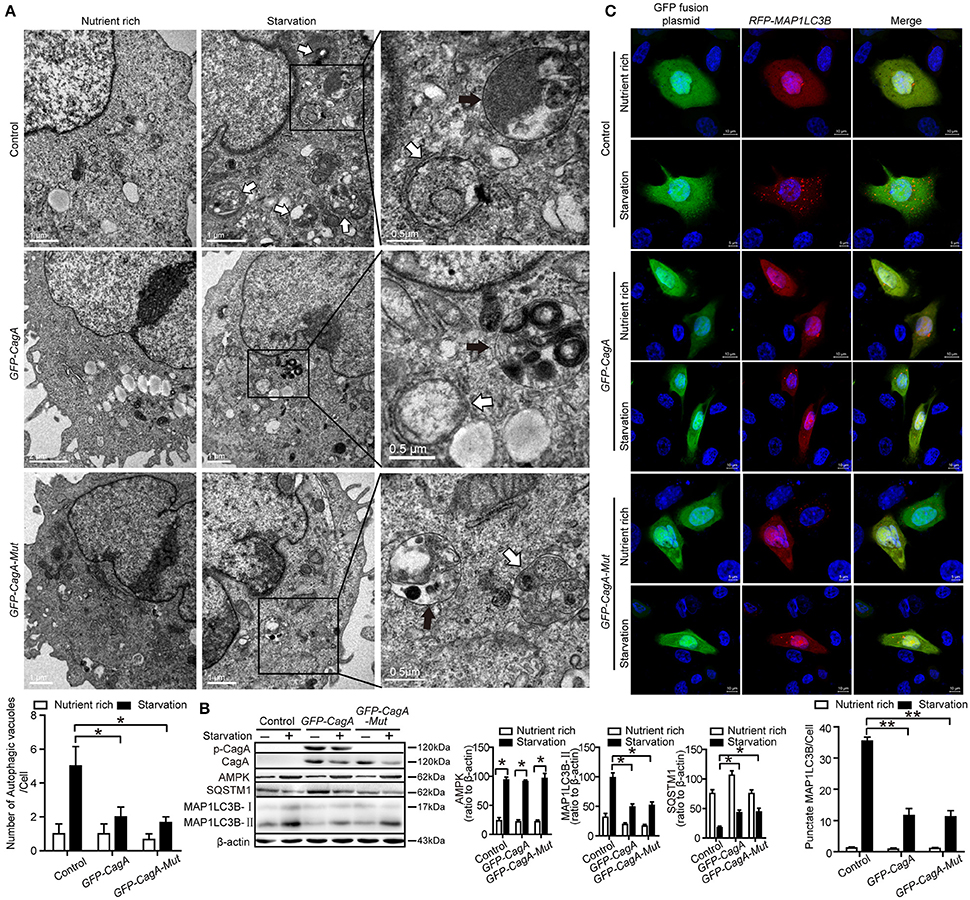
Figure 4. CagA down-regulates starvation-induced autophagy in AGS cells. (A) Transmission electron microscopy showing autophagic vacuoles in AGS cells transfected with GFP-CagA, GFP-CagA-Mut, or a control (pEGFP-C1) plasmid before pretreatment of normal media or subjected to 4 h starvation. The white arrows indicate autophagosomes, and the black arrows indicate autolysosomes. The numbers of autophagic vacuoles per cell in each TEM section (n = 35 cells) are shown in the lower graph and the data are expressed as mean ± SEM. (B) Western blot assay showing MAP1LC3B-II conversion and expression of p-CagA, CagA, AMPK, and SQSTM1 in AGS cells transfected with GFP-CagA, GFP-CagA-Mut, or a control (pEGFP-C1) plasmid in the nutrient rich medium or 4 h starvation. (C) Confocal microscopy showing AGS cells co-transfected with RFP-MAP1LC3B and GFP-CagA, GFP-CagA-Mut, or a control (pEGFP-C1) plasmid in the nutrient rich medium or 4 h starvation. Scale bars: 5 or 10 μm. The number of RFP-MAP1LC3B puncta in each cell (n ≥ 200 cells) was counted. Experiments were performed in triplicate, and all replicates showed similar results. *P < 0.05, **P < 0.01.
Autophagy Inhibition Increases Cytokines Production
To clarify the role of CagA in the inflammation, the expression of proinflammatory cytokines (IL-8, TNF-α, and IL-1β), which are involved in gastritis during H. pylori infection (Nakachi et al., 2000), was examined by ELISA assay. These cytokines were significantly higher in AGS cells infected with Hp-WT or Hp-c-cagA than in those infected with Hp-ΔcagA at different time points (Figure 5A). Moreover, These cytokines in AGS cells infected with Hp-WT and Hp-ΔcagA was increased following the increase of the bacterial load. AGS cells infected with Hp-WT produced greater amounts of the cytokines than cells infected with Hp-ΔcagA (Figure 5B).
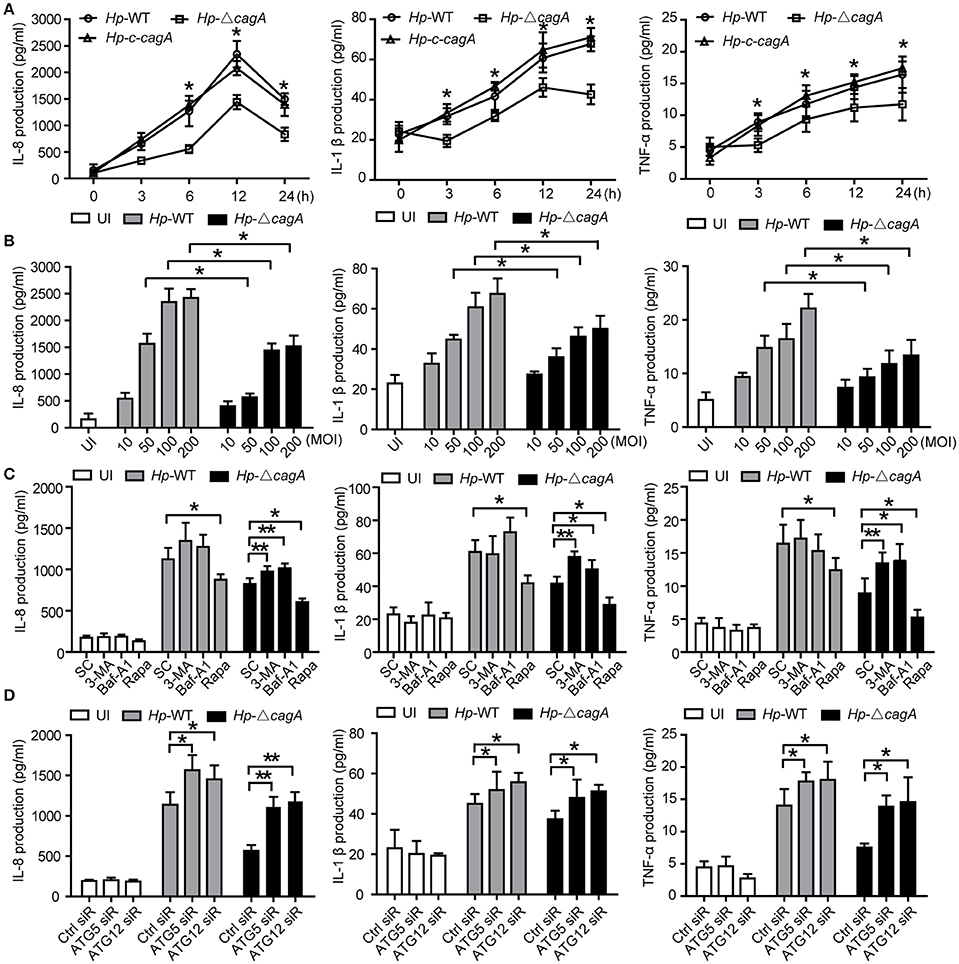
Figure 5. Inhibition of autophagy enhances cytokines production induced by the cagA-knockout H. pylori. (A,B) Production of IL-8, IL-1β and TNF-α in AGS cells infected Hp-WT, Hp-ΔcagA or Hp-c-cagA at MOI of 100 for the indicated periods of time (A) or at different MOIs (10, 50, 100, and 200) for 12 h (B), as assessed by enzyme-linked immunosorbent assay (ELISA). (C) After pretreatment of SC (solvent control, 0.1% DMSO), 3-MA (2 mM), Baf-A1 (10 nM) or Rapa (100 nM), AGS cells were infected with Hp-WT or Hp-ΔcagA (MOI = 100:1) for 6 h. Supernatants were assessed by ELISA for levels of IL-8, IL-1β, and TNF-α. (D) Production of IL-8, IL-1β, and TNF-α in AGS cells transfected with siRNA specific for ATG5 or ATG12 (50 nM) for 24 h and infected with Hp-WT or Hp-ΔcagA (MOI = 100) for 6 h, as assessed by ELISA. Data are presented as the mean ± SEM of three experiments. *P < 0.05, **P < 0.01.
We also examined the production of the cytokines with the autophagy enhancer (Rapa, Rapamycin) or inhibitors (3-MA or Baf-A1) treatment during Hp-WT and Hp-ΔcagA infection. The effects of two autophagy inhibitors, and one enhancer, are shown in Supplementary Figures 4A–C. Autophagy inhibitors significantly increased the cytokines and activated NF-κB, and enhancer Rapa decreased the ones in AGS cells infected Hp-ΔcagA infection (Figure 5C and Supplementary Figure 4E). After 24 h infection, the three proinflammatory cytokines were increased with the inhibitors in cells infected with Hp-WT and Hp-ΔcagA (Supplementary Figure 4F). Moreover, the production of proinflammatory cytokines and activity of NF-κB were significantly increased in AGS cells transfected with siRNAs for ATG5 or ATG12 upon H. pylori infection (Figure 5D and Supplementary Figure 4G). These data suggested that autophagy plays a critical role in the inflammation induced by H. pylori.
c-Met Is an Important Adaptor in CagA-mediated Autophagy Pathway
The previous study reported that CagA has been known to activate c-Met and the PI3K/AKT pathway (Churin et al., 2003). However, it is not clear whether c-Met could regulate autophagy. The wild type H. pylori infection activated c-Met in AGS cells (Figure 6A). CagA was coimmunoprecipitated with c-Met in AGS cells infection with Hp-WT (Figure 6B). This result was consistent with previous study (Oliveira et al., 2009). The effects of c-Met depletion through siRNA interference are shown in Supplementary Figure 4D. The number of GFP-MAP1LC3B puncta in c-Met siRNA group was higher than that of control group upon infection with the Hp-WT (P < 0.05, Figure 6C). It was a significant increase in the ratio of MAP1LC3B-II to β-actin in c-Met siRNA group than in the control siRNA upon infection with the Hp-WT (P < 0.05, Figure 6D). Furthermore, MDC and AO staining showed that c-Met siRNA group induced the formation of autophagolysosomes in AGS cells at a significantly higher level, compared with control siRNA group in AGS cells infected with Hp-WT (P = 0.008 and 0.018, respectively, Figures 6E,F and Supplementary Figure 5A). Moreover, in CagA-expressing AGS cells, the ratio of MAP1LC3B-II to β-actin significantly increased by c-Met siRNA regardless of infection status (Figure 6G). These results demonstrate that c-Met may be an important adaptor in CagA-mediated autophagy pathway.
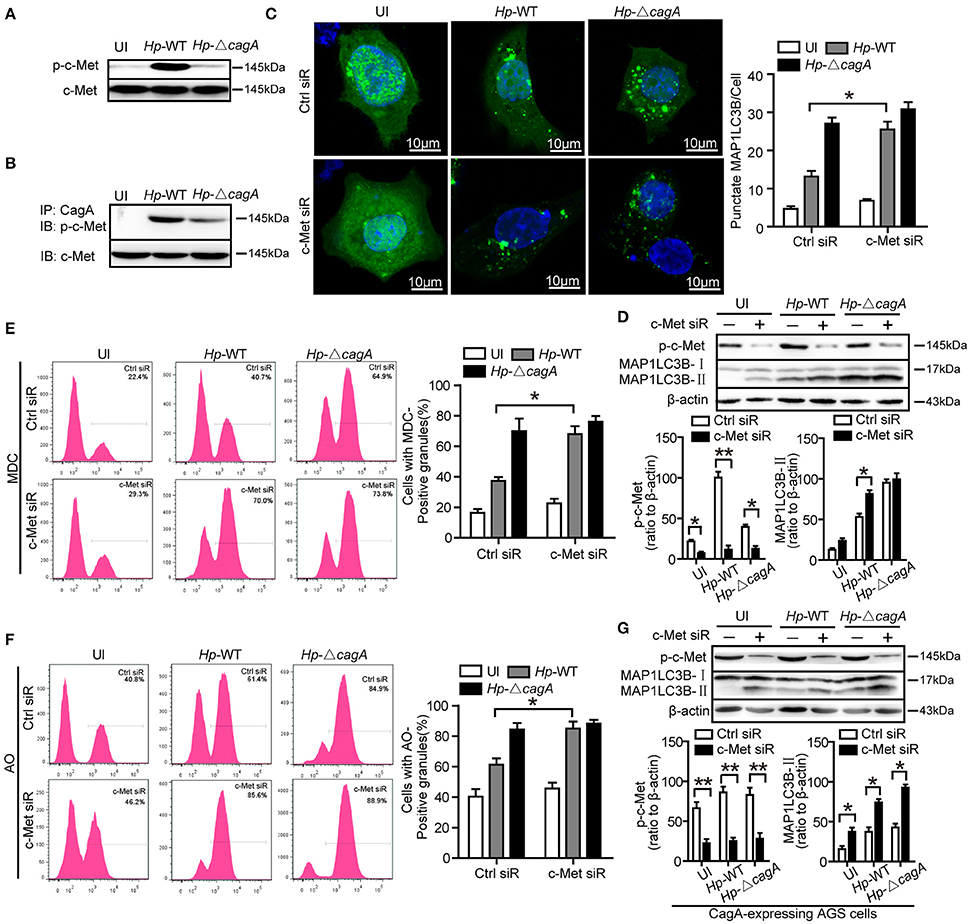
Figure 6. c-Met is an important adaptor in CagA-mediated autophagy pathway. (A,B) AGS cells were infected with Hp-WT or Hp-ΔcagA, and p-c-Met and c-Met were detected by western blot. CagA was immunoprecipitated from lysates. Immunoprecipitates (IP) were subjected to SDS-PAGE and immunoblot (IB) analysis with anti-p-c-Met (top) or anti–c-Met (bottom) antibodies. (C) Confocal microscopy showing AGS cells co-transfected with GFP-MAP1LC3B plasmid and c-Met siRNAs or control siRNA for 24 h, and then infected with Hp-WT or Hp-ΔcagA for 6 h. The percentages of cells with MAP1LC3B punctas are shown in the right graph with data being expressed as means ± SEM of three experiments (n ≥ 200 cells). (D) Western blot analysis of p-c-Met, MAP1LC3B-II conversion and β-actin in AGS cells transfected with c-Met siRNA or control siRNA and infected with Hp-WT or Hp-ΔcagA for 6 h. p-c-Met and MAP1LC3B-II band intensity was normalized to β-actin. (E,F) Flow cytometry showing MDC (upper panel) and AO (lower panel) staining of AGS cells transfected with c-Met siRNA or control siRNA and then infected with Hp-WT or Hp-ΔcagA for 6 h. (G) Western blot analysis of p-c-Met, MAP1LC3B-II conversion and β-actin in CagA-expressing AGS cells (AGS cells after transfecting the CagA expression plasmid, GFP-CagA) after transfected with c-Met siRNA or control siRNA and infected with H. pylori as described above. Experiments performed in triplicate showed consistent results. *P < 0.05, **P < 0.01.
CagA Regulates Autophagy through c-Met/Akt Signaling Pathway
Given that c-Met could activate PI3K/AKT/mTOR pathway (Lim and Walikonis, 2008; Tang et al., 2015), we hypothesized that PI3K/AKT/mTOR pathway might play an important role in the process of CagA-mediated autophagy. We analyzed the activation status of the key members of autophagy-related PI3K/Akt/mTOR pathways. As shown in Figure 7A, Hp-WT activated Akt kinase at Ser-473 site at a significantly higher level than did Hp-ΔcagA (P = 0.018), which was consistent with a previous report (Tabassam et al., 2009). Both Hp-WT and Hp-ΔcagA increased MAP1LC3B-II expression, but Hp-ΔcagA did at a significantly higher level than did Hp-WT (Figure 7A). There was a significant increase in the levels of phosphorylated mTOR (p-mTOR) and phosphorylated S6 ribosomal protein (p-S6) upon Hp-WT vs. Hp-ΔcagA (Figure 7A). Tyrosine phosphorylation of CagA did not affect the expression levels of proteins related to PI3K/Akt/mTOR pathway and autophagy in AGS cells (Figure 7B), whereas c-Met siRNA significantly decreased the level of p-Akt, p-mTOR, and p-S6, and increased MAP1LC3B-II levels (Figure 7C). Moreover, treatment of MK-2206, a specific inhibitor of Akt, abrogated Akt activation, and reversed the ratio of MAP1LC3B-II/β-action, and decreased the level of p-Akt, p-mTOR, and p-S6 (Figure 7D). Then, to investigate whether c-Met siRNA or MK-2206 reverse inflammatory response during H. pylori infection, we detected the expression of inflammatory cytokines. As shown in Figure 7E, there was a significant decrease in the production of proinflammatory cytokines in cells transfected with siRNA specific for c-Met upon infection. Similarly, the expression of inflammatory cytokines significantly decreased in AGS cells treated with MK2206 during infection (Figure 7F). Together, we concluded that the CagA-mediated autophagy pathway may be dependent on the c-Met/Akt signaling pathway, which could regulate the expression of inflammatory cytokines.
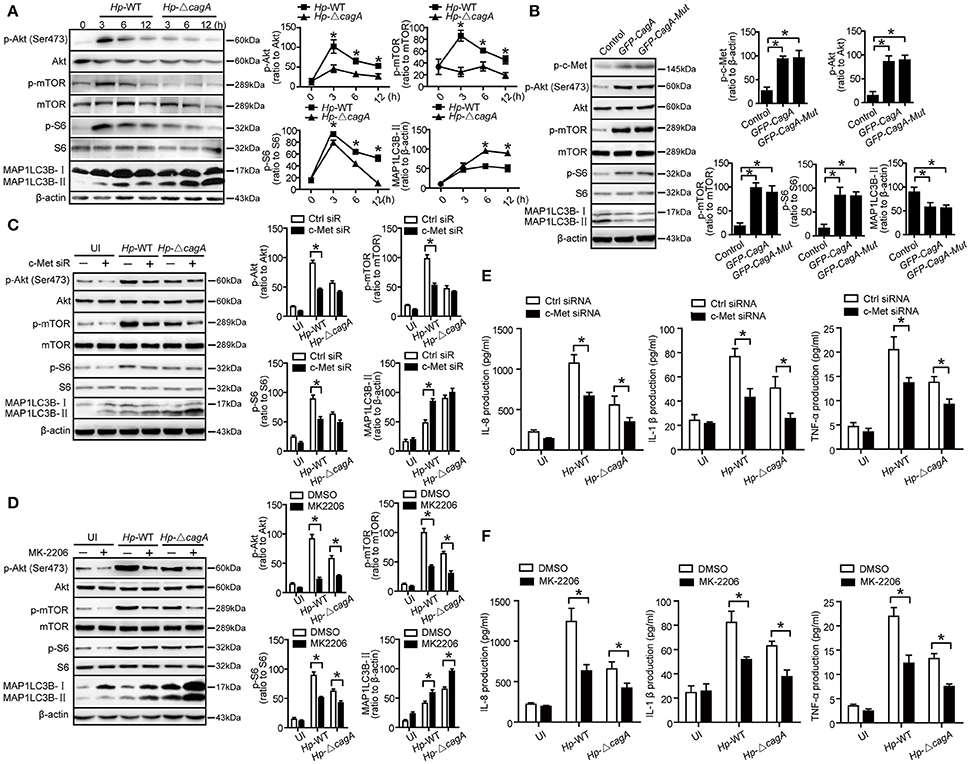
Figure 7. CagA regulates autophagy through PI3K/AKT/mTOR pathway. (A) Expression of p-Akt(Ser473), Akt, p-mTOR, mTOR, p-S6, S6, MAP1LC3B-I, and MAP1LC3B-II in AGS cells infected with Hp-WT or Hp-ΔcagA(MOI = 100) at different time points. (B) Expression of p-Akt(Ser473), Akt, p-mTOR, mTOR, p-S6, S6, MAP1LC3B-I, and MAP1LC3B-II in AGS cells transfected with GFP-CagA, GFP-CagA-Mut or control plasmid. (C) Expression of p-Akt(Ser473), Akt, p-mTOR, mTOR, p-S6, S6, MAP1LC3B-I, and MAP1LC3B-II in AGS cells transfected c-Met siRNA or control siRNA (50 nM) for 24 h and then infected with Hp-WT or Hp-ΔcagA (MOI = 100) for 6 h. (D) Expression of p-Akt(Ser473), Akt, p-mTOR, mTOR, p-S6, S6, MAP1LC3B-I, and MAP1LC3B-II in AGS cells infected with Hp-WT or Hp-ΔcagA (MOI = 100) for 6 h with or without pre-treatment of MK-2206 (8 μM). (E) Production of IL-8, IL-1β and TNF-α in AGS cells transfected c-Met siRNA or control siRNA (50 nM) for 24 h and then infected with Hp-WT or Hp-ΔcagA (MOI = 100) for 6 h, as assessed by ELISA. (F) After pretreatment of DMSO or MK-2206 (8 μM), AGS cells were infected with Hp-WT or Hp-ΔcagA (MOI = 100:1) for 6 h. Supernatants were assessed by ELISA for levels of IL-8, IL-1β, and TNF-α. Experiments performed in triplicate showed consistent results. *P < 0.05.
Discussion
In the present study, we observed that (i) autophagy was down-regulated in gastric mucosal tissues infected with cagA+ positive H. pylori strains, with increased gastric inflammation; (ii) CagA inhibited autophagy and induced production of proinflammatory cytokines in AGS cells; (iii) CagA downregulated starvation-induced autophagy; (iv) Inhibition of autophagy enhanced H. pylori-induced cytokine production; (v) c-Met siRNA significantly affected CagA-mediated autophagy; and (vi) CagA regulates autophagy through c-Met/Akt signaling pathway. These findings indicate that CagA may act as a negative regulator of autophagy in H. pylori-induced inflammatory response. Specifically, given that inflammation and autophagy are major determinants of gastric malignancy (Mohri et al., 2012), it also opens a new avenue of research on gastric malignancies, especially prophylaxis and treatment.
Autophagy, as the quality control of the cellular environment, plays an important role in the protective response during infection (Deretic, 2010). However, a number of pathogens could subvert autophagy to promote inflammation generation, the occurrence and promotion of tumor, and genetic instability (Deretic and Levine, 2009). Previous studies have reported that autophagosome formation was induced by VacA of H. pylori in vitro (Terebiznik et al., 2009), but VacA could also disrupt autophagic flux to promote the infection (Raju et al., 2012). In the present study, we demonstrated that CagA could inhibit autophagy, increased the production of proinflammatory cytokines and facilitated gastric inflammation. In gastric mucosal tissues, autophagy was downregulated in patients infected with CagA positive H. pylori strains, which was accompanied with an increased production of cytokines. To rule out the effect of VacA on autophagy, the toxigenic vacA genotype (vacAs1m1), expressing a functional VacA toxic, were excluded from the study. We selectively recruited patients with H. pylori negative infection, ones infected with H. pylori cagA−/vacAs1m2 strains and ones infected with cagA+/vacAs1m2 strains in the present study. As shown in Figures 2A–C, the signaling molecules such as, lower MAP1LC3B-II conversion, SQSTM1 accumulation and decreased LAMP1 expression (late endosomal/lysosomal marker; Yu et al., 2010) in gastric mucosal tissues infected with cagA+ H. pylori strains compared with cagA− H. pylori strains, which indicated that autophagic activity was decreased with increased gastric inflammation in patients infected with cagA+/vacAs1m2 strains. These results suggest that H. pylori CagA might induce inflammation by inhibiting autophagy. The intracellular CagA could be degraded by autophagy and short lived in AGS cells (Tsugawa et al., 2012). These finding suggest that induction of autophagy by H. pylori infection can degrade CagA by host cell defenses. Our observations indicate that persistent infection of bacterial exerts CagA to inhibit autophagy and induce inflammation.
Our observation that CagA is a negative regulatory factor for autophagy induced by H. pylori infection is consistent with findings of Deen's study (Deen et al., 2015), which showed that cagPAI of H. pylori has an inhibitory role in autophagy in macrophages. In addition, our results are also consistent with another study in which gastric biopsies from patients infected with cagA+/vacAs1m1 strains showed a significantly higher accumulation of SQSTM1 in the gastric epithelium compared with patients infected with a nonfunctional cagA−/vacAs2m2 strains (Raju et al., 2012). Given that tyrosine phosphorylation of CagA plays critical roles in the activation of many pathways (Moss et al., 2001; Boonyanugomol et al., 2011; Wandler and Guillemin, 2012), we constructed the corresponding tyrosine phosphorylation mutants of the parent CagA (GFP-CagA-Mut). Our results demonstrated that tyrosine phosphorylation of CagA did not affect the PI3K/Akt/mTOR pathway, autophagy, and inflammation, suggesting that inhibition of autophagy is not dependent on tyrosine phosphorylation of CagA. Thus, the more specific mechanism of autophagy inhibited by CagA needs to be further investigated in the future.
It is well-established that autophagy plays critical roles in innate and adaptive immunity (Deretic et al., 2013), and disrupted autophagy is involved in secreting the proinflammatory cytokines, such as: IL-1α, IL-8, and IL-18 (Martins et al., 2015). Several studies have reported that autophagy may be an important mechanism for controlling inflammation in patients with Crohn's disease (Hampe et al., 2007; Rioux et al., 2007). Here, we demonstrated that autophagy inhibition enhanced the production of proinflammatory cytokines in H. pylori infection. SQSTM1, which is a major cargo ubiquitin-binding receptor in cells, is degraded by autolysosomes, and deficiencies of autophagy leads to accumulation of SQSTM1 (Wang et al., 2006). Moreover, SQSTM1 has further beneficial effects in NF-κB dependent cytokine production (Dupont et al., 2009). In the present study, there was a significant accumulation of SQSTM1 in the gastric mucosa of patients infected with CagA-positive H. pylori strains. When autophagy was inhibited, the activity of NF-κB was enhanced in AGS cells infected with mutant H. pylori strains (i.e., Hp-ΔcagA). These results suggested that autophagy inhibited by CagA leads to accumulation of SQSTM1, resulting in NF-κB dependent cytokine production.
CagA activates c-Met through its CRPIA (i.e., conserved repeat responsible for phosphorylation-independent activity) motif, which is critical for activation of PI3K/Akt signaling pathway and the pleiotropic transcriptional responses in H. pylori infection, including activation of NF-κB and β-catenin (Suzuki et al., 2009). Our data showed that, CagA was coimmunoprecipitated with c-Met in AGS cells during H. pylori infection, and siRNA silencing mediated c-Met knockdown in AGS enhanced the autophagy significantly in cells infected with wide-type cagA+ H. pylori strain (i.e., Hp-WT). The PI3K/Akt signaling pathway participates in autophagy via mTOR, an autophagic regulators, resulting in autophagy suppression (Harashima et al., 2012). In the present study, we showed that CagA-positive H. pylori significantly increased the level of phosphorylated Akt at Ser473 and the levels of p-mTOR and p-S6 in AGS cells. The Akt inhibitor reversed the ratio of MAP1LC3B-II/β-actin in CagA-positive H. pylori infection, and blocked the level of phosphorylated Akt at Ser473. These findings clearly indicate that CagA inhibits autophagy via the c-Met-PI3K/Akt-mTOR signaling pathway.
Although CagA has already been reported to be a virulent factor in the inflammation induced by H. pylori infection, this is a new study demonstrating that CagA negatively regulates autophagy through c-Met-PI3K/Akt-mTOR signaling pathway, which is associated with increased expression of proinflammatory cytokines. Therefore, we postulate that inhibition of autophagy by CagA promotes gastric inflammation, which, in turn, initiates the multistep of gastric carcinogenesis (Correa, 1992). Moreover, given the pleiotropic actions of CagA, the interplay between CagA and autophagy regulation mechanism, which needs to be further investigated. A better understanding of the molecular mechanisms by which H. pylori infection modulates and interplays with autophagy will shed new insight into the development of more effective therapeutic strategies for H. pylori infection.
Author Contributions
Conceived and designed the experiments: NL and BT. Performed the experiments: YJ, PZ, YZ, and YF. Analyzed the data: QL, KW, WZ, GG, and TW. Wrote the paper: YjF, BQ, XM, and QZ.
Conflict of Interest Statement
The authors declare that the research was conducted in the absence of any commercial or financial relationships that could be construed as a potential conflict of interest.
Acknowledgments
Thanks Dr. Ji-qin Lian and Dr. Shi-ming Yang (Third Military Medical University, Chongqing, China) for editing of the manuscript, and Medjaden Bioscience Limited for assisting in the preparation of this manuscript. This work was supported by grants from National Natural Science Foundation of China (NSFC, 81301482 and 81501721).
Supplementary Material
The Supplementary Material for this article can be found online at: https://www.frontiersin.org/article/10.3389/fcimb.2017.00417/full#supplementary-material
References
Argent, R. H., Thomas, R. J., Aviles-Jimenez, F., Letley, D. P., Limb, M. C., El-Omar, E. M., et al. (2008). Toxigenic Helicobacter pylori infection precedes gastric hypochlorhydria in cancer relatives, and H. pylori virulence evolves in these families. Clin. Cancer Res. 14, 2227–2235. doi: 10.1158/1078-0432.CCR-07-2022
Asahi, M., Azuma, T., Ito, S., Ito, Y., Suto, H., Nagai, Y., et al. (2000). Helicobacter pylori CagA protein can be tyrosine phosphorylated in gastric epithelial cells. J. Exp. Med. 191, 593–602. doi: 10.1084/jem.191.4.593
Boonyanugomol, W., Chomvarin, C., Baik, S. C., Song, J. Y., Hahnvajanawong, C., Kim, K. M., et al. (2011). Role of cagA-positive Helicobacter pylori on cell proliferation, apoptosis, and inflammation in biliary cells. Dig. Dis. Sci. 56, 1682–1692. doi: 10.1007/s10620-010-1512-y
Brandt, S., Kwok, T., Hartig, R., Konig, W., and Backert, S. (2005). NF-kappaB activation and potentiation of proinflammatory responses by the Helicobacter pylori CagA protein. Proc. Natl. Acad. Sci. U.S.A. 102, 9300–9305. doi: 10.1073/pnas.0409873102
Churin, Y., Al-Ghoul, L., Kepp, O., Meyer, T. F., Birchmeier, W., and Naumann, M. (2003). Helicobacter pylori CagA protein targets the c-Met receptor and enhances the motogenic response. J. Cell Biol. 161, 249–255. doi: 10.1083/jcb.200208039
Correa, P. (1992). Human gastric carcinogenesis: a multistep and multifactorial process–first american cancer society award lecture on cancer epidemiology and prevention. Cancer Res. 52, 6735–6740.
Cremer, T. J., Amer, A., Tridandapani, S., and Butchar, J. P. (2009). Francisella tularensis regulates autophagy-related host cell signaling pathways. Autophagy 5, 125–128. doi: 10.4161/auto.5.1.7305
Deen, N. S., Gong, L., Naderer, T., Devenish, R. J., and Kwok, T. (2015). Analysis of the relative contribution of phagocytosis, lc3-associated phagocytosis, and canonical autophagy during Helicobacter pylori infection of macrophages. Helicobacter 20, 449–459. doi: 10.1111/hel.12223
Deretic, V. (2010). Autophagy in infection. Curr. Opin. Cell Biol. 22, 252–262. doi: 10.1016/j.ceb.2009.12.009
Deretic, V., and Levine, B. (2009). Autophagy, immunity, and microbial adaptations. Cell Host Microbe 5, 527–549. doi: 10.1016/j.chom.2009.05.016
Deretic, V., Saitoh, T., and Akira, S. (2013). Autophagy in infection, inflammation and immunity. Nat. Rev. Immunol. 13, 722–737. doi: 10.1038/nri3532
Dixon, M. F., Genta, R. M., Yardley, J. H., and Correa, P. (1996). Classification and grading of gastritis. The updated Sydney System. International Workshop on the Histopathology of Gastritis, Houston 1994. Am. J. Surg. Pathol. 20, 1161–1181. doi: 10.1097/00000478-199610000-00001
Dupont, N., Lacas-Gervais, S., Bertout, J., Paz, I., Freche, B., Van Nhieu, G. T., et al. (2009). Shigella phagocytic vacuolar membrane remnants participate in the cellular response to pathogen invasion and are regulated by autophagy. Cell Host Microbe 6, 137–149. doi: 10.1016/j.chom.2009.07.005
Fischer, W., Puls, J., Buhrdorf, R., Gebert, B., Odenbreit, S., and Haas, R. (2001). Systematic mutagenesis of the Helicobacter pylori cag pathogenicity island: essential genes for CagA translocation in host cells and induction of interleukin-8. Mol. Microbiol. 42, 1337–1348. doi: 10.1046/j.1365-2958.2001.02714.x
Gunn, M. C., Stephens, J. C., Stewart, J. A., Rathbone, B. J., and West, K. P. (1998). The significance of cagA and vacA subtypes of Helicobacter pylori in the pathogenesis of inflammation and peptic ulceration. J. Clin. Pathol. 51, 761–764. doi: 10.1136/jcp.51.10.761
Hampe, J., Franke, A., Rosenstiel, P., Till, A., Teuber, M., Huse, K., et al. (2007). A genome-wide association scan of nonsynonymous SNPs identifies a susceptibility variant for Crohn disease in ATG16L1. Nat. Genet. 39, 207–211. doi: 10.1038/ng1954
Harashima, N., Inao, T., Imamura, R., Okano, S., Suda, T., and Harada, M. (2012). Roles of the PI3K/Akt pathway and autophagy in TLR3 signaling-induced apoptosis and growth arrest of human prostate cancer cells. Cancer Immunol. Immunother. 61, 667–676. doi: 10.1007/s00262-011-1132-1
Kayath, C. A., Hussey, S., El Hajjami, N., Nagra, K., Philpott, D., and Allaoui, A. (2010). Escape of intracellular Shigella from autophagy requires binding to cholesterol through the type III effector, IcsB. Microbes Infect. 12, 956–966. doi: 10.1016/j.micinf.2010.06.006
Klionsky, D. J., Cuervo, A. M., and Seglen, P. O. (2007). Methods for monitoring autophagy from yeast to human. Autophagy 3, 181–206. doi: 10.4161/auto.3678
Lim, C. S., and Walikonis, R. S. (2008). Hepatocyte growth factor and c-Met promote dendritic maturation during hippocampal neuron differentiation via the Akt pathway. Cell. Signal. 20, 825–835. doi: 10.1016/j.cellsig.2007.12.013
Martins, J. D., Liberal, J., Silva, A., Ferreira, I., Neves, B. M., and Cruz, M. T. (2015). Autophagy and inflammasome interplay. DNA Cell Biol. 34, 274–281. doi: 10.1089/dna.2014.2752
Mizushima, N., Yoshimori, T., and Levine, B. (2010). Methods in mammalian autophagy research. Cell 140, 313–326. doi: 10.1016/j.cell.2010.01.028
Mohri, Y., Tanaka, K., Ohi, M., Toiyama, Y., Yasuda, H., Inoue, Y., et al. (2012). Inflammation-based prognostic score as a predictor of postoperative gastric cancer recurrence. Anticancer Res. 32, 4581–4584.
Moss, S. F., Sordillo, E. M., Abdalla, A. M., Makarov, V., Hanzely, Z., Perez-Perez, G. I., et al. (2001). Increased gastric epithelial cell apoptosis associated with colonization with cagA + Helicobacter pylori strains. Cancer Res. 61, 1406–1411.
Nakachi, N., Klein, T. W., Friedman, H., and Yamamoto, Y. (2000). Helicobacter pylori infection of human gastric epithelial cells induces IL-8 and TNFalpha, but not TGFbeta1 mRNA. FEMS Immunol. Med. Microbiol. 29, 23–26.
Nakagawa, I., Amano, A., Mizushima, N., Yamamoto, A., Yamaguchi, H., Kamimoto, T., et al. (2004). Autophagy defends cells against invading group A Streptococcus. Science 306, 1037–1040. doi: 10.1126/science.1103966
Oliveira, M. J., Costa, A. M., Costa, A. C., Ferreira, R. M., Sampaio, P., Machado, J. C., et al. (2009). CagA associates with c-Met, E-cadherin, and p120-catenin in a multiproteic complex that suppresses Helicobacter pylori-induced cell-invasive phenotype. J. Infect. Dis. 200, 745–755. doi: 10.1086/604727
Pattingre, S., Tassa, A., Qu, X., Garuti, R., Liang, X. H., Mizushima, N., et al. (2005). Bcl-2 antiapoptotic proteins inhibit Beclin 1-dependent autophagy. Cell 122, 927–939. doi: 10.1016/j.cell.2005.07.002
Py, B. F., Lipinski, M. M., and Yuan, J. (2007). Autophagy limits Listeria monocytogenes intracellular growth in the early phase of primary infection. Autophagy 3, 117–125. doi: 10.4161/auto.3618
Raju, D., Hussey, S., Ang, M., Terebiznik, M. R., Sibony, M., Galindo-Mata, E., et al. (2012). Vacuolating cytotoxin and variants in Atg16L1 that disrupt autophagy promote Helicobacter pylori infection in humans. Gastroenterology 142, 1160–1171. doi: 10.1053/j.gastro.2012.01.043
Rioux, J. D., Xavier, R. J., Taylor, K. D., Silverberg, M. S., Goyette, P., Huett, A., et al. (2007). Genome-wide association study identifies new susceptibility loci for Crohn disease and implicates autophagy in disease pathogenesis. Nat. Genet. 39, 596–604. doi: 10.1038/ng2032
Shin, D. M., Jeon, B. Y., Lee, H. M., Jin, H. S., Yuk, J. M., Song, C. H., et al. (2010). Mycobacterium tuberculosis eis regulates autophagy, inflammation, and cell death through redox-dependent signaling. PLoS Pathog. 6:e1001230. doi: 10.1371/journal.ppat.1001230
Shintani, T., and Klionsky, D. J. (2004). Autophagy in health and disease: a double-edged sword. Science 306, 990–995. doi: 10.1126/science.1099993
Suerbaum, S., and Michetti, P. (2002). Helicobacter pylori infection. N. Engl. J. Med. 347, 1175–1186. doi: 10.1056/NEJMra020542
Suzuki, M., Mimuro, H., Kiga, K., Fukumatsu, M., Ishijima, N., Morikawa, H., et al. (2009). Helicobacter pylori CagA phosphorylation-independent function in epithelial proliferation and inflammation. Cell Host Microbe 5, 23–34. doi: 10.1016/j.chom.2008.11.010
Tabassam, F. H., Graham, D. Y., and Yamaoka, Y. (2009). Helicobacter pylori activate epidermal growth factor receptor- and phosphatidylinositol 3-OH kinase-dependent Akt and glycogen synthase kinase 3beta phosphorylation. Cell. Microbiol. 11, 70–82. doi: 10.1111/j.1462-5822.2008.01237.x
Tang, B., Li, Q., Zhao, X. H., Wang, H. G., Li, N., Fang, Y., et al. (2015). Shiga toxins induce autophagic cell death in intestinal epithelial cells via the endoplasmic reticulum stress pathway. Autophagy 11, 344–354. doi: 10.1080/15548627.2015.1023682
Tang, B., Wang, K., Jia, Y. P., Zhu, P., Fang, Y., Zhang, Z. J., et al. (2016). Fusobacterium nucleatum-induced impairment of autophagic flux enhances the expression of proinflammatory cytokines via ROS in Caco-2 Cells. PLoS ONE 11:e0165701. doi: 10.1371/journal.pone.0165701
Terebiznik, M. R., Raju, D., Vazquez, C. L., Torbricki, K., Kulkarni, R., Blanke, S. R., et al. (2009). Effect of Helicobacter pylori's vacuolating cytotoxin on the autophagy pathway in gastric epithelial cells. Autophagy 5, 370–379. doi: 10.4161/auto.5.3.7663
Tsugawa, H., Suzuki, H., Saya, H., Hatakeyama, M., Hirayama, T., Hirata, K., et al. (2012). Reactive oxygen species-induced autophagic degradation of Helicobacter pylori CagA is specifically suppressed in cancer stem-like cells. Cell Host Microbe 12, 764–777. doi: 10.1016/j.chom.2012.10.014
Vaira, D., Malfertheiner, P., Megraud, F., Axon, A. T., Deltenre, M., Hirschl, A. M., et al. (1999). Diagnosis of Helicobacter pylori infection with a new non-invasive antigen-based assay. HpSA European study group. Lancet 354, 30–33. doi: 10.1016/S0140-6736(98)08103-3
Wandler, A. M., and Guillemin, K. (2012). Transgenic expression of the Helicobacter pylori virulence factor CagA promotes apoptosis or tumorigenesis through JNK activation in Drosophila. PLoS Pathog. 8:e1002939. doi: 10.1371/journal.ppat.1002939
Wang, L., Dong, Z., Huang, B., Zhao, B., Wang, H., Zhao, J., et al. (2010). Distinct patterns of autophagy evoked by two benzoxazine derivatives in vascular endothelial cells. Autophagy 6, 1115–1124. doi: 10.4161/auto.6.8.13508
Wang, Q. J., Ding, Y., Kohtz, D. S., Mizushima, N., Cristea, I. M., Rout, M. P., et al. (2006). Induction of autophagy in axonal dystrophy and degeneration. J. Neurosci. 26, 8057–8068. doi: 10.1523/JNEUROSCI.2261-06.2006
Yla-Anttila, P., Vihinen, H., Jokitalo, E., and Eskelinen, E. L. (2009). Monitoring autophagy by electron microscopy in Mammalian cells. Methods Enzymol. 452, 143–164. doi: 10.1016/S0076-6879(08)03610-0
Yu, L., McPhee, C. K., Zheng, L., Mardones, G. A., Rong, Y., Peng, J., et al. (2010). Termination of autophagy and reformation of lysosomes regulated by mTOR. Nature 465, 942–946. doi: 10.1038/nature09076
Keywords: Helicobacter pylori, autophagy, CagA, c-Met, SQSTM1
Citation: Li N, Tang B, Jia Y, Zhu P, Zhuang Y, Fang Y, Li Q, Wang K, Zhang W, Guo G, Wang T, Feng Y, Qiao B, Mao X and Zou Q (2017) Helicobacter pylori CagA Protein Negatively Regulates Autophagy and Promotes Inflammatory Response via c-Met-PI3K/Akt-mTOR Signaling Pathway. Front. Cell. Infect. Microbiol. 7:417. doi: 10.3389/fcimb.2017.00417
Received: 23 July 2017; Accepted: 08 September 2017;
Published: 21 September 2017.
Edited by:
Pascale Alard, University of Louisville, United StatesReviewed by:
Mario M. D'Elios, University of Florence, ItalyNagendran Tharmalingam, Brown University, United States
Copyright © 2017 Li, Tang, Jia, Zhu, Zhuang, Fang, Li, Wang, Zhang, Guo, Wang, Feng, Qiao, Mao and Zou. This is an open-access article distributed under the terms of the Creative Commons Attribution License (CC BY). The use, distribution or reproduction in other forums is permitted, provided the original author(s) or licensor are credited and that the original publication in this journal is cited, in accordance with accepted academic practice. No use, distribution or reproduction is permitted which does not comply with these terms.
*Correspondence: Bin Qiao, cijnmd@126.com
Xu-hu Mao, mxh95xy@tom.com
Quan-ming Zou, qmzou2007@163.com
†These authors have contributed equally to this work.