Polymorphisms in Protein Tyrosine Phosphatase Non-receptor Type 2 and 22 (PTPN2/22) Are Linked to Hyper-Proliferative T-Cells and Susceptibility to Mycobacteria in Rheumatoid Arthritis
 Robert C. Sharp
 Shazia A. Beg
 Saleh A. Naser
- 1Burnett School of Biomedical Sciences, University of Central Florida College of Medicine, Orlando, FL, United States
- 2Health Center, Universtiy of Central Florida College of Medicine, Orlando, FL, United States
A shared genetic pre-disposition, chronic inflammation, and treatment with similar biologics between Rheumatoid arthritis (RA) and Crohn's disease (CD) have intrigued us to investigate whether the two disorders share trigger association or possible causation. We hypothesized earlier that Single Nucleotide Polymorphisms (SNPs) in the negative regulators Protein Tyrosine Phosphatase Non-receptor type 2 and 22 (PTPN2/22) lead to a dysregulated immune response, susceptibility to environmental triggers, and continued apoptosis as seen in chronic inflammation in RA and CD. To test the hypothesis, peripheral leukocytes samples from 132 consented subjects were genotyped for 9 SNPs in PTPN2/22 using TaqMan™ genotyping. The effect of the SNPs on PTPN2/22 and IFN-γ expression was determined using real time PCR. T-cell proliferation and response to phytohematoagglutonin (PHA) mitogen and mycobacterial antigens were determined by BrdU proliferation assay. Blood samples were also analyzed for the Mycobacterium avium subspecies paratuberculosis (MAP) IS900 gene by nPCR. Out of 9 SNPs examined, heterozygous (TC) or minor (CC) alleles of PTPN2:rs478582 occurred in 79% RA compared to 60% healthy controls (p-values ≤ 0.05; OR = 2.28). Similarly, heterozygous (GA) or minor (AA) alleles of PTPN22:rs2476601 occurred in 29% RA compared to 6% healthy controls (p-values ≤ 0.05; OR = 5.90). PTPN2/22 expression in RA was decreased by 1.2-fold compared to healthy controls. PTPN2:rs478582 upregulated IFN-γ in RA by 1.5-fold. Combined PTPN2:rs478582 and PTPN22:rs2476601 increased T-cell proliferation by 2.7-fold when treated with PHA. Surprisingly, MAP DNA was detected in 34% of RA samples compared to 8% healthy controls, (p-values ≤ 0.05, OR = 5.74). RA samples with PTPN2:rs478582 and/or PTPN22:rs2476601 were more positive for MAP than samples without polymorphisms. Combined occurrence of PTPN2:rs478582 and PTPN22:rs2476601 in association with the presence of MAP has significantly increased T-cell response and elevated IFN-γ expression in RA samples. The data suggest that genetic polymorphisms may play vital role in T-cell regulation, susceptibility to mycobacteria and ultimately response to treatment. This is the first study to report the detection of MAP DNA in the blood of RA patients; further studies are needed using larger number of samples.
Introduction
Most inflammatory diseases including Rheumatoid Arthritis (RA) have always been classified as autoimmune diseases due to genetic disorders and association with environmental triggers. Genetic predispositions include single nucleotide polymorphisms (SNPs) that affect the alleles of different genes (McInnes and Schett, 2011; Yarwood et al., 2014; Smolen et al., 2016). In RA, several SNPs have been reported in HLA class 2 histocompatibility antigen, DRB1 beta chain (HLA-DRB1), protein tyrosine phosphatase non-receptor type 22 (PTPN22), cytotoxic T-lymphocyte-associated protein 4 (CTLA4), and cluster of differentiation 40 (CD40) (McInnes and Schett, 2011; Yarwood et al., 2014; Smolen et al., 2016). SNPs in these genes alter or stimulate the activation and regulation of major components of the immune system (T-cells, B-cells, macrophages, etc.) and osteoclasts which could lead to immune-dysregulation (Brennan and McInnes, 2008; McInnes and Schett, 2011; Smolen et al., 2016). Consequently, this leads to accumulation of immune cells in and around synovial joints and excessive production of anti-CCP, rheumatoid factor autoantibodies (RF) and various pro-inflammatory cytokines such as TNF-α, IFN-γ, IL-1, and IL-6 (Brennan and McInnes, 2008; McInnes and Schett, 2011; Smolen et al., 2016). Specifically, SNPs in immune regulatory genes such as protein tyrosine phosphatase non-receptor type 2 (PTPN2) and PTPN22 (PTPN2/22) could potentially cause these problems in RA. PTPN2/22 encode proteins that act as phosphatases that negatively regulate the immune response and some regulatory cellular functions (Gurzov et al., 2015; Sharp et al., 2015). Both PTPN2/22 proteins are found in T-cells to remove phosphates from LCK and ZAP-70 of the T-cell receptor (TCR), which in turn stops activation of the TCR (Gurzov et al., 2015; Sharp et al., 2015). PTPN2 protein is also active in epithelial cells around the joints and intestinal tissues, which negatively regulates chemokine production by removing phosphates from STAT1 dimers and reduces apoptosis by removing phosphates from BIM proteins (Gurzov et al., 2015; Sharp et al., 2015). We agree that the prevalence of SNPs in PTPN2/22 may vary and we support the possibility that the effect on gene expression may be significant which ultimately may void their functions as negative regulators (Figure 1). Consequently, T-cells remain constantly active, leading to hypersecretion of pro-inflammatory cytokines and inflammation along with tissue damage (Gurzov et al., 2015; Sharp et al., 2015).
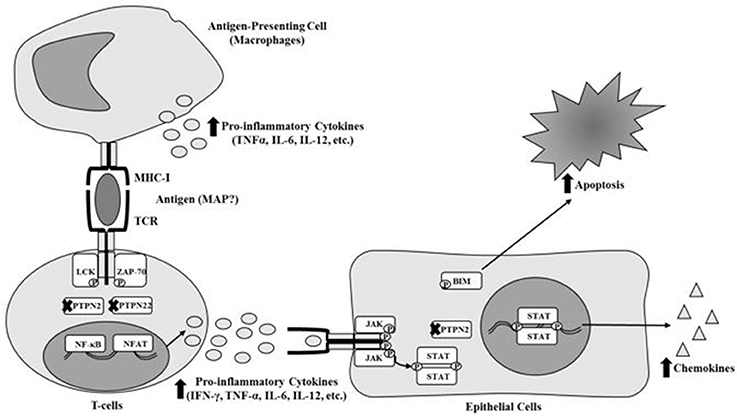
Figure 1. Effect of SNPs in PTPN2/22 on T-cell response.
RA is an idiopathic autoimmune disease with suspected genetic predisposition and environmental triggers association. Due to intense inflammation, hyperplasia of the joints occurs along with cartilage and bone destruction, which leads to extreme pain and deformity of the extremities (Smolen et al., 2007; Aletaha et al., 2010; McInnes and Schett, 2011). RA symptoms include joint swelling and pain of three or more joints, morning stiffness lasting 30 min and subcutaneous rheumatoid nodules (Majithia and Geraci, 2007). Anti-CCP along with RF have also been useful to diagnose RA, more so than erythrocyte sedimentation rate (ESR) and C-reactive protein serum levels (Nishimura et al., 2007; Egerer et al., 2009; Pincus and Sokka, 2009; Aletaha et al., 2010; Taylor et al., 2011). Although, anti-CCP seems to be more specific, but less sensitive than RF in RA diagnosis. Overall, ~30% of patients with RA are negative for anti-CCP (Nishimura et al., 2007; Egerer et al., 2009; Pincus and Sokka, 2009). RF, on the other hand, seems to have lower specificity but higher sensitivity compared to anti-CCP test. Overall, ~30–40% of patients with RA are negative for rheumatoid factor (Nishimura et al., 2007; Egerer et al., 2009; Pincus and Sokka, 2009). The limitation in early and accurate diagnosis of RA affects many patients who are left with continued pain and debilitating suffering. It is imperative that new and improved methods of testing for RA (i.e., genetic testing or identification of potential environmental antigens) is discovered to not only better diagnose RA, but to also find better treatments for the disease as well.
Treatment of inflammatory diseases such as RA and Crohn's disease (CD) includes non-steroid anti-inflammatory drugs (NSAIDs), glucocorticoids, and disease-modifying anti-rheumatic drugs (DMARDs) (Majithia and Geraci, 2007; Smolen et al., 2007, 2016). NSAIDs and glucocorticoids are used for RA patients to help reduce overall pain and stiffness (Majithia and Geraci, 2007; Smolen et al., 2016). However, these medications have a wide-variety of long-term side effects such as ulceration, osteoporosis, hypertension, weight gain, etc., thus NSAIDs and glucocorticoids need to be paired with other medications to reduce the side effects (Majithia and Geraci, 2007; Fakhrudin et al., 2015; Smolen et al., 2016). DMARDs includes synthetic products such as methotrexate, sulfasalazine and hydroxychloroquine and includes biologics such as adalimumab/infliximab (anti-TNF-α), tocilizumab (anti-IL-6 receptor), abatacept (T-cell co-stimulator), and rituximab (B-cell deactivator) (Majithia and Geraci, 2007; Smolen et al., 2016). Using multi-therapy or mono-therapy of different DMARDs is controversial and is continued to be argued among clinicians due to conflicting side effects of each medication. Problems with both synthetic and biological DMARDs continue to be the high risk of developing sides effects including GI intolerance, hypersensitivity to the medication, production of antibodies against the medication, and increasing the risk of developing opportunistic infections such as Mycobacterium tuberculosis infection (Bartelds et al., 2007; Dixon et al., 2010; Smolen et al., 2016). DMARDs and synthetic DMARDs are re-classified as DMAIDs when used in inflammatory bowel treatment such as CD (Allen et al., 2017). Infliximab is most commonly prescribed medication for both RA and CD (Kuek et al., 2007; Allen et al., 2017). RA and CD patients share the same treatments, thus it is possible that both RA and CD pathogenesis share common factors involved in disease pathogenesis (Georgiadis et al., 2003; Kuek et al., 2007; Zhernakova et al., 2009; Voight and Cotsapas, 2012; Allen et al., 2017).
Environmental triggers involved in RA include cigarette smoking, air pollutants, and bacteria including Porphyromonas ginivalis (P. gingivalis) and Proteus mirablis (P. mirablis) (Klareskog et al., 2011; Fisher et al., 2015; Smolen et al., 2016). Molecular mimicry between a haemolysin protein sequence (ESRRAL) produced by P. mirablis and a RA susceptibility sequence (EQRRAA) was reported, thus showing possible connections to genetic pre-disposition and an environmental trigger synergistic threat (Ebringer and Wilson, 2000). Most recently, Mycobacterium avium subspecies paratuberculosis (MAP) has been associated with other autoimmune diseases including CD, T1D, and possibly in RA (Naser et al., 2009a, 2013; Masala et al., 2011; Sharp et al., 2015). The association of MAP with these inflammatory diseases was based on shared genetic predisposition and molecular mimicry with environmental antigens (Naser et al., 2009a, 2013; Masala et al., 2011; Sharp et al., 2015). MAP infection in a genetically predisposition patient should trigger, exacerbate and possibly dysregulate the immune system by stimulating the production of pro-inflammatory cytokines and, through molecular mimicry, production of autoantibodies (Naser et al., 2009a, 2013; Masala et al., 2011; Sharp et al., 2015). This is the first study designed to explore the effect of an environmental trigger, such as MAP, and SNPs in PTPN2/22 on gene expression and the consequent effect on T-cells reactivity and inflammation. We hypothesize that SNPs in PTPN2/22 and, along with MAP infection, causes hyper-proliferative T-cells and overexpression of IFN-γ leading to possible inflammation in RA patients.
Methods
Clinical Samples
Three 4.0-mL K2-EDTA coded blood tubes were obtained from 132 consented RA and healthy control subjects that were acquired from the University of Central Florida Health Center. The study was approved by the University of Central Florida Institutional Review Board #IRB00001138. Each subject completed and signed a written consent form before samples were collected. The average age of healthy controls was 30.7 ± 13.4 with a gender ratio of 41.9% male and 58.1% female subjects. The average age of RA patients was 49.9 ± 13.7 with a gender ratio of 11.4% male and 88.6% female subjects. Many factors including the higher prevalence of RA in older females than in males (3:1 ratio) found in other studies, the preference of a female rheumatologists by female RA patients, and the selection of rheumatologists around the area has been noted and considered in this study (Kvien et al., 2006; van Vollenhoven, 2009). Table 1 lists age, gender and other demographic information and current medications for all RA subjects participating in this study. One tube of blood sample was processed for detection of MAP IS900 DNA. Another tube of blood sample was processed for PTPN2/22 genotyping and gene expression experiments, whereas the third tube of blood sample was utilized in T-cell proliferation study.
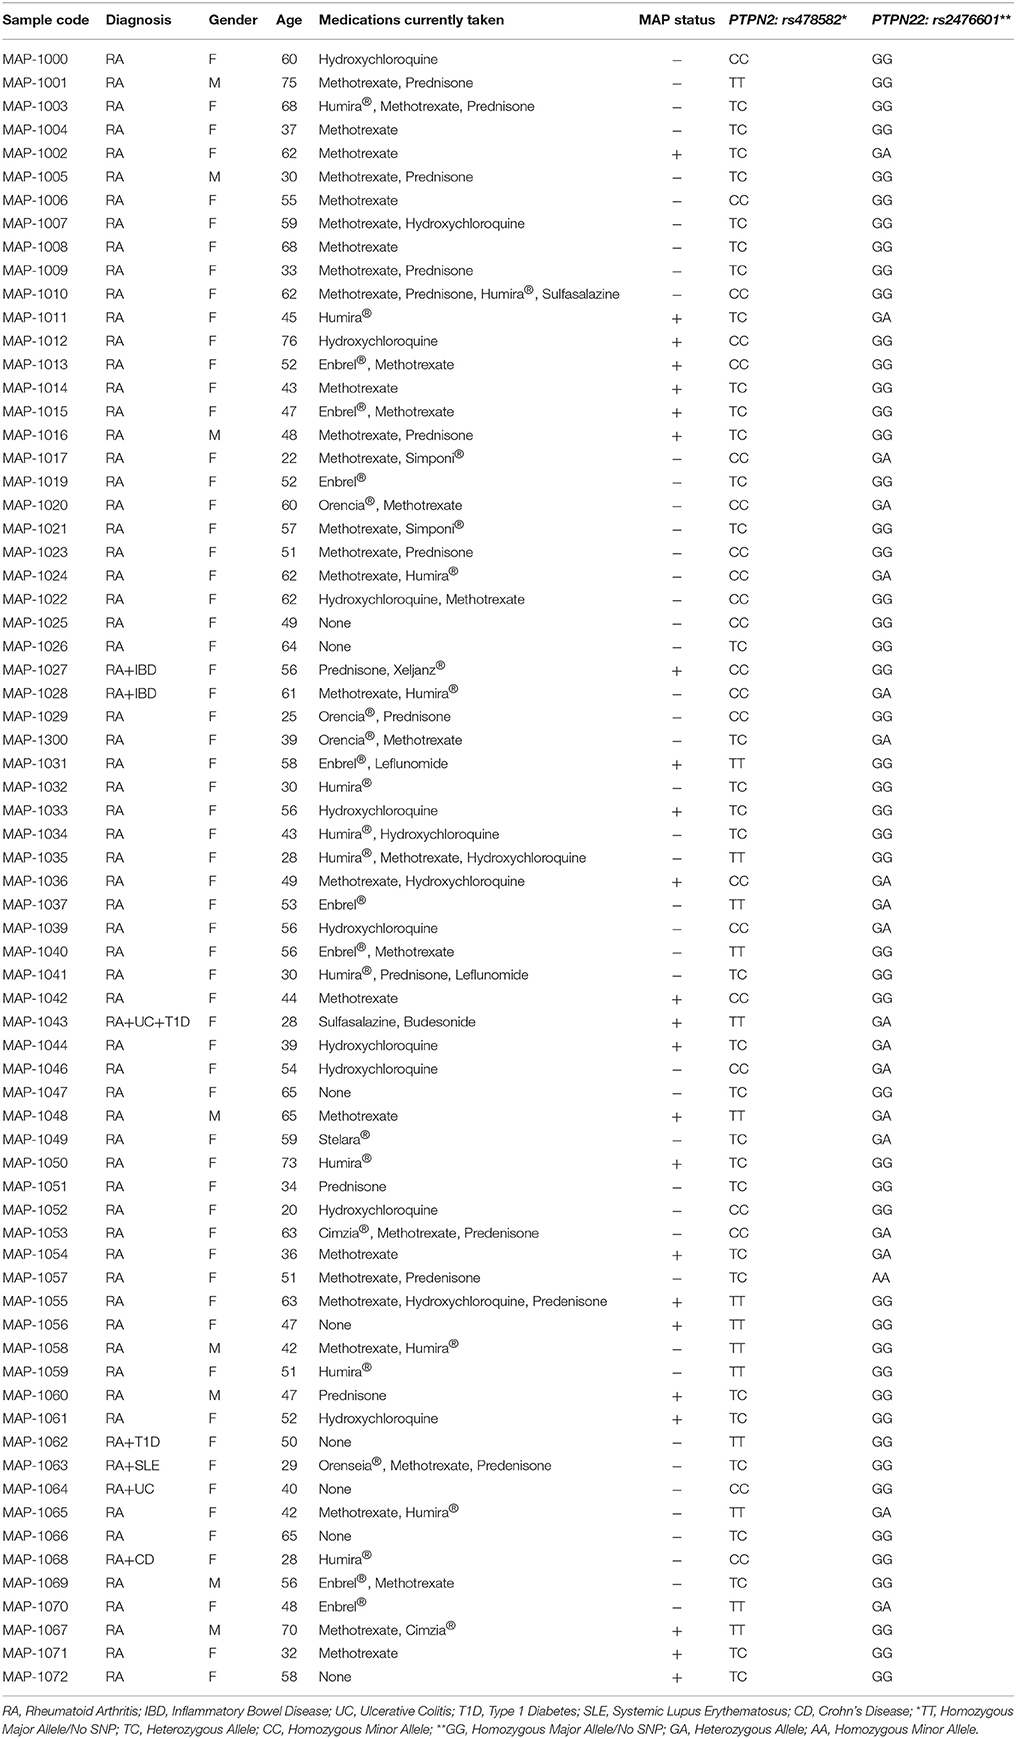
Table 1. Demographics, treatment history, and results of MAP and allele frequency of rs478582/rs2476601 in RA samples used in study.
Detection of MAP IS900 DNA in Peripheral Leukocytes
Blood sample tubes designated for MAP IS900 detection were centrifuged at 3,000 RPMs for 10 min at room temperature. A 1.0 mL sample of plasma was transferred to sterile 1.5 mL microcentrifuge tube and was stored at −20°C for further analysis. Buffy coat layer containing peripheral leukocytes were also transferred into new sterile 1.5 mL microcentrifuge tube containing double volume of red cell lysis buffer (ammonium chloride solution, G-Biosciences®). Tubes were then incubated by rocking on a gentle shaker for 10 min, which then were centrifuged at 5,000 RPMs for 5 min at room temperature. The supernatant was removed and purified buffy coat pellets were stored in Tris-EDTA (TE) buffer and subjected to genomic DNA extraction using a modified DNAzol® extraction protocol as follows. Fresh or thawed buffy coat pellets suspended in 1.0 mL DNAzol® reagent was mixed with 400 μL of 100% isopropanol. Tubes were then incubated for 15 min at room temperature followed by centrifugation at 8,000 RPMs for 6 min. The supernatant was discarded and DNA pellets were washed once with 500 μL DNAzol® reagent and centrifuged at 8,000 RPMs for 5 min. Genomic DNA pellets were washed again with 1.0 mL of 75% ethanol and centrifuged at 8,000 RPMs for 5 min. DNA pellets were then dried in a speedvac for 5 min. Dried DNA pellets were dissolved in 20 μL molecular biological grade sterile H2O and stored at −20°C for analysis by nPCR. Detection of MAP IS900 DNA was done following our nPCR protocol and nucleotide primers as described previously (Naser et al., 2004). The presence of a 298 bp band on a 2% agarose gel was indicative of presence of MAP in patient sample. Positive MAP DNA control originated from our UCF4, a culture of clinical strain isolated from CD patient. Negative control tube for each PCR step contained all PCR ingredients except DNA template was used.
PTPN2/22 Genotyping
Genotyping of PTPN2/22 for 9 SNPs were performed on DNA from peripheral blood. Genotyping was done at the University of Florida Pharmacotherapy and Translational Research Department (Gainesville, FL) using the TaqMan™ SNP Genotyping Assays (Applied Biosystems™). We investigated 4 SNPs specific to PTPN2 including rs1893217, rs2542151, rs7234029, and rs478582 along with 5 SNPs specific for PTPN22 including rs2476601, rs2488457, rs33996649, rs34209542, and rs2476599. Table 2 summarizes SNPs allele mutations and amino acid mutations used in this study. Briefly, 1 mL blood was stored at −20°C until all samples were collected. DNA extractions were performed on whole blood samples using QIAamp® DNA Blood Mini Kit (Qiagen™) following the manufacturer's protocol. Similarly, TaqMan™ genotyping assays for PTPN2/22 were performed on DNA samples following manufacturer protocol (Applied Biosystems™). Briefly, reaction mixtures consisted of 2x TaqMan™ Master Mix and 20x Assay Working Stock (primers with VIC and FAM fluorophore attachment) were transferred into a 384-well microtiter plate. DNA samples and controls were then added to the plate which then was subjected to RT-PCR using Applied Biosystems™ QuantStudio™ RT-PCR System. The protocol consisted of 95°C for 10 min for 1 cycle, 92°C for 15 s and 58°C for 1 min for 50 cycles. The plate was read for VIC and FAM fluorophores for each sample at 551 and 517 nm, respectively. Fluorescence of VIC or FAM alone determined that the sample had allele 1 or allele 2, while VIC and FAM together determined that the sample is heterozygous for each allele.
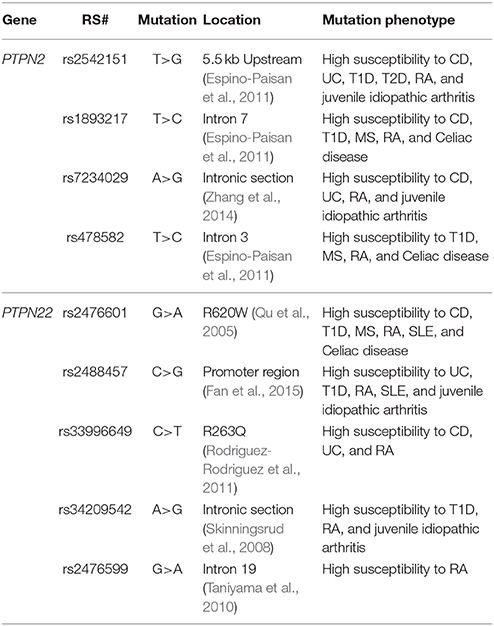
Table 2. List of SNPs in PTPN2/22 examined in this study.
PTPN2/22 and IFN-γ Gene Expression
A total of 1 mL of fresh whole blood was transferred into 2.0 mL RNA-ase free microcentrifuge tube and was immediately processed for RNA extraction. RNA was isolated from peripheral leukocytes and then used to synthesis cDNA for determining gene expression of PTPN2/22 and IFN-γ via RT-PCR. RNA extraction was performed following the TRIzol® Reagent (Invitrogen) manufacturer's instruction. Briefly,1.0 mL of whole blood was transferred into 2.0 mL RNase free microcentrifuge tubes and centrifuged at 3,000 RPMs for 15 min. Plasma was discarded and buffy coat layer containing peripheral leukocytes were transferred to new RNA-ase free microcentrifuge tubes with double volume of red cell lysis buffer (ammonium chloride solution, G-Biosciences®). Tubes were incubated by rocking on gentle shaker for 10 min which then was centrifuged at 5,000 RPMs for 5 min at room temperature. Supernatant was then removed and peripheral leukocyte pellets were suspended in 1.0 mL of TRIzol®. Tubes were then incubated by rocking on a gentle shaker for 15 min. A volume of 0.2 mL of chloroform was then added to each tube. The mixture was then incubated at room temperature for 3 min. Tubes were then centrifuged at 11,400 RPMs for 15 min at 4°C. The colorless, upper aqueous phase containing RNA was transferred into new 2.0 mL RNA-ase free microcentrifuge tubes. A volume of 0.5 mL of 100% isopropanol was added followed by incubation at room temperature for 10 min. Tubes were then centrifuged at 11,400 RPMs for 10 min at 4°C. RNA pellets were washed in 1 mL of 75% ethanol and then centrifuged at 8,700 RPMs for 5 min at 4°C. RNA pellets were air-dried for 15–30 min and then suspended in 20 μL of RNase free H2O and heated at 60°C for 10 min.
cDNA synthesis was performed following the iScript™ Reverse Transcription (Bio-Rad®) manufacturer's instruction. Briefly, 600 ng of RNA from each sample was added to PCR reaction tubes containing 0.2 mL PCR reaction, 4 μL of iScript™ Reverse Transcription (Bio-Rad®), and up to 20 uL RNase free H2O. Tubes were then placed in a thermal cycler (MyGene™ Series Pelteir Thermal Cycler) and ran for 5 min at 25°C, 20 min at 46°C, and 1 min at 95°C. Final concentration of cDNA for each sample was 30 ng/μL.
RT-PCR reactions in a 96-well microamp plate consisted of 1 μL of cDNA (30 ng), 10 μL of Fast SYBR Green Mastermix (Thermofisher Scientific®), 1 μL of either PTPN2, PTPN22, or IFN-γ PrimePCR SYBER Green Assay mix (Bio-Rad®). and 8 μL of molecular biological grade sterile H2O. Oligonucleotide primers for 18s RNA gene (forward primer: 5′-GTA ACC CGT TGA ACC CCA TT-3′; reverse primer: 5′-CCA TCC AAT CGG TAG TAG CG-3′) were used as a control and to obtain baseline CT readings. RT-PCR reaction was performed using the 7500 Fast Real-Time PCR System (Applied Biosystems®). Relative mRNA expression levels were calculated using ΔCT (Sample RT-PCR CT reading–18s CT baseline) and using the equation (2−ΔCT × 1,000).
Isolation of Peripheral Lymphocytes and Proliferation Assay
Isolation of peripheral lymphocytes was performed using Lymphoprep™ reagent (Axis-Shield®) as described previously (Naser et al., 2009b). A stock of 2X freezing media containing 10.0 mL of 25% human serum albumin (Gemini®), 10.0 mL of sterile RPMI-1640 (Sigma-Aldrich®), and 5.0 mL DMSO was made for the use of preserving lymphocytes for storage at −80°C. Isolated lymphocytes were transferred into 1.0 mL cryogenic vials (Nalgene®) with double the amount of 2x freezing media added to samples and stored at −80°C for future use. Lymphocytes were thawed and washed with cRPMI, which contained 10% sterile heat-inactivated FBS (Sigma-Aldrich®) and 1% sterile antibiotic/antimycotic solution (Sigma-Aldrich®) added to RPMI-1640 before T-cell isolation. T-cell isolation from lymphocyte samples were done using EasySep™ Human T-cell Isolation Kit (Stemcell™) following manufacturer's instruction. Briefly, isolated lymphocytes were transferred into a 2.0 mL round-bottom microcentrifuge tubes. The Isolation Cocktail mixture was added at 50 μL/mL to sample tubes and was incubated at room temperature for 5 min. The RapidSpheres™ mixture was added to the tubes at 40 μL/mL and were placed in the EasySep™ magnet for 3 min. Isolated T-cells were poured from the tubes in the magnet to new 2.0 mL microcentrifuge tubes. T-cells were then counted using trypan blue solution (0.4%, Sigma®) cell viability assay.
T-cell proliferation assay was done using bromodeoxyuridine (BrdU) labeling proliferation ELISA kit (Roche Molecular Biochemicals®) as described previously (Naser et al., 2009b). Phytohematoagglutunin (PHA) was used to evaluate T-cell response. Purified Protein Derivative-like (PPD-like) from MAP was prepared by purification of supernatant from sonicates of protein extract obtained from clinical strain UCF4 culture pellet. It was used to determine T-cell response and prior exposure to MAP antigens. Briefly, 1 × 10⁵ of isolated T-cells were transferred in triplicates onto a 96-well culture plate and were incubated in either RPMI only, PHA (10 μg/mL, Sigma-Aldrich®) or PPD-like (5 μg/mL) along with respected patients' plasma for 72 h at 37°C and 5% CO2. T-cells were then labeled with BrdU and incubated for 24 h at 37°C and 5% CO2. Cell proliferation was measured through Roche BrdU proliferation ELISA kit as described previously (Naser et al., 2009b). Relative T-cell proliferation levels of samples were compared to blanks (RPMI only) and controls (isolated T-cells in RPMI only) by examining fold change in absorbance reading of each well at 450 nm.
Statistical Analysis
Samples were analyzed for significance using unpaired, two-tailed t-tests; unpaired, two-tailed z-score; and odds ratio. GraphPad Prism 7 was used for statistical analysis and creation of graphs. P-values ≤ 0.05 were considered significant. Relative mRNA gene expression was determined by the use of ΔCT of the gene of interest found in each sample and the equation 2−ΔCT × 1,000 (Sullivan et al., 2013).
Results
Mycobacterium avium Subspecies Paratuberculosis-IS900 DNA Detected in RA
Purified DNA from peripheral leukocytes of 118 subjects (70 RA and 48 healthy controls) was analyzed by nPCR using oligonucleotide primers specific to MAP IS900. MAP DNA was detected in blood samples from RA subject as illustrated in Figure 2A. The 298 bp PCR product purified from representative gels was sequenced and BLAST analysis confirmed the identity of MAP, which has previously been used to confirm if patient samples are considered having the MAP infection (Naser et al., 2004, 2009a, 2013). As shown in Figure 2B, out of 70 blood samples from RA subjects, 24 (34.3%) were positive for MAPbacteremia compared to only 4 out 48 (8.3%) healthy controls (p-value ≤ 0.05). The odds ratio (OR) value was determined to be 5.74 (95% CI: 1.84–17.9; p-value ≤ 0.05), where the presence of MAP DNA is most likely to occur in RA patients. MAP bacteria has been successfully re-cultured from at least one RA buffy coat sample (MAP-1015, see Table 1) via BD Bactec™ MGIT™ Para-TB medium (Becton, Dickinson and Company). The cultured sample was confirmed to be MAP positive by way of nPCR as previously mentioned. Culturing of MAP bacteria from other RA patient samples is still ongoing.
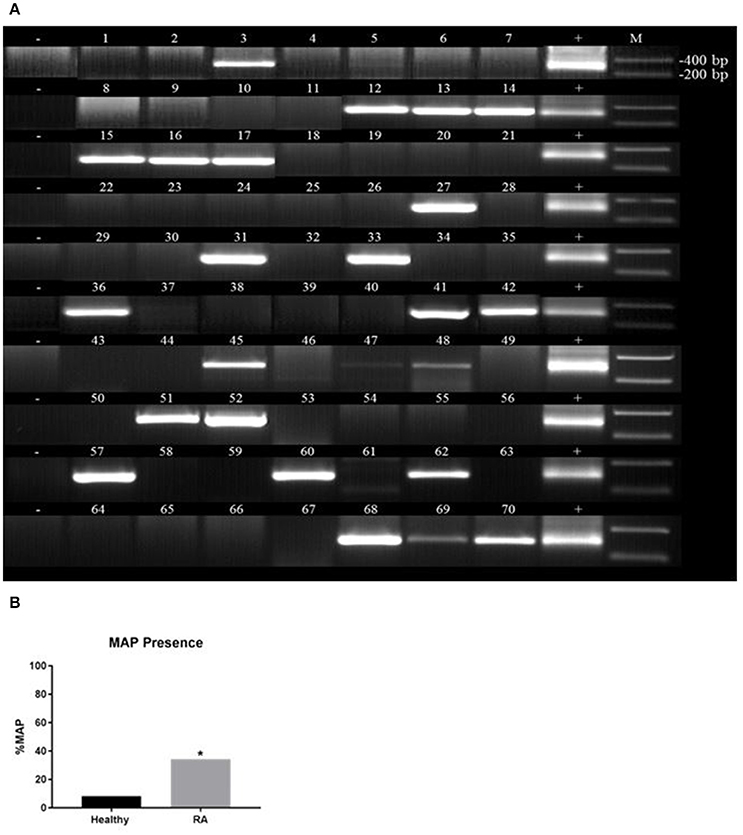
Figure 2. Detection of Mycobacterium avium subspecies paratuberculosis (MAP) in blood samples from RA. Nested PCR was performed on genomic DNA from blood samples from RA subjects (A) and healthy controls (B). DNA from MAP strain UCF4 was used as a positive control (+); a negative control (without DNA template) was also included (−). M corresponds with molecular weight marker. *P-values ≤ 0.05.
Frequency of SNP Alleles in PTPN2/22 in RA
TaqMan™ genotyping was done on purified DNA from 132 subjects (70 RA and 62 healthy controls). DNA from each subject was analyzed for 4 SNPs specific to PTPN2 (rs1893217, rs2542151, rs7234029, rs478582) and 5 SNPs specific to PTPN22 (rs2476601, rs2488457, rs33996649, rs34209542, rs2476599). Data referred to as homozygous major allele is considered normal/no SNP, while heterozygous allele and homozygous minor allele were considered abnormal and designated as SNP positive. As shown in Figure 3, Out of 4 SNPs specific to PTPN2, rs478582 was significant in RA since heterozygous (TC) or minor (CC) alleles were detected in 55/70 (78.6%) RA samples compared to 36/60 (60.0%) healthy controls (p-value ≤ 0.05, Figure 3A). Specifically, 22/70 (31.4%) minor (CC) alleles were detected in RA compared to 9/60 (15.0%) healthy controls (p-value ≤ 0.05), whereas heterozygous (TC) alleles were detected in 33/70 (47.1%) RA compared to 28/60 (46.7%) healthy controls. Out of 5 SNPs specific to PTPN22, rs2476601 was significant in RA since heterozygous (GA) or minor (AA) alleles were detected in 20/70 (28.6%) RA samples compared to only 4/62 (6.45%) healthy controls (p-values ≤ 0.05, Figure 3B). Specifically, heterozygous alleles (GA) were detected in 19/70 (27.1%) RA compared to 4/62 (6.45%) healthy controls (p-value ≤ 0.05). There was rare minor (AA) alleles detected in all samples. The OR value for the significance of PTPN2:rs478582 was 2.28 (95% CI: 1.05–4.93; p-value ≤ 0.05) whereas OR value for PTPN22:rs2476601 was 5.90 (95% CI: 1.89–18.4; p-value ≤ 0.05).
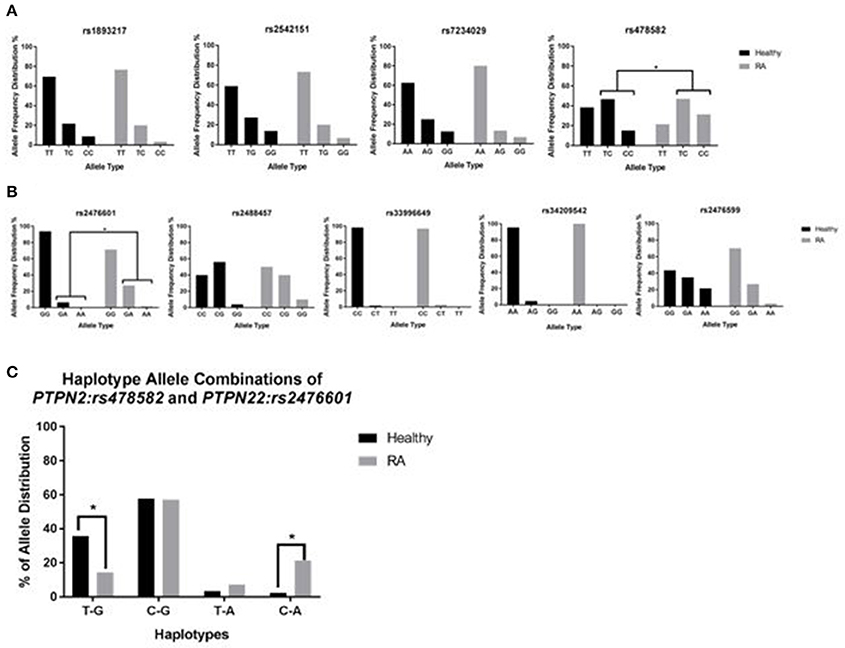
Figure 3. Genotyping of 9 SNPs in PTPN2/22 in RA. (A) Represents the allele frequency in PTPN2: rs1893217, rs2542151, rs7234029, rs478582. (B) Represents the allele frequency in PTPN22: rs2476601, rs2488457, rs33996649, rs34209542, rs2476599. (C) Represents haplotype combinations between PTPN2:rs478582 and PTPN22:rs2476601 including T-G (major/major), C-G (heterozygous or minor/major), T-A (major/heterozygous or minor), and C-A (minor/minor). *P-values ≤ 0.05.
For determination of haplotype combinations, we examined the significant SNPs PTPN2:rs478582 and PTPN22:rs2476601 allele combinations to confirm the allele distribution among samples (Figure 3C). Examination of the following haplotype combinations were determined in the samples, where PTPN2:rs478582 and PTPN22:rs2476601 allele types were combined respectively: T-G, C-G, T-A, and C-A. T-G haplotype (major/major) was found more significantly in healthy controls (21/59 = 35.6%) than in RA samples (10/70 = 14.3%, p-value ≤ 0.05). C-G haplotype (heterozygous or minor/major) was found in 40/70 (57.1%) RA samples compared to healthy 34/59 (57.6%). T-A haplotype (major/heterozygous or minor) was found more in RA samples (5/70 = 7.14%), compared to healthy controls (2/59 = 3.39%), while C-A (heterozygous or minor/heterozygous or minor) was found significantly more in RA samples (15/70 = 21.4%) than in healthy controls (2/59 = 2.39%, p-value ≤ 0.05). When examining the haplotypes in more detail, CC-GA haplotype was found more significantly (p-value ≤ 0.05) in RA patients (8/70 = 11.4%) than in healthy controls (1/59 = 1.69%).
Effect of PTPN2:rs478582 and PTPN22:rs2476601 on PTPN2/22 Expression
Gene expression of PTPN2/22 in 37 RA and 31 healthy controls were reported. The overall relative mRNA expression of PTPN2 was lower in RA compared to healthy controls (8.22 ± 5.33 and 10.3 ± 6.95, respectively). Similarly, relative mRNA expression of PTPN22 was also lower in RA compared to healthy controls (2.55 ± 1.74, and 3.24 ± 1.84, respectively). Examination of relative mRNA expression of PTPN2/22 in relationship with samples with either PTPN2:rs478582 or PTPN22:rs2476601 was examined as seen in Table 3.
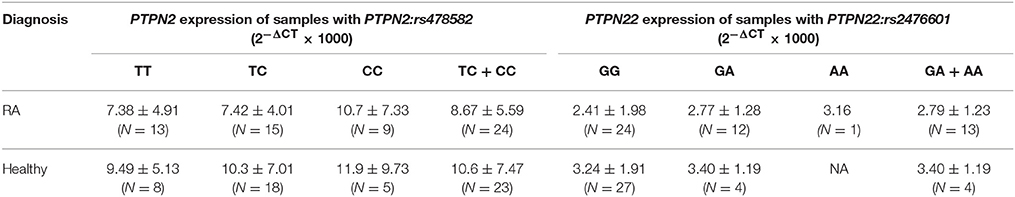
Table 3. Effect of PTPN2:rs478582 and PTPN22:rs2476601 on PTPN2/22 expression.
The effect of PTPN2:rs478582 on gene expression was evaluated. The average relative mRNA expression in RA with heterozygous (TC) or minor (CC) allele was 8.67 ± 5.59 (N = 24) compared to 10.6 ± 7.47 (N = 23) in healthy controls with similar SNPs and lower than healthy controls without SNPs (TT) (9.49 ± 5.13; N = 8). Specifically, the average relative mRNA expression in RA with heterozygous (TC) allele was 7.42 ± 4.01; N = 15) which is much lower than healthy control with the heterozygous (TC) allele (10.3 ± 7.01; N = 18) and normal (TT) healthy controls (9.49 ± 5.13; N = 8). The effect of minor (CC) allele on PTPN2 expression in RA was 10.7 ± 7.33 (N = 9) and lower than healthy controls with minor (CC) allele (11.9 ± 9.73; N = 5). The effect of PTPN2:rs478582 on mRNA expression in each subject group was not significant. Among healthy controls, the average relative mRNA expression in samples with heterozygous (TC) or minor (CC) allele was 10.6 ± 7.47 (N = 23) compared to 9.49 ± 5.13 (N = 8) in normal (TT) samples. The average relative mRNA expression with only heterozygous (TC) allele was 10.3 ± 7.01(N = 18), whereas samples with minor (CC) allele had 11.9 ± 9.73 (N = 5) compared to normal (TT) healthy controls (9.49 ± 5.13 N = 8). Among RA samples, the average relative mRNA expression in samples with the heterozygous (TC) or minor (CC) allele was 8.67 ± 5.59 (N = 24) compared to 7.38 ± 4.91 (N = 13) in normal (TT) samples. The average relative mRNA expression samples with only heterozygous (TC) allele was 7.42 ± 4.0 (N = 15), whereas samples with the minor (CC) allele had 10.7 ± 7.33 (N = 9) compared to RA normal (TT) samples (7.38 ± 4.91; N = 13). The overall average relative mRNA expression in all samples with heterozygous (TC) or minor allele (CC) was 9.63 ± 6.58 (N = 47) compared to 8.19 ± 4.98 (N = 21) in samples without any SNP. Specifically, the average relative mRNA expression in all samples with only heterozygous (TC) allele was 8.99 ± 5.94 (N = 33) and with only the minor (CC) allele was 11.2 ± 7.91 (N = 14) compared to the samples without any SNP (8.19 ± 4.98; N = 21).
Correlation analyses were also performed to determine if PTPN22:rs2476601 alters PTPN22 expression. The average relative mRNA expression in RA with heterozygous (GA) or minor allele (AA) was 2.79 ± 1.23 (N = 13) compared to 3.40 ± 1.19 (N = 4) in healthy controls with similar SNP and normal (GG) healthy control (3.24 ± 1.91, N = 27). Specifically, the average relative mRNA expression in RA with only heterozygous (GA) allele was 2.77 ± 1.28 (N = 12) compared to 3.40 ± 1.19 (N = 4) in healthy controls with similar SNP and normal (GG) healthy controls (3.24 ± 1.91; N = 27). There was rare occurrence of minor (AA) allele in all samples. Among each group, there was not any significance. Among healthy controls, the average relative mRNA expression in samples with heterozygous (GA) or minor (AA) allele was 3.40 ± 1.19 (N = 4) compared to 3.24 ± 1.91 (N = 27) normal (GG) samples. The average relative mRNA expression with only heterozygous (GA) allele was 3.40 ± 1.19 (N = 4), where there were no samples with minor (AA) allele. Among RA samples, the average relative mRNA expression in samples with the heterozygous (GA) or minor (AA) allele was 2.79 ± 1.23 (N = 13) compared to 2.41 ± 1.98 (N = 24) in normal (GG) samples. The average relative mRNA expression samples with heterozygous (GA) allele only was 2.77 ± 1.28 (N = 12) compared to 3.16 in minor (AA) allele. There was no significant difference in the overall average relative mRNA expression in all samples with heterozygous (GA) or minor allele (AA) and samples without any SNP. Specifically, the average relative mRNA expression in all samples with only heterozygous (GA) allele was 2.92 ± 1.25 (N = 16) and with only the minor (AA) allele was 3.16 (N = 1) compared to the samples without any SNP (2.85 ± 1.97, N = 51).
Effect of PTPN2:rs478582 and PTPN22:rs2476601 on T-Cell Response
To evaluate the effect of PTPN2:rs478582 and/or PTPN22:rs2476601 on T-cell function, we treated purified T-cells from RA (N = 25) and healthy controls (N = 15) with PHA and MAP PPD-like and measured T-cell proliferative response (Figure 4). T-cells were isolated and purified from clinical samples, which tested positive for heterozygous and/or homozygous minor alleles for PTPN2:rs478582 and/or PTPN22:rs2476601.
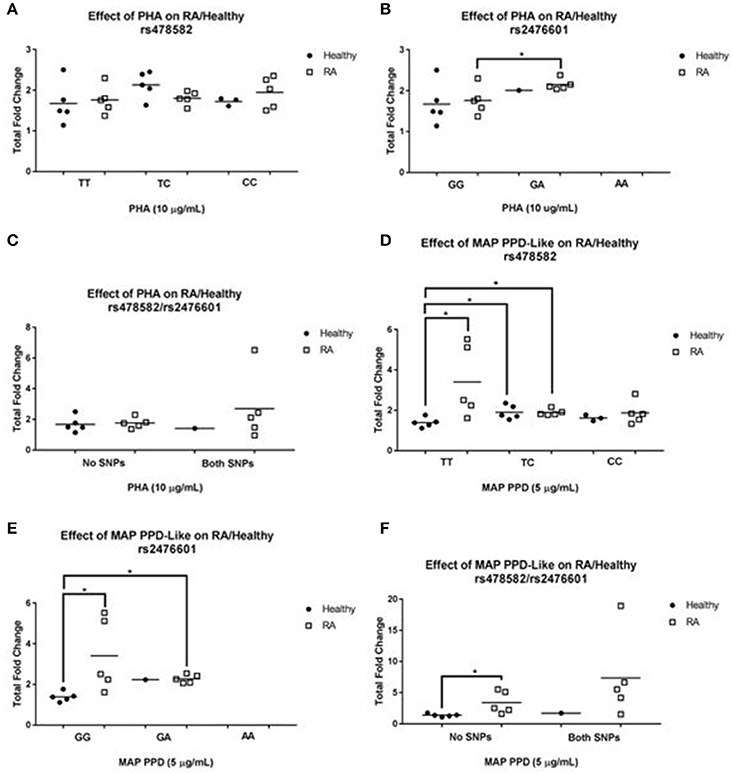
Figure 4. T-cell Response in RA Associated with PTPN2:rs478582 and PTPN22:rs2476601. (A,B) Against Phytohematoagglutonin (PHA). (D,E) Against MAP Purified Protein Derivative-Like (PPD-Like). PTPN2:rs478582- heterozygous allele (TC), minor allele (CC), and wild type (TT). PTPN22:rs2476601-heterozygous allele (GA), minor allele (AA), and wild type (GG). The effect of combined SNPs in PTPN2/22 in T-cells induced with either PHA or MAP PPD-like is illustrated in (C,F). *P-values ≤ 0.05.
Effect of PTPN2:rs478582 on T-Cell Response
Unlike T-cells from RA subjects, there was an increase in T-cell proliferation response between healthy controls with heterozygous (TC) allele (2.1± 0.3-fold increase, N = 5) and those without SNP (TT) (1.7 ± 0.5-fold increase, N = 5) when induced with PHA (Figure 4A). On the contrary, there was 2.0 ± 0.4-fold increase (N = 5) in T-cells response in RA samples with minor (CC) allele compared to a 1.8 ± 0.3-fold increase (N = 5) in RA normal (TT) T-cells. There was no difference in T-cell response in healthy controls with (N = 3) and without (N = 5) minor allele. The effect of heterozygous (TC) allele on T-cell proliferation response from healthy controls treated with MAP PPD-like (Figure 4D) resulted in a 1.9 ± 0.3-fold increase (N = 5) compared to only 1.4 ± 0.2-fold increase (N = 5) in normal (TT) T-cells from healthy control (p-value ≤ 0.05). T-cells from healthy controls with minor (CC) allele responded to MAP PPD-like with 1.6 ± 0.2-fold increase (N = 3) compared to 1.4 ± 0.2 (N = 5) in normal T-cells from healthy controls. RA samples with heterozygous (TC) allele had a significantly higher T-cell proliferation response fold increase to MAP PPD-like (1.9 ± 0.2, N = 5) compared to healthy controls with normal (TT) (1.4 ± 0.2, N = 5, p-value ≤ 0.05).
Effect of PTPN22:rs2476601 on T-Cell Response
The effect of heterozygous (GA) allele on T-cell proliferation response from healthy controls treated with PHA (Figure 4B) resulted in a 2.0-fold increase (N = 1) compared to only 1.7 ± 0.5-fold increase (N = 5) in normal (GG) T-cells from healthy controls. Similarly, T-cells from RA subjects with heterozygous (GA) allele responded with a 2.2 ± 0.1 (N = 5) fold increase compared to a 1.8 ± 0.3-fold increase (N = 5) in normal (GG) T-cells from RA subjects (p-value ≤ 0.05). There were no patient samples with just the minor (AA) allele to do T-cell proliferation. The effect of heterozygous (GA) allele on T-cell proliferation response from healthy controls treated with MAP PPD-like (Figure 4E) resulted in a 2.2 (N = 1) fold increase compared to only 1.4 ± 0.2 (N = 5) fold increase in normal (GG) T-cells from healthy controls. T-cells from RA samples with heterozygous (GA) allele responded lower (2.3 ± 0.2-fold increase, N = 5) to MAP PPD-like than normal T-cells (3.4 ± 1.8-fold increase, N = 5). RA samples with normal (GG) T-cells had a significantly higher response to MAP PPD-like (3.4 ± 1.8, N = 5) compared to healthy controls with normal (GG) (1.4 ± 0.2, N = 5, p-value ≤ 0.05). RA samples with heterozygous (GA) allele had a significantly higher T-cell proliferation response to MAP PPD-like (2.3 ± 0.2, N = 5) compared to healthy controls with normal (GG) (1.4 ± 0.2, N = 5, p-value ≤ 0.05).
Effect of Combined PTPN2:rs478582 and PTPN22:rs2476601 on T-cell Response
Response of T-cells from RA samples with both SNPs treated with PHA was 2.7 ± 2.2-fold increase (N = 5) compared to a 1.8 ± 0.3-fold increase (N = 5) in T-cells from RA samples without SNP (Figure 4C). There was no difference in T-cells response against PHA in samples from healthy controls with (N = 1) and without combined SNPs (N = 5). T-cells from RA samples with both SNPs responded to MAP PPD-like with a 7.4 ± 6.7-fold increase (N = 5) compared to a 3.4 ± 1.8-fold increase (N = 5) in normal RA samples (Figure 4F). Similarly, T-cells from healthy controls with combined SNPs resulted in 1.7-fold increase (N = 1) when treated with MAP PPD-like compared to only 1.4 ± 0.2-fold increase (N = 5) in T-cells from healthy control without SNPs.
Effect of PTPN2:rs478582 and PTPN22:rs2476601 on IFN-γ Expression
The effect of PTPN2:rs478582 and PTPN22:rs2476601 on IFN-γ expression was determined on 35 RA and 24 healthy controls (Figure 5). The average relative mRNA expression of IFN-γ in all samples with PTPN2:rs478582 heterozygous (TC) or minor (CC) allele, regardless of disease, was 0.39 ± 0.31 (N = 38) compared to 0.28 ± 0.16 (N = 21) in normal (TT) samples. Specifically, the average relative mRNA expression of IFN-γ in all samples with PTPN2:rs478582 minor (CC) allele was 0.48 ± 0.39 (N = 12). In RA samples, the average relative mRNA expression of IFN-γ in samples with PTPN2:rs478582 heterozygous (TC) or minor (CC) allele was 0.33 ± 0.32 (N = 22), compared to 0.22 ± 0.16 in 13 normal (TT) RA samples (Figure 5A). Surprisingly, the effect of the PTPN2:rs478582 minor (CC) allele on IFN-γ expression in RA samples was more significant (0.43 ± 0.41; N = 8). However, the average relative mRNA expression of IFN-γ in healthy control samples with and without PTPN2:rs478582 heterozygous (TC) or minor (CC) allele was similar [0.47 ± 0.28 (N = 16), 0.39 ± 0.12 (N = 8), respectively (Figure 5A)]. As observed in RA samples, the effect of PTPN2:rs478582 minor (CC) allele on IFN-γ expression in healthy controls was elevated (0.58 ± 0.39; N = 4). Correlation analyses were also performed to determine if PTPN22:rs2476601 alters IFN-γ expression (Figure 5B). In healthy controls, the average relative mRNA expression of IFN-γ in samples with the heterozygous (GA) or minor allele (AA) for PTPN22:rs2476601 was 0.67 ± 0.28 compared to 0.40 ± 0.21 in normal (GG) samples (p-value ≤ 0.05). There was no significant effect for PTPN22:rs2476601 heterozygous (GA) or minor allele (AA) on IFN-γ expression in RA samples.
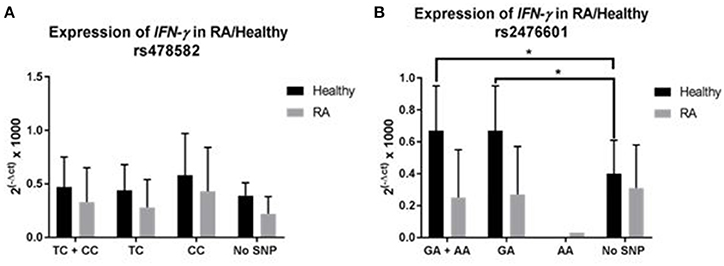
Figure 5. Effect of PTPN2:rs478582/PTPN22:rs2476601 on IFN-γ Expression in RA. (A) IFN-γ expression in RA and healthy control subjects with PTPN2:rs478582. (B) IFN-γ expression in RA and healthy control subjects with PTPN22:rs2476601. *P-values ≤ 0.05.
Effect of PTPN2:rs478582 and PTPN22:rs2476601 on Susceptibility to MAP Infection
Correlation analyses were performed to determine if PTPN2:rs479592 in RA may affected susceptibility to MAP infection (Figure 6A). Out of 55 RA samples with either heterozygous (TC) or minor (CC) allele for PTPN2:rs478582, 18/55 (32.7%) were positive for MAPbacteremia compared to only 2/31 (6.5%; p-value ≤ 0.05) in healthy controls. The OR value was 7.05 (95% CI: 1.51–32.9). Specifically, MAP presence in RA samples with only heterozygous (TC) allele was 13/33 (39.3%) compared to none in 23 healthy controls samples (p-value ≤ 0.05).
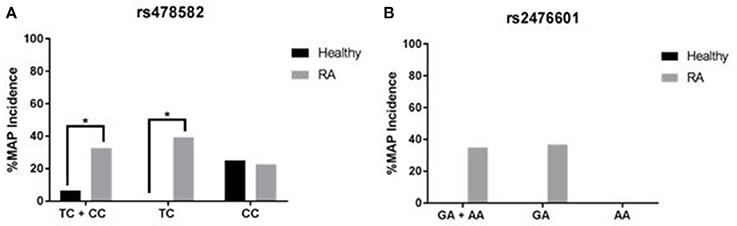
Figure 6. Effect of PTPN2:rs478582 and PTPN22:rs2476601 on Susceptibility to MAP Infection. (A) MAP in the blood from RA and healthy samples associated with PTPN2:rs478582 [heterozygous allele (TC), minor allele (CC) and combined alleles (TC + CC)]. (B) MAP in the blood from RA and healthy samples-associated with PTPN22:s2476601 [heterozygous allele (GA), minor allele (AA), and combined alleles (GA + AA)]. *P-values ≤ 0.05.
Similarly, correlation analyses were performed to determine if PTPN22:rs2476601 in RA may affected susceptibility to MAP infection (Figure 6B). Out of 20 RA samples with either the heterozygous or minor allele for PTPN22:rs2476601, 7/20 (35.0%) had MAPbacteremia compared to none in healthy controls. OR value of significance was 5.00 (95% CI: 0.23–106.1). Specifically, MAP presence in RA samples with heterozygous allele was 7/19 (36.8%) compared to none in healthy controls. MAP was absent in all samples with minor allele.
We also investigated the PTPN2/22 expression in MAP positive samples. Overall, samples with MAPbacteremia had an average relative PTPN2 mRNA expression of 10.0 ± 6.31 (N = 15) compared to 9.00 ± 6.16 (N = 52) in MAP-free samples, regardless of disease. In RA samples with MAP, the average relative mRNA expression of PTPN2 was 9.53 ± 5.42 (N = 12) compared to 7.59 ± 5.28 (N = 25) in MAP-free samples. Only three healthy controls samples were positive for MAP and they had average relative mRNA expression of PTPN2 11.9 ± 10.57 compared to 10.3 ± 6.71 (N = 27) in MAP-free samples. There was no change in PTPN22 expression in samples with or without MAP.
Effect of Combined PTPN2:rs478582, PTPN22:rs2476601, and MAP on PTPN2/22 Expression
The correlation of PTPN2/22 expression in samples with either PTPN2:rs478582 or PTPN22:rs2476601 that had MAP presence was examined as seen in Tables 4, 5. The overall relative mRNA expression of PTPN2 was lower in RA compared to healthy controls (8.22 ± 5.33 and 10.3 ± 6.95, respectively). The effect of PTPN2:rs478582 on PTPN2 gene expression in RA with heterozygous (TC) or minor (CC) allele was 8.67 ± 5.59 (N = 24) compared to 10.6 ± 7.47 (N = 23) in healthy controls with similar SNPs and lower than healthy controls without SNPs (TT) (9.49 ± 5.13; N = 8). In MAP positive RA samples with PTPN2:rs478582, the average relative mRNA expression of PTPN2 was 9.49 ± 6.15 compared to 6.01 ± 4.70 (N = 8) in normal (TT) MAP-free samples. Only one healthy control sample was positive for MAP and had heterozygous (TC) allele had an average relative mRNA expression in PTPN2 of 24.1 compared to 8.36 ± 4.42 (N = 4) in healthy controls without MAP presence and without the SNP.
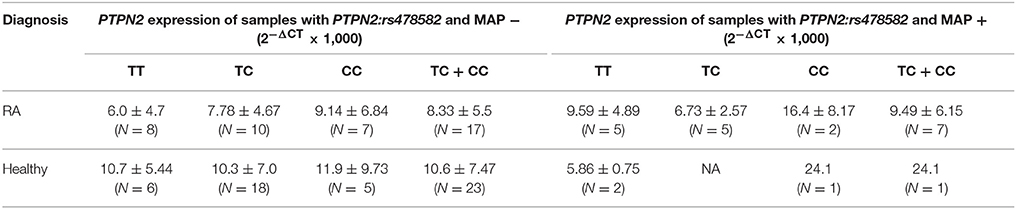
Table 4. Effect of combined PTPN2:rs478582 and MAP presence on PTPN2 expression.
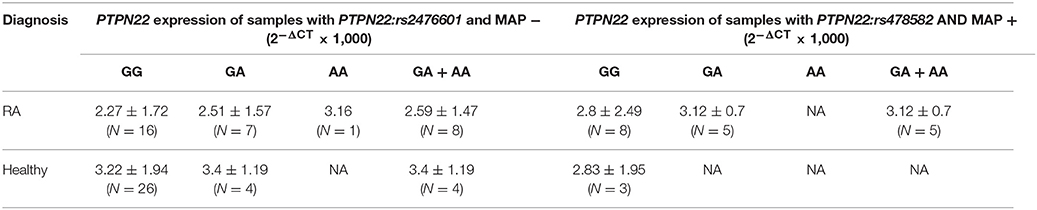
Table 5. Effect of combined PTPN22:rs2476601 and MAP presence on PTPN22 expression.
Similarly, relative mRNA expression of PTPN22 was also lower in RA compared to healthy controls (2.55 ± 1.74, and 3.24 ± 1.84, respectively). The average relative mRNA expression in RA with heterozygous (GA) or minor allele (AA) was 2.79 ± 1.23 (N = 13) compared to 3.40 ± 1.19 (N = 4) in healthy controls with similar SNP and normal (GG) healthy control (3.24 ± 1.91, N = 27). Overall, samples with MAP presence and the PTPN22:rs2476601 heterozygous (GA) or minor (AA) allele had an average relative mRNA expression of 3.12 ± 0.70 (N = 5) compared to 2.85 ± 1.89 (N = 41) in normal MAP free samples. In MAP positive RA samples with PTPN22:rs2476601, the average relative mRNA expression of PTPN22 was 3.12 ± 0.70 (N = 5) compared to normal MAP-free (2.24 ± 1.67; N = 17). None of healthy control samples has both MAP presence and PTPN22:rs2476601.
Only 3 RA samples had PTPN2:rs478582, PTPN22:rs2476601 and were positive for MAP. PTPN2/22 expression and T-cell response were not significantly different from early observation.
Effect of Combined PTPN2:rs478582, PTPN22:rs2476601, and MAP on IFN-γ Expression
Overall, there was no significant difference in IFN-γ mRNA expression in 59 samples with or without MAP presence. The average relative mRNA expression in IFN-γ was 0.35 ± 0.26 in samples with MAP present, while samples without MAP presence (N = 45) was 0.35 ± 0.28. Similar data was observed when gene expression was evaluated in RA and healthy control samples.
Correlation analyses were performed to determine if MAP presence with PTPN2:rs478582 heterozygous (TC) or minor (CC) allele changes gene expression of IFN-γ (Figure 7). Overall, samples with MAP presence and PTPN2:rs478582 (N = 7) had an average relative mRNA expression in IFN-γ of 0.43 ± 0.32, while samples without MAP presence and the SNP (N = 14) was 0.29 ± 0.17. In RA samples, the average relative mRNA expression in IFN-γ in samples with MAP presence and PTPN2:rs478582 (N = 6) was 0.39 ± 0.33 compared to 0.21 ±0.18 (N = 8) in RA samples without MAP presence and without the SNP. In healthy controls, the average relative mRNA expression in IFN-γ in samples with MAP presence and PTPN2:rs478582 (N = 1) was 0.67 compared to 0.39 ± 0.10 in healthy controls without MAP presence and without the SNP (N = 6).
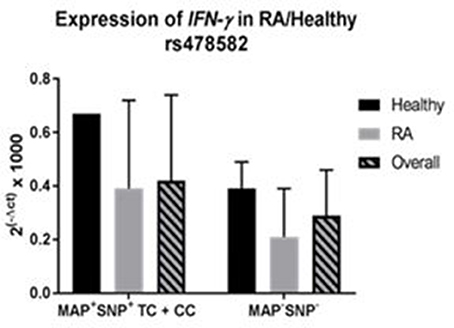
Figure 7. Combined Effect of MAP and PTPN2:rs478582 on IFN-γ Expression in RA.
Correlation analyses were also performed to determine if MAP presence with PTPN22:rs2476601 heterozygous (GA) or minor (AA) allele changes gene expression of IFN-γ. Overall, samples with MAP presence and PTPN22:rs2476601 (N = 5) had an average relative mRNA expression in IFN-γ of 0.15 ± 0.07, while samples without MAP presence and the SNP (N = 34) was 0.32 ± 0.22. In healthy controls, there were no samples with both MAP presence and PTPN22:rs2476601 together. In RA patients, the average relative mRNA expression in IFN-γ in samples with MAP presence and the PTPN22:rs2476601 SNP (N = 5) was 0.15 ± 0.07 compared to 0.27 ± 0.24 in RA patients without MAP presence and without the SNP (N = 17).
Only 3 RA samples had PTPN2:rs478582, PTPN22:rs2476601 and were positive for MAP. IFN-γ expression and T-cell response were not significantly different from early observation.
Effect of Medication to Susceptibility to MAPbacteremia
The effect of the medications taken by RA participants, as shown in Table 1, were evaluated for the susceptibility of MAP. Four different medication groups were studied for MAP susceptibility: hydroxychloroquine (TLR repressor), methotrexate (anti-folate), prednisone (steroid), and anti-TNF-α medications (Humira®, Enbrel®, Simponi®, and Cimzia®). Out of 14 RA patients on hydroxychloroquine, 6 (42.9%) were positive for MAPbacteremia, while 12 out of 37 (32.4%) of RA patients on methotrexate also were positive for MAPbacteremia. For RA patients on prednisone, 4 out of 16 (25.0%) of RA patients were positive for MAPbacteremia, while 6 out of 23 (26.1%) RA patients on anti-TNF-α medications (Humira®, Enbrel®, Simponi®, and Cimzia®) also were positive for MAPbacteremia.
Discussion
Extensive efforts are ongoing to investigate pathogenesis and effective treatment for inflammatory diseases. Current medications are expensive and the side effects are lengthy. For example, RA etiology remains unknown, but there are established protocols for diagnosis of and management of symptoms. However, the side effects of all RA medications are serious and undesirable (Majithia and Geraci, 2007; Dixon et al., 2010; Smolen et al., 2016). Therefore, it is imperative that the pathogenesis of RA is deciphered in order to develop protocols for accurate and early detection and treatment of the disease. RA patients suffer from elevation of pro-inflammatory cytokines such as IFN-γ and TNF-α and their impact on apoptosis and development of chronic inflammation (Majithia and Geraci, 2007; McInnes and Schett, 2011; Smolen et al., 2016). Only environmental factors and genetic predisposition mutations have been linked to RA (Klareskog et al., 2011; Yarwood et al., 2014; Fisher et al., 2015; Smolen et al., 2016). This study is focused on investigating the effect of SNPs on key negative regulators genes such as PTPN2/22 expression and their impact on upregulation of pro-inflammatory cytokines, apoptosis and inflammation. We hypothesized that heterozygous and/or homozygous minor allele mutation(s) in health-keeping genes such as PTPN2/22 in RA lead to elevated IFN-γ, TNF-α, apoptosis, and development of inflammation. To our knowledge, this is the first study designed to elucidate the molecular cause of inflammation in RA in association with environmental triggers such as MAP. The latter has been associated with similar inflammation in CD, T1D, multiple sclerosis, and others (Naser et al., 2009a,b, 2013; Masala et al., 2011; Sharp et al., 2015). This study is first to report the detection of MAP DNA in more than of one third of RA patients (Figure 2B). The data is significant, intriguing, and should be a motive to expand future investigations to include a larger pool of samples. As well-advertised, the incidence of M. tuberculosis infection in RA, is among the most accepted side effect of the treatment (Dixon et al., 2010; McInnes and Schett, 2011; Smolen et al., 2016). Therefore, detection of MAP infection in RA patients should be investigated further as to whether it is a complication of the treatment or a possible culprit of the disease. Although MAP IS900 DNA is good in detecting MAP presence in patient samples, it does not provide information about the MAP bacteria viability. This in turn does not show accurate status of either active or previous infection in the patient sample. Thus, culturing of the blood from RA patients is necessary to determine if an active MAP infection is present in the patients.
Genetic predisposing is key for susceptibility to disease, severity of inflammation and possible ability to respond to treatment. Due to the large number of published SNPs in PTPN2/22, we selected 9 SNPs in this study based on shared occurrence in other diseases with similar approved treatment protocol (McInnes and Schett, 2011; Yarwood et al., 2014; Sharp et al., 2015; Smolen et al., 2016). Specifically, we focused on SNPs in PTPN2/22, which increase susceptibility to RA and CD. The latter is well-investigated in our laboratory in association with MAP (Naser et al., 2004, 2009b; Sharp et al., 2015). This study identified PTPN2:rs478582 to be significant in RA (p-values ≤ 0.05, OR = 2.28) compared to healthy controls (Figure 3A). Similarly, PTPN22:rs2476601 was significant in RA (p-values ≤ 0.05, OR = 5.90) compared to healthy controls (Figure 3B). The data specifically linked PTPN2:rs478582 minor (CC) allele to be more significantly associated with RA (p-values ≤ 0.05). In short, our data suggest to clinicians that minor (CC) allele in PTPN2 increases the risk of acquiring RA by a fold of 2.1. Moreover, PTPN22:rs2476601 heterozygous (GA) allele in PTPN22 was more significant in RA (p-values ≤ 0.05), indicating that patients with this SNP are at risk of acquiring RA by a fold of 4.3. Further examination of RA genotyping showed that patient samples with both PTPN2:rs478582 and PTPN22:rs2476601 alleles (regardless of heterozygous or minor alleles) showed to be more significant (p-values ≤ 0.05) compared to healthy controls, showing a 6.5-fold increased risk of developing RA. Some of the limitations of looking into SNPs in a diverse population, such as from this study, is that it is difficult to determine the alterations of allelic distribution between different population groups. Thus, it is important that further population studies that focus on examining PTPN2/22 SNPs from other subpopulation groups, such as race, country of origin, and age/gender in RA patients should be done.
The effect of SNPs on PTPN2/22 gene expression and function have been debated heavily in the literature (Vang et al., 2005; Serrano et al., 2013; Spalinger et al., 2013; Sharp et al., 2015). This study demonstrated that RA samples with either PTPN2:rs478582/PTPN22:rs2476601 heterozygous or minor alleles could potentially alter the PTPN2/22 gene or the protein activity of PTPN2/22 in T-cells, thus could possibly void the negative regulatory function of PTPN2/22. The effects of PTPN2:rs478582/PTPN22:rs2476601 in PTPN2/22 were also examined further to determine the effect on T-cell and production of IFN-γ.
Since PTPN2/22 is found in all T-cell types, we decided not to segregate the T-cell subpopulations and instead look into total T-cell activity. However, further studies need to be done on the effects of SNPs in PTPN2/22 in different subpopulations of T-cells. Stimulation of T-cells from RA samples associated with PTPN2:rs478582 and induced with PHA led marked increase in T-cell proliferation. T-cells from RA patients associated PTPN22:rs2476601 had even more significant increase in T-cell proliferation (p-values ≤ 0.05). Moreover, it was shockingly surprising to see T-cell reactivity response treatment with MAP PPD-like. Specifically, T-cells, isolated from the blood of RA patients associated with PTPN2:rs478582/PTPN22:rs2476601 combined SNPs, proliferated by several folds more than those cells from health controls. Thus, T-cells from RA samples associated with SNPs in PTPN2/22 seem to demonstrate three characteristics: first, they are hyperactive, second they seem to lack a negative feedback control, and third they reacted to MAP PPD-like significantly indicating prior exposure to MAP antigens. Hyperactive T-cells with lack of negative feedback control may explain the marked increase in pro-inflammatory cytokines such as TNF-α and IFN-γ in RA. The examination of T-cells in this study has been an exploratory study, thus it is necessary to examine bigger populations of RA and health control subjects in the future. Along with this, further investigation on the outcome of the other immune cells, such as B-cells, NK cells, and macrophages, need to be examined in RA patients with SNPs in PTPN2/22 to conclude how the hyper-proliferative T-cells react to other immune cells.
The hyperactivity to MAP PPD-like in the RA T-cells may be correlated to presence of MAP in RA samples and possibly activation of M. tuberculosis in some RA patients with biologic drugs treatments. The study provided more evidence that SNPs in PTPN2/22 may have increased susceptibility to MAP infection as shown in Figure 6. Specifically, PTPN2:rs478582 correlated with MAP infection in 32.7% (OR = 7.05) RA patients. Similarly, PTPN22:rs2476601 correlated with MAP infection in 35.0% (OR = 5.00) RA patients (p-values ≤ 0.05). The data also demonstrated that presence of MAP did not alter PTPN2/22 expression.
To elucidate whether medications may have any effect on the outcome of this study, we examined the effect of current medications taken by the RA participants on the risk of susceptibility to MAP infection. As shown in Table 1, out of all the DMARDs (hydroxychloroquine, methotrexate, prednisone, Humira®, Enbrel®, etc.) that the RA patients were on, hydroxychloroquine was found to increase MAP susceptibility the most in RA patients by a 1.3-fold change compared to RA patients not on hydroxychloroquine and had MAPbacteremia. These findings suggest that more investigation is needed by testing larger number of patients with RA. We also discovered that IFN-γ expression was lower in RA patients who are on DMARDs treatment compared to RA patients who are on different treatments (Table 1). Specifically, blood samples from RA patients treated with Humira® expressed lower IFN-γ (0.15 ± 0.10, N = 11) compared to blood samples from other RA patients (0.29 ± 0.27; p-values ≤ 0.05) or even healthy controls (0.44 ± 0.24; p-values ≤ 0.05). Moreover, RA samples associated with PTPN2:rs478582/PTPN22:rs2476601 heterozygous or minor alleles had higher IFN-γ expression than RA group without (Figure 5). These finding demonstrates that SNPs in PTPN2/22 may led to elevated IFN-γ levels and inflammation in RA patients. However, since we focused only on PTPN2/22 on the control of IFN-γ expression in this study, we did not examine the other cytokines that control IFN-γ production. Further investigation is needed to examine the effects of both pro-inflammatory cytokines, such as TNF-α, and anti-inflammatory cytokines, such as IL-6, in subjects with SNPs in PTPN2/22.
Overall, the data supports our hypothesis that SNPs in PTPN2/22 leads to loss functions of these genes resulting in hyper-proliferative T-cells and increase susceptibility to Mycobacteria including MAP. Along with genetic testing for SNPs and proper treatment, personalized treatment for RA is plausible. More studies are encouraged to explore the incidence and impact of these SNPs on health keeping genes and susceptibility to infection in RA.
Author Contributions
RS, Ph.D. candidate, has performed all experiments, and collected and analyzed all data in this study. He was also instrumental in designing the experiments and writing the manuscript. SB is the clinical coordinator in this study and has supervised recruitment of subjects, collection of clinical samples, and transmitting of relevant data to the investigators. She played a vital role in analyzing the data and revising the manuscript. SN is the corresponding author on the manuscript and the primary investigator of the study. He managed the entire study, supervised all experiments, and helped analyze and interpret data and writing of the manuscript.
Funding
This study was funded, in part, by the Crohn's Disease Grant funded by the State of Florida.
Conflict of Interest Statement
The authors declare that the research was conducted in the absence of any commercial or financial relationships that could be construed as a potential conflict of interest.
Acknowledgments
Special thanks to the State of Florida for the legislative financial funding and to members of SN research team. Our thanks are also due to the staff in SB office and all those who participated in this study.
References
Aletaha, D., Neogi, T., Silman, A. J., Funovits, J., Felson, D. T., Bingham, C. O. III., et al. (2010). 2010 Rheumatoid arthritis classification criteria: an American college of rheumatology/European league against rheumatism collaborative initiative. Arthritis Rheum. 62, 2569–2581. doi: 10.1002/art.27584
Allen, P. B., Olivera, P., Emery, P., Moulin, D., Jouzeau, J. Y., Netter, P., et al. (2017). Review article: moving towards common therapeutic goals in Crohn's disease and rheumatoid arthritis. Aliment. Pharmacol. Ther. 45, 1058–1072. doi: 10.1111/apt.13995
Bartelds, G. M., Wijbrandts, C. A., Nurmohamed, M. T., Stapel, S., Lems, W. F., Aarden, L., et al. (2007). Clinical response to adalimumab: relationship to anti-adalimumab antibodies and serum adalimumab concentrations in rheumatoid arthritis. Ann. Rheum. Dis. 66, 921–926. doi: 10.1136/ard.2006.065615
Brennan, F. M., and McInnes, I. B. (2008). Evidence that cytokines play a role in rheumatoid arthritis. J. Clin. Invest. 118, 3537–3545. doi: 10.1172/JCI36389
Dixon, W. G., Hyrich, K. L., Watson, K. D., Lunt, M., Galloway, J., Ustianowski, A., et al. (2010). Drug-specific risk of tuberculosis in patients with rheumatoid arthritis treated with anti-TNF therapy: results from the British Society for Rheumatology Biologics Register (BSRBR). Ann. Rheum. Dis. 69, 522–528. doi: 10.1136/ard.2009.118935
Ebringer, A., and Wilson, C. (2000). HLA molecules, bacteria and autoimmunity. J. Med. Microbiol. 49, 305–311. doi: 10.1099/0022-1317-49-4-305
Egerer, K., Feist, E., and Burmester, G. (2009). The serological diagnosis of rheumatoid arthritis. Dtsch. Arztebl. Int. 106, 159–163. doi: 10.3238/arztebl.2009.0159
Espino-Paisan, L., de la Calle, H., Fernandez-Arquero, M., Figuredo, M. A., de la Concha, E. G., Urcelay, E., et al. (2011). A polymorphism in PTPN2 gene is associated with an earlier onset of type 1 diabetes. Immunogenetics 63, 255–258. doi: 10.1007/s00251-010-0500-x
Fakhrudin, N., Hastuti, S., Andriani, A., Widyarini, S., and Nurrochmad, A. (2015). Study on the antiinflammatory activity of Artocarpus altilis leaves extract in mice. Int. J. Pharmacognosy Phytochem. Res. 7, 1080–1085.
Fan, Z. D., Wang, F. F., Huang, H., Huang, N., Ma, H. H., Guo, Y. H., et al. (2015). STAT4 rs7574865 G/T and PTPN22 rs2488457 G/C polymorphisms influence the risk of developing juvenile idiopathic arthritis in Han Chinese patients. PLoS ONE 10:e0117389. doi: 10.1371/journal.pone.0117389
Fisher, B. A., Cartwright, A. J., Quirke, A. M., de Pablo, P., Romaguera, D., Panico, S., et al. (2015). Smoking, Porphyromonas gingivalis and the immune response to citrullinated autoantigens before the clinical onset of rheumatoid arthritis in a Southern European nested case-control study. BMC Musculoskelet. Disord. 16:331. doi: 10.1186/s12891-015-0792-y
Georgiadis, A. N., Tzambouras, N., Ioachim, E., Tsianos, E. V., Agnantis, N., and Drosos, A. A. (2003). Seropositive rheumatoid arthritis associated with Crohn's disease. Clin. Exp. Rheumatol. 21, 363–365.
Gurzov, E. N., Stanley, W. J., Brodnicki, T. C., and Thomas, H. E. (2015). Protein tyrosine phosphatases: molecular switches in metabolism and diabetes. Trends Endocrinol. Metab. 26, 30–39. doi: 10.1016/j.tem.2014.10.004
Klareskog, L., Malmstrom, V., Lundberg, K., Padyukov, L., and Alfredsson, L. (2011). Smoking, citrullination and genetic variability in the immunopathogenesis of rheumatoid arthritis. Semin. Immunol. 23, 92–98. doi: 10.1016/j.smim.2011.01.014
Kuek, A., Hazleman, B. L., and Ostor, A. J. K. (2007). Immune-mediated inflammatory diseases (IMIBs) and biological therapy: a medical revolution. Postgrad. Med. J. 978, 251–260. doi: 10.1136/pgmj.2006.052688
Kvien, T. K., Uhlig, T., Odegard, S., and Heiberg, M. S. (2006). Epidemiological aspects of rheumatoid arthritis. Ann. N. Y. Acad. Sci. 1069, 212–222. doi: 10.1196/annals.1351.019
Majithia, V., and Geraci, S. A. (2007). Rheumatoid arthritis: diagnosis and management. Am. J. Med. 120, 936–939. doi: 10.1016/j.amjmed.2007.04.005
Masala, S., Paccagnini, D., Cossu, D., Brezar, V., Pacifico, A., Ahmed, N., et al. (2011). Antibodies recognizing Mycobacterium avium paratuberculosis epitopes cross-react with the beta-cell antigen ZnT8 in Sardinian type 1 diabetic patients. PLoS ONE 6:e26931. doi: 10.1371/journal.pone.0026931
McInnes, I. B., and Schett, G. (2011). The pathogenesis of rheumatoid arthritis. N. Engl. J. Med. 365, 2205–2219. doi: 10.1056/NEJMra1004965
Naser, S. A., Collins, M. T., Crawford, J. T., and Valentine, J. F. (2009a). Culture of Mycobacterium avium subspecies paratuberculosis (MAP) from the blood of patients with Crohn's disease: a follow-up blind multi center investigation. Open Inflamm. J. 2, 22–23.
Naser, S. A., Ghobrial, G., Romero, C., and Valentine, J. F. (2004). Culture of Mycobacterium avium subspecies paratuberculosis from the blood of patients with Crohn's disease. Lancet 364, 1039–1044. doi: 10.1016/S0140-6736(04)17058-X
Naser, S. A., Romero, C., Elwasila, S., Ghonaim, M., Naser, N., and Valentine, J. F. (2009b). Functional dysregulation of PBMC and PMN in Crohn's Disease. Open Inflamm. J. 2, 24–33. doi: 10.2174/1875041900902010024
Naser, S. A., Thanigachalam, S., Dow, C. T., and Collins, M. T. (2013). Exploring the role of Mycobacterium avium subspecies paratuberculosis in the pathogenesis of type 1 diabetes mellitus: a pilot study. Gut Pathog. 5:14. doi: 10.1186/1757-4749-5-14
Nishimura, K., Sugiyama, D., Kogata, Y., Tsuji, G., Nakazawa, T., Kawano, S., et al. (2007). Meta-analysis: diagnostic accuracy of anti-cyclic citrullinated peptide antibody and rheumatoid factor for rheumatoid arthritis. Ann. Intern. Med. 146, 797–808. doi: 10.7326/0003-4819-146-11-200706050-00008
Pincus, T., and Sokka, T. (2009). Laboratory tests to assess patients with rheumatoid arthritis: advantages and limitations. Rheum. Dis. Clin. North Am. 35, 731–734. doi: 10.1016/j.rdc.2009.10.007
Qu, H., Tessier, M. C., Hudson, T. J., and Polychronakos, C. (2005). Confirmation of the association of the R620W polymorphism in the protein tyrosine phosphatase PTPN22 with type 1 diabetes in a family based study. J. Med. Genet. 42, 266–270. doi: 10.1136/jmg.2004.026971
Rodriguez-Rodriguez, L., Taib, W. R., Topless, R., Steer, S., Gonzalez-Escribano, M. F., et al. (2011). The PTPN22 R263Q polymorphism is a risk factor for rheumatoid arthritis in Caucasian case-control samples. Arthritis Rheum. 63, 365–372. doi: 10.1002/art.30145
Serrano, A., Marquez, A., Mackie, S. L., Carmona, F. D., Solans, R., Miranda-Filloy, J. A., et al. (2013). Identification of the PTPN22 functional variant R620W as susceptibility genetic factor for giant cell arteritis. Ann. Rheum. Dis. 72, 1882–1886. doi: 10.1136/annrheumdis-2013-203641
Sharp, R. C., Abdulrahim, M., Naser, E. S., and Naser, S. A. (2015). Genetic variations in PTPN2 and PTPN22: role in the pathogenesis of type 1 diabetes and Crohn's disease. Front. Cell. Infect. Microbiol. 5:95. doi: 10.3389/fcimb.2015.00095
Skinningsrud, B., Husebye, E. S., Gervin, K., Lovas, K., Blomhoff, A., Wolff, A. B., et al. (2008). Mutation screening of PTPN22: association of the 1858T-allele with Addison's disease. Eur. J. Hum. Genet. 16, 977–982. doi: 10.1038/ejhg.2008.33
Smolen, J. S., Aletaha, D., Koeller, M., Weisman, M. H., and Emery, P. (2007). New therapies for treatment of rheumatoid arthritis. Lancet. 3701, 861–1874. doi: 10.1016/S0140-6736(07)60784-3
Smolen, J. S., Aletha, D., and McInnes, I. B. (2016). Rheumatoid arthritis. Lancet. 388, 22–28. doi: 10.1016/S0140-6736(16)30173-8
Spalinger, M. R., Lang, S., Weber, A., Frei, P., Fried, M., Rogler, G., et al. (2013). Loss of protein tyrosine phosphatase nonreceptor type 22 regulates interferon-gamma-induced signialing in human monocytes. Gastroenterology 144, 978–988. doi: 10.1053/j.gastro.2013.01.048
Sullivan, R. R., Faris, B. R., Eborn, D., Grieger, D. M., Cino-Ozuna, A. G., and Rozell, T. G. (2013). Follicular expression of follicle stimulating hormone receptor variants in the ewe. Reprod. Biol. Endocrinol. 11:113. doi: 10.1186/1477-7827-11-113
Taniyama, M., Maruyama, T., Tozaki, T., Nakano, Y., and Ban, Y. (2010). Association of PTPN22 haplotypes with type 1 diabetes in the Japanese population. Hum. Immunol. 71, 795–798. doi: 10.1016/j.humimm.2010.05.016
Taylor, P., Gartemann, J., Hsieh, J., and Creeden, J. (2011). A systematic review of serum biomarkers anti-cyclic citrullinated peptide and rheumatoid factor as tests for rheumatoid arthritis. Autoimmune Dis. 2011, 1–18. doi: 10.4061/2011/815038
Vang, T., Congia, M., Macis, M. D., Musuemci, L., Orru, V., Zavattari, P., et al. (2005). Autoiumme-associated lymphoid tyrosine phosphatase is a gain-of-function variant. Nat. Genet. 37, 1317–1319. doi: 10.1038/ng1673
van Vollenhoven, R. F. (2009). Sex differences in rheumatoid arthritis: more than meets the eye…. BMC Med. 7:12. doi: 10.1186/1741-7015-7-12
Voight, B. F., and Cotsapas, C. (2012). Human genetics offers an emerging picture of common pathways and mechanisms in autoimmunity. Curr. Opin. Immunol. 24, 552–557. doi: 10.1016/j.coi.2012.07.013
Yarwood, A., Huizinga, W. J., and Worthington, J. (2014). The genetics of rheumatoid arthritis: risk and protection in different stages of the evolution of RA. Rheumatology 55, 199–209. doi: 10.1093/rheumatology/keu323
Zhang, J. X., He, J. H., Wang, J., Song, J., Lei, H. B., Wang, J., et al. (2014). Associations between PTPN2 polymorphisms and susceptibility to ulcerative colitis and Crohn's disease: a meta-analysis. Inflamm. Res. 63, 71-79. doi: 10.1007/s00011-013-0673-5
Keywords: rheumatoid arthritis, PTPN2, PTPN22, PTPN2/22, mycobacteria, SNPs, Crohn's disease
Citation: Sharp RC, Beg SA and Naser SA (2018) Polymorphisms in Protein Tyrosine Phosphatase Non-receptor Type 2 and 22 (PTPN2/22) Are Linked to Hyper-Proliferative T-Cells and Susceptibility to Mycobacteria in Rheumatoid Arthritis. Front. Cell. Infect. Microbiol. 8:11. doi: 10.3389/fcimb.2018.00011
Received: 30 October 2017; Accepted: 09 January 2018;
Published: 25 January 2018.
Edited by:
Adel M. Talaat, University of Wisconsin-Madison, United StatesReviewed by:
Somashekarappa G. Nanjappa, University of Illinois at Urbana–Champaign, United StatesPaul M. Coussens, Michigan State University, United States
Copyright © 2018 Sharp, Beg and Naser. This is an open-access article distributed under the terms of the Creative Commons Attribution License (CC BY). The use, distribution or reproduction in other forums is permitted, provided the original author(s) or licensor are credited and that the original publication in this journal is cited, in accordance with accepted academic practice. No use, distribution or reproduction is permitted which does not comply with these terms.
*Correspondence: Saleh A. Naser, saleh.naser@ucf.edu