Akkermansia muciniphila as a Model Case for the Development of an Improved Quantitative RPA Microbiome Assay
 Heather J. Goux
 Dimple Chavan
 Mary Crum2
  Richard C. Willson
- 1Department of Biology and Biochemistry, University of Houston, Houston, TX, United States
- 2Department of Chemical and Biomolecular Engineering, University of Houston, Houston, TX, United States
- 3Tecnológico de Monterrey-ITESM Campus Monterrey, Monterrey, Mexico
Changes in the population levels of specific bacterial species within the gut microbiome have been linked to a variety of illnesses. Most assays that determine the relative abundance of specific taxa are based on amplification and sequencing of stable phylogenetic gene regions. Such lab-based analysis requires pre-analytical sample preservation and storage that have been shown to introduce biases in the characterization of microbial profiles. Recombinase polymerase amplification (RPA) is an isothermal nucleic acid amplification method that employs commercially available, easy-to-use freeze-dried enzyme pellets that can be used to analyze specimens rapidly in the field or clinic, using a portable fluorometer. Immediate analysis of diverse bacterial communities can lead to a more accurate quantification of relative bacterial abundance. In this study, we discovered that universal bacterial 16S ribosomal DNA primers give false-positive signals in RPA analysis because manufacturing host Escherichia coli DNA is present in the RPA reagents. The manufacturer of RPA reagents advises against developing an RPA assay that detects the presence of E. coli due to the presence of contaminating E. coli DNA in the reaction buffer (www.twistdx.co.uk/). We, therefore, explored four strategies to deplete or fragment extraneous DNA in RPA reagents while preserving enzyme activity: metal-chelate affinity chromatography, sonication, DNA cleavage using methylation-dependent restriction endonucleases, and DNA depletion using anti-DNA antibodies. Removing DNA with anti-DNA antibodies enabled the development of a quantitative RPA microbiome assay capable of determining the relative abundance of the physiologically-important bacterium Akkermansia muciniphila in human feces.
Introduction
The human intestinal microbiome contains ≥1014 bacteria representing over 400 species (Ott et al., 2004). Recent publications have suggested that the composition of the gut microbiota is significantly associated with health and disease (Shreiner et al., 2015; Lloyd-Price et al., 2016; Lynch and Pedersen, 2016; Duvallet et al., 2017). Relatively small changes in bacterial levels from key taxonomic groups have been linked to a wide range of illnesses, including inflammatory bowel disease, Crohn's disease, colon cancer, and hyperglycemia (Watterlot et al., 2008; Kang et al., 2013; Scher et al., 2013; Scheperjans et al., 2015; Schneeberger et al., 2015; Dao et al., 2016; Rosa et al., 2017; Wong et al., 2017). The use of pro- or prebiotics or fecal microbiota transplantation have been shown to alter the microbial profile of the gut, in some cases improving health (Muegge, 2011; Petrof et al., 2013; Colman and Rubin, 2014; Cui et al., 2015; Plovier et al., 2016; Routy et al., 2018). Development of a method to monitor the abundance of beneficial microorganisms within the complex milieu of the gut microbiome is therefore of considerable interest.
A variety of techniques are available for analyzing microbiota composition, including small-subunit ribosomal RNA (16S rRNA) gene sequencing, whole-metagenome shotgun sequencing, quantitative polymerase chain reaction assays, and microbial culture (Morgan and Huttenhower, 2012). All prokaryotes harbor a 16S rRNA gene, which includes both conserved sequences and species-specific hypervariable regions. Well-developed databases (e.g., GreenGenes, Ribosomal Database Project, and Silva) are available to classify 16S rRNA sequence data at high taxonomic resolution for use in microbial population profiling. Sequencing short 16S rRNA gene segments often is more cost-effective than sequencing the entire metagenome and thus enables cohort studies large enough to identify statistically significant correlations with disease states (Morgan and Huttenhower, 2012; Hermann-Bank et al., 2013; Robinson et al., 2016). Although 16S rRNA sequencing is currently the favored tool for the detection of bacterial biomarkers, qPCR is faster, cheaper, and easier to interpret, making it the preferred method for biomarker validation (Watterlot et al., 2008; Kostic et al., 2012; Kang et al., 2013; Scher et al., 2013; Zhang et al., 2016). In addition, qPCR often enables more accurate quantification of specific species than 16S rRNA sequencing (Hermann-Bank et al., 2013). However, PCR and 16S detection methods can be subject to biases associated with pre-analytical sample preservation, storage, and DNA extraction (Robinson et al., 2016), leading to inaccuracies in fecal bacterial quantification. Reducing the amount of sample handling and eliminating sample storage can lead to a more accurate estimation of bacterial abundance within the gut.
Recombinase polymerase amplification (RPA) is an isothermal amplification nucleic acid detection method suitable for analysis of samples at the point of need (Euler et al., 2012a; Abd El Wahed et al., 2013, 2015; Rosser et al., 2015; Bonney et al., 2017; Kim and Lee, 2017). Rather than heat denaturation, RPA uses recombinases (E. coli RecA) to form a complex with signal stranded oligonucleotides (30–35 nt primers) and single strand binding proteins (SSBs) assist site-specific D-loop strand invasion (Piepenburg et al., 2006) of dsDNA. At a constant temperature of 37–42°C, Sau (Staphylococcus aureus) DNA polymerase performs primer-extension to generate a new strand of DNA. Much like PCR, the newly generated product goes on to become the template for future rounds of amplification. Incorporation of a cleavable self-quenched exo-probe or SYBR Green dye allows for real-time fluorescence monitoring of RPA assays, thus enabling quantitative analysis typically within 10–15 min (Crannell et al., 2014, 2015; Kim and Lee, 2016, 2017; Moore and Jaykus, 2017). As RPA utilizes freeze-dried, reaction-ready enzyme pellets (manufactured by TwistDx, Inc.) and a portable fluorometer, the technique can be readily adapted to field applications (Abd El Wahed et al., 2015). Immediate field-based analysis of diverse bacterial communities can lead to a more accurate quantification of relative bacterial abundance.
Although RPA can provide valuable data for quantifying bacterial taxa within the gut microbiome, transitioning from an exploratory 16S rRNA–based sequencing study to a PCR/RPA-based confirmatory study can be complicated by differences in the way taxonomic abundance is defined (Ott et al., 2004; Morgan and Huttenhower, 2012; Gloor et al., 2017). In real-time RPA, bacteria are quantified according to a standard curve with abundance defined in terms of gene copies per unit volume (Euler et al., 2012b; Crannell et al., 2014, 2015; Kim and Lee, 2017). By contrast, in 16S rRNA–based sequencing, bacterial abundance is estimated based on the fraction of total observed 16S rRNA sequences assignable to a particular taxonomic group (with the complication that the number of 16S rRNA genes per genome can vary; Robinson et al., 2016). Thus, correlations based on 16S rRNA–based sequencing are relative rather than absolute (Ott et al., 2004); as such, subsequent quantitative PCR/RPA data should ideally be reported in terms of relative abundance. One way this has been achieved in gut bacterial PCR studies is by calculating the ratio of group-specific to total 16S rRNA abundance (Hermann-Bank et al., 2013; Brukner et al., 2015; Zhang et al., 2016). This method can be easily adapted to RPA to quantify target organisms.
The importance of accurate quantification of specific organisms within the gut microbiome can be illustrated by the case of diabetes, which affected 9.4% of Americans (30.3 million individuals) in 2015 (Centers for Disease Control and Prevention, 2017). Akkermansia muciniphila is a gram-negative, anaerobic, mucin-degrading bacterium commonly found in high abundance in the human gut. Low abundance of A. muciniphila has been linked to hyperglycemia, glucose intolerance, obesity, and type 2 diabetes (Everard et al., 2011, 2013; Louis et al., 2016; Yassour et al., 2016). A. muciniphila is also a key producer of short-chain fatty acids in the gut, which have been shown to inhibit inflammation and aid in metabolic dysregulation (Dao et al., 2016). In several mouse studies, administering A. muciniphila to diabetic subjects improved their metabolic functions and aided in weight loss (Greer et al., 2016; Plovier et al., 2016; Hänninen et al., 2017). The medical community may soon need an inexpensive screening tool for identifying individuals with lower fecal A. muciniphila abundance that could benefit from therapeutic intervention. We, therefore, chose A. muciniphila as a model organism in developing a quantitative RPA microbiome assay.
During assay development, we found that non-specific amplification occurred using 16S rRNA universal primer pairs in the absence of added DNA template, reducing the accuracy of total bacterial load quantification. Amplification of residual Escherichia coli production-host DNA contained in the recombinant RPA reagents was identified as the confounding factor and was confirmed by Sanger sequencing. Relative A. muciniphila abundance is calculated from the ratio of A. muciniphila to total 16S rRNA abundance. Therefore, an inability to quantify the total bacterial load precludes accurate estimation of the relative abundance of A. muciniphila. To resolve this issue, we explored four strategies to deplete or destroy extraneous E. coli DNA while preserving RPA reagent functionality: (1) metal-chelate affinity capture; (2) sonication; (3) methylation-dependent restriction endonuclease digestion; and (4) DNA capture/removal using anti-DNA antibodies. We show that removal of interfering DNA using anti-DNA antibodies was the most effective strategy. Using RPA reagents treated with anti-DNA antibodies, we then constructed a quantitative total bacterial standard curve and determined the relative abundance of A. muciniphila in a human fecal sample to demonstrate the application of the quantitative RPA microbiome assay.
Materials and Methods
Design of Bacteria-Specific Primers
It is suggested that RPA primers be 30–35 nt long for optimal amplification of the template. Only 9% of previously published RPA primers are below 30 nt in length (Daher et al., 2016). RPA was attempted with widely-used 16S universal primers (primer set 2; Table 1) which resulted in a significant delay in amplification. We, therefore, undertook to design our own bacteria-specific primers 28–35 nt in length and with GC content of 30–70%. Highly-conserved regions within the 16S rRNA gene were chosen as the targets for bacteria-specific RPA primers. When designing a 16S gene specific universal primer, it is likely that large increases in primer length would lead to an increase in the number of mismatches. However, guidelines for RPA primer design are not as stringent as those for the design of PCR primers. Longer RPA primers tolerate some additional mismatches while still achieving adequate amplification (Daher et al., 2015). The National Center for Biotechnology Information BLAST tool was used to test each primer's potential match to all publicly-available bacteria genome sequences. A match was defined for this purpose as less than six total mismatches and less than four mismatches in the last six 3′ nucleotides of either the primer or the target sequence. Primer sequences complementary to human DNA were identified using BLAST and excluded in order to reduce the probability of amplifying human DNA. The free-energy calculation function of the OligoAnalyzer tool (http://www.idtdna.com/analyzer/Applications/OligoAnalyzer) was used to assess the potential formation of secondary structures (primer dimers and hairpins) and avoid inter- or intra-molecular interactions with a ΔG of <−6 kcal.mol−1.
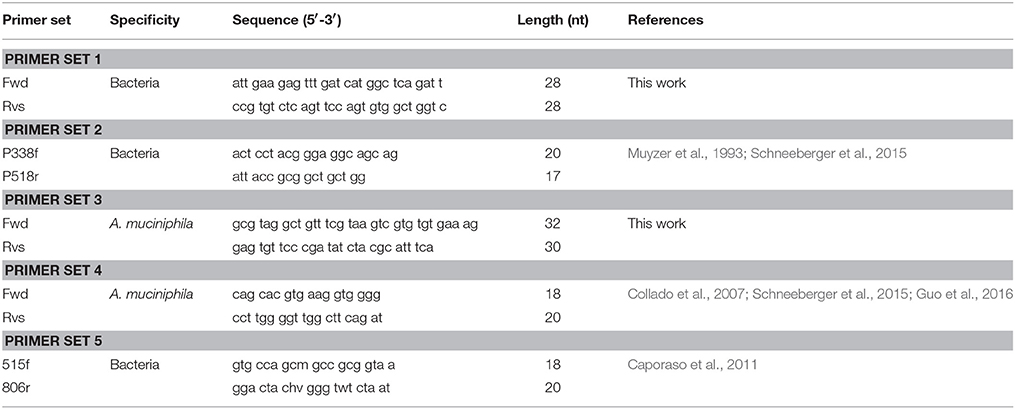
Table 1. General bacteria- and Akkermansia muciniphila–specific primer pairs.
During A. muciniphila specific primer design, two different A. muciniphila 16S rRNA gene reference sequences (American Type Culture Collection [ATCC] strain BAA-835; accession number NR_074436.1 and accession number NR_042817.1) were downloaded from GenBank (http://www.ncbi.nlm.nih.gov/genbank) and aligned using SeaView (Gascuel et al., 2010) to identify species-specific conserved sequences within the 16S rRNA gene variable region. The newly-developed A. muciniphila specific primers (primer set 3, Table 1) were tested for species-specificity using an NCBI BLAST search tool to confirm zero mismatches to all 39 A. muciniphila genomes in the GenBank reference genome database. The NCBI BLAST tool was also used to test each primer's off-target specificity to all publicly-available bacteria genome sequences outside of A. muciniphila. The reverse primer was found to be 100% matched to two off-target organisms, Haloferula rosa and Luteolibacter algae (Verrucomicrobia phylum). Luteolibacter algae and H. rosa are two species commonly found in marine environments (Yoon et al., 2008; He et al., 2017) and are not known to inhabit the human gut in significant abundance. Using data from the U.S. NIH Human Microbiome Project and the search engine EZ Bio Cloud (https://www.ezbiocloud.net/resources/human_microbiome) we found no presence of L. algae and H. rosa in stool. The Akkermansia genus dominates the Verrucomicrobia population found in the human gut (Dubourg et al., 2013). When found in the gut, the abundance of these species is not enough to significantly affect the calculation of A. muciniphila abundance (0–5% of total reads; Zhang et al., 2015).
Genomic DNA Standards
E. coli strain 1532 (ATCC 35218) was streaked onto a 5% sheep's blood agar plate (Becton, Dickinson and Company; Franklin Lakes, NJ) and incubated for 12 h at 37°C. Genomic DNA (gDNA) was isolated from E. coli cultures using an UltraClean Microbial DNA Isolation kit (Mo Bio Laboratories; Carlsbad, CA). The absorbance of isolated E. coli and commercially obtained A. muciniphila gDNA (strain ATCC BAA-835) was measured at 230, 260, and 280 nm using a Nanodrop 1000 (NanoDrop Instruments, Wilmington, DE). The 260/280 and 260/230 absorbance ratios were ≥2.0, confirming gDNA purity. The gDNA concentration, expressed as genome copies per μL, was calculated using the absorbance at 260 nm, the extinction coefficient of double-stranded DNA (0.020 μg−1 mL cm−1), the average molar weight of a DNA base pair (650 g mol−1), the size of each reference strain's genome (E. coli ATCC 35218, 4.64 Mbp; A. muciniphila ATCC BAA-835, 2.66 Mbp), and Avogadro's number. gDNA aliquots (10 μL) were stored at −20°C and used as RPA standards. Ten-fold serial dilutions of both E. coli and A. muciniphila gDNA were made using nuclease-free deionized water. Finally, 2 or 5 μL of template (100–107 copies of E. coli or A. muciniphila gDNA) were added to quantitative RPA and PCR reactions.
Quantitative Real-Time RPA
Real-time RPA reactions were performed using a TwistAmp Basic kit (TwistDx, Cambridge, UK, TABAS03KIT) with primers purchased from Integrated DNA Technologies (Coralville, IA). Master mix (45.5 μL) containing 420 nM primers (primer pair set 1 or 2, Table 1), SYBR green dye I (ThermoFisher Scientific, Product #S7567; 45,500-fold dilution of stock concentration), and TwistAmp rehydration buffer was prepared and distributed into TwistAmp Basic reaction tubes. Next, 2 or 5 μL of template (100–106 copies of E. coli or A. muciniphila gDNA standard) and 2.5 μL of 280 mM magnesium acetate (MgAc) were added to the reaction mix to initiate the amplification reaction. Tubes were then placed into an Agilent MxPro 3005 real-time PCR machine (Agilent Technologies, Santa Clara, CA). Fluorescence (excitation, 497 nm; detection, 520 nm) was measured every 15 s for 60 min at 37°C.
Strategies for Removing Extraneous DNA From RPA Reagents
Strategy 1: Removing DNA Using Metal-Chelate Affinity Capture
Chelating Sepharose fast-flow beads (25 μL; catalog no. 17057502, GE Healthcare; cross-linked 6% agarose functionalized with iminodiacetic acid groups) were charged according to the manufacturer's protocol with Ni2+ ions to enable interaction with aromatic DNA base nitrogen atoms (Murphy et al., 2003; Cano et al., 2005) and then resuspended in 70 μL of 60 mM Tris buffer (pH 7) containing 1 M NaCl. Four TwistDx TwistAmp RPA reaction pellets were rehydrated in 70 μL of TwistDx Rehydration Buffer. The bead and RPA reagent suspensions were combined and mixed on a rotator at end-over-end at 3 rpm for 2 h at 4°C. The mixture was then centrifuged at 5,500 xg for 2 min to remove the beads, and the supernatant was aliquoted into four PCR tubes (35 μL per tube). Master mix (47.5 μL) containing 505 μM primers and SYBR green dye (47,500-fold dilution of stock solution) was added to each tube along with 2 μL of E. coli gDNA standard (100 copies per μL). Next, 2.5 μL of 280 mM MgAc was added to the PCR tubes, which were then placed into an Agilent MxPro 3005 Real-Time PCR machine and amplified at 37°C.
Strategy 2: DNA Shearing by Sonication
Individual TwistAmp RPA Reaction pellets were reconstituted with 29.5 μL of TwistDx Rehydration Buffer, placed on ice, and sonicated at a amplitude of 40 for 10 cycles (3 s on, 7 s off) using an ultrasonic homogenizer (Model 150V/T, Biologics Inc.). Next, 29.5 μL of the sonicated suspension and 16 μL of master mix (containing 1.5 μM primer set 1 and 16,000-fold dilution of SYBR green dye) were pipetted into new PCR tubes. Template (2 μL; 100 E. coli gDNA copies per μL) and 2.5 μL of 280 mM MgAc were added to initiate RPA, and the tubes were placed into an Agilent MxPro 3005 real-time PCR machine for amplification.
Strategy 3: Methylation-Dependent Endonuclease Digestion
RPA pellets were suspended in 29.5 μL of Rehydration Buffer with 0–140 units of DpnI restriction endonuclease (New England Biolabs, product #R0176S) and incubated for 15 or 60 min at 37°C, with or without 14 mM MgAc, to cleave methylated E. coli gDNA at Gm6ATC restriction sites. After digestion, tubes with treated pellet solution were mixed with 47.5 μL of master mix containing 505 μM primers and SYBR green dye (47,500-fold dilution of stock solution). Finally, 2 μL (100 copies) of E. coli gDNA standard and 2.5 μL of 280 mM MgAc were added to the tube caps and spun down in a microcentrifuge to simultaneously initiate the RPA reactions.
Strategy 4: DNA Depletion Using Anti-DNA Antibodies
Anti-dsDNA antibodies coupled to amine-modified magnetic particles were prepared as follows. Nine hundred microliters of 55.6 μg mL−1 anti-dsDNA antibody (#ab27156, Abcam) in 100 mM sodium acetate buffer (pH 5.4) was added to 45 μL of 0.1 M NaIO4. After 30 min of incubation at room temperature (RT), oxidized antibodies were concentrated using 100-kDa Amicon Ultra centrifugal filters (Millipore, Billerica, MA, USA) and diluted to 500 μL at 100 μg mL−1 in 200 mM sodium carbonate buffer (pH 9.6). Next, 3.1-μm Promag amine microspheres (200 μL; 1 × 10⁸ particles; Bangs Laboratories Inc.) were washed and resuspended in 500 μL of 200 mM sodium carbonate buffer (pH 9.6) and then added to the oxidized antibodies. After incubation at RT for 2 h, 15 μL of 5 M NaCNBH3, 1 M NaOH was added to the reaction and incubated for an additional 30 min at RT. Next, 75 μL of 1 M hydroxylamine was added, and the mixture was incubated for 30 min. The antibody-functionalized magnetic particles were washed 3 times and stored at 4°C in phosphate-buffered saline (PBS) (final concentration, 1 × 10⁵ particles per μL).
To remove extraneous DNA, TwistAmp Basic kit freeze-dried pellets (TwistDx) were reconstituted in 29.5 μL of TwistDx Rehydration Buffer and transferred to a low-binding microcentrifuge tube containing 2 × 10⁵ antibody-functionalized magnetic beads in 2 μL of buffer. The microcentrifuge tube was placed on a rotator and incubated for 30 min at 4°C, after which the beads were removed using a magnet, and the solution was transferred to new tubes in 29.5-μL aliquots. Master mix (47.5 μL) containing 505 μM primers and SYBR green dye (47,500-fold dilution of the stock solution) was added to each tube along with E. coli gDNA (100 genome copies per μL) in 2 μL. Finally, 2.5 μL of 280 mM MgAc was added to the tube caps and spun in a microcentrifuge to simultaneously initiate RPA.
qPCR Assays
Real-time PCR standard curves were prepared with 10-fold serial dilutions of gDNA standards (E. coli ATCC 35218 or A. muciniphila ATCC BAA-835) using previously-validated primer pairs (16S rRNA bacteria-specific primer set 2, or A. muciniphila specific primer set 4, Table 1). qPCR was performed in 20-μL reaction volumes containing 550 nM primers (1.1 μL of 10 μM), a 1 × concentration of Brilliant III Ultra-Fast SYBR green qPCR master mix (10 μL of 2 × commercial stock conc.; Agilent Technologies), and 2 or 5 μL of template. Amplification curves, baselines, and threshold cycles were calculated using Agilent MxPro 3005P software as described below.
Threshold Time and Cycle Parameters for RPA and qPCR Reactions
MxPro software (Agilent Technologies) was used to normalize baseline fluorescence and calculate RPA threshold times from raw fluorescence data. Using a linear least mean squares algorithm, the baseline function was calculated by fitting the raw fluorescence in the first 3 min of the reaction to a first-order function. Baseline-corrected fluorescence was obtained by subtracting the baseline from the raw fluorescence to plot an amplification curve. For each assay, threshold fluorescence was defined as the point at which the fluorescence exceeded the average baseline-corrected fluorescence by three standard deviations, located in the exponential region of the amplification curve. The threshold time or cycle was calculated as the time or cycle at which the reaction met the threshold fluorescence. For each assay, average threshold cycle (n = 3) was plotted against copies of gDNA per reaction on semi-logarithmic axes to generate a regression line.
Determining Total Bacterial and A. muciniphila Abundance
An anonymized human fecal sample from a deceased Caucasian female with a medical history of hypoglycemia and hypothyroidism was obtained from Analytical Biological Services Inc. Three micrograms of DNA (15 ng/μL) was isolated from 220 mg of the fecal sample using QIAamp DNA Stool mini kit (catalog no. 51504, Qiagen). Nucleic acid purity was confirmed by a 260 nm/280 nm absorbance ratio of 1.83 using Nanodrop™. Either 3 or 7.5 ng of isolated DNA (2- or 5-μL of a 10-fold dilution of the stock concentration) was run as the template in quantitative RPA and PCR assays. Average threshold time (RPA) or cycle (PCR) and relative standard curves were used to determine the number of E. coli or A. muciniphila gDNA copies per 15 ng of the isolated DNA. Finally, the relative A. muciniphila abundance was calculated as the ratio of A. muciniphila gDNA copies per μL to the number of bacterial gDNA copies per μL.
For both A. muciniphila (ATCC BAA-835) and E. coli (ATCC 35218) gDNA standards, the 16S rRNA gene sequences from the GenBank (accession nos. NR_074436.1 and EF436579, respectively) were aligned to the complete genome sequences of A. muciniphila (accession no. NC_010655.1) and E. coli (accession NZ_KK583188.1) using the NCBI BLAST. This resulted in three and seven matches (100% in identity and composition) for A. muciniphila and E. coli, respectively. Thus, to calculate the 16S rRNA gene copies for each standard, the genomic DNA copies were multiplied by the number of 16rRNA gene copies per genome (3 for A. muciniphila and 7 for E. coli).
Sequencing-Based Detection
The composition of the fecal microbiome was independently characterized using 16S rRNA sequencing. A QIAamp DNA Stool mini kit was used to isolate DNA from the fecal sample. SeqWright Genomic Services (Houston, TX) generated and validated a library of 300-bp amplicons (MiSeq Reagent kit v3, MS-102-3001) using the extracted DNA and a universal primer pair (primer set 5; Table 1) spanning the 16S rRNA V4 region (Caporaso et al., 2011). Sequencing was performed on an Illumina MiSeq instrument with 250-bp paired-end reads. Reads were then uploaded to the Sequencing Read Archive (BioProjectID: PRJNA472995) and Illumina Basespace Sequencing Hub for sequencing analysis. Kraken Metagenomics software was used to assign taxonomic labels to each read using a k-mer–based algorithm. The relative abundance of A. muciniphila was then calculated by comparing the number of reads classified as A. muciniphila to the total number of bacterial reads.
Results
Identification of Escherichia coli DNA Contamination in RPA Reagents
With unmodified RPA reagents, amplification was observed with primer set 1 in reactions containing 100–1,000,000 copies of E. coli gDNA in 10.3 min essentially independent of initial template concentration (standard deviation: 60 s, range: 10–11 min); no-template controls also showed amplification in 9.5 min (n = 1) (Figure S1). To confirm that the newly designed primer pair (primer set 1) was bacteria-specific, the amplification curves generated using primer set 1 were compared to amplification curves generated using the previously published and validated universal primer set 2 (Table 1, Figure S1). Amplification was observed with primer set 2 in reactions containing 100–1,000,000 copies of E. coli gDNA in 24.2 min (standard deviation: 150 s, range: 23.2–25.8 min), essentially independent of template concentration; the no-template control also showed amplification in 24.8 min (n = 1). A difference in primer length is the cause of the large jump in threshold time that is observed when no-template control reactions are tested with the two universal primer pairs. The manufacturer of the RPA reagent (TwistDx) recommends that RPA primers be 30–35 nt long. When RPA reactions are tested with PCR-size primers (15–22 nt in length), reactions will take longer to achieve threshold fluorescence than when reactions are tested with primers of the recommended length.
Amplicons generated from the no-template reaction with primer set 1 were purified using a QIAquick PCR Purification kit. To determine if primer dimers were contributing to unintended amplification, the purified RPA product was analyzed by gel electrophoresis to show the expected ~330-bp single band. To determine the phylogenic origin of the amplicon, the product was Sanger sequenced (Genewiz, Houston, TX) and the sequencing traces analyzed with Sequence Scanner 2 (Applied Biosystems, Foster City, CA) to generate a consensus sequence. The consensus sequence was aligned against NCBI's 16S ribosomal RNA database using nBLAST to show the highest similarity (99–100% identity) when aligned with a portion of the 16S rRNA gene in E. coli. Information provided by the manufacturer indicated that essential enzymes in RPA reagents are produced in an E. coli expression host. We, therefore, hypothesized that DNA from the E. coli vector is present in the RPA reaction pellets and amplified when 16S rRNA universal primers are used.
Strategies for Removing Extraneous DNA From RPA Reagents
Removing DNA Using Metal-Chelate Affinity Capture
As the purines of single-stranded nucleic acids contain an imidazole ring similar to that of the histidines recognized in “His6-tagging,” they exhibit a strong affinity for chelated transition metal ions (Murphy et al., 2003; Cano et al., 2005). Thus, we hypothesized that Ni-IDA immobilized metal affinity chromatography (IMAC) agarose beads would be an effective means of selectively binding and removing extraneous DNA from RPA reagents.
RPA reaction pellets were first reconstituted in rehydration buffer and then incubated with Ni+2-loaded IDA sepharose particles, as described in section Materials and Methods. The particles were removed by centrifugation, and the resulting supernatant was tested using primer set 1 in real-time RPA reactions spiked with 100 copies of E. coli gDNA (data not shown). Amplification curves generated using Ni-treated, and untreated reagents were indistinguishable, indicating that: (1) there was no significant decline in reaction efficiency after incubation with the IMAC resin; (2) RPA proteins exhibited low nonspecific (or His-tag) binding to Ni-IDA sepharose beads; and (3) little, if any, DNA was removed during the treatment of RPA pellets. Given our previous finding that Ni-IDA affinity is specific to single-stranded nucleic acids with exposed purine bases (Murphy et al., 2003; Cano et al., 2005), this result suggests that the majority of the residual DNA in the RPA reagents is double-stranded.
DNA Shearing by Sonication
Sonication is widely used in next-generation sequencing protocols to shear genomic DNA into fragments of as little as 150–200 bp. Gel electrophoresis analysis of the product generated from primer set 2, and no-template control reactions showed a single band, ~300 bp in length. Thus, we hypothesized that sonicating the reaction pellet would render the contaminating DNA un-amplifiable in downstream RPA reactions. No-template reactions with sonicated reagents reached the threshold fluorescence, on average, 60 s earlier than reactions with untreated reagents (Figure S2). Thus, we concluded that: (1) RPA reagents are tolerant of the degree of sonication applied, and (2) sonicating RPA pellets was not sufficient to shear extraneous DNA to such a degree as to impair amplification.
This result is consistent with previous studies which showed increases in amplification efficiency when samples are sonicated before PCR (Golenberg et al., 1996; Veal et al., 2012). Fragmenting genomic DNA into ~1 kb segments suggests facilitation of DNA dehybridization in GC-rich regions for quicker binding of polymerase at recognition sites and enhanced strand amplification.
Methylation-Dependent Endonuclease Digestion
DpnI is a methylation-dependent restriction endonuclease that cleaves DNA prepared from E. coli dam+ strains but not PCR-amplified DNA (Glickman, 1980; Barnes et al., 2014). The DpnI cleavage site (5′-Gm6ATC) was found to occur twice within the region of predicted amplification in the E. coli 16S rRNA gene (Figure S3). Thus, pre-treating RPA reagents with DpnI restriction enzymes should digest and render the extraneous DNA un-amplifiable.
Laborious removal of DpnI after incubation and prior to initiation of the RPA reaction likely would be unnecessary. As RPA reactions are isothermal, they commence immediately upon mixing of the reagents. This continuous amplification leads to prompt generation of synthetic products (Piepenburg et al., 2006). If sample (reaction template) and primers are simultaneously added to the DpnI-treated pellet, a portion of the sample DNA is likely to evade DpnI cleavage, allowing it to be amplified during the first round of RPA. The resulting unmethylated synthetic products are impervious to DpnI enzymatic cleavage and are available to act as a template in subsequent rounds of amplification.
No-template RPA reactions that contained pellets pre-treated for 15 min with 20 units of DpnI showed only a 90-s delay in threshold time when compared with reactions using untreated pellets, suggesting that some but not all of the extraneous DNA was digested during DpnI treatment (Figure 1). Negative control reactions with pellets incubated with DpnI in the absence of magnesium (DpnI's co-factor) showed the same threshold time as reactions using untreated RPA reagent.
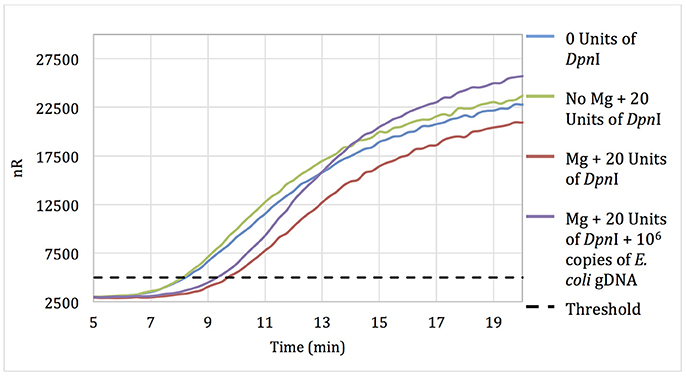
Figure 1. Amplification curves of RPA reactions carried out using primer set 1 and untreated reagents (blue) or reagents pre-treated with 20 units of DpnI for 15 min (red). Reagents pre-treated with DpnI and spiked with 106 copies of E. coli gDNA (purple); reagents pre-treated with DpnI in the absence of MgAc (green).
Increasing the DpnI digestion time from 15 to 60 min resulted in no increase in the threshold time difference between no-template reactions with treated and untreated RPA reagent. However, increasing the DpnI concentration 5- or 7-fold resulted in a 2.75 and 5.5-min increases in the threshold time, respectively (data not shown). Results indicate that treating RPA reagents with DpnI can digest and render a significant proportion of contaminating DNA un-amplifiable in subsequent applications.
DNA Depletion Using Anti-DNA Antibodies
Magnetic particles conjugated with anti-DNA antibodies with affinity for both dsDNA and ssDNA were used to treat RPA reagents, as described in section Materials and Methods. No-template RPA reactions that were pretreated with anti-dsDNA antibody magnetic particles showed a 3-min later threshold time than reactions involving untreated reagents (Figure 2). These data demonstrate that treating RPA reagents with anti-dsDNA antibody magnetic particles removes a significant proportion of extraneous DNA.
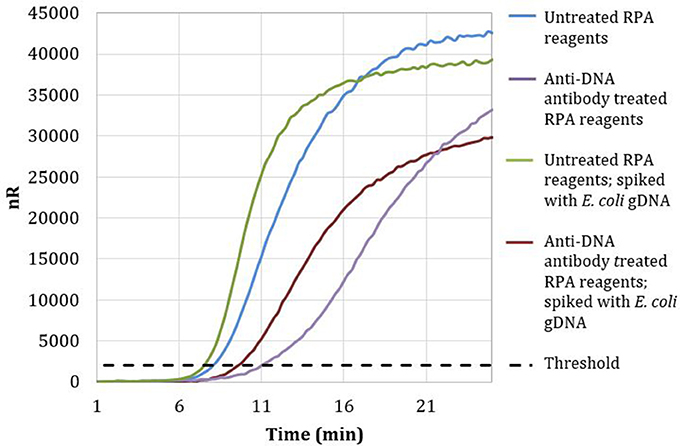
Figure 2. Amplification curves of RPA reactions carried out with RPA primer set 1 and untreated (blue) or treated (purple) reagents. Untreated reactions spiked with 100 copies of E. coli gDNA (green) exhibited a threshold time of 7.25 min, whereas anti-DNA antibody treated reactions spiked with 100 copies of E. coli gDNA (maroon) exhibited a threshold time of 9.5 min.
Reactions with treated reagents showed a 1.75-min earlier threshold time when spiked with 100 copies of E. coli gDNA compared with reactions with treated reagents in the absence of spiked E. coli gDNA (Figure 2). These data indicate that treatment with anti-dsDNA antibody magnetic particles does not significantly remove proteins necessary for RPA amplification.
Both DpnI treatment and anti-dsDNA antibody magnetic particles effectively removed extraneous DNA, with similar efficiencies, from RPA reagents. Treating RPA reagents with 100 units of DpnI showed a 2.75 min delay in threshold time when compared to reactions with untreated reagents. RPA reagents treated with anti-dsDNA antibody showed a comparable delay of 3 min in threshold time when compared to reactions with untreated reagents.
The cost of RPA reagents is ~$5 per reaction; these reagents can be treated to remove extraneous DNA with 100 units of DpnI at a cost of $3.33, or using anti-DNA antibody and magnetic particles for $2.25 per reaction. Thus later work employed the slightly less-expensive anti-DNA magnetic particles.
Quantitative Bacterial Detection Using RPA
To determine the detection range of the assay based on DNA-depleted reagents, 10-fold serial dilutions of E. coli gDNA standards were spiked into RPA reactions containing RPA reagents pre-treated with anti-ds DNA antibody magnetic particles (Figure 3A). Two replicates for concentrations ranging from 106 to 103 E. coli gDNA copies per reaction and two no-template control reactions were performed. Threshold time versus log copy number of E. coli gDNA was fit to a semi-logarithmic regression line to generate a standard curve (Figure 3B).
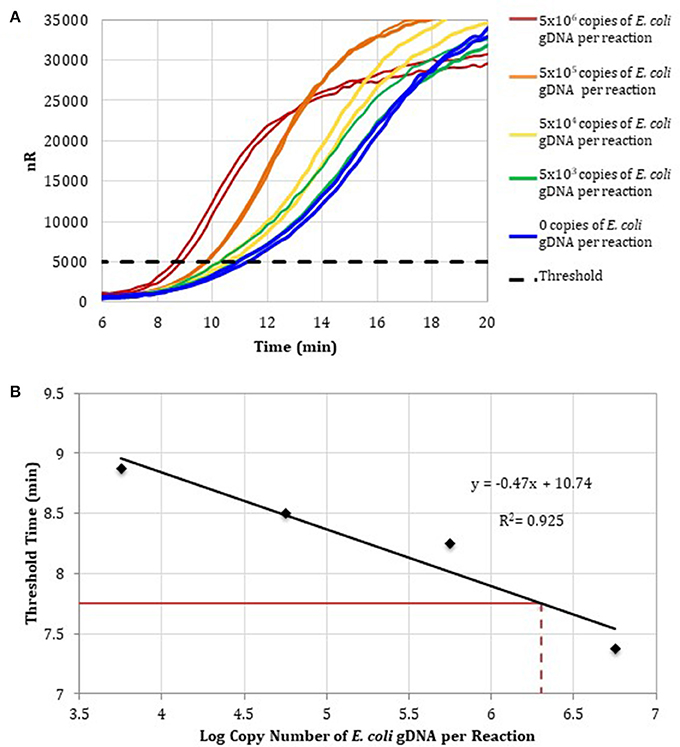
Figure 3. (A) RPA amplification curves generated using the primer set 1, 0–106 copies of E. coli gDNA (2 μL per reaction; n = 2), and RPA reagents pre-treated with anti-dsDNA antibody-coupled magnetic particles. (B) RPA standard curve was generated using the average threshold times calculated from measurements in (A) (n = 2). The fecal DNA exhibited an average threshold time of 7. 75 min (solid red line) and an estimated load of 6.3-log copies of bacterial gDNA per reaction (dotted red line) or a total bacterial load of 1.01 × 10⁷ bacterial gDNA copies per 15 ng of isolated gDNA.
To demonstrate that the total bacterial load in a clinically relevant sample can be quantified using RPA, DNA was isolated from a human fecal sample (Analytical Biological Services, Inc.) and amplified in RPA reactions. Based on the E. coli standard curve, the total bacterial load of the fecal sample was 1.01 × 10⁷ bacterial gDNA copies per 15 ng of isolated gDNA.
The same fecal sample was also re-analyzed using real-time PCR. A total of 2 μL of each E. coli gDNA standard dilution was spiked into PCR reactions containing previously published pan bacteria–specific primers (Table 1, primer set 2; n = 3). Threshold cycle was plotted against log copies of E. coli gDNA per reaction to generate a standard curve (Figure S4), which was then used to calculate the total bacterial load of the fecal sample as 5.58 × 10⁶ bacterial gDNA copies per 15 ng of isolated DNA. The total bacterial load of the stool sample quantified by qPCR differed by less than two-fold from the total bacterial load estimated by quantitative RPA (1.01 × 10⁷ bacterial gDNA copies per 15 ng of isolated gDNA).
Development of the A. muciniphila Assay
Absolute A. muciniphila Abundance
Akkermansia muciniphila gDNA (0–1,000,000 copies; ATCC BAA-835) was amplified using real-time SYBR Green-RPA with A. muciniphila–specific primers designed in this work (Table 1, primer set 3). The amplification curves were used to determine threshold time values and generate a standard curve (log copy number gDNA vs. threshold cycle, Figure 4). Reactions run with no added template (NTC) exhibited an average threshold time of 10.8 ± 0.42 min (n = 3). Reactions spiked with 1,000 copies E. coli gDNA (ATCC 35218) exhibited an average threshold time insignificantly different from that of the NTC (10.6 min; n = 3).
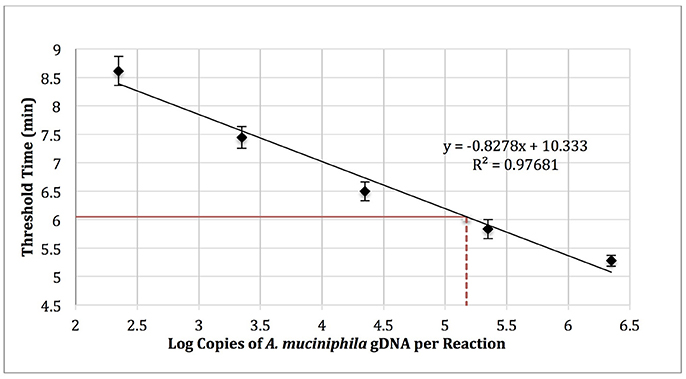
Figure 4. RPA standard curve of A. muciniphila gDNA (0-1,000,000 copies; ATCC BAA-835) amplified using real-time SYBR green-RPA and primer set 1 (n = 3). The average threshold time of a 10-fold dilution of the fecal sample gDNA was 6.05 ± 0.1 min (solid red line, n = 3). The estimated load was 1.48 × 10⁵ copies of A. muciniphila gDNA per reaction (dotted red line) or 2.99 × 10⁵ copies of A. muciniphila gDNA per 15 ng of DNA isolated from the fecal sample.
Five microliters of a 10-fold dilution of gDNA isolated from the fecal sample (15 ng gDNA per μl) was run as a template in RPA reactions to yield an average threshold time of 6.05 ± 0.1 min (n = 3). The standard curve (Figure 4) was then used to quantify the absolute load of A. muciniphila as 2.99 × 10⁵ gDNA copies per 15 ng of DNA isolated from the fecal sample.
The absolute A. muciniphila concentration in the fecal sample was separately determined by qPCR using primer set 4 (Table 1), which reportedly enables determination of the absolute abundance of A. muciniphila via qPCR (Collado et al., 2007; Schneeberger et al., 2015; Guo et al., 2016). The absolute A. muciniphila load of the fecal sample was estimated based on the qPCR semi-logarithmic regression line as 8.91 × 10⁴ gDNA copies per reaction, or 1.78 × 10⁵ gDNA copies per 15 ng of isolated gDNA (Figure S5), quite similar to the absolute A. muciniphila load of the fecal sample as determined using RPA (2.99 × 10⁵ bacterial gDNA copies per 15 ng of isolated gDNA).
Relative A. muciniphila Abundance
Relative A. muciniphila abundance was calculated as the ratio of A. muciniphila 16S copies to total bacterial 16S copies using both qPCR (using primer sets 2 and 4) and RPA (using primer sets 1 and 3) to show a relative abundance of 1.36 and 1.29%, respectively. The relative A. muciniphila abundance of the fecal sample was determined using RPA from 3 × 2.99 × 105 A. muciniphila 16S copies per 15 ng of gDNA divided by 7 × 1.01 × 107 bacterial 16S copies per 15 ng of gDNA) and from PCR 5.34 × 10⁵ A. muciniphila 16S copies/3.91 × 107 bacterial 16S copies) as 3 × 1.78 × 105 A. muciniphila 16S copies per 15 ng of gDNA divided by 7 × 5.58 × 106 bacterial 16S copies per 15 ng of gDNA.
In 16S rRNA gene sequencing, relative A. muciniphila abundance was defined as the ratio of A. muciniphila reads to the total number of bacterial reads. In 16S rRNA sequencing, the fecal sample produced 14,358,714 reads, of which 14,285,134 (99.5%) were taxonomically classified as bacteria. A total of 297,040 reads (2.07% of all reads) were classified as A. muciniphila ATCC BAA-835–specific, in good agreement with the RPA result.
When compared to sequencing, RPA gave a slightly lower relative A. muciniphila abundance in the fecal sample. This result could have been due to off-target amplification of the bacteria-specific primers. Note that the accuracy of the relative A. muciniphila abundance RPA assay, as with all nucleic acid-based assays, is highly dependent upon the quality of the primers. RPA assay sensitivity could perhaps be improved by increasing the primer specificity.
Discussion
Many microbial taxonomic groups have been identified as beneficial, detrimental, or simply indicative of a wide range of health conditions. As the number of organisms of interest expands, so does the need for inexpensive, accurate, and quantitative measurement of bacterial abundance within the gut. Unlike qPCR or 16S sequencing, RPA enables field-based testing. Recombinase polymerase amplification (RPA) is an isothermal nucleic acid amplification method that employs commercially available, easy-to-use freeze-dried, reaction-ready enzyme pellets that can be used to analyze specimens rapidly in the field, using a portable fluorometer. Analyzing complex microbial communities immediately after sampling can lead to a more accurate quantification of relative bacterial abundance. RPA is a method that is quickly growing in usage and range of applications (Piepenburg et al., 2008; Kim and Easley, 2011; Loo et al., 2013; Shin et al., 2013; Xu et al., 2014; Tortajada-Genaro et al., 2015; Daher et al., 2016; Yamanaka et al., 2017).
While many groups have developed RPA assays that demonstrate species-specific detection (Euler et al., 2012b; Ahmed et al., 2014; Krõlov et al., 2014; Clancy et al., 2015; Liljander et al., 2015; Cabada et al., 2017), there has been no development of an RPA assay that performs bacterial-specific detection. This gap is due to a high level of E. coli DNA in commercial RPA reagents. This paper is the first to offer a solution to this contamination. After successfully removing the contaminating DNA, we proceeded to demonstrate successful RPA quantification of bacteria in a stool sample.
In this proof-of-concept study we enabled the estimation of the relative abundance of A. muciniphila in human fecal DNA and demonstrated the promise of RPA as an inexpensive and accurate tool for measuring gut microbiome marker organisms. A. muciniphila appears to play a pivotal role in insulin resistance and inflammation. Furthermore, low abundance of A. muciniphila in the human gut is found to correlate with obesity. More recent studies indicate that A. muciniphila can influence the effectiveness of certain cancer immunotherapy drugs (Gopalakrishnan et al., 2018; Routy et al., 2018). Altering patients' gut microbiota to be rich in A. muciniphila may increase the fraction of individuals who respond to cancer immunotherapies. Given the short time A. muciniphila has been studied, the multitude of studies that support its role as a beneficial bacterium suggests its important role in human health. The medical community may soon need an inexpensive screening tool for identifying individuals with low fecal A. muciniphila abundance. To further assess the analytical accuracy and sensitivity of Akkermansia muciniphila detection with RPA more fecal samples should be tested.
Author Contributions
HG helped conceive the project, designed and executed experiments, and wrote the manuscript. DC helped to design and perform experiments, and edited the manuscript. MC helped to interpret and conceive the project, and edited the manuscript. KK interpreted experiments, and helped to write and edit the manuscript. RW conceived the project, interpreted experiments, and helped to write and edit the manuscript.
Conflict of Interest Statement
The authors declare that the research was conducted in the absence of any commercial or financial relationships that could be construed as a potential conflict of interest.
The reviewer JG and handling Editor declared their shared affiliation.
Acknowledgments
This work was supported by the FEMSA Foundation and the National Science Foundation, www.nsf.gov, (Grant Number 1759440).
Supplementary Material
The Supplementary Material for this article can be found online at: https://www.frontiersin.org/articles/10.3389/fcimb.2018.00237/full#supplementary-material
References
Abd El Wahed, A., El-Deeb, A., El-Tholoth, M., Abd El Kader, H., Ahmed, A., Hassan, S., et al. (2013). A portable reverse transcription recombinase polymerase amplification assay for rapid detection of foot-and-mouth disease virus. PLoS ONE 8:e71642. doi: 10.1371/journal.pone.0071642
Abd El Wahed, A., Weidmann, M., and Hufert, F. T. (2015). Diagnostics-in-a-Suitcase: development of a portable and rapid assay for the detection of the emerging avian influenza A (H7N9) virus. J. Clin. Virol. 69, 16–21. doi: 10.1016/j.jcv.2015.05.004
Ahmed, A., van der Linden, H., and Hartskeerl, R. A. (2014). Development of a recombinase polymerase amplification assay for the detection of pathogenic Leptospira. Int. J. Environ. Res. Public Health 11, 4953–4964. doi: 10.3390/ijerph110504953
Barnes, H. E., Liu, G., Weston, C. Q., King, P., Pham, L. K., Waltz, S., et al. (2014). Selective microbial genomic DNA isolation using restriction endonucleases. PLoS ONE 9:e109061. doi: 10.1371/journal.pone.0109061
Bonney, L. C., Watson, R. J., Afrough, B., Mullojonova, M., Dzhuraeva, V., Tishkova, F., et al. (2017). A recombinase polymerase amplification assay for rapid detection of Crimean-Congo Haemorrhagic fever Virus infection. PLoS Negl. Trop. Dis. 11:e0006013. doi: 10.1371/journal.pntd.0006013
Brukner, I., Longtin, Y., Oughton, M., Forgetta, V., and Dascal, A. (2015). Assay for estimating total bacterial load: relative qPCR normalisation of bacterial load with associated clinical implications. Diagn. Microbiol. Infect. Dis. 83, 1–6. doi: 10.1016/j.diagmicrobio.2015.04.005
Cabada, M. M., Malaga, J. L., Castellanos-Gonzalez, A., Bagwell, K. A., Naeger, P. A., Rogers, H. K., et al. (2017). Recombinase polymerase amplification compared to real-time polymerase chain reaction test for the detection of Fasciola hepatica in human stool. Am. J. Trop. Med. Hyg. 96, 341–346. doi: 10.4269/ajtmh.16-0601
Cano, T., Murphy, J. C., Fox, G. E., and Willson, R. C. (2005). Separation of genomic DNA from plasmid DNA by selective renaturation with immobilized metal affinity capture. Biotechnol. Prog. 21, 1472–1477. doi: 10.1021/bp050155g
Caporaso, J. G., Lauber, C. L., Walters, W. A., Berg-Lyons, D., Lozupone, C. A., Turnbaugh, P. J., et al. (2011). Global patterns of 16S rRNA diversity at a depth of millions of sequences per sample. Proc. Natl. Acad. Sci. U.S.A. 108(Suppl 1), 4516–4522. doi: 10.1073/pnas.1000080107
Centers for Disease Control and Prevention (2017). National Diabetes Statistics Report, 2017. Atlanta, GA: Centers for Disease Control and Prevention, US Dept of Health and Human Services. Available online at: https://www.cdc.gov/diabetes/data/statistics/statistics-report.html
Clancy, E., Higgins, O., Forrest, M. S., Boo, T. W., Cormican, M., Barry, T., et al. (2015). Development of a rapid recombinase polymerase amplification assay for the detection of Streptococcus pneumoniae in whole blood. BMC Infect. Dis. 15:481. doi: 10.1186/s12879-015-1212-5
Collado, M. C., Derrien, M., Isolauri, E., De Vos, W. M., and Salminen, S. (2007). Intestinal integrity and Akkermansia muciniphila, a mucin-degrading member of the intestinal microbiota present in infants, adults, and the elderly. Appl. Environ. Microbiol. 73, 7767–7770. doi: 10.1128/AEM.01477-07
Colman, R. J., and Rubin, D. T. (2014). Fecal microbiota transplantation as therapy for inflammatory bowel disease: a systematic review and meta-analysis. J. Crohns. Colitis 8, 1569–1581. doi: 10.1016/j.crohns.2014.08.006
Crannell, Z. A., Rohrman, B., and Richards-Kortum, R. (2014). Quantification of HIV-1 DNA using real-time recombinase polymerase amplification. Anal. Chem. 86, 5615–5619. doi: 10.1021/ac5011298
Crannell, Z. A., Rohrman, B., and Richards-Kortum, R. (2015). Development of a quantitative recombinase polymerase amplification assay with an internal positive control. J. Vis. Exp. doi: 10.3791/52620
Cui, B., Feng, Q., Wang, H., Wang, M., Peng, Z., Li, P., et al. (2015). Fecal microbiota transplantation through mid-gut for refractory Crohn's disease: safety, feasibility, and efficacy trial results. J. Gastroenterol. Hepatol. 30, 51–58. doi: 10.1111/jgh.12727
Daher, R. K., Stewart, G., Boissinot, M., and Bergeron, M. G. (2016). Recombinase polymerase amplification for diagnostic applications. Clin. Chem. 62, 947–958. doi: 10.1373/clinchem.2015.245829
Daher, R. K., Stewart, G., Boissinot, M., Boudreau, D. K., and Bergeron, M. G. (2015). Influence of sequence mismatches on the specificity of recombinase polymerase amplification technology. Mol. Cell. Probes 29, 116–121. doi: 10.1016/j.mcp.2014.11.005
Dao, M. C., Everard, A., Aron-Wisnewsky, J., Sokolovska, N., Prifti, E., Verger, E. O., et al. (2016). Akkermansia muciniphila and improved metabolic health during a dietary intervention in obesity: relationship with gut microbiome richness and ecology. Gut 65, 426–436. doi: 10.1136/gutjnl-2014-308778
Dubourg, G., Lagier, J. -C., Armougom, F., Robert, C., Audoly, G., Papazian, L., et al. (2013). High-level colonisation of the human gut by Verrucomicrobia following broad-spectrum antibiotic treatment. Int. J. Antimicrob. Agents 41, 149–155. doi: 10.1016/j.ijantimicag.2012.10.012
Duvallet, C., Gibbons, S. M., Gurry, T., Irizarry, R. A., and Alm, E. J. (2017). Meta-analysis of gut microbiome studies identifies disease-specific and shared responses. Nat. Commun. 8, 1784.
Euler, M., Wang, Y., Nentwich, O., Piepenburg, O., Hufert, F. T., and Weidmann, M. (2012a). Recombinase polymerase amplification assay for rapid detection of Rift Valley fever virus. J. Clin. Virol. 54, 308–312. doi: 10.1016/j.jcv.2012.05.006
Euler, M., Wang, Y., Otto, P., Tomaso, H., Escudero, R., Anda, P., et al. (2012b). Recombinase polymerase amplification assay for rapid detection of Francisella tularensis. J. Clin. Microbiol. 50, 2234–2238. doi: 10.1128/JCM.06504-11
Everard, A., Belzer, C., Geurts, L., Ouwerkerk, J. P., Druart, C., Bindels, L. B., et al. (2013). Cross-talk between Akkermansia muciniphila and intestinal epithelium controls diet-induced obesity. Proc. Natl. Acad. Sci. U.S.A. 110, 9066–9071. doi: 10.1073/pnas.1219451110
Everard, A., Lazarevic, V., Derrien, M., Girard, M., Muccioli, G. G., Muccioli, G. M., et al. (2011). Responses of gut microbiota and glucose and lipid metabolism to prebiotics in genetic obese and diet-induced leptin-resistant mice. Diabetes 60, 2775–2786. doi: 10.2337/db11-0227
Gascuel, O., Gouy, M., and Lyon, D. (2010). SeaView version 4: a multiplatform graphical user interface for sequence alignment and phylogenetic tree building. Mol. Biol. Evol. 27, 221–224. doi: 10.1093/molbev/msp259
Glickman, B. W. (1980). Escherichia coli mutator mutants deficient in methylation- instructed DNA mismatch correction. Proc. Natl. Acad. Sci. U.S.A. 77, 1063–1067. doi: 10.1073/pnas.77.2.1063
Gloor, G. B., Macklaim, J. M., Pawlowsky-Glahn, V., and Egozcue, J. J. (2017). Microbiome datasets are compositional: and this is not optional. Front. Microbiol. 8:2224. doi: 10.3389/fmicb.2017.02224
Golenberg, E. M., Bickel, A., and Weihs, P. (1996). Effect of highly fragmented DNA on PCR. Nucleic Acids Res. 24, 5026–5033. doi: 10.1093/nar/24.24.5026
Gopalakrishnan, V., Spencer, C. N., Nezi, L., Reuben, A., Andrews, M. C., Karpinets, T. V., et al. (2018). Gut microbiome modulates response to anti-PD-1 immunotherapy in melanoma patients. Science 359, 97–103. doi: 10.1126/science.aan4236
Greer, R. L., Dong, X., Moraes, A. C., Zielke, R. A., Fernandes, G. R., Peremyslova, E., et al. (2016). Akkermansia muciniphila mediates negative effects of IFNγ on glucose metabolism. Nat. Commun. 7:13329. doi: 10.1038/ncomms13329
Guo, X., Zhang, J., Wu, F., Zhang, M., Yi, M., and Peng, Y. (2016). Different subtype strains of Akkermansia muciniphila abundantly colonize in southern China. J. Appl. Microbiol. 120, 452–459. doi: 10.1111/jam.13022
Hänninen, A., Toivonen, R., Pöysti, S., Belzer, C., Plovier, H., Ouwerkerk, J. P., et al. (2017). Akkermansia muciniphila induces gut microbiota remodelling and controls islet autoimmunity in NOD mice. Gut. doi: 10.1136/gutjnl-2017-314508. [Epub ahead of print].
He, S., Stevens, S. L. R., Chan, L. -K., Bertilsson, S., Glavina Del Rio, T., Tringe, S. G., et al. (2017). Ecophysiology of freshwater verrucomicrobia inferred from metagenome-assembled genomes. mSphere 2:e00277-17. doi: 10.1128/mSphere.00277-17
Hermann-Bank, M., Skovgaard, K., Stockmarr, A., Larsen, N., and Mølbak, L. (2013). The Gut Microbiotassay: a high-throughput qPCR approach combinable with next generation sequencing to study gut microbial diversity. BMC Genomics 14:788. doi: 10.1186/1471-2164-14-788
Kang, D. -W., Park, J. G., Ilhan, Z. E., Wallstrom, G., Labaer, J., Adams, J. B., et al. (2013). Reduced incidence of Prevotella and other fermenters in intestinal microflora of autistic children. PLoS ONE 8:e68322. doi: 10.1371/journal.pone.0068322
Kim, J., and Easley, C. J. (2011). Isothermal DNA amplification in bioanalysis: strategies and applications. Bioanalysis 3, 227–239. doi: 10.4155/bio.10.172
Kim, J. Y., and Lee, J.-L. (2016). Rapid detection of salmonella enterica serovar enteritidis from eggs and chicken meat by real-time recombinase polymerase amplification in comparison with the two-step real-time PCR. J. Food Saf. 36, 402–411. doi: 10.1111/jfs.12261
Kim, J. Y., and Lee, J.-L. (2017). Development of a multiplex real-time recombinase polymerase amplification (RPA) assay for rapid quantitative detection of Campylobacter coli and jejuni from eggs and chicken products. Food Control 73, 1247–1255. doi: 10.1016/j.foodcont.2016.10.041
Kostic, A. D., Gevers, D., Pedamallu, C. S., Michaud, M., Duke, F., Earl, A. M., et al. (2012). Genomic analysis identifies association of Fusobacterium with colorectal carcinoma. Genome Res. 22, 292–298. doi: 10.1101/gr.126573.111
Krõlov, K., Frolova, J., Tudoran, O., Suhorutsenko, J., Lehto, T., Sibul, H., et al. (2014). Sensitive and rapid detection of Chlamydia trachomatis by recombinase polymerase amplification directly from urine samples. J. Mol. Diagn. 16, 127–135. doi: 10.1016/j.jmoldx.2013.08.003
Liljander, A., Yu, M., O'Brien, E., Heller, M., Nepper, J. F., Weibel, D. B., et al. (2015). Field-applicable recombinase polymerase amplification assay for rapid detection of Mycoplasma capricolum subsp. capripneumoniae. J. Clin. Microbiol. 53, 2810–2815. doi: 10.1128/JCM.00623-15
Lloyd-Price, J., Abu-Ali, G., and Huttenhower, C. (2016). The healthy human microbiome. Genome Med. 8, 51. doi: 10.1186/s13073-016-0307-y
Loo, J. F., Lau, P. M., Ho, H. P., and Kong, S. K. (2013). An aptamer-based bio-barcode assay with isothermal recombinase polymerase amplification for cytochrome-c detection and anti-cancer drug screening. Talanta 115, 159–165. doi: 10.1016/j.talanta.2013.04.051
Louis, S., Tappu, R. -M., Damms-Machado, A., Huson, D. H., and Bischoff, S. C. (2016). Characterization of the gut microbial community of obese patients following a weight-loss intervention using whole metagenome shotgun sequencing. PLoS ONE 11:e0149564. doi: 10.1371/journal.pone.0149564
Lynch, S. V., and Pedersen, O. (2016). The human intestinal microbiome in health and disease. N. Engl. J. Med. 375, 2369–2379. doi: 10.1056/NEJMra1600266
Moore, M. D., and Jaykus, L. -A. (2017). Development of a recombinase polymerase amplification assay for detection of epidemic human noroviruses. Sci. Rep. 7:40244. doi: 10.1038/srep40244
Morgan, X. C., and Huttenhower, C. (2012). Chapter 12: Human microbiome analysis. PLoS Comput. Biol. 8:e1002808. doi: 10.1371/journal.pcbi.1002808
Muegge, B. D. (2011). Diet drives convergence in gut microbiome functions across mammalian phylogeny and within humans. Science 332, 970–974. doi: 10.1126/science.1198719
Murphy, J. C., Jewell, D. L., White, K. I., Fox, G. E., and Willson, R. C. (2003). Nucleic acid separations utilizing immobilized metal affinity chromatography. Biotechnol. Prog. 19, 982–986. doi: 10.1021/bp025563o
Muyzer, G., Waal, E. C. D. E., and Uitierlinden, A. G. (1993). Profiling of complex microbial populations by denaturing gradient gel electrophoresis analysis of polymerase chain reaction-amplified genes coding for 16s rRNA. Appl. Environ. Microbiol. 59, 695–700.
Ott, S. J., Musfeldt, M., Ullmann, U., Hampe, J., and Schreiber, S. (2004). Quantification of intestinal bacterial populations by real-time PCR with a universal primer set and minor groove binder probes: a global approach to the enteric flora. 42, 2566–2572. doi: 10.1128/JCM.42.6.2566-2572.2004
Petrof, E. O., Gloor, G. B., Vanner, S. J., Weese, S. J., Carter, D., Daigneault, M. C., et al. (2013). Stool substitute transplant therapy for the eradication of Clostridium difficile infection: “ RePOOPulating ” the gut. Microbiome 1, 1–12. doi: 10.1186/2049-2618-1-3
Piepenburg, O., Williams, C. H., and Armes, N. A. (2008). Methods for Multiplexing Recombinase Polymerase Amplification. US Patent. Available online at: https://patentimages.storage.googleapis.com/16/58/ef/149158a9aa42f4/US7435561.pdf (Accessed May 14, 2018).
Piepenburg, O., Williams, C. H., Stemple, D. L., and Armes, N. A. (2006). DNA detection using recombination proteins. PLoS Biol. 4:e204. doi: 10.1371/journal.pbio.0040204
Plovier, H., Everard, A., Druart, C., Depommier, C., Van Hul, M., Geurts, L., et al. (2016). A purified membrane protein from Akkermansia muciniphila or the pasteurized bacterium improves metabolism in obese and diabetic mice. Nat. Med. 23, 107–113. doi: 10.1038/nm.4236
Robinson, C. K., Brotman, R. M., and Ravel, J. (2016). Intricacies of assessing the human microbiome in epidemiologic studies. Ann. Epidemiol. 26, 311–321. doi: 10.1016/j.annepidem.2016.04.005
Rosa, B. A., Hallsworth-pepin, K., Martin, J., Wollam, A., and Mitreva, M. (2017). Genome sequence of Christensenella minuta DSM 22607. Genome Announc. 5, 4–5. doi: 10.1128/genomeA.01451-16
Rosser, A., Rollinson, D., Forrest, M., and Webster, B. L. (2015). Isothermal Recombinase Polymerase amplification (RPA) of Schistosoma haematobium DNA and oligochromatographic lateral flow detection. Parasit. Vectors 8:446. doi: 10.1186/s13071-015-1055-3
Routy, B., Le Chatelier, E., Derosa, L., Duong, C. P. M., Alou, M. T., Daillère, R., et al. (2018). Gut microbiome influences efficacy of PD-1–based immunotherapy against epithelial tumors. Science 359, 91–97. doi: 10.1126/science.aan3706
Scheperjans, F., Aho, V., Pereira, P. B., Koskinen, K., Paulin, L., Pekkonen, E., et al. (2015). Gut microbiota are related to Parkinson's disease and clinical phenotype. Mov. Disord. 30, 350–358. doi: 10.1002/mds.26069
Scher, J. U., Sczesnak, A., Longman, R. S., Segata, N., Ubeda, C., Bielski, C., et al. (2013). Expansion of intestinal Prevotella copri correlates with enhanced susceptibility to arthritis. Elife 2:e01202. doi: 10.7554/eLife.01202
Schneeberger, M., Everard, A., Gómez-Valadés, A. G., Matamoros, S., Ramírez, S., Delzenne, N. M., et al. (2015). Akkermansia muciniphila inversely correlates with the onset of inflammation, altered adipose tissue metabolism and metabolic disorders during obesity in mice. Sci. Rep. 5:16643. doi: 10.1038/srep16643
Shin, Y., Perera, A. P., Kim, K. W., and Park, M. K. (2013). Real-time, label-free isothermal solid-phase amplification/detection (ISAD) device for rapid detection of genetic alteration in cancers. Lab Chip 13, 2106–2114. doi: 10.1039/c3lc50129a
Shreiner, A. B., Kao, J. Y., and Young, V. B. (2015). The gut microbiome in health and in disease. Curr. Opin. Gastroenterol. 31, 69–75. doi: 10.1097/MOG.0000000000000139
Tortajada-Genaro, L. A., Santiago-Felipe, S., Amasia, M., Russom, A., and Maquieira, Á. (2015). Isothermal solid-phase recombinase polymerase amplification on microfluidic digital versatile discs (DVDs). RSC Adv. 5, 29987–29995. doi: 10.1039/C5RA02778K
Veal, C. D., Freeman, P. J., Jacobs, K., Lancaster, O., Jamain, S., Leboyer, M., et al. (2012). A mechanistic basis for amplification differences between samples and between genome regions. BMC Genomics 13:455. doi: 10.1186/1471-2164-13-455
Watterlot, L., Lakhdari, O., Bermu, L. G., Sokol, H., Bridonneau, C., Furet, J.-P., et al. (2008). Faecalibacterium prausnitzii is an anti-inflammatory commensal bacterium identified by gut microbiota analysis of Crohn disease patients. Proc. Natl. Acad. Sci. U.S.A. 105, 16731–16736. doi: 10.1073/pnas.0804812105
Wong, S. H., Kwong, T. N. Y., Chow, T. -C., Luk, A. K. C., Dai, R. Z. W., Nakatsu, G., et al. (2017). Quantitation of faecal Fusobacterium improves faecal immunochemical test in detecting advanced colorectal neoplasia. Gut 66, 1441–1448. doi: 10.1136/gutjnl-2016-312766
Xu, C., Li, L., Jin, W., and Wan, Y. (2014). Recombinase polymerase amplification (RPA) of CaMV-35S promoter and nos terminator for rapid detection of genetically modified crops. Int. J. Mol. Sci. 15, 18197–18205. doi: 10.3390/ijms151018197
Yamanaka, E. S., Tortajada-Genaro, L. A., and Maquieira, Á. (2017). Low-cost genotyping method based on allele-specific recombinase polymerase amplification and colorimetric microarray detection. Microchim. Acta 184, 1453–1462. doi: 10.1007/s00604-017-2144-0
Yassour, M., Lim, M. Y., Yun, H. S., Tickle, T. L., Sung, J., Song, Y. -M., et al. (2016). Sub-clinical detection of gut microbial biomarkers of obesity and type 2 diabetes. Genome Med. 8:17. doi: 10.1186/s13073-016-0271-6
Yoon, J., Matsuo, Y., Katsuta, A., Jang, J.-H., Matsuda, S., Adachi, K., et al. (2008). Haloferula rosea gen. nov., sp. nov., Haloferula harenae sp. nov., Haloferula phyci sp. nov., Haloferula helveola sp. nov. and Haloferula sargassicola sp. nov., five marine representatives of the family Verrucomicrobiaceae within the phylum “Verrucomicrobia.” Int. J. Syst. Evol. Microbiol. 58, 2491–2500. doi: 10.1099/ijs.0.2008/000711-0
Zhang, A. N., Mao, Y., and Zhang, T. (2016). Development of quantitative real-time PCR assays for different clades of “Candidatus Accumulibacter.” Sci. Rep. 6:23993. doi: 10.1038/srep23993
Keywords: RPA, gut microbiome, Akkermansia muciniphila, bacterial quantification, point-of-need
Citation: Goux HJ, Chavan D, Crum M, Kourentzi K and Willson RC (2018) Akkermansia muciniphila as a Model Case for the Development of an Improved Quantitative RPA Microbiome Assay. Front. Cell. Infect. Microbiol. 8:237. doi: 10.3389/fcimb.2018.00237
Received: 11 December 2017; Accepted: 20 June 2018;
Published: 12 July 2018.
Edited by:
Pascale Alard, University of Louisville, United StatesReviewed by:
Elisabeth Margaretha Bik, uBiome, United StatesJames E. Graham, University of Louisville, United States
Copyright © 2018 Goux, Chavan, Crum, Kourentzi and Willson. This is an open-access article distributed under the terms of the Creative Commons Attribution License (CC BY). The use, distribution or reproduction in other forums is permitted, provided the original author(s) and the copyright owner(s) are credited and that the original publication in this journal is cited, in accordance with accepted academic practice. No use, distribution or reproduction is permitted which does not comply with these terms.
*Correspondence: Richard C. Willson, willson@uh.edu