Co-designing Indices for Tailored Seasonal Climate Forecasts in Malawi
 Neha Mittal1*
  Edward Pope2
  Stephen Whitfield1
  James Bacon2
  Marta Bruno Soares1
  Andrew J. Dougill1
  Marc van den Homberg3
  Dean P. Walker1
  Charles Langton Vanya4
  Austin Tibu5 Clement Boyce4
- 1School of Earth and Environment, University of Leeds, Leeds, United Kingdom
- 2Met Office Hadley Centre, Exeter, United Kingdom
- 3510 an Initiative of the Netherlands Red Cross, The Hague, Netherlands
- 4Department of Climate Change and Meteorological Services, Blantyre, Malawi
- 5Lilongwe University of Agriculture and Natural Resources, Lilongwe, Malawi
In central and southern Malawi, climate variability significantly impacts agricultural production and food availability owing to a high dependence on rain-fed maize production. Seasonal climate forecast information has the potential to inform farmers' agricultural planning, thereby improving preparedness to extreme events. In this paper we describe and evaluate an approach to co-designing and testing agro-climatic indices for use in seasonal forecasts that are tailored to farmer-defined decision-making needs in three districts of central and southern Malawi. Specifically, we aim to (a) identify critical maize specific agro-climatic indices by engaging key stakeholders and farmers; (b) compare and triangulate these indices with the historical climate record in study districts; and (c) analyze empirical relationships between seasonal total rainfall and maize specific indices in order to assess the potential for forecasting them at appropriate seasonal timescales. The identified agro-climatic indices include critical temperature/rainfall thresholds that are directly associated with phenological stages of maize growth with direct implications for maize yield and quality. While there are statistically significant relationships between observed wet season rainfall totals and several agro-climatic indices (e.g., heavy rainfall days and dry spell), the forecast skill of the UK Met Office's coupled initialized global seasonal forecasting system (GloSea5) over Malawi is currently low to provide confident predictions of total wet season rainfall and the agro-climatic indices correlated with it. We reflect on some of the opportunities and challenges associated with integrating farmers' information needs into a seasonal forecast process, through the use of agro-climatic indices.
Introduction
In central and southern Malawi, climate variability significantly impacts agricultural production and food availability owing to a high dependence on rain-fed maize production (Fisher and Lewin, 2013). A large majority of maize growing farmers are involved in semi-subsistence farming and are vulnerable to frequent exposure to climate extremes (Stevens and Madani, 2016). Investment in the development and improvement of seasonal climate forecasts (SCF) is seen as a potential means to improving the preparedness and resilience of agriculture in this context (Ziervogel and Opere, 2010; Kalanda-Joshua et al., 2011; Hansen et al., 2019). However, forecasting climate extremes and agricultural impacts in central and southern Malawi is challenging for a variety of technical reasons, including the relative lack of forecast model skill over Malawi, as the country lies in the transition zone of the dipole pattern for the ENSO-rainfall teleconnection (Jury et al., 1992; Diro, 2016), and there is limited availability of observational data to evaluate forecast skill or calibrate models at small spatial scales (Dinku et al., 2014).
There is also a significant knowledge gap around the use of SCF and how it interacts with farmers' information needs for on-farm decision making processes (Simelton et al., 2013; Coulibaly et al., 2015; Vincent et al., 2017; Clarkson et al., 2019; Tembo-Nhlema et al., 2019). The design and delivery of SCFs is rarely informed by a clear understanding of the timelines around agricultural and livelihood decision making (Ingram et al., 2002; Hansen et al., 2019), or the impacts of weather on crop-specific growth and development stages (Cairns et al., 2013). This limits the potential for translating forecasts into locally relevant and crop-specific indices that can inform farm-level decision making (Klopper et al., 2006; Hansen et al., 2019). Hewitt et al. (2012) argue that an effective climate service must have a credible scientific basis, and appropriately engage and meet the needs of users. There is a growing recognition amongst the climate services community (Vaughan et al., 2018; Bruno Soares and Buontempo, 2019; Hansen et al., 2019), that participation of the users of climate information across the design and delivery of climate service tools can help in both addressing technical knowledge gaps (Kniveton et al., 2015; Meadow et al., 2015) and improving the contextual relevance and uptake of information (Roncoli et al., 2008; Vincent et al., 2018).
There is evidence that suggests that observed crop responses to weather and climate can be explained using a relatively simple set of agro-climatic indices (Tadross et al., 2009; Trnka et al., 2011; Mathieu and Aires, 2018). In essence, this reduces the complexity of climate–crop impacts to a few key relationships and thresholds (Lobell and Field, 2007). Conventionally, indices are developed in a techno-scientific way, derived and validated through combinations of complex crop models and controlled experimental observation data (Tadross et al., 2009; Mathieu and Aires, 2018). However, in this study we start from the premise that such indices hold potential as a means for bringing together alternative knowledges, in order to tailor SCF information to the specific locations and needs of maize farmers in Malawi. We aim to contribute toward ongoing efforts in co-producing weather and climate services by implementing and evaluating a participatory approach to the development of agro-climatic indices for SCF, which starts from the experiences and decision-making processes of farmers themselves. We describe and evaluate a participatory research study in three Districts of southern and central Malawi as a means to identifying relevant and useful agro-climatic indices that add value to existing seasonal forecast services.
We calculate these farmer-derived indices using weather station observations to understand the recorded frequency and intensity of identified indices and analyze historical relationships between these indices and variables commonly described in seasonal forecast outputs, such as total seasonal rainfall. We also evaluate the skill of the UK Met Office's coupled initialized global seasonal forecasting system (GloSea5) over Malawi. Specifically, we
(a) identify critical maize specific agro-climatic indices that influence crop management practices in three districts of central and southern Malawi by engaging key stakeholders and farmers;
(b) compare and triangulate these indices with the historical climate record in these districts;
(c) analyze the statistical characteristics of maize specific agro-climatic indices, and quantify their correlations with wet season rainfall totals.
Rain-Fed Maize Agriculture and Seasonal Climate Forecasts in Malawi
In Malawi, small-scale, semi-subsistence rain-fed agriculture contributes to about 70% of total agricultural production. This is dominated by maize which covers about 50% of the total cultivated land and is grown by 97% of farmers (African Development Bank, 2018). Recent weather events including flooding due to cyclone Idai in March 2019, and rainfall extremes associated with the 2015–16 El Niño event, directly impacted agricultural production and affected millions of livelihoods (African Development Bank, 2018). Altered rainfall distributions and reduced rainfall quantities interact with farm-level decision-making (for example decisions related to the choice of planting dates) to either exacerbate or mitigate impacts in terms of crop losses, labor burdens, input costs, and more (Jew et al., 2020). This close connection between maize production and weather and climate suggests that actionable SCF play an important role in farmers' decision-making throughout the maize growing season.
In Malawi, seasonal forecasts are produced by the Department for Climate Change and Meteorological Services (DCCMS). In September the forecast is communicated to the Department of Agricultural Extension Service (DAES). Information is passed down from DAES to Agricultural Extension Development Officers (AEDOs) through District Agricultural Development Officer (DADO) in each Agricultural Development Districts (ADD) before reaching the lead farmers and other farmers in advance of the main growing season. These forecasts, at both National and District levels, are expressed as the probabilities for three tercile categories of predicted seasonal total rainfall: below-normal (dry conditions), normal (around the average), and above-normal (wet conditions). A probability is assigned to each category, indicating the chance of the category occurring during the target season at district level. As such, the forecast probabilities indicate both the direction of the forecast, as well as the amount of confidence in the forecast, accounting for the broad range of uncertainties that are inherent in forecasting (e.g., uncertainty in key physical processes, incomplete observations, etc.). However, these tercile forecasts are not updated frequently throughout the growing season (Venäläinen et al., 2016; Tembo-Nhlema et al., 2019), and lack targeted information for the agricultural sector, such as risk of dry spells occurrence during key maize growth stages (Simelton et al., 2013), making forecasts less useful for farmers evolving information needs.
Research Methods
Choice of Pilot Districts
The study focuses on three pilot districts in central and southern Malawi: Salima, Mangochi, and Zomba. These districts were selected on the basis of area under rainfed maize cultivation, drought, flood, and food security risk assessments (World Bank, 2009), and the presence of ongoing activity associated with the uptake and use of seasonal climate forecasts through both the Malawi Red Cross Society (MRCS) and the Participatory Integrated Climate Services for Agriculture training (PICSA) programme (Table 1). MRCS is involved building community resilience and scaling up nutrition through various projects on disaster risk reduction and preparedness such as on. MRCS is also involved in forecast-based financing across Malawi, whereby triggers are being developed to initiate early action and to release funding before the occurrence of floods or droughts event. PICSA with support from the World Food Programme (WFP) has trained ~20,000 lead farmers and 200,000 farmers across 10 districts in Malawi to use both historical climate information and seasonal forecast to make informed decisions at individual farm level such as choice of relevant crop variety, livestock, and livelihood options (UNDP, 2020).
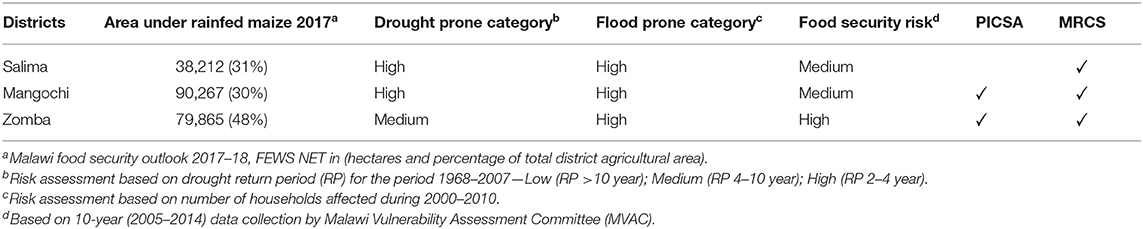
Table 1. Criteria for selecting the pilot districts.
The process of identifying study districts also involved consulting a wide range of stakeholders to understand the current landscape of agricultural climate services in Malawi. This consultation took place in in November 2018 and involved meeting representatives from the Department of Agricultural Extension Service (DAES), National Smallholder Farmers' Association of Malawi (NASFAM), Farm Radio Trust, United Nations Development Programme (UNDP), World Food Programme (WFP), Food and Agriculture Organization (FAO), and the Department for Climate Change and Meteorological Services (DCCMS). The consultations with these organizations helped to: (i) align our research with existing in-country on-going research and application; (ii) avoid duplication of efforts in terms of location and research foci; (iii) add value to existing or planned agricultural climate services activity.
Focus Group Discussions
We carried out focus group discussions (FGDs) in specific Extension Planning Areas (EPAs) within each district. The EPAs are sub-district administrative units for which agricultural extension service delivery, an important mechanism for the dissemination of forecast information, is carried out. The selected EPAs have PICSA and MRCS ongoing projects focusing on early warning early action and farmer engagement in weather services delivery and have at least one weather station with a long-term observational record. The chosen EPAs also provided scope for understanding spatial resolution and heterogeneity (if exists) in agro-climatic indices by allowing for intra-district (across three EPAs in Mangochi; Nankumba, Mbwadzulu, and Maiwa) and inter-district (one EPA each in Salima; Khombedza and Zomba; Mpokwa) comparison (Figure 1).
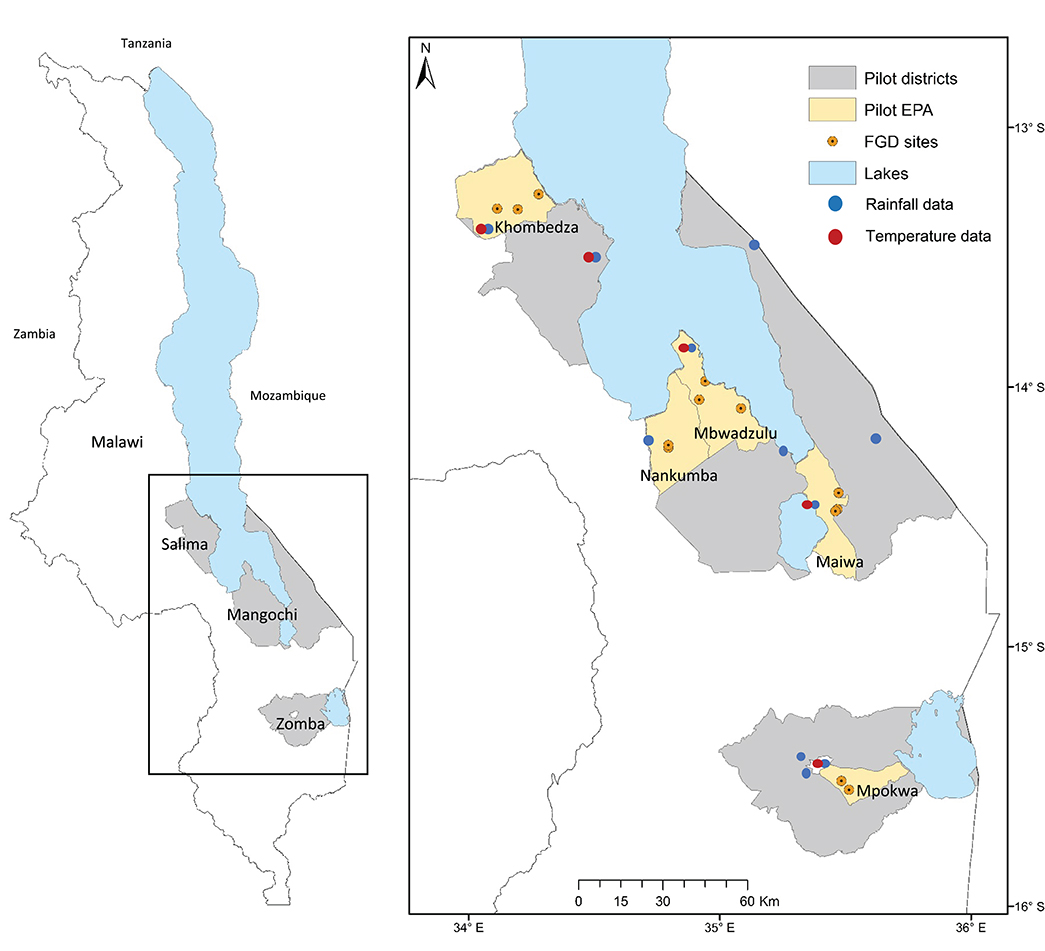
Figure 1. Location of Salima, Mangochi, and Zomba districts in central and southern Malawi (left), highlighting selected Extension Planning Areas (EPA), focus group discussion (FGD) locations, and the availability of rainfall and temperature observational data within these districts (right).
FGDs were used to identify the maize-specific agro-climate indices that are important determinants of crop management practices. FGDs were selected as the preferred method to engage with farmers and Agricultural Extension Development Officers (AEDOs) across the three districts as it allows the discussion and interaction of a specific group in relation to a particular topic of interest (Bryman, 2016). We conducted 15 FGDs between April and May 2019 across five EPAs; 10 FGDs with farmers and 5 FGDs with Agricultural Extension Development Officers (AEDOs). The AEDOs are farm advisors who work closely with farmers and farming households in communicating seasonal forecast information and providing relevant farm, crop, and livestock management advice. The farmers involved in the FGD were selected by the AEDOs and included both male and female farmers (and amongst which one or more than one was the lead farmer i.e., farmer representative). In total, 70 female farmers and 48 male farmers, and 21 AEDOs participated in the FGDs. The age of male farmer and female farmer participants ranged from 28–58 to 20–54, respectively. The FGDs were conducted in the local language Chichewa, facilitated by a local research assistant who audio recorded, translated and transcribed the discussions. The FGDs were conducted with the support of the MRCS and its district offices in Salima, Mangochi, and Zomba. The MRCS and their district officies have developed trusted relationships with AEDOs and farmers in the selected EPAs through their preparedness and relief work during flood and drought events.
We followed a protocol to conduct the FGD (outlined in full in Appendix 1) by which farmers collectively constructed a seasonal calendar, chronologically describing key farm level activities and decisions throughout the year. Decision calendars can be used as tools for identifying and organizing information about the timing of decisions of specific users and thus provide useful entry-points for understanding climate information needs and how to best tailor existing climate services products (Bert et al., 2006; Ray and Webb, 2016). The discussion focused on identifying crucial farm activities and describing how they depended upon or are affected by weather conditions, crop and field conditions during normal and extreme years, and non-climatic factors affecting farm decisions under normal and extreme weather conditions in different months. We used information on how extreme weather conditions negatively affect crop growth and farm decisions to identify crucial months for maize growing farmers, critical weather conditions affecting maize growth in the region.
From the collected qualitative data, we coded and organized climate and farm decision-making information according to month of the maize growing season. We also extracted farmer responses regarding specific seasonal climatic phenomenon or event which led to adverse impacts on crops, or affected crop management decisions and their timing, so that we could derive a cause-effect relationship. Where possible, we identified thresholds above or below which the particular phenomenon/event had adverse implications on maize yields, so that this could be distilled into a combination of agro-climatic indices and their threshold values. We found it difficult to identify specific thresholds for these indices from FGDs. The farmers and AEDOs provided the qualitative descriptions of the indices in form of impact of extreme weather events on maize growth, their farm decisions and livelihoods but not in terms of the amount of rainfall or temperature threshold that affected the maize yield or growth. Therefore, we followed an iterative process of engaging the meteorologists from the DCCMS while identifying, testing, and validating the thresholds drawn from the peer-reviewed literature.
Station Data
The identified agro-climatic indices (Table 2 results section) were calculated from long-term observations of daily temperature and rainfall. The 12 weather stations used for this analysis are all located within the Lakeshore Area and Shire Highlands climatic forecasting zones, as designated by DCCMS. Salima and Mangochi districts are part of Lakeshore area, and Zomba district is part of Shire Highlands (Figure 1). Missing data were handled on a case-by-case basis, depending on the implications for the subsequent calculations. Because wet season rainfall totals and agroclimatic indices were calculated on an annual basis only, any years which contained substantial gaps in the daily data (e.g., missing a block of at least 30 days, as defined by DCCMS) were removed from the analysis. The rainfall data at these stations span 39–119 years with a mean length of 58 years, while the temperature data span 25–55 years with a mean length of 39 years. All rainfall datasets, and 10 out of 12 temperature datasets, extend for more than 30 years. None of the datasets are shorter than 15 years, which is a minimum duration over which climate variability can be evaluated (Dunning et al., 2016). As such, the data provides an informative sample of Malawi's climate for the two zones from which these observations are drawn, as well as the study districts.
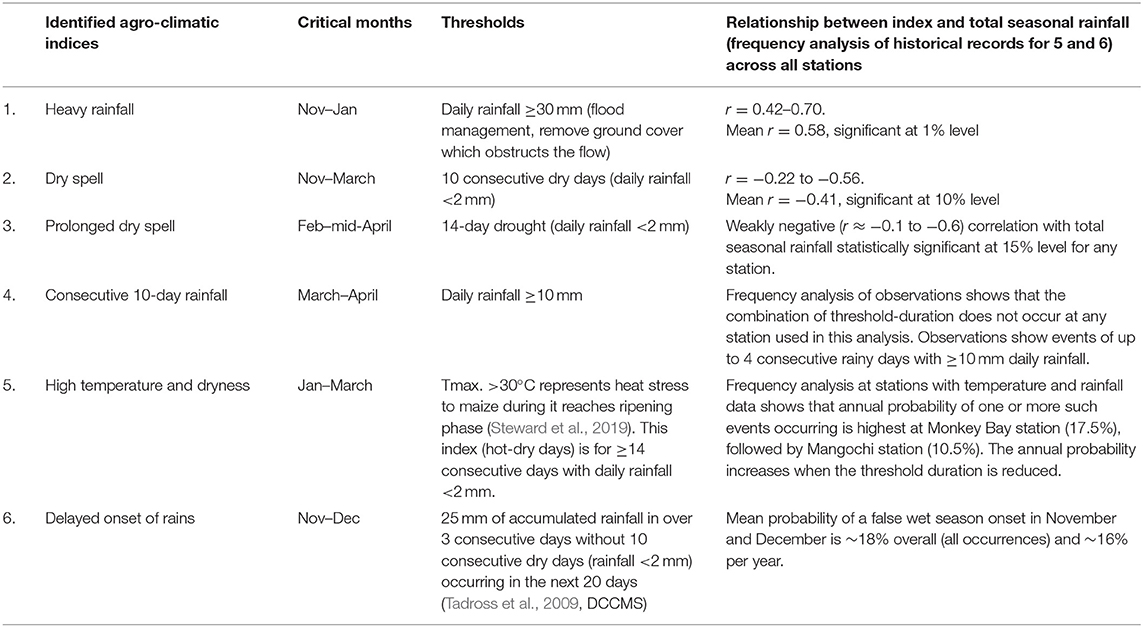
Table 2. Details of identified maize specific agro-climatic indices, and corresponding critical months, thresholds, empirical relationship with total wet season rainfall.
Defining the Wet Season and Computing Correlations Between Wet Season Rainfall and Agro-Climatic Indices
For each of the identified agro-climatic index, we calculate the annual frequency of agro-climatic event occurrence for the time windows identified as agriculturally relevant in the elicitation process. For all indices except “delayed onset of rains” and “high temperature and dryness” we explore correlations between the annual frequency of the event occurrence, during the months relevant to that index, and the corresponding total wet season rainfall that year. Since some of the agro-climatic events are relatively rare within individual months, we predominantly calculate the correlations across the entire wet season to maximize the likelihood of identifying robust statistical relationships. The aim is to provide information on both the climatological properties of the indices, and also to assess whether skillful seasonal forecasts of total wet season rainfall could indirectly provide information about important agro-climatic indices. Since the annual frequency is a discrete count, we use Poisson regression to quantify its association with total wet season rainfall total, which is continuous We use McFadden's pseudo-R2 statistic (Heinzl and Mittlböck, 2003) to quantify the goodness of fit of the relationship between the agro-climatic indices and total wet season rainfall. Pseduo-R2 is calculated as 1-(deviance/null deviance) of the fitted relationship, where the deviance quantifies how well the model predicts the observed values, and null deviance is the same expression but under the null hypothesis that the agro-climatic index is independent of total wet season rainfall. Smaller deviance values indicate a better model fit, meaning that pseudo-R2 values closer to 1 suggest that the fitted model is better at predicting the agro-climatic index than the null model. All analysis was carried out using R.
To calculate total wet season rainfall for each location, it is first necessary to estimate onset and cessation dates for each wet season, and then calculate the total precipitation between these dates. Malawi's wet season is driven by the seasonal progression of the Intertropical Convergence Zone (ITCZ). This zonal band of convective and precipitative maxima migrates south in the austral spring (September–November), bringing the first rains and heralding the onset of the wet season, while its equatorward return during the austral autumn (March–May) is associated with the wet season's cessation. Our approach to total wet season rainfall calculation follows the method outlined in Liebmann and Marengo (2001), adapted to calculate the onset and cessation dates for each year and station. See Liebmann and Marengo (2001) and Dunning et al. (2016) for further details.
Frequency Analysis for “High Temperature and Dryness” and “Delayed Onset of Rains”
Since it is determined by both temperature and precipitation, the “high temperature and dryness” index cannot be straightforwardly correlated with total wet season rainfall. Instead, we focus on exploring the climatological properties of this index. Since these events are rare in the observational record, we use the mean number of events per year at each station as the rate parameter (λ) of the Poisson distribution, which gives a better estimate of the annual probability that several events will occur in a year. We repeat this approach for three duration thresholds, i.e., identifying “high temperature and dryness” conditions which occur for ≥ 14 consecutive days, ≥10 consecutive days and ≥7 consecutive days (see Supplementary Table 3). We explored changing the duration thresholds identified during the FGDs because some events were extremely infrequent in the observational station record. The threshold for these indices were adjusted through iterative discussions between project scientists and meteorologists at the DCCMS during the indices identification stage and climate analysis stages.
Similarly, the “delayed onset of rains” index is assessed by estimating the likelihood of “true” and “false” wet season onsets using the following definition: “onset occurs when ≥25 mm rainfall accumulated in 3 consecutive days, which should not be followed by 10 consecutive dry days (CDD; rainfall <2 mm) in the following 20 days” (Kniveton et al., 2009; Tadross et al., 2009), based on iterative discussions with the DCCMS. According to this definition, the occurrence of <10 CDD within the 20 days following the ≥25 mm “event” will be considered a “true” onset. This definition is used to categorize potential wet season onset dates throughout November and December as true or false. Then, comparing the number of false onsets to the total number of onsets gives the proportion of “true” to “false” onsets.
Seasonal Forecast Model
To assess the potential to improving seasonal rainfall forecasts in Malawi, we evaluate the skill of the UK Met Office's Global Seasonal Forecast System 5 (GloSea5; MacLachlan et al., 2015; Walker et al., 2019) at predicting total wet season rainfall, which show higher skill than Greater Horn of Africa Climate Outlook Forum (GHACOF) consensus-based forecasts (Walker et al., 2019). To do this, retrospective seasonal forecast model runs were initialized on September 1st and October 1st over the period 1993–2015, and then run for 210 days to give forecasts of October–March and November-April rainfall. We quantify the skill of GloSea5 seasonal hindcasts of rainfall for Malawi, relative to the WATCH Forcing Data applied to ERA-Interim (WFDEI) reanalysis precipitation dataset (Weedon et al., 2014). For each initialization, early (OND/NDJ), late (JFM/FMA), and full wet season (ONDJFM/NDJFMA) hindcast skill across the entire country is evaluated using tercile Relative Operating Characteristic (ROC) curves and rainfall anomaly timeseries comparisons. Although skill varies regionally across Malawi, we present results only for the domain average (8–18° S, 32–36° E) to test if GloSea5 is generally skillful in the region. The horizontal resolution of the model (~50 km) is not high enough to provide reliable information at the district level.
Results and Analysis
Identification of Maize Specific Climate Indices and Their Thresholds
Across five EPAs in three districts, agro-climatic indices that impact maize growth during particular phenological phases were identified. These are (i) delayed onset of rains during the establishment phase; (ii) heavy rainfall events during vegetative and flowering phase; (iii) dry spells and prolonged dry spells during the entire maize growth phase; (iv) hot and dry incidences during flowering and yield formation phase; and (v) consecutive rain days during the yield formation and ripening phase. Figure 2 summaries the linkages between maize growth phases/stages and farm practices as well as the implications weather related events can have on these during the main maize growing season from November to April. Despite subtle differences in their farm activities during each calendar month across the five EPAs, famers' SCF information needs during the crucial months of maize growth and production remains the same. These farm practices are strongly dependent upon the amount and timing of rainfall during November-April season.
“We plant maize soon after the first rains, they start between 15th and 30th November, we have rainfall once a week followed by sunny weather” (male farmer, Mpokwa EPA).
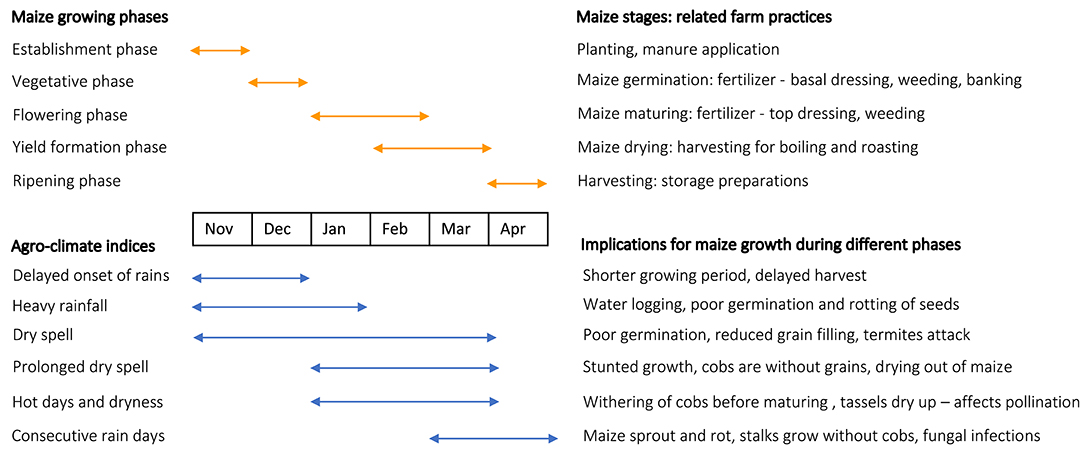
Figure 2. Linkages between different phenological stages of maize growth and farm practices during November to April rainy season, and identified maize-specific agro-climate indices and their implications on maize growth and yield.
Similar information on the onset of rains was echoed by farmers across all EPAs. Farmers in different EPAs recall different years as extreme/bad years. Mpokwa farmers gave an example of 2012–13 event, when in January 2013, they planted maize for the 6th time before consistent rains began which resulted in a shorter growing period and delayed harvest. Information about the onset of rains during September–October months was considered as most useful potential agro-climatic indicator by participants as a reliable forecast of this can help with preparing land in time, buying the right seed variety and other necessary inputs such as fertilizers, and budgeting for the season.
Similarly, heavy rainfall events early in the season necessitated weeding before planting began, while their occurrence after planting led to poor germination and rotting of seeds, washing away of fertilizer causing plant wilting, worm infestation, and loss of precious resources (seeds and fertilizer).
“Due to heavy rains after planting, it takes many days for the maize seeds to germinate. And when we go check, we find that some seeds have rotten. We end up replanting and the same thing happens. In some planting stations, the seeds have not germinated. In the end, there is no uniformity in the growth of the maize plants. And that gives us no hope for a good harvest” (male farmer, Maiwa EPA).
Farmers suggested that excessive multi-day rainfall relatively early into the season caused soil leaching as well waterlogging and flooding of fields. Conversely, such an event later into the season can cause either the maize stalks to only grow tall without developing cobs because of Witch weed (Kaufiti) infestation, or it can delay harvesting.
Dry spells cause a myriad of issues from lack of water availability to disease infestation. Dry spells in 2017–18 (Nankumba), 2015–16 and 2017–18 (Khombedza) caused crop withering as well as crops suffering from fall armyworms and termite attacks. Information about dry spells especially during the rainy season could help farmers to decide which varieties of maize they can plant.
“We plant early maturing maize varieties when we are informed that there will be few rains in our area in January, so that our crops are already matured by then” (male farmer, Khombedza EPA).
Prolonged dry spells lasting a month in December affects seed germination, but their occurrence in January and February causes withering away of crops. In 2010–11, Mpokwa farmers experienced permanent wilting and stunted crop with many cobs without grains because of a long February dry spell, while a 5-week spell in 2017–18 in Khombedza caused scarcity of water for irrigation and fall army worm disease. Since prolonged dry spell affect the maize maturing and its drying, it results in reduced yield and limits the chances of early harvest of maize for household consumption.
We observe a propensity of farmers to elicit a need for rainfall-related weather and climate information compared to temperature, as others also have (Haigh et al., 2015; Klemm and McPherson, 2018). However, we also find that a combined understanding of weather related events and their impacts on the maize growth stags reveals a complex climate information need during maize maturing and drying stages from January to March i.e., temperature-rainfall climate index—an index of high temperature and dryness (see Table 2 for details).
A combination of prolonged high temperature and dry weather during the rainy season, such as the 2000–01 drought in Mbwadzulu, severely affected the crop predominantly through pest infestation and plant/crop wilting. Farmers and AEDOs use the terms masiku otentha meaning hot days, masimu otentha kwambiri meaning very hot days, and nyengo yothentha meaning it's hot; interchangeably to discuss high temperature days.
“We often have dry spells in January and our crops wither, turn yellow and are attacked by diseases. This is also because of high temperatures when the tassels are dry, there is no pollination. It normally lasts a week but if the dry spell lasts two to three weeks, we are greatly affected” (female farmer 1, Mbwadzulu EPA).
“With the high temperatures, we delay with fertilizer application and it is too late to do the application after the maize plants have developed cobs” (female farmer 2, Mbwadzulu EPA).
Since these hot and dry events affects the crop at a relatively advanced stage, it is vital to understand how likely it is to occur, because as the season progresses, the farmer gets progressively locked-in to the agricultural management practice adopted for the season. Participants expressed that information about high temperature and dryness could be very valuable in helping farmers to (or not to) plan re-planting activities, in case first planting fails, as high temperature and dryness lead to drying of soil resulting in withering of crops and loss of yield.
We observe that farmer responses about experiences of climatic extremes do not just reflect perceptions about weather phenomena but also have implications for crops. This connects well with observations that such participatory process not only capture farmer perceptions of rainfall or rainfall changes but also exposure, sensitivity, and impacts on the farming system (Simelton et al., 2013). This can explain some of the discrepancy between farmer recall of events and historical climate observation records. Farmers place more emphasis on certain events if these had more impact on their crop yield.
Statistical Analysis of Identified Agro-Climatic Indices
We explore the relationship between agro-climatic indices and wet season rainfall totals for four of the six indices listed in Table 2; these are: “heavy rainfall,” “dry spell,” “prolonged dry spell,” and “consecutive 10-day rainfall.” Using the same weather station data, we also analyze the probability of delayed onset of rains (%), probability of delayed onset per year (%), and the frequency of combined “high temperature and dryness” conditions lasting at least 14, 10, and 7 days. Correlations between the agro-climatic indices and wet season rainfall totals were calculated at each weather station and are listed in Supplementary Table 1a. To gain a better understanding of spatial patterns evident in the data, the correlation analysis results were aggregated at the district and regional (central and southern Malawi) levels (also Supplementary Table 1a). Aggregate Pearson correlation coefficients are provided as ranges, while the joint statistical significance (referred to as “field significance”) of these multiple correlations is estimated using the Walker test (e.g., Wilks, 2006). This approach is robust even when the individual hypothesis tests are non-independent, as in this case due to similarities in meteorological conditions across the weather stations. The correlations for each station, district, and regional level informs the findings presented below.
Heavy Rainfall, November–January
We find positive correlations (r ≈ 0.4–0.7) between “heavy rainfall” events and total wet season rainfall (Figure 3) which are statistically significant at the 1% level for all the stations across the three districts considered here. Using the Walker test, these correlations are found to be collectively significant at the 1% level, when grouped by district, and for the whole region. The interpretation, therefore, is that that heavy rainfall events will tend to be more frequent during wet seasons with higher total rainfall. Despite being highly statistically significant, these relationships show considerable scatter, and caution is needed in interpreting and applying these relationships in decision-making processes (Supplementary Figure 1).
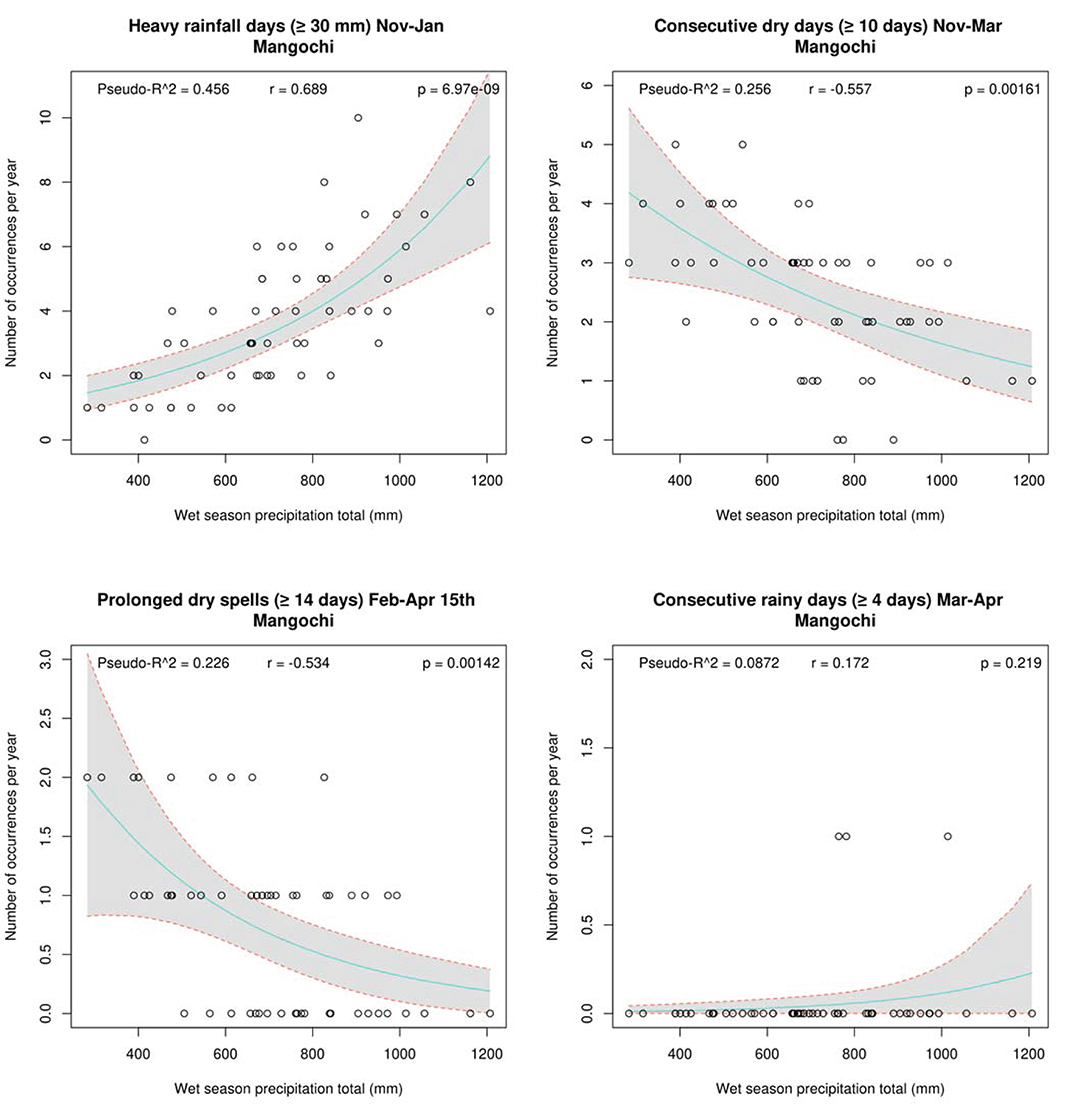
Figure 3. Results of correlation analysis between the agro-climatic indices developed through the iterative process and wet season precipitation totals for Mangochi station, Mangochi district. Clockwise from top left: “heavy rainfall” events November–January, “dry spell 1–2 weeks” November–March, “consecutive 4-day rainfall” March–April, and “prolonged dry spells” February–April 15th.
Dry Spell, November–March
We observe negative correlations (r ≈ −0.2 to −0.6) between “dry spell 1–2 weeks” and total wet season rainfall (Figure 3). For the stations, all but four of the correlations are significant at the 5% level. Collectively, the correlations are field significant at the 1% level for each district, and the whole region. This relationship suggests that the frequency of 10-day dry spells in November to March tends to be lower when wet season rainfall totals are higher. However, the modest confidence of the station level correlations reported here, in addition to the limited sample size for the conclusions drawn at the district level, must be considered if these relationships are to be used to infer dry spell frequency from skillful wet season rainfall forecasts (Supplementary Figure 2).
Prolonged Dry Spell, February–April
We find weakly negative correlations (r ≈ −0.1 to −0.6) between “prolonged dry spells” of ≥14 consecutive days for February–mid-April and total wet season rainfall (Figure 3). These correlations are locally significant at the 5% level for six of the stations considered, and not significant at the other six (see Supplementary Table 1a). However, these correlations are field significant regionally, indicating that the collection of locally significant station correlations is not a “false discovery” (Wilks, 2006). Nevertheless, there is considerable uncertainty in these relationships (Supplementary Figure 3b), meaning they are not robust enough to form the basis of a forecast.
Consecutive 10-Day Rainfall, March–April
Within the available observations, we identified only one occurrence of ≥10 mm daily rainfall sustained over ≥10 consecutive days, which was recorded at Salima. As such, there is no evidence for a relationship with total wet season rainfall (Figure 3). Testing showed there were very few occurrences of consecutive rainfall events lasting longer than 4 days (Supplementary Figure 4). This highlights a potential discrepancy between the occurrence of historic weather events and farmers' perception of them; this is explored further in the discussion.
High Temperature and Dryness Lasting ≥14 Consecutive Days, January–March
Analysis of “high temperature and dryness” events is restricted to the six of the 12 weather stations which provide overlapping data for precipitation and temperature (see Supplementary Figure 5). We find that “high temperature and dryness” events which last for at least 14 consecutive days are extremely rare within the available observational records, with no recorded occurrences at Chanco, Chitala and Makoka stations (Supplementary Table 2). Monkey Bay in Mangochi district has the highest observed rate (~0.19 events per year), which gives an estimated 17.5% annual chance that one or more “high temperature and dryness” event will occur in a given year (see Supplementary Table 2).
Due to the rarity of hot-dry events lasting at least 14 days, we also explored the characteristics of shorter duration events lasting at least 10 and 7 days (see Supplementary Table 2). However, even for these shorter thresholds we find no recorded events in the available data for Chanco and Chitala stations (Supplementary Figure 5). For the 7-day threshold, we calculate an annual chance of roughly 70% that Monkey Bay will experience at least one hot-dry event per year. More generally, we find that no more than three hot-dry events occur in any given year or location (Supplementary Figure 5) for any of the three thresholds explored here. Consequently, the estimated annual chance of more than three events per year, estimated using the Poisson distribution, is negligible for all stations except Monkey Bay, where there is an estimated 3.6% chance per year. We note that these probabilities are long-term averages based on available historical observations and will be influenced by both natural climate variations and climate change over that period.
Delayed Onset of Rains, November–December
Analysis of the weather station observations show a roughly 84% probability (averaged across the 12 stations) that the traditional onset threshold marks the beginning of the wet season for any given year. The corollary is that the mean probability of a false wet season onset in November and December is ~16% per year (Supplementary Table 3). As such, there is a substantial risk, each year, that maize planted after early rains will experience adverse growing conditions.
Seasonal Forecast Skill of GloSea5
We find that for the October to March period, GloSea5 seasonal precipitation forecasts offer limited skill across Malawi (Supplementary Figure 6), and there will be little to be gained from downscaling the seasonal forecast to individual sites, districts, and regions. For different sub-season periods Relative Operating Characteristic (ROC) scores indicate marginal improvements for above normal and below normal forecasts of precipitation during January–March compared to October–December. Comparing GloSea5 and reanalysis data for the 1993–2015 period indicates a statistically insignificant correlation (r = 0.21) for January–March and no obvious correlation for October–November, suggesting limited predictability of the 6-month rainfall forecast for Malawi (Supplementary Figure 7). We find greater skill for northern and southern Malawi, but lower skill in the central region. A potentially important reason for the relatively low skill of the model in this region is that Malawi is a point of transition between ENSO precipitation teleconnections, whereby the warm phase of ENSO is associated with wetting in the north and drying in the south (Mason and Chidzambwa, 2008). So, while GloSea5 seasonal prediction system has been shown to exhibit greater skill than GHACOF consensus-based forecasts for East Africa (Walker et al., 2019), the model currently lacks skill in and around Malawi. This may be because Malawi covers a relatively small area, meaning that even slight biases in the location of key weather patterns and teleconnections can result in forecasts with low skill.
Discussion
Analysis reveals challenges and opportunities in identifying agro-climatic indices and understanding the climatological characteristics of the indices. These important components are analyzed and tested in the Malawian context for an important subsistence crop; maize, but it provides an opportunity to explore crucial aspects in the effort toward developing agricultural climate services in Malawi. We discuss the key issues in this section.
Identifying Agro-Climatic Indices
We sought to identify agro-climatic indices that affect farm-level decision making with the objective of explicitly linking climate forecasts with on-farm decisions. Our participatory approach contrasts with the more common techno-scientific approaches (Tadross et al., 2009; Mathieu and Aires, 2018), which led to different challenges. Key challenges we faced included; contextualizing local terms and knowledge, and identifying indices that could be developed into forecast information given limited availability of long-term climate data.
There are challenges in contextualizing words and phrases used in the local language. For example, masiku otentha (hot days), masimu otentha kwambiri (very hot days) and nyengo yothentha (it's hot) were used interchangeably during FGDs but they have different meaning and are used/understood in specific contexts. We also found that the process of deriving specific thresholds values, and to ascertain their appropriateness for inclusion in SCF, requires further iterative evaluation and refinement through engagement of meteorologists and agriculture experts. Moreover, we should not assume that there exists a knowledge of agro-climatic indices and thresholds among the users that will emerge from this process in every context (Simelton et al., 2013; Nkiaka et al., 2019; Dorward et al., 2020). Some of the discrepancies between farmers, AEDOs and meteorologists defined indices and thresholds, indices available in literature, and the frequency of their occurrence in station observations indicates the challenges of both identifying and developing indices that should simultaneously meet multiple criteria. These include identifying indices and thresholds, that significantly impact crop productivity, that are understandable for farming communities, that help farmers make informed farm-level decisions, and that are associated with sufficient forecast model skill.
Identifying an appropriate threshold for sectors that rely on anticipatory action such as forecast-based financing, crop insurance etc., is important. Moreover, in a region that faces natural disasters anticipatory action or early warning early action requires developing triggers that have a sufficiently long lead time to initiate and implement early actions before the imminent hazard materializes in a disaster. Slow onset disasters such as drought rely mostly on seasonal to subseasonal forecasts (as opposed to sudden onset disasters such as floods that rely on short term forecasts) (Bazo et al., 2019). The agro-climatic indices as developed in our research could also be used to determine the timing of cash-based transfers to support the most vulnerable and poor farmers in taking early action themselves (Nobre et al., 2019).
The agro-climatic indices identified and developed through this work are limited to temperature and rainfall indices mainly due to the need to validate indices using long-term station observational data. The choice of EPAs with each district was significantly affected by the availability of long-term temperature and rainfall observations, which meant that identification and validation of agro-climatic indices could not be carried out across all EPAs within the district. While temperature and rainfall are the key climate variables affecting the maize yield and quality according to the farmers and AEDOs, there are also other factors that affect maize yield, such as soil condition, type, and availability of farm inputs etc. While information on these non-climatic factors is currently limited the development of crop-specific agro-climatic indices could be supplemented by additional research on the impact of non-climatic factors on farmers' decision making, cropping calendar and crop yield.
Climatological Characteristics of Agro-Climatic Indices
The second component aims to understand the climatological characteristics of the indices. Here, we evaluated the skill of the GloSea5 model in simulating total wet season rainfall; alongside this, we also analyzed relationships in the observations between rainfall-based agro-climatic indices and total wet season rainfall, the probability of delayed onset of rains, and the frequency of high temperature and dryness events.
This work highlights the challenge of providing a skillful seasonal rainfall forecast for a relatively small country with complex meteorology. In particular, our results show that current models are not able to provide reliable forecasts of wet season rainfall totals—further work is needed to understand why this is the case, and where improvements can be made. Despite the lack of seasonal forecast skill, this work highlights the value of information about the average annual frequency and year-to-year variability of the selected agro-climatic indices, which will be useful to farmers, agricultural planners and policy makers by giving a better understanding of the climatological risk. In addition, our analysis suggests there is potential for adding value to seasonal forecasts, provided they are sufficiently skillful. For example, based on the available observations, we find two agro-climatic indices that exhibit a moderate correlation with total wet season rainfall (“heavy rainfall” and “dry spells”) which are regionally significant at the 1% level. In principle, these relatively strong relationships mean that a skillful forecast of total wet season rainfall would indirectly provide information about the likely number of heavy rainfall events and dry spells at sites of interest. However, doing so would require careful assessment of uncertainties in both the seasonal rainfall forecast and the local relationship with the agro-climatic indices. In contrast, “prolonged dry spell” and “consecutive 10-day rainfall” events are rare in the observational record, and there is no evidence for significant relationships with total wet season rainfall. More generally, improved understanding of historical events will complement existing efforts to engage and train farmers to better understand and use historical information for farming decisions in Malawi (Clarkson et al., 2019; Dorward et al., 2020). Further work is needed to understand how maize yield responds to variations in the agro-climatic indices explored in this work, using both field measurements and appropriate crop models.
Summary and Conclusions
The study explores two important components; identification of agro-climatic indices and understanding the climatological characteristics of the indices; that could enable the tailoring of seasonal forecast for the agricultural sector in Malawi. Our approach also reveals challenges in identifying and co-designing indices and thresholds, which is a crucial step in addressing the on-going challenge of including farmer-focused information in seasonal forecasts in Malawi. While we find that total seasonal rainfall could be useful entry point for including information about crop-specific agro-climatic indices, the choice of thresholds for agro-climatic indices requires careful validation. Continuous engagement between agriculture stakeholders and DCCMS to validate the indices will help identify the thresholds that could be used by the DCCMS to develop targeted forecasts. These forecasts could be then tailored over time to address feedback regarding usefulness and usability from a range of water, agriculture, and humanitarian sector stakeholders.
Data Availability Statement
The data analyzed in this study is subject to the following licenses/restrictions: The dataset used for analysis was made available by the Department of Climate Change and Meteorological Services, Malawi on request. Requests to access these datasets should be directed to Department of Climate Change and Meteorological Services, Malawi.
Ethics Statement
The studies involving human participants were reviewed and approved by Ethics approval was granted for the research by the ESSL, Environment and LUBS (AREA) Faculty Research Ethics Committee University of Leeds, reference 18-081. Written informed consent for participation was not required for this study in accordance with the national legislation and the institutional requirements.
Author Contributions
NM, SW, MB, and EP designed the study. NM and JB conducted the analysis. NM, SW, and EP wrote the manuscript. All authors contributed ideas and edited the manuscript.
Funding
We gratefully acknowledge funding from the UK Research and Innovation as part of the NERC Science for Humanitarian Emergencies and Relief programme under IPACE-Malawi (NE/S005900/1), and partial funding from the Global Challenges Research Fund under AFRICAP (BB/P027784/1).
Conflict of Interest
The authors declare that the research was conducted in the absence of any commercial or financial relationships that could be construed as a potential conflict of interest.
Acknowledgments
We thank all the farmers and agricultural extension officers for their time for participating in the discussions. We thank the Department for Climate Change and Meteorological Services, Malawi for providing station observations; Malawi Red Cross Society and Ileen Streefkerk for support in conducting the focus group discussions.
Supplementary Material
The Supplementary Material for this article can be found online at: https://www.frontiersin.org/articles/10.3389/fclim.2020.578553/full#supplementary-material
References
African Development Bank (2018). Malawi Bank Group Country Strategy Paper 2018-2022. Available online at: https://www.afdb.org/fileadmin/uploads/afdb/Documents/Project-and-Operations/Malawi_CSP_2018-2022.pdf
Bazo, J., Singh, R., Destrooper, M., and de Perez, E. C. (2019). “Chapter 18 - pilot experiences in using seamless forecasts for early action: the “Ready-Set-Go!” approach in the red cross,” in Sub-seasonal to Seasonal Prediction, eds. A. W. Robertson and F. Vitart (Elsevier), p. 387–398.
Bert, F. E., Satorre, E. H., Toranzo, F. R., and Podest,á, G. P. (2006). Climatic information and decision-making in maize crop production systems of the Argentinean Pampas. Agric. Syst. 88, 180–204. doi: 10.1016/j.agsy.2005.03.007
Bruno Soares, M., and Buontempo, C. (2019). Key challenges for the long-term sustainability of climate services. WIRES Clim. Change 10:e587. doi: 10.1002/wcc.587
Cairns, J. E., Hellin, J., Sonder, K., Araus, J. L., MacRobert, J. F., Thierfelder, C., et al. (2013). Adapting maize production to climate change in sub-Saharan Africa. Food Secur. 5, 345–360. doi: 10.1007/s12571-013-0256-x
Clarkson, G., Dorward, P., Osbahr, H., Torgbor, F., and Kankam-Boadu, I. (2019). An investigation of the effects of PICSA on smallholder farmers' decision-making and livelihoods when implemented at large scale–the case of Northern Ghana. Clim. Serv. 14, 1–14. doi: 10.1016/j.cliser.2019.02.002
Coulibaly, Y. J., Kundhlande, G., Tall, A., Kaur, H., and Hansen, J. (2015). Which Climate Services do Farmers and Pastoralists Need in Malawi? Baseline Study for the GFCS Adaptation Program in Africa. CCAFS Working Paper no. 112. Copenhagen: CGIAR Research Program on Climate Change, Agriculture and Food Security (CCAFS).
Dinku, T., Block, P., Sharoff, J., Hailemariam, K., Osgood, D., del Corral, J., et al. (2014). Bridging critical gaps in climate services and applications in Africa. Earth Perspect. 1:15. doi: 10.1186/2194-6434-1-15
Diro, G. T. (2016). Skill and economic benefits of dynamical downscaling of ECMWF ENSEMBLE seasonal forecast over southern Africa with RegCM4. Int. J. Climatol. 36, 675–688. doi: 10.1002/joc.4375
Dorward, P., Osbahr, H., Sutcliffe, C., and Mbeche, R. (2020). Supporting climate change adaptation using historical climate analysis. Clim. Dev. 12, 469–480. doi: 10.1080/17565529.2019.1642177
Dunning, C. M., Black, E. C., and Allan, R. P. (2016). The onset and cessation of seasonal rainfall over Africa. J. Geophys. Res. Atmos. 121, 11–405. doi: 10.1002/2016JD025428
Fisher, M., and Lewin, P. A. (2013). Household, community, and policy determinants of food insecurity in rural Malawi. Dev. South. Afr. 30, 451–467. doi: 10.1080/0376835X.2013.830966
Haigh, T., Takle, E., Andresen, J., Widhalm, M., Carlton, J. S., and Angel, J. (2015). Mapping the decision points and climate information use of agricultural producers across the US corn belt. Clim. Risk Manage. 7, 20–30. doi: 10.1016/j.crm.2015.01.004
Hansen, J. W., Vaughan, C., Kagabo, D. M., Dinku, T., Carr, E. R., Körner, J., et al. (2019). Climate services can support african farmers' context-specific adaptation needs at scale. Front. Sustain. Food Syst. 3:21. doi: 10.3389/fsufs.2019.00021
Heinzl, H., and Mittlböck, M. (2003). Pseudo R-squared measures for Poisson regression models with over- or underdispersion. Comput. Stat. Data Anal. 44, 253–271. doi: 10.1016/S0167-9473(03)00062-8
Hewitt, C., Mason, S., and Walland, D. (2012). The global framework for climate services. Nat. Clim. Chang. 2, 831–832. doi: 10.1038/nclimate1745
Ingram, K. T., Roncoli, M. C., and Kirshen, P. H. (2002). Opportunities and constraints for farmers of West Africa to use seasonal precipitation forecasts with Burkina Faso as a case study. Agric. Syst. 74, 331–349. doi: 10.1016/S0308-521X(02)00044-6
Jew, E. K., Whitfield, S., Dougill, A. J., Mkwambisi, D. D., and Steward, P. (2020). Farming systems and conservation agriculture: technology, structures and agency in Malawi. Land Use Policy 95:104612. doi: 10.1016/j.landusepol.2020.104612
Jury, M. R., Pathack, B., and Sohn, B. J. (1992). Spatial structure and interannual variability of summer convection over southern Africa and the SW Indian Ocean. S. Afr. J. Sci, 88, 275–280.
Kalanda-Joshua, M., Ngongondo, C., Chipeta, L., and Mpembeka, F. (2011). Integrating indigenous knowledge with conventional science: enhancing localised climate and weather forecasts in Nessa, Mulanje, Malawi. Phys. Chem. Earth Parts ABC 36, 996–1003. doi: 10.1016/j.pce.2011.08.001
Klemm, T., and McPherson, R. A. (2018). Assessing decision timing and seasonal climate forecast needs of winter wheat producers in the South-Central United States. J. Appl. Meteorol. Climatol. 57, 2129–2140. doi: 10.1175/JAMC-D-17-0246.1
Klopper, E., Vogel, C. H., and Landman, W. A. (2006). Seasonal climate forecasts–potential agricultural-risk management tools? Clim. Change 76, 73–90. doi: 10.1007/s10584-005-9019-9
Kniveton, D., Visman, E., Tall, A., Diop, M., Ewbank, R., Njoroge, E., et al. (2015). Dealing with uncertainty: integrating local and scientific knowledge of the climate and weather. Disasters 39(Suppl.), S35–S53. doi: 10.1111/disa.12108
Kniveton, D. R., Layberry, R., Williams, C. J. R., and Peck, M. (2009). Trends in the start of the wet season over Africa. Int. J. Climatol. 29, 1216–1225. doi: 10.1002/joc.1792
Liebmann, B., and Marengo, J. (2001). Interannual variability of the rainy season and rainfall in the Brazilian Amazon Basin. J. Clim. 14, 4308–4318. doi: 10.1175/1520-0442(2001)014<4308:IVOTRS>2.0.CO;2
Lobell, D. B., and Field, C. B. (2007). Global scale climate–crop yield relationships and the impacts of recent warming. Environ. Res. Lett. 2:014002. doi: 10.1088/1748-9326/2/1/014002
MacLachlan, C., Arribas, A., Peterson, K. A., Maidens, A., Fereday, D., Scaife, A. A., et al. (2015). Global seasonal forecast system version 5 (GloSea5): a high-resolution seasonal forecast system. Q. J. R Meteorol. Soc. 141, 1072–1084. doi: 10.1002/qj.2396
Mason, S. J., and Chidzambwa, S. (2008). Position Paper: Verification of African RCOF Forecasts. Technical Report 09-02. International Research Institute for Climate and Society, Columbia University.
Mathieu, J. A., and Aires, F. (2018). Assessment of the agro-climatic indices to improve crop yield forecasting. Agric. For. Meteorol. 253, 15–30. doi: 10.1016/j.agrformet.2018.01.031
Meadow, A. M., Ferguson, D. B., Guido, Z., Horangic, A., Owen, G., and Wall, T. (2015). Moving toward the deliberate coproduction of climate science knowledge. Weather Clim. Soc. 7, 179–191. doi: 10.1175/WCAS-D-14-00050.1
Nkiaka, E., Taylor, A., Dougill, A. J., Antwi-Agyei, P., Fournier, N., Bosire, E. N., et al. (2019). Identifying user needs for weather and climate services to enhance resilience to climate shocks in sub-Saharan Africa. Environ. Res. Lett. 14:123003. doi: 10.1088/1748-9326/ab4dfe
Nobre, G. G., Davenport, F., Bischiniotis, K., Veldkamp, T., Jongman, B., Funk, C. C., et al. (2019). Financing agricultural drought risk through ex-ante cash transfers. Sci. Total Environ. 653, 523–535. doi: 10.1016/j.scitotenv.2018.10.406
Ray, A. J., and Webb, R. S. (2016). “Understanding the user context: decision calendars as frameworks for linking climate to policy, planning and decision-making,” in Climate in Context: Science and Society Partnering for Adaptation, eds. A. Parris, G. M. Garfin, K. Dow, R. Meyer, and S. L. Close (New York, NY: John Wiley & Sons), p. 27–50.
Roncoli, C., Jost, C., Kirshen, P., Sanon, M., Ingram, K. T., Woodin, M., et al. (2008). From accessing to assessing forecasts: an end-to-end study of participatory climate forecast dissemination in Burkina Faso (West Africa). Clim. Change 92, 433–460. doi: 10.1007/s10584-008-9445-6
Simelton, E., Quinn, C. H., Batisani, N., Dougill, A. J., Dyer, J. C., Fraser, E. D. G., et al. (2013). Is rainfall really changing? Farmers' perceptions, meteorological data and policy implications. Clim. Dev. 5, 123–138. doi: 10.1080/17565529.2012.751893
Stevens, T., and Madani, K. (2016). Future climate impacts on maize farming and food security in Malawi. Sci. Rep. 6:36241. doi: 10.1038/srep36241
Steward, P. R., Thierfelder, C., Dougill, A. J., and Ligowe, I. (2019). Conservation agriculture enhances resistance of maize to climate stress in a Malawian medium-term trial. Agric. Ecosyst. Environ. 277, 95–104. doi: 10.1016/j.agee.2018.07.009
Tadross, M., Suarez, P., Lotsch, A., Hachigonta, S., Mdoka, M., Unganai, L., et al. (2009). Growing-season rainfall and scenarios of future change in southeast Africa: implications for cultivating maize. Clim. Res. 40, 147–161. doi: 10.3354/cr00821
Tembo-Nhlema, D., Vincent, K., and Henriksson Malinga, R. (2019). “Creating useful and usable weather and climate information – insights from participatory scenario planning in Malawi,” in Working Paper No. 357, Centre for Climate Change Economics and Policy/ Working Paper No. 325, Grantham Research Institute on Climate Change and the Environment (London: School of Economics and Political Sciences).
Trnka, M., Olesen, J. E., Kersebaum, K. C., Skjelvåg, A. O., Eitzinger, J., Seguin, B., et al. (2011). Agroclimatic conditions in Europe under climate change. Glob. Chang. Biol. 17, 2298–2318. doi: 10.1111/j.1365-2486.2011.02396.x
UNDP (2020). Information for the People. Available online at: https://undp-climate.exposure.co/malawi (accessed November 15, 2020).
Vaughan, C., Dessai, S., and Hewitt, C. (2018). Surveying climate services: what can we learn from a bird's-eye view? Weather Clim. Soc. 10, 373–395. doi: 10.1175/WCAS-D-17-0030.1
Venäläinen, A., Pilli-Sihvola, K., Tuomenvirta, H., Ruuhela, R., Kululanga, E., Mtilatila, L., et al. (2016). Analysis of the meteorological capacity for early warnings in Malawi and Zambia. Clim. Dev. 8, 190–196. doi: 10.1080/17565529.2015.1034229
Vincent, K., Daly, M., Scannell, C., and Leathes, B. (2018). What can climate services learn from theory and practice of co-production? Clim. Serv. 12, 48–58. doi: 10.1016/j.cliser.2018.11.001
Vincent, K., Dougill, A. J., Dixon, J. L., Stringer, L. C., and Cull, T. (2017). Identifying climate services needs for national planning: insights from Malawi. Clim. Policy 17, 189–202. doi: 10.1080/14693062.2015.1075374
Walker, D. P., Birch, C. E., Marsham, J. H., Scaife, A. A., Graham, R. J., and Segele, Z. T. (2019). Skill of dynamical and GHACOF consensus seasonal forecasts of East African rainfall. Clim. Dyn. 53, 4911–4935. doi: 10.1007/s00382-019-04835-9
Weedon, G. P., Balsamo, G., Bellouin, N., Gomes, S., Best, M. J., and Viterbo, P. (2014). The WFDEI meteorological forcing data set: WATCH forcing data methodology applied to ERA-Interim reanalysis data. Water Resour. Res. 50, 7505–7514. doi: 10.1002/2014WR015638
Wilks, D. S. (2006). On “field significance” and the false discovery rate. J. Appl. Meteorol. Climatol. 45, 1181–1189. Available online at: https://journals.ametsoc.org/view/journals/apme/45/9/jam2404.1.xml?tab_body=fulltext-display
World Bank (2009). Malawi: Economic Vulnerability and Disaster Risk Assessment. Drought and Flood Risk Atlas.
Keywords: agro-climatic indices, Africa, maize, farmers, decision making
Citation: Mittal N, Pope E, Whitfield S, Bacon J, Bruno Soares M, Dougill AJ, Homberg Mvd, Walker DP, Vanya CL, Tibu A and Boyce C (2021) Co-designing Indices for Tailored Seasonal Climate Forecasts in Malawi. Front. Clim. 2:578553. doi: 10.3389/fclim.2020.578553
Received: 30 June 2020; Accepted: 26 November 2020;
Published: 13 January 2021.
Edited by:
Simon Wang, Utah State University, United StatesReviewed by:
Parichart Promchote, Kasetsart University, ThailandCarla Roncoli, Emory University, United States
Copyright © 2021 Mittal, Pope, Whitfield, Bacon, Bruno Soares, Dougill, Homberg, Walker, Vanya, Tibu and Boyce. This is an open-access article distributed under the terms of the Creative Commons Attribution License (CC BY). The use, distribution or reproduction in other forums is permitted, provided the original author(s) and the copyright owner(s) are credited and that the original publication in this journal is cited, in accordance with accepted academic practice. No use, distribution or reproduction is permitted which does not comply with these terms.
*Correspondence: Neha Mittal, n.mittal@leeds.ac.uk