Investigating Rainfall Patterns in the Hubei Province, China and Northern Italy During the Covid-19 Lockdowns
 Ridwana Binte Sharif
 Paul Houser
 Valentina Aquila
 Viviana Maggioni
- 1Sid and Reva Dewberry Department of Civil, Environment, and Infrastructure Engineering, George Mason University, Fairfax, VA, United States
- 2Geography and Geoinformation Science Department, George Mason University, Fairfax, VA, United States
- 3Environmental Science Department, American University, Washington, DC, United States
In the spring of 2020, many countries enacted strict lockdowns to contain the spread of the 2019 coronavirus disease (COVID-19), resulting in a sharp observed decrease in regional atmospheric pollutant concentrations, such as NOx and aerosols in early 2020. Atmospheric composition can influence cloud properties and might have a significant effect on the initiation of precipitation. This study investigated changes in precipitation patterns during COVID-19 lockdowns and compared them to patterns observed during the previous 19 years (2001 through 2019) across two regions of interest, the Hubei province in China and Northern Italy using a satellite-based precipitation dataset. Results indicated that overall rainfall averages were higher in the spring of 2020 with respect to their corresponding climatological means, with higher standard deviations especially in the more urbanized regions like Wuhan, China and Milan, Italy. Precipitation rates observed during the Spring of 2020 tend to fall outside of the climatological 25–75th percentile bounds. Similarly, the number of rainy pixels was in several cases in Spring 2020 higher than the climatological 75th percentile and sometimes even higher than the 95th one. These anomalies may be due to natural variations and may not be caused directly by the reduction in atmospheric pollutant concentrations. Nevertheless, our analysis proved that precipitation patterns during the lockdowns were on the extreme tails of the precipitation climatological distributions for both regions of interest. Lastly, decorrelation lags and distances in Northern Italy remained similar to their corresponding climatological values, whereas in the Hubei province some differences were observed, with the Spring 2020 spatial correlation variogram almost overlapping the climatological 5th percentile and with a decorrelation distance shorter than the climatological value.
Introduction
The global coronavirus disease 2019 (COVID-19) pandemic halted normal human activities in many countries and often resulted in strict lockdowns in an effort to contain the spread of the virus related infection (Wang et al., 2020b). The central government of China placed a lockdown order in the epicenter of the outbreak, Wuhan city, on January 23, 2020 (Ibeh et al., 2020). Within hours from the order, travel restrictions were imposed in most public transport systems like buses, railways, ferries and flights with most of the highways closed and only one person per household allowed to exit once every 2 days to ensure home quarantine. Eventually, events and gatherings were canceled for practicing social distancing and public places as well as schools and universities started closing down (Lau et al., 2020). As the 2019–20 coronavirus pandemic worsened, similar measures were enacted around the globe, ranging from quarantine of confirmed and possibly infected individuals to community containments and shutdown of non-essential businesses, like manufacturing plants (Wilder-Smith and Freedman, 2020).
Though the restriction measures were implemented to flatten the epidemic curve, reduction of road traffic, industry, and power generation activities led to a considerable decrease in anthropogenic emissions in different lockdown regions in early 2020 (Tobías et al., 2020). Studies using satellite observations and local ground-based observations demonstrated such a decline in air pollution (Forster et al., 2020). For example, a decrease in nitrogen dioxide (NO2) levels across China during the lockdown period was observed when compared to NO2 concentrations before the pandemic (Kerimray et al., 2020). Several studies showed significant reduction in air pollutant concentrations, especially NO2 levels (with reductions as high as 30%), particularly in heavily polluted areas of China, Italy, Spain, and USA (Collivignarelli et al., 2020; Dantas et al., 2020; Lal et al., 2020; Otmani et al., 2020; Wang and Su, 2020).
Considerable reductions in the Aerosol Optical Depth (AOD), a proxy for aerosol concentrations, were also reported around the world during the COVID-19 lockdowns (Lal et al., 2020; Ranjan et al., 2020). About 10% of the total mass of aerosol particles present in the atmosphere is from anthropogenic sources and can dominate the air downwind of urban and industrial areas (Voiland, 2010). Fossil fuel combustion, automobiles, incinerators, smelters, and power plants are major producers of sulfates, nitrates, black carbon, and other particles. The presence of aerosols modifies the microphysics of clouds and, consequently, their albedo (Twomey, 1977), as well as the environment surrounding the cloud, leading to changes in cloud lifetime and precipitation occurrence (Albrecht, 1989; Pincus and Baker, 1994). While the impacts of aerosol-cloud interactions on the global climate are currently not known with high confidence (Boucher et al., 2013), observational studies showed local correlations between aerosol, cloud properties, and precipitation. Specifically, past work showed that aerosols have a significant effect on cloud properties and the initiation of precipitation, as they serve as cloud condensation nuclei (CCN; Feingold et al., 2003; Gassó, 2008; Yuan et al., 2011; Boucher et al., 2013; Constantino and Bréon, 2013; McCoy and Hartmann, 2015; Zamora et al., 2016). Large concentrations of anthropogenic aerosols can either decrease or increase rainfall as a result of their radiative effect and CCN activities (Rosenfeld et al., 2008; Koren et al., 2012; Fan et al., 2018; Li et al., 2019, 2021). Clouds with low CCN concentrations, on the one hand, evaporate too quickly to grow into long-lasting clouds. Heavily polluted clouds, on the other hand, dissipate much of their moisture before precipitating, if they can form at all, due to the decreased surface heating caused by the aerosol haze layer. Therefore, a sudden change in atmospheric aerosol concentration has the potential to impact the formation of precipitation and its regional patterns.
Aerosol-cloud interactions have an impact on the regional scale, changing local precipitation and temperature. Anthropogenic aerosol has the ability of suppressing precipitation (Givati and Rosenfeld, 2004; Li et al., 2019). Charles (2008) found that European weekend pollution variations have complex impacts on precipitation and weather depending on location and season. Angela and Vitart (2018) concluded that accounting for aerosol variability (rather than using a climatological value) can improve sub-seasonal forecasts with temperature bias reductions up to 2°C at the monthly scale. Wang et al. (2020a) suggested that aerosol changes can have a larger impact on extreme winter weather than greenhouse gases at the regional scale. Makar et al. (2015) showed a change in modeled precipitation during summertime of about 20% across North America in response to scenarios including/excluding aerosol feedback schemes. Keresztesi et al. (2019) analyzed rainfall chemistry in Europe and showed significant impact of anthropogenic emission sources on precipitation. Guo et al. (2018) investigated aerosol interaction with different rainfall regimes and established the fact that air pollution might affect the relationship between aerosol and precipitation regimes. Considering improvement in air quality as a temporary benefit (Kumar et al., 2020), the COVID-19 lockdown situation gave us an unprecedented opportunity to investigate any aerosol-induced precipitation pattern change.
In this study, we focused on changes in precipitation patterns in two regions, the Hubei Province in China and Northern Italy, during the lockdown period compared to previous years using satellite-based observations. By using a set of statistical approaches (e.g., mean, standard deviation, interquantile range, and decorrelation metrics), we performed analyses in terms of precipitation magnitude, number of rainy days, as well as temporal and spatial patterns and assess whether precipitation characteristics observed during the lockdown period fell within their natural variability or not. Section Methodology provides an overview of the study areas, the satellite precipitation dataset used in this study, and the methodological approach. Section Results and Discussion presents and discusses the results, while final conclusions are drawn in section Conclusion.
Methodology
Study Areas and Dataset
Although many countries around the world have enacted lockdown measures to contain the spread of the COVID-19 disease in the past year, this work focused only on the Hubei province in China (Figure 1) and Northern Italy (Figure 2). Several cities in the Hubei province, including the capital Wuhan, went into lockdown on January 23, 2020 by the order of the central government. The Italian prime minister ordered Northern Italy into a lockdown on March 8, 2020. These two regions were chosen because they were among the first ones to implement shelter-in-place orders. Moreover, these two areas, heavily industrial and often characterized by high air pollution levels, showed large changes in atmospheric pollution during Spring 2020 (Miyazaki et al., 2020; Lonati and Riva, 2021). The Hubei Province in China covers an area of 185,900 km2 with a population of 60.7 million. Major sources of air pollution in the region are emissions from industries, coal combustion, and motor vehicles (Liu et al., 2012; Wang et al., 2017). With an area of ~120,260 km2 and a population of 27.4 million, Northern Italy suffers from air pollution mainly due to heavy industrial activities, transportation, and stagnation of pollutants because of its geographic condition (Coker et al., 2020). The study was conducted across the two regions of interest using a 20 year-long time series, spanning from 2001 to 2020. For the Hubei province, we considered the period from January to April, whereas for Northern Italy, we analyzed the period from March to May to study the precipitation patterns for the entire duration of the lockdown in the two regions.
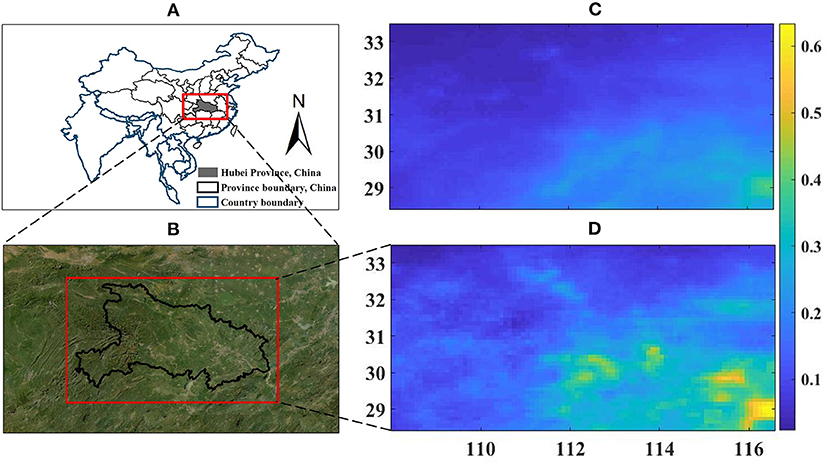
Figure 1. (A) Location of the study area in the Hubei province, China; (B) Boundaries of the study areas overlying the “World Imagery” ArcGIS Online basemap (Sources: Esri, DigitalGlobe, GeoEye, i-cubed, USDA FSA, USGS, AEX, Getmapping, Aerogrid, IGN, IGP, swisstopo, and the GIS User Community); (C) Average IMERG precipitation in mm/hour during January-April of 2001–2019; and (D) Average IMERG precipitation in mm/hour during January-April 2020.

Figure 2. (A) Location of the study area in Italy; (B) Boundaries of the study areas in Northern Italy overlying the “World Imagery” ArcGIS Online basemap (Sources: Esri, DigitalGlobe, GeoEye, i-cubed, USDA FSA, USGS, AEX, Getmapping, Aerogrid, IGN, IGP, swisstopo, and the GIS User Community); (C) Average IMERG precipitation in mm/hour during January-April of 2001-2019; and (D) Average IMERG precipitation in mm/hour during January-April 2020.
For this study, we used the Global Precipitation Mission (GPM)-based precipitation IMERG (Integrated Multi-satellite Retrievals for GPM; Huffman et al., 2015). IMERG provides gridded (10 km), half-hourly estimates of precipitation, developed by intercalibrating and blending all satellite microwave precipitation estimates with infrared-based images and ground observations for 2001-present (Huffman et al., 2020). The IMERG algorithm is run to produce three different versions. The Early version is run in near real time; the Late version has a 12-hr latency and is bias adjusted to climatological sets of coefficients, whereas the Final version produces bias-corrected estimates with a latency of 3.5 months. IMERG is well-known for its global availability, its high temporal and spatial resolution, and good performance across several regions of the world (Zhang et al., 2018; Khan and Maggioni, 2019). Given the regional focus of this work, the IMERG Late version was chosen because of its latency and quality.
The Hubei province is characterized by a subtropical monsoon climate and by a diverse topography including flat, mountain and hilly areas. Higher temperature and precipitation rates fare thus registered from June to August (Wang and Li, 2016). On the other hand, Northern Italy belongs to the Mediterranean climatic region with cold winters and humid summers (Molteni et al., 1983; Deitch et al., 2017). During the time series analyzed in this work (2001–2020), the average IMERG Late precipitation recorded in the Hubei province during January-April was 349 and 204 mm in Northern Italy during March-May. Overall, April was the rainiest month in the Hubei province and May was the rainiest in Northern Italy. The daily average precipitation was 2.91 mm/d (2.21 mm/d) with maximum daily precipitation of 6.55 mm (5.22 mm) and minimum daily precipitation of 0.36 mm (0.24 mm) across the Hubei Province (Northern Italy).
Statistical Analyses
For both study regions, the half-hourly IMERG precipitation data were converted to daily rainfall magnitudes for each year from 2001 to 2020. Specifically, we investigated whether precipitation characteristics observed during the 2020 lockdown periods fell within the precipitation natural variability observed in the region during 2001–2019. Thus, the regional average precipitation in the Spring of 2020 was compared to the probability distribution of precipitation built based on the 2001–2019 time series. Analyses were performed to assess how often the 2020 average fell within certain inter-quantile ranges (or bounds), defined as the 25–75th and the 5–95th bounds of the previous 19 years. Similar kind of analyses were conducted for both rainfall magnitude and the number of rainy pixels. For this latter, the percent number of rainy pixels was computed based on the pixels showing daily averages larger than 0 mm/day across the region. Then, we assessed how often the 2020 rainy pixel percentage fell within the percentile ranges (i.e., 25–75th and 5–95th bounds) of rainy pixels based on the previous 19 years.
Furthermore, the two-sample Kolmogorov-Smirnov test was adopted to compare the precipitation observed in Spring 2020 to each one of the previous 19 years and verify whether the time series were statistically different from each other. Specifically, the 2020 time series of half-hourly IMERG precipitation was tested against each time series of the previous 19 years and also against the 19-year average time series of precipitation magnitude. The null hypothesis was set to be “the two time series come from the same continuous distribution” and a significance level of 0.01 was chosen.
Spatio-Temporal Patterns
Next, we studied whether the spatio-temporal variability of precipitation patterns during the lockdown periods was any different than the patterns observed during 2001–2020 using de-correlation metrics, which are standard tools for measuring spatial and temporal dependencies in rainfall fields (Brown et al., 2001; Chumchean et al., 2003). To investigate temporal variability, correlation coefficients were computed for each year during 2001–2020 for different time lags with time series of rainy pixels as precipitation events for each time step. The 2020 correlogram (i.e., autocorrelations plotted as a function of time lags) was compared to the 2001–2019 mean correlogram, as well as the 25–75th and 5–95th inter-quantile ranges. When assessing temporal correlations, it is important to keep as much of the original temporal information as possible (Emelianenko and Maggioni, 2019). Therefore, correlations were computed based on the original IMERG half-hourly data.
To study precipitation spatial variability, the correlation of the time series associated with any two pixels were plotted as a function of their distance. Thus, similar kind of variograms as for temporal correlations were generated. An exponential decay model was fitted to both temporal and spatial variograms. The lag at which the correlation is 1/e (where, e is Euler's number) is called decorrelation lag or lag-one correlation and defines the decorrelation lag (or distance; Hossain and Anagnostou, 2006; Di et al., 2020). The decorrelation value suggests at which point (in time or space) two events stop to be correlated (i.e., the two precipitation events are no longer part of the same storm system). Decorrelation lags and lengths for 2020 were compared to the ones observed in the previous 19 years.
Results and Discussion
Precipitation Magnitude and Frequency
As a first step, regional maps of average precipitation during January-April (March-May) of 2001–2019 were compared to the 2020 average in the Hubei province in Figure 1 (Northern Italy in Figure 2). In both study areas, precipitation averages in 2020 were higher than the corresponding past 19 years with an average of 0.19 mm/h (0.11 mm/h) in Spring 2020 compared to the climatological average of 0.12 mm/h (0.09 mm/h) from the previous 19 years in the Hubei province (Northern Italy). Maximum and minimum precipitation values in the average maps were also higher than in the previous 19 years in Hubei Province, China. However, in Northern Italy, although the maximum precipitation in 2020 was higher than the climatological value, the minimum precipitation in 2020 was lower than in the previous 19 years. It is interesting to note that in both 2020 maps there was a region that was clearly rainier than the rest of the study area. Specifically, the rainiest region in the Hubei province was located in the south-eastern portion and for Northern Italy was in the central area. In both cases, such region corresponds to a heavily industrial (and usually more polluted) area, i.e., the city of Wuhan (precisely located in the south-eastern part of Hubei province) and the city of Milan in Northern Italy.
In order to assess the variability of precipitation during the two periods of interest and in the two study regions, the standard deviation during each Spring (from 2001 to 2020) was analyzed (Figure 3). In the Hubei province, the precipitation standard deviation in 2020 was very close to the maximum value ever recorded during the 2001–2019 period. In Northern Italy, the 2020 standard deviation was slightly higher than the 75th percentile, but lower than the maximum value. Thus, the precipitation observed in Spring 2020 showed much more variability with respect to the climatological median in both regions. Specifically, for the Hubei province (Northern Italy), the standard deviation of precipitation in Spring 2020 was 41% (22%) higher than the average standard deviation of the previous 19 years.
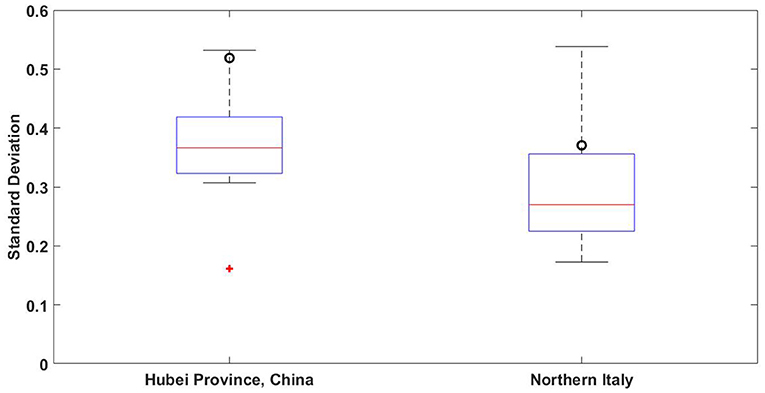
Figure 3. Boxplot of standard deviations (in mm/hr) computed for each Spring of 2001–2019 for the Hubei province and Northern Italy. The central red mark indicates the median, and the bottom/top edges indicate the 25th/75th percentiles, the whiskers show the most extreme points not considered outliers, whereas the red crosses represent outliers from 19 years data of standard deviations. The black circles indicate the corresponding standard deviations for Spring 2020.
For further investigation, we analyzed time series of daily precipitation averaged across the two regions of interest (Figure 4). Specifically, the regional average precipitation during the Spring of 2020 was compared to the probability distribution (5th, 25th, 50th, 75th, and 95th percentiles) of precipitation during 2001–2019. In the Hubei province, the 2020 daily precipitation rates mostly fell within the climatological distribution and there was no specific month during which 2020 precipitation rates were particularly low or high. On the contrary, in Northern Italy larger (than normal) precipitation events were recorded at the very beginning of the lockdown (early March) and in the late Spring, with a long period of very low rainfall rates. As shown by the time series, May was wetter than the other months and in 2020 May was even wetter than usual in the region, with the seasonal average being very close to the climatological 95th percentile. In order to better understand precipitation events in these regions, we computed the number of days during which the 2020 average fell outside the 2001–2019 percentile bounds of interest (Table 1). For the Chinese Hubei province, in about 46% of the cases the 2020 average was outside the 25–75th percentile bounds observed in the previous 19 years and 17% of the times it was outside the 5–95th bounds. Similarly, for Northern Italy the 2020 average was outside the 25–75th bounds in about 73% of the cases and outside the 5–95th range 19% of the times.
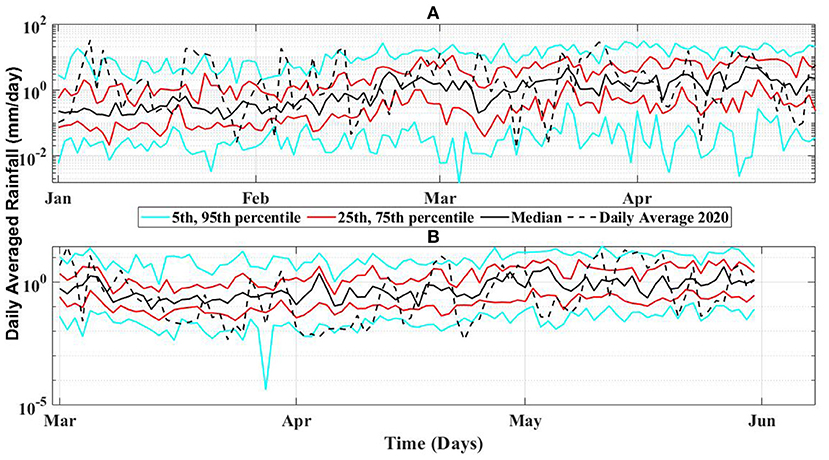
Figure 4. Time series of daily averaged IMERG precipitation in mm/day across the (A) Hubei Province, China and (B) Northern Italy, showing the 5th, 25th, 50th (median), 75th, and 95th percentiles of the precipitation distribution observed during the springs of 2001–2019 and average values during spring 2020 (dashed black line).
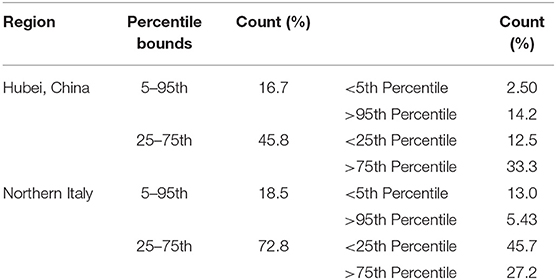
Table 1. Number of times (in %) that the 2020 daily average rainfall magnitude falls outside the climatological percentile bounds.
We can therefore conclude that the rainfall magnitudes observed in 2020 tend to sit in the extreme region of the climatological distribution obtained from the past 19 years. It is important to note that such anomalies may be due to natural variations and may not be related to the reduction in air pollution in the regions of interest. This work represents a first attempt to analyze precipitation patterns during the lockdowns to verify whether any anomalies can be identified with respect to the regional climatologies.
The same analyses were conducted for the number of rainy pixels across each region (Figure 5). It is interesting to note that in the Hubei province, there was a tendency for the percentage of rainy pixels to be higher than the 75th (and in a few cases higher than the 95th) percentile. Similarly to the rainfall rate patterns observed in Figure 4, the number of rainy pixels in Northern Italy was higher than 95th percentile in early March and in the late Spring, but lower than normal during the rest of the season, with almost half of the cases below the climatological 25th percentile. This corresponded to more spatially-distributed events with larger precipitation rates at the beginning and end of the season and smaller and more localized storms in late March through April.
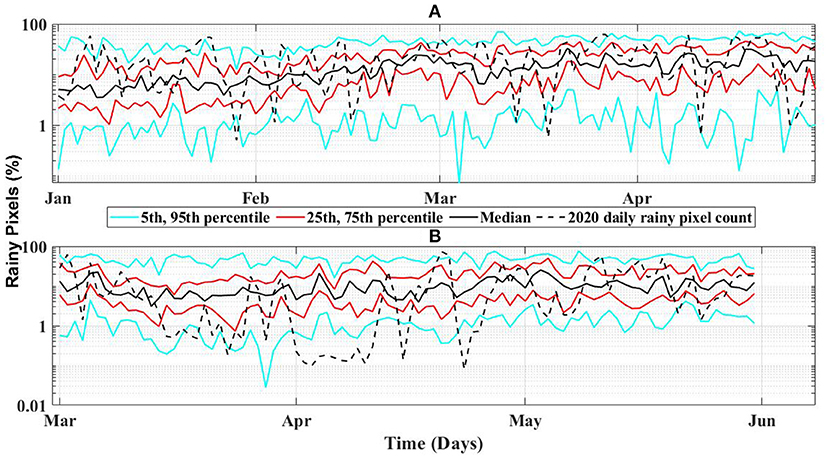
Figure 5. Time series of rainy pixels (in %) across the (A) Hubei Province, China and (B) Northern Italy, showing the 5th, 25th, 50th (median), 75th, and 95th percentiles of the precipitation distribution observed during the springs of 2001-2019 and the daily rainy pixel count during spring 2020 (dashed black line).
Similar to Tables 1, 2 showed how many times the percent number of daily rainy pixels in year 2020 fell outside the 2001–2019 percentile bounds of interest. For the Hubei province, in about 53% (18%) of the cases the 2020 time series data were outside the climatological 25–75th (5–95th) range, whereas Northern Italy showed that about 62% (26%) of the 2020 cases were outside the 25–75th (5–95th) bounds. Results were very similar to the ones found for precipitation magnitudes, with several cases in Spring 2020 being higher than the climatological 75th percentile and sometimes even higher than the 95th one.

Table 2. Number of times (in %) that the 2020 daily rainy pixel number falls outside the climatological percentile bounds.
The two-sample Kolmogorov-Smirnov test was then performed to verify whether the precipitation observed in year 2020 and the one observed in any previous year were statistically different from each other. The null hypothesis was defined as “the two time series came from same continuous distributions.” All tests run between year 2020 and each one of previous 19 years rejected the null hypothesis at the 99% confidence level. The null hypothesis was also rejected when testing the 2020 time series and the average of the 19-year time series, which confirmed what observed in the time series and analyses presented above.
Temporal and Spatial Decorrelation
Precipitation temporal variability was investigated by computing correlation coefficients between lagged time series of rainy pixels, using half hourly lags from 1 to 50, and by plotting them as a function of the temporal lag (Figure 6). The vertical axis thus shows autocorrelations between lagged time series and the horizontal axis presents different half hourly time lags. An exponential decay model was then fitted to the variogram, as shown in Figure 6. For the Hubei province, the decorrelation lag based on the past 19 spring seasons is 28 half hours (=14 h) and in year 2020 is 34 half hours (=17 h). Longer decorrelation lags correspond to longer precipitation events that are commonly stratiform systems (rather than convective storms) of wider spatial extensions (Anders et al., 2006; Wu et al., 2008; Jameson and Kostinski, 2010; Gensic et al., 2016). For Northern Italy, the decorrelation lag based on climatological values was 26 half hours (=13 h) and in year 2020 it slightly reduced to 24 half hours (=12 h). Overall, the 2020 line was very close to the climatological median. Nevertheless, for short lags (<5 h), the dashed line sat in between the climatological 75 and 95th percentiles, i.e., toward the high end of the climatological distribution.
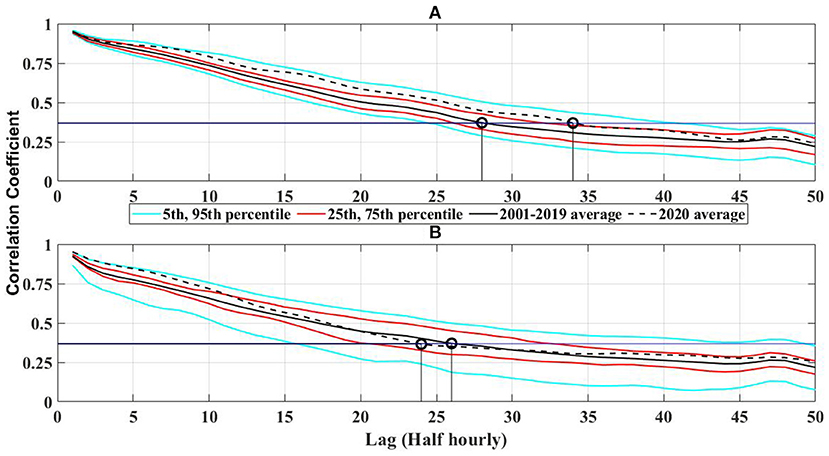
Figure 6. Variogram of temporal correlations for a half hourly precipitation in the (A) Hubei province during January-April, 2001–2020 and (B) Northern Italy during March-May, 2001–2020, showing the mean, 5th, 25th, 75th, and 95th percentiles for 2001–2019 and the mean for 2020. The horizontal solid line represents a correlation value of 1/e and the corresponding decorrelation lags.
In order to assess the spatial extent of precipitation systems, we investigated spatial correlation coefficients. Spatial variograms were built similarly to the temporal variograms presented in Figure 6 during the Spring of the past 19 years and for 2020 (Figure 7). In this case, the vertical axis shows correlation coefficients between time series associated with any two pixels as a function of their Euclidean distance. For the Chinese Hubei province, the variogram almost overlapped with the climatological 5th percentile, showing a decorrelation lag shorter than usual. Decorrelation distances in the region were larger than 150 km (as the correlograms in the plot do not reach the 1/e threshold). The higher the decorrelation distance, the more extended the precipitation system is; the shorter the decorrelation distance, the more localized systems are and the higher precipitation spatial variability is (Delahaye et al., 2015; Armon et al., 2020). Results showed that Spring 2020 was characterized by longer, but more localized, events in the Hubei province. In Northern Italy, the 2020 variogram almost overlapped the climatological median computed based on the previous 19 years, with a decorrelation distance of about 120 km. Thus, the temporal and spatial distribution of rainfall in the Spring of 2020 did not show any considerable difference with respect to its natural variability.
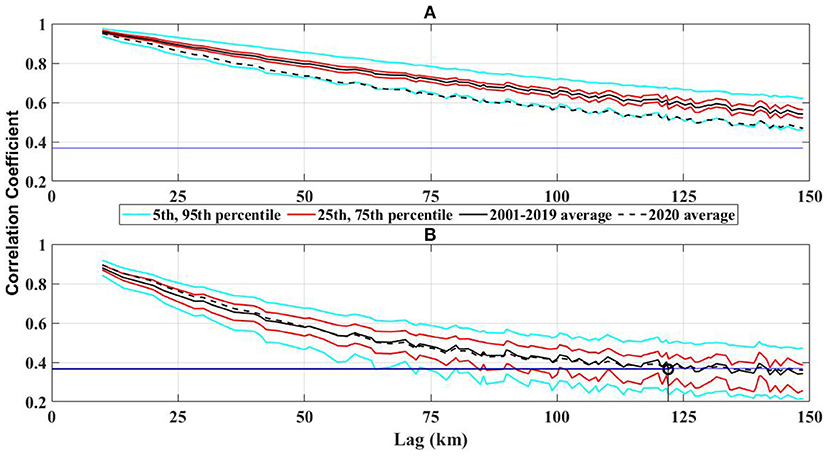
Figure 7. Variogram of spatial correlations for a daily precipitation in the (A) Hubei province during January-April, 2001–2020 and (B) Northern Italy during March-May, 2001–2020, showing the mean, 5th, 25th, 75th, and 95th percentiles for 2001–2019 period and the mean for 2020. The horizontal solid line represents a correlation value of 1/e and the corresponding decorrelation distances.
Conclusion
The primary goal of this study was to investigate if precipitation patterns during the COVID-19 lockdowns fell within the natural variability of precipitation, defined by the probability distributions during the previous 19 years (2001 through 2019) across two regions of interest, the Hubei province in China and Northern Italy. A global satellite precipitation dataset, IMERG, was used to analyze local temporal and spatial patterns of rainfall in the two study regions.
Results indicated that overall rainfall averages were higher in the Spring of 2020 with respect to their corresponding climatological means, with larger variations around those means. Such difference was even more pronounced in the most polluted regions, where the cities of Wuhan and Milan are located. This is potentially due to sharp decrease in emissions of NOx and anthropogenic aerosols observed during lockdown. Atmospheric aerosols can influence cloud properties as they serve as cloud condensation nuclei (CCN) and they might have a significant effect on the initiation of precipitation and its pattern (Wehbe et al., 2021).
Rain rates observed during the Spring of 2020 mostly fell outside of the climatological 25–75th percentile bounds. Although differences in precipitation between Spring 2020 and the past 19 years were statistically significant, the observed anomalies may be due to synoptic conditions and large-scale atmospheric dynamics and may not be caused directly by the reduction in atmospheric pollutant concentrations (NOx and aerosols). Nevertheless, our analysis proved that precipitation patterns during the lockdowns sat on the extreme tails of the precipitation climatological distributions and should therefore be further investigated.
The spatio-temporal variability of rainfall in the regions also highlighted some differences with respect to the climatological behavior, especially in the Hubei Province where longer decorrelation lags were identified in the Spring of 2020, which demonstrated that events were longer but more localized. These results should also be corroborated by additional studies in other regions where the reduction in atmospheric pollutants was also evident during COVID-19 imposed lockdowns (Sanap, 2021).
Further work should explore the sources and reasons behind the changes in precipitation patterns identified in this work. This could be pursued by using a combination of satellite-based observations and atmospheric or climatological model simulations to verify any existing link between changes in anthropogenic pollution and local/regional precipitation and meteorological patterns. Future work could also look at changes in precipitation or AOD in other regions using satellite-based products.
Data Availability Statement
The raw data supporting the conclusions of this article will be made available by the authors, without undue reservation.
Author Contributions
RS performed the data collection, analysis, writing of original draft, and draft revisions. PH was responsible for the initial idea and provided feedback on the analysis and methodology. VA helped with the draft revision and provided constructive feedback on the data analysis. VM was responsible for the initial idea, supervised the analysis, and helped with the manuscript writing. All authors contributed to the article and approved the submitted version.
Conflict of Interest
The authors declare that the research was conducted in the absence of any commercial or financial relationships that could be construed as a potential conflict of interest.
Publisher's Note
All claims expressed in this article are solely those of the authors and do not necessarily represent those of their affiliated organizations, or those of the publisher, the editors and the reviewers. Any product that may be evaluated in this article, or claim that may be made by its manufacturer, is not guaranteed or endorsed by the publisher.
References
Albrecht, B. A. (1989). Aerosols, cloud microphysics, and fractional cloudiness. Science 245, 1227–1230. doi: 10.1126/science.245.4923.1227
Anders, A. M., Roe, G. H., Hallet, B., Montgomery, D. R., Finnegan, N. J., and Putkonen, J. (2006). Spatial Patterns of Precipitation and Topography in the Himalaya. Geological Society of America. 39–53. doi: 10.1130/2006.2398(03)
Angela, B., and Vitart, F. (2018). Can the direct effect of aerosols improve subseasonal predictability? Monthly Weather Rev. 146, 3481–3498. doi: 10.1175/MWR-D-17-0282.1
Armon, M., Marra, F., Enzel, Y., Rostkier-edelstein, D., and Morin, E. (2020). Radar-based characterisation of heavy precipitation in the Eastern Mediterranean and its representation in a convection-permitting model. Hydrol. Earth Syst. Sci. 24, 1227–1249. doi: 10.5194/hess-24-1227-2020
Boucher, O., Randall, D., Artaxo, P., Bretherton, C., Feingold, G., Forster, P., et al. (2013). “Clouds and aerosols,” in Climate Change 2013 the Physical Science Basis: Working Group I Contribution to the Fifth Assessment Report of the Intergovernmental Panel on Climate Change (Cambridge, UK; New York, NY: Cambridge University Press), 571–658.
Brown, P. E., Diggle, P. J., Lord, M. E., and Young, P. C. (2001). Space - time calibration of radar rainfall data. Appl. Stat. 221–241. doi: 10.1111/1467-9876.00230
Charles, K. (2008). How pollution influences the weekend weather. Nature 2008:1017. doi: 10.1038/news.2008.1017
Chumchean, S., Sharma, A., and Seed, A. (2003). Radar rainfall error variance and its impact on radar rainfall calibration. Phys. Chem. Earth 28, 27–39. doi: 10.1016/S1474-7065(03)00005-6
Coker, E. S., Cavalli, L., Fabrizi, E., Guastella, G., Lippo, E., Parisi, M. L., et al. (2020). The effects of air pollution on COVID-19 related mortality in Northern Italy. Environ. Resour. Econ. 2020, 1–24. doi: 10.1007/s10640-020-00486-1
Collivignarelli, M. C., Abbà, A., Bertanza, G., Pedrazzani, R., Ricciardi, P., and Miino, M. C. (2020). Lockdown for CoViD-2019 in Milan: what are the effects on air quality? Sci. Tot. Environ. 732:139280. doi: 10.1016/j.scitotenv.2020.139280
Constantino, L., and Bréon, F.-M. (2013). Satellite-based estimate of aerosol direct radiative effect over the South-East Atlantic. atmosphere. Chem. Phys. Discuss. 13, 23295–23324. doi: 10.5194/acpd-13-23295-2013
Dantas, G., Siciliano, B., França, B. B. M., da Silva, C., and Arbilla, G. (2020). The impact of COVID-19 partial lockdown on the air quality of the City of Rio de Janeiro, Brazil. Sci. Tot. Environ. 729:139085. doi: 10.1016/j.scitotenv.2020.139085
Deitch, M. J., Sapundjieff, M. J., and Feirer, S. T. (2017). Characterizing precipitation variability and trends in the world's mediterranean-climate areas. Water 9, 1–21. doi: 10.3390/w9040259
Delahaye, F., Kirstetter, P.-E., Dubreuil, V., Machado, L. A. T., Vila, D. A., and Clark, R. (2015). A consistent gauge database for daily rainfall analysis over the Legal Brazilian Amazon. J. Hydrol. 527, 292–304. doi: 10.1016/j.jhydrol.2015.04.012
Di, Z. W., Maggioni, V., Mei, Y., Vazquez, M., Houser, P., and Emelianenko, M. (2020). Centroidal voronoi tessellation based methods for optimal rain gauge location prediction. J. Hydrol. 584:124651. doi: 10.1016/j.jhydrol.2020.124651
Emelianenko, M., and Maggioni, V. (2019). Mathematical Challenges in Measuring Variability Patterns for Precipitation Analysis. Springer. Mathematics of Planet Earth. 55–74. doi: 10.1007/978-3-030-22044-0_3
Fan, J., Rosenfeld, D., Zhang, Y., Giangrande, S. E., Li, Z., Machado, L. A. T., et al. (2018). Substantial convection and precipitation enhancements by ultrafine aerosol particles. Science 418, 411–418. doi: 10.1126/science.aan8461
Feingold, G., Eberhard, W. L., Veron, D. E., and Previdi, M. (2003). First measurements of the twomey indirect effect using ground-based remote sensors. Geophys. Res. Lett. 30, 19–22. doi: 10.1029/2002GL016633
Forster, P. M., Forster, H. I., Evans, M. J., Gidden, M. J., Jones, C. D., Keller, C. A., et al. (2020). Current and future global climate impacts resulting from COVID-19. Nat. Climate Change 91, 1–30. doi: 10.1038/s41558-020-0883-0
Gassó, S. (2008). Satellite observations of the impact of weak volcanic activity on marine clouds. J. Geophys. Res. 113, 1–14. doi: 10.1029/2007JD009106
Gensic, J. L., Baldwin, M., and Wandishin, M. S. (2016). Relationships Between Sounding-Based Parameters and Precipitation Field Decorrelation. Research Experience for Undergraduates Final Project.
Givati, A., and Rosenfeld, D. (2004). Quantifying precipitation suppression due to air pollution. J. Appl. Meteorol. 1038–1056. doi: 10.1175/1520-0450(2004)043<1038:QPSDTA>2.0.CO;2
Guo, J., Liu, H., Li, Z., Rosenfeld, D., Jiang, M., Xu, W., et al. (2018). Aerosol-induced changes in the vertical structure of precipitation : a perspective of TRMM precipitation radar. Atmos. Chem. Phys. 18, 13329–13343. doi: 10.5194/acp-18-13329-2018
Hossain, F., and Anagnostou, E. N. (2006). A two-dimensional satellite rainfall error model. IEEE Trans. Geosci. Remote Sens. 44, 1511–1522. doi: 10.1109/TGRS.2005.863866
Huffman, G. J., Bolvin, D. T., Braithwaite, D., Hsu, K.-L., Joyce, R., Kidd, C., et al. (2015). NASA Global Precipitation Measurement (GPM) Integrated Multi-SatellitE Retrievals for GPM (IMERG) Prepared for: Global Precipitation Measurement (GPM) National Aeronautics and Space Administration (NASA). Algorithm Theoretical Basis Document (ATBD) Version 4.5, no. November: 26. National Aeronautics and Space Administration (NASA).
Huffman, G. J., Bolvin, D. T., Braithwaite, D., Hsu, K.-L., Joyce, R., Kidd, C., et al. (2020). “Integrated multi-satellite retrievals for the global precipitation measurement (GPM) mission (IMERG),” in Satellite Precipitation Measurement. Advances in Global Change Research, vol 67, eds V. Levizzani, C. Kidd, D. Kirschbaum, C. Kummerow, K. Nakamura, F. Turk (Cham: Springer), 343–53. doi: 10.1007/978-3-030-24568-9_19
Ibeh, I. N., Enitan, S. S., Akele, R. Y., and Isitua, C. C. (2020). A review of the COVID-19 pandemic and the role of medical laboratory scientists in containment. J. Med. Lab. Sci. 2020, 68–89. Available online at: https://www.researchgate.net/publication/340916952_A_Review_of_the_COVID-19_Pandemic_and_the_Role_of_Medical_Laboratory_Scientists_in_containment
Jameson, A. R., and Kostinski, A. B. (2010). On the enhanced temporal coherency of radar observations in precipitation. J. Appl. Meteorol. Cimatol. 49, 1794–1804. doi: 10.1175/2010JAMC2403.1
Keresztesi, Á., Birsan, M.-V., Nita, I.-A., Bodor, Z., and Szép, R. (2019). Assessing the neutralisation, wet deposition and source contributions of the precipitation chemistry over Europe during 2000–2017. Environ. Sci. Europe 31:50. doi: 10.1186/s12302-019-0234-9
Kerimray, A., Baimatova, N., Ibragimova, O. P., Bukenov, B., Kenessov, B., Plotitsyn, P., et al. (2020). Assessing air quality changes in large cities during COVID-19 lockdowns: the impacts of traffic-free urban conditions in Almaty, Kazakhstan. Sci. Tot. Environ. 730:139179. doi: 10.1016/j.scitotenv.2020.139179
Khan, S., and Maggioni, M. (2019). Assessment of level-3 gridded global precipitation mission (GPM) products over oceans. Remote Sens. 11. doi: 10.3390/rs11030255
Koren, I., Altaratz, O., Remer, L. A., Feingold, G., Martins, J. V., and Heiblum, R. H. (2012). Aerosol-induced intensification of rain from the tropics to the mid-latitudes. Nat. Geosci. 5, 3–7. doi: 10.1038/ngeo1364
Kumar, P., Hama, S., Omidvarborna, H., Sharma, A., Sahani, J., Abhijith, K. V., et al. (2020). Temporary reduction in fine particulate matter due to ‘anthropogenic emissions switch-off’ during COVID-19 lockdown in Indian Cities. Sustain. Cities Soc. 62:102382. doi: 10.1016/j.scs.2020.102382
Lal, P., Kumar, A., Kumar, S., Kumari, S., Saikia, P., Dayanandan, A., et al. (2020). The dark cloud with a silver lining: assessing the impact of the SARS COVID-19 pandemic on the global environment. Sci. Tot. Environ. 732:139297. doi: 10.1016/j.scitotenv.2020.139297
Lau, H., Khosrawipour, V., Kocbach, P., Mikolajczyk, A., Schubert, J., Bania, J., et al. (2020). The positive impact of lockdown in Wuhan on containing the COVID-19 outbreak in China. J. Travel Med. 27, 1–7. doi: 10.1093/jtm/taaa037
Li, F., Lin, W., Jiang, B., and Li, J. (2021). The difference and linkage between aerosol direct and indirect effects on precipitation over Southeast Asia during summer 2015. J. Atmospher. Solar-Terrestrial Phys. 226:105778. doi: 10.1016/j.jastp.2021.105778
Li, Z., Wang, Y., Guo, J., Zhao, C., Cribb, M. C., Dong, X., et al. (2019). East Asian Study of tropospheric aerosols and their impact on regional clouds, precipitation, and climate (EAST - AIR CPC). J. Geophys. Res. 2019, 26–54. doi: 10.1029/2019JD030758
Liu, Q., Zhang, L., Li, J., Zuo, D., Kong, D., Shen, X., et al. (2012). The gap in injury mortality rates between urban and rural residents of Hubei Province, China. BMC Public Health 12:180. doi: 10.1186/1471-2458-12-180
Lonati, G., and Riva, F. (2021). Regional Scale Impact of the COVID-19 Lockdown on Air Quality : Gaseous Pollutants in the Po Valley, Northern Italy. Atmospher. 12, 264. doi: 10.3390/atmos12020264
Makar, P. A., Gong, W., Milbrandt, J., Hogrefe, C., Zhang, Y., Curci, G., et al. (2015). Feedbacks between air pollution and weather, part 1: effects on weather. Atmospher. Environ. 115, 442–469. doi: 10.1016/j.atmosenv.2014.12.003
McCoy, D. T., and Hartmann, D. L. (2015). Observations of a substantial cloud aerosol indirect effect during the 2014-2015 Bárð*arbunga-Veið*ivötn Fissure Eruption in Iceland. Geophys. Res. Lett. 42, 10409–10414. doi: 10.1002/2015GL067070
Miyazaki, K., Bowman, K., Sekiya, T., Jiang, Z., Chen, X., Eskes, H., et al. (2020). Air quality response in China linked to the 2019 novel coronavirus (COVID-19) lockdown. Geophys. Res. Lett. 47, 1–10. doi: 10.1029/2020GL089252
Molteni, F., Bonelli, P., and Bacci, P. (1983). Precipitation over Northern Italy: a description by means of principal component analysis. J. Appl. Meteorol. Climatol. 22, 1738–1752. doi: 10.1175/1520-0450(1983)022<1738:PONIAD>2.0.CO;2
Otmani, A., Benchrif, A., Tahri, M., Bounakhla, M., Chakir, E. M., Bouch, M. E., et al. (2020). Impact of Covid-19 lockdown on PM10, SO2 and NO2 concentrations in Salé City (Morocco). Sci. Tot. Environ. 735:139541. doi: 10.1016/j.scitotenv.2020.139541
Pincus, R., and Baker, M. B. (1994). Effect of precipitation on the albedo susceptibility of clouds in the marine boundary layer. Nature 372, 250–252. doi: 10.1038/372250a0
Ranjan, A. K., Patra, A. K., and Gorai, A. K. (2020). Effect of lockdown due to SARS COVID-19 on Aerosol Optical Depth (AOD) over urban and mining regions in India. Sci. Tot. Environ. 745:141024. doi: 10.1016/j.scitotenv.2020.141024
Rosenfeld, D., Lohmann, U., Raga, G. B., O'Dowd, C. D., Kulmala, M., Fuzzi, S., et al. (2008). Flood or drought: how do aerosols affect precipitation? Science 321, 1309–1313. doi: 10.1126/science.1160606
Sanap, S. D. (2021). Global and regional variations in aerosol loading during COVID-19 imposed lockdown. Atmospher. Environ. 246:118132. doi: 10.1016/j.atmosenv.2020.118132
Tobías, A., Carnerero, C., Reche, C., Massagué, J., Via, M., Minguillón, M. C., et al. (2020). Changes in air quality during the lockdown in Barcelona (Spain) one month into the SARS-CoV-2 epidemic. Sci. Tot. Environ. 726:138540. doi: 10.1016/j.scitotenv.2020.138540
Twomey, S. (1977). The influence of pollution on the shortwave albedo of clouds. J. Atmospher. Sci. 34, 1149–1152. doi: 10.1175/1520-0469(1977)034<1149:TIOPOT>2.0.CO;2
Voiland, A. (2010). Aerosols: Tiny Particles, Big Impact. NASA Earth Observatory. Available online at: https://earthobservatory.nasa.gov/features/aerosols (accessed October 21, 2021).
Wang, Q., and Su, M. (2020). A preliminary assessment of the impact of COVID-19 on environment – a case study of China. Sci. Tot. Environ. 728:138915. doi: 10.1016/j.scitotenv.2020.138915
Wang, R., and Li, C. (2016). Spatiotemporal analysis of precipitation trends during 1961–2010 in Hubei Province, Central China. Theoret. Appl. Climatol. 124, 385–399. doi: 10.1007/s00704-015-1426-x
Wang, S., Yu, S., Yan, R., Zhang, Q., Li, P., Wang, L., et al. (2017). Characteristics and origins of air pollutants in Wuhan, China, based on observations and hybrid receptor models. J. Air Waste Manag. Assoc. 67, 739–753. doi: 10.1080/10962247.2016.1240724
Wang, Y., Le, T., Chen, G., Yung, Y. L., Su, H., Seinfeld, J. H., et al. (2020a). Reduced European aerosol emissions suppress winter extremes over Northern Eurasia. Nat. Climate Change 10, 225–230. doi: 10.1038/s41558-020-0693-4
Wang, Y., Wen, Y., Wang, Y., Zhang, S., Zhang, K. M., Zheng, H., et al. (2020b). Four-month changes in air quality during and after the COVID-19 lockdown in six megacities in China. Environ. Sci. Technol. Lett. 7, 802–808. doi: 10.1021/acs.estlett.0c00605
Wehbe, Y., Tessendorf, S. A., Weeks, C., Bruintjes, R., Xue, L., Rasmussen, R., et al. (2021). Analysis of aerosol – cloud interactions and their implications for precipitation formation using aircraft observations over the United Arab Emirates. Atmos. Chem. Phys. 21, 12543–12560. doi: 10.5194/acp-21-12543-2021
Wilder-Smith, A., and Freedman, D. O. (2020). Isolation, quarantine, social distancing and community containment: pivotal role for old-style public health measures in the novel coronavirus (2019-NCoV) outbreak. J. Travel Med. 27, 1–4. doi: 10.1093/jtm/taaa020
Wu, R., Kirtman, B. P., and Pegion, K. (2008). Local rainfall-SST relationship on subseasonal time scales in satellite observations and CFS. Geophys. Res. Lett. 35, 26–31. doi: 10.1029/2008GL035883
Yuan, T., Remer, L. A., and Yu, H. (2011). Microphysical, macrophysical and radiative signatures of volcanic aerosols in trade wind cumulus observed by the A-train. Atmospher. Chem. Phys. 11, 7119–7132. doi: 10.5194/acp-11-7119-2011
Zamora, L. M., Kahn, R. A., Cubison, M. J., Diskin, G. S., Jimenez, J. L., Kondo, Y., et al. (2016). Aircraft-measured indirect cloud effects from biomass burning smoke in the arctic and subarctic. Atmospher. Chem. Phys. 16, 715–738. doi: 10.5194/acp-16-715-2016
Keywords: COVID-19, precipitation, patterns, lockdown, IMERG
Citation: Sharif RB, Houser P, Aquila V and Maggioni V (2022) Investigating Rainfall Patterns in the Hubei Province, China and Northern Italy During the Covid-19 Lockdowns. Front. Clim. 3:799054. doi: 10.3389/fclim.2021.799054
Received: 21 October 2021; Accepted: 15 December 2021;
Published: 21 January 2022.
Edited by:
Victor Ongoma, Mohammed VI Polytechnic University, MoroccoReviewed by:
S. Sanap, India Meteorological Department, IndiaTomás Bolaño-Ortiz, National Technological University, Argentina
Copyright © 2022 Sharif, Houser, Aquila and Maggioni. This is an open-access article distributed under the terms of the Creative Commons Attribution License (CC BY). The use, distribution or reproduction in other forums is permitted, provided the original author(s) and the copyright owner(s) are credited and that the original publication in this journal is cited, in accordance with accepted academic practice. No use, distribution or reproduction is permitted which does not comply with these terms.
*Correspondence: Ridwana Binte Sharif, rsharif@gmu.edu