Introducing uncertainties in composite indicators. The case of the Impact Chain risk assessment framework
 Camilo Melo-Aguilar
 Miguel Agulles
 Gabriel Jordà2
- 1Universidad Complutense de Madrid, Madrid, Spain
- 2Universitat de les Illes Balears, Palma, Spain
- 3Centre Oceanográfic de Balears, Instituto Español de Oceanografía (CSIC-IEO), Palma, Spain
The use of composite indices is widespread in many fields of knowledge but a common problem associated to those type of indices is how to introduce uncertain knowledge on them. One example would be the Impact Chain framework for risk assessment. This methodology has proven to be a robust and effective approach to set up the conceptual framework associated to a given risk allowing to naturally consider the different components that shape that risk. However, the operationalization of the impact chain may not be straightforward, in particular due to the inherent uncertainties associated to the selected indicators and the assigned weights. In this paper, we propose to use a probabilistic framework that would allow to consider uncertain knowledge in the composite indicator computation. Moreover, in the framework of the UNCHAIN project, a web-based tool has been developed to ease the task of implementing that methodology. This web-based application is designed as a multidimensional tool to consider uncertainties in any type of composite indicator, thus, its scope goes beyond the Impact Chain and risk analysis framework. For illustrative purposes, the tool has been applied to a case study on the risk of loss tourist attractiveness due to heat stress conditions on the Balearic island, Spain. This case study is used to show how uncertainties in different components of the impact chain can affect the robustness of the final risk assessment. Also, the tool provides an estimate of the sensitivity of the final risk to each component, which can be used to guide risk mitigation strategies. Finally, a proposal for the validation of the risk assessment is presented.
1. Introduction
Natural disasters related to extreme climate conditions are one of the main threats that human society faces nowadays and are expected to become more frequent in the coming decades due to global warming (Seneviratne et al., 2022). In fact, the effects of a changing climate are currently emerging in different parts of the world. One example is the devastating early heat wave that hit Northwestern India and Southern parts of Pakistan during March and April 2022, which was the hottest in India since records began 122 years ago (Zachariah et al., 2022). In addition, extremely dry conditions in both India and Pakistan favored local heating of the land surface. This situation reduced India's wheat production, limiting global wheat stocks. In the future, climate-related impacts may become more severe, as they are shaped not only by changes in the climate state, but also by many societal factors, like a growing population, socioeconomic development, or a rising demand for food, water, and energy, which underlie physical and social vulnerability, and the social responses themselves (Ara Begum et al., 2022).
Accordingly, climate risk assessment at local to national and regional levels has become an important tool for the development and implementation of adaptation strategies to support decision-making that limit the consequences of climate-related impacts on the natural and socioeconomic dimensions. Climate risk assessment includes identifying the frequency and intensity of climate hazards (droughts, floods, heat waves, etc.), but also evaluating the level of impact on the socioeconomic system and the natural ecosystems (Reisinger et al., 2020; Ara Begum et al., 2022). This, in turn, depends on the exposed elements and how vulnerable they are (Mastrandrea et al., 2010; Toimil et al., 2017; Leis and Kienberger, 2020). In this regard, the concept of impact chains (IC; Fritzsche et al., 2014) has emerged as an important analytical tool that helps to understand, systemize, and prioritize the drivers of climate risk. Impact chains are conceptual models that describe climate impacts as cause–effect relationships within a socio-ecological system (Aall and Korsbrekke, 2020), focusing on identifying and describing important linkages between the different components of climate related risks.
To quantify the level of risk imposed by a certain physical disturbance on a natural or socioeconomic system, the three components of risk defined in the ICs framework (i.e., hazard, exposure, and vulnerability; Reisinger et al., 2020), are combined in climate risk models (Kropf et al., 2022). In these types of models, indicators are defined for the hazard (i.e., climate stressor), the exposed elements (e.g., population, infrastructure, buildings, ecosystems etc.), and the vulnerability components. These indicators are then aggregated using different approaches, from simple weighted arithmetic/geometric methods (Fritzsche et al., 2014) to more complex impact functions that estimate the level of damage (Aznar-Siguan and Bresch, 2019) and the potential risk. An important feature of climate risk models is that they may enable quantitative data (e.g., evidence of observed and modeled evolution of the climate system) to be combined with qualitative information (e.g., expert judgment), thus, providing an integrated climate-risk assessment across multiple lines of evidence (2O'Neill et al., 017). However, the different nature of the input data complicates the quantification of the final risk. Particularly, obtaining robust verification data for the exposure and vulnerability components can be quite challenging (Kropf et al., 2022), since these elements are sometimes identified from subjective methods (Zommers et al., 2020).
Moreover, dealing with uncertainties in the selection, quantification, and weighting (i.e., the relative importance among the three components of risk) of the input indicators remains central in the debate on climate change risk due to the inherently complex nature of climate-related phenomena. Particularly, assessing the risk under future climate change conditions involves dealing with different sources of uncertainties, including those from climate model projections, in addition to future changes in demographics, human development, economy, lifestyle, and policies (O'Neill et al., 2017). The way uncertainties related to climate-risk analysis are traditionally handled in the climate science field is too strongly associated with statistical measures of the magnitude and frequency of the hazard (Aven, 2020), while the concept of uncertainty should be also applied to the exposure and vulnerability to any given hazards (Reisinger et al., 2020).
Incorporating a systematic treatment of uncertainty into the framework of climate risk analysis has become an important task to improve the quality of such analyses and provide useful results for risk management. This will assist policymakers to develop more informed adaptation measures taking into account the full range of uncertain aspects inherent to climate risk analysis. However, the implementation in practice of the uncertain aspects of climate risk assessments still faces some limitations. For instance, translating qualitative sources of information to a quantitative measure of uncertainty, and integrating them with hazard model-based output that can be incorporated into risk analysis is challenging (Adler and Hirsch Hadorn, 2014). Some attempts have been done in this direction, like the probabilistic impact risk model softwares packages CLIMADA (Aznar-Siguan and Bresch, 2019) or CAPRA (Cardona et al., 2012). However, although they are valuable tools that provide a way to consider a measure of uncertainty in the different components of risk, they tend to be designed to address a limited range of climate and other natural events (e.g., tropical cyclones, river flood, or earthquakes). Therefore, their use is restricted to those specific cases, limiting its application to a wider range of potential climate-related events. Furthermore, using these types of software may require some level of expertise, thus, limiting its implementation by some users.
One of the goals of the UNCHAIN project (“Unpacking climate impact chains”) funded by the AXIS-JPI EU funding mechanism (http://www.unchain.no/) is to develop and test a standardized analytical framework for addressing uncertainties involved in local decision-making on climate change adaptation. In this work, we contribute to this goal by proposing an extension to the Impact Chain framework that allows to consider uncertainties in the different components of the risk assessment. The basic idea is to consider that any component of the IC (indicators and weights) is defined not as a single value, but as a probability density function (PDF) that describes the uncertainty associated to that component. As a result, a PDF for the final risk is obtained. The methodology can also be used to assess the sensitivity of the risk to different factors, thus helping the policymakers in the development of adaptation strategies.
In order to simplify the application of the method, a very simple, user-friendly interactive web application has been developed, the UNTIC (Unchain Tool for Impact Chain uncertainties) tool, which can be easily adapted to any climate-related risk evaluation or even extended to other fields. The reason is that climate risk assessment can be though of as a composite index (CI), as it reflects a complex relationship between multiple dimensions and indicators (e.g., natural phenomena and socioeconomic components). Essentially, a CI combines multiple indicators using various normalization and weighting schemes (Wu and Wu, 2012) to allow better interpretation of the connections between its different dimensions rather than reducing it to its “isolated parts” (Rosen, 1991). In fact, CIs are widely developed in several fields, such as, economy, in which they are very popular tools to assess and rank countries and institutions (e.g., Human Developing Index; UNDP, 2022), sustainability (e.g., Ecological Footprint; Huang et al., 2015), environment (Wiréhn et al., 2015), and others. However, despite the widespread and interdisciplinary nature of CIs, there remain criticisms surrounding their development. In particular, the lack of uncertainty and sensitivity analyses in the development of many CIs is a shortcoming that may limit the delivery of a more robust message on the CI conclusions (Greco et al., 2019). Considering the broad scope of CIs, the UNTIC tool is designed as a multidimensional application to introduce uncertainties in any type of CI. That is, it is not limited to the aggregation of the three components (i.e., hazard, exposure, and vulnerability) considered in the Impact Chain and risk analysis framework. Instead, users can include as many components and indicators as necessary, and the application automatically expand uncertainties to each component and to the aggregated CI.
Herein, we describe the methodology and the practical application of the UNTIC tool to a case study on the risk of loss of tourist attractiveness due to heat stress increase on the Balearic Island, Spain. We encourage researchers in the field of climate risk assessments and other disciplines to incorporate the quantification of uncertainties when computing CI (e.g., using the UNTIC tool or other similar software).
2. Materials and methods
2.1. The Impact Chain formalism
The probabilistic approach for composite indices was originally developed for the risk assessment in the Impact Chain framework. Therefore, for clarity, the methodology is presented in that framework. However, the same background applies to the estimation of any type of CI. i.e., in practice, any type of CI can be described as a combination of different dimensions and indicators, and the aggregation scheme described here could be extended to CIs of any complexity.
Following the IPCC AR5 (Burkett et al., 2014), in the context of climate-related impacts, risk is defined as a combination of three interacting components: (1) climate-related hazards (including hazardous events and trends), (2) exposure in places and settings that could be adversely affected, and (3) vulnerability of human and natural and socio-economical systems. Then, it is not enough to identify climate hazards (i.e., floods, heat waves, water scarcity, etc.) but also the grade of affection to the socioeconomic system of the region under evaluation. That is, to quantify the possible consequences depending on the exposure and vulnerability components (Mastrandrea et al., 2010; Toimil et al., 2017; Leis and Kienberger, 2020). This can be done following the approach proposed in the Vulnerability Sourcebook (Fritzsche et al., 2014) which is based on the concept of impact chain. The development of a climate-risk assessment under the IC approach involves the combination of the hazard, exposure, and vulnerability components via identifying and describing connections between them. The interactions between these factors, are controlled by the different indicators that make up each of the IC components, which ultimately shape the final risk magnitude. Accordingly, in the IC approach, the risk is defined as:
where H, E, and V, are the components that describe the Hazard, Exposure, and Vulnerability, respectively. The Ws refer to relative Weight/Normalization factor applied to transfer these three components to risk value, and w represents the weight of the indicators for each risk component. It must be noted that here we have assumed the typical choice where the three components are arithmetically combined, but the whole formalism presented below can easily be translated to any type of combination. For instance, the risk components could be aggregated geometrically (multiplicative aggregation), where Equation (1) takes the form:
The selection of the aggregation method depends on a “compensability” effect among the different indicators. That is, the existence of trade-offs between high- and low-score indicators. While a weighted arithmetic aggregation allow for “full compensability,” meaning that a high score for one indicator can offset a low score of another indicator, the weighted geometric aggregation, only allows partial compensability (Nardo et al., 2008). The latter means that a very low score for one indicator can only partly offset a very high score of another indicator. It is important to recall that by definition all weights must add up to 1 (e.g., WH + WE + WV = 1, or ∑wk = ∑wi = ∑wj = 1).
The identification of the indicators for each of the risk components (either quantitative or qualitative), the normalization and the determination of the weights is not straightforward. It requires literature review, brainstorming process, compilation of historical data regarding past events of the analyzed phenomenon, expert judgement, and the interaction with the different stakeholders involved in the field (Fritzsche et al., 2014). The latter is one of the most important tasks in linking academia with practitioners and to promote the adoption of the results by the final users and policymakers as they actively participate in the co-generation of knowledge. However, participatory approaches such as workshops and other, add uncertainties to the climate-risk assessment as they tend to be subjective methods.
2.2. Addressing uncertainties in the impact chain framework
Three main types of uncertainties of different nature that influence the results of the risk assessment can be considered. First, existing datasets are uncertain, leading to uncertain indicators. Second, the relative importance of each element of the IC (the weight) has a profound impact on the final risk. However, that is usually defined based on subjective expert knowledge, which is inherently subject to uncertainties. Finally, a third level of uncertainty exists when some key elements of the actual chain of impacts may not be included in the theoretical IC. This would lead to a biased estimate of the final risk, so the problem must be bounded in some way. All these types of uncertainties should be quantified and propagated to the final risk, so the risk is provided along with a level of confidence. Here, we propose a standardized probabilistic framework in which the basic idea is to consider that any component of the IC (indicators and weights) is defined not as a single value, but as a PDF. The PDF provides a full representation of all the possible values that a quantity can have with its probability of occurrence. A sketch of the approach is presented in Figure 1.
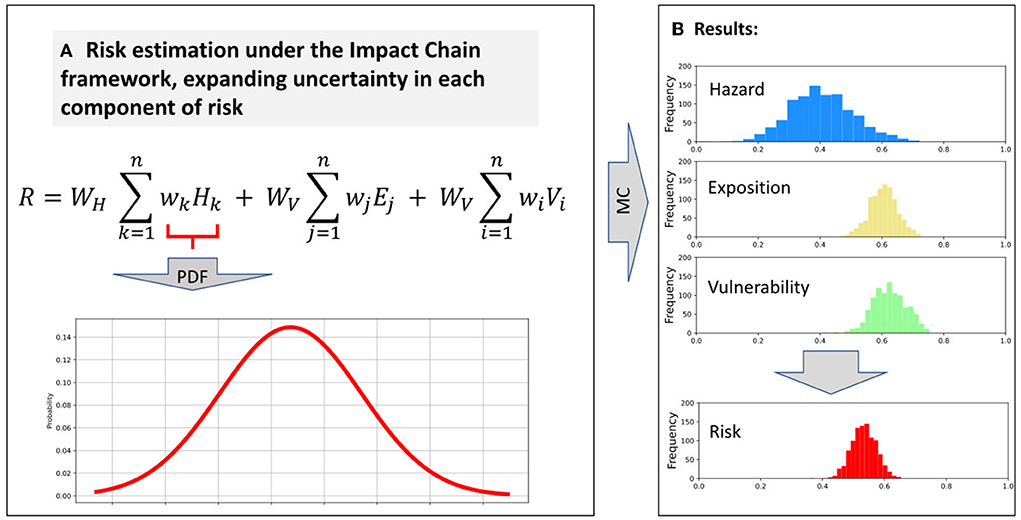
Figure 1. Sketch of the methodology proposed to accommodate uncertainties in the impact chain framework. (A) Risk estimation under the Impact Chain framework, expanding uncertainty in each component of risk. (B) Results.
In practice, to implement this approach, some choices have to be made to define the PDFs. For all those indicators for which enough information on the uncertainty could be obtained, a frequent choice is to use a Gaussian function with an amplitude defined by the estimated uncertainties:
where p represents the probability of having an indicator or weight value, x0 is the central most likely value as provided by the databases or the experts opinions, and σ is the the standard deviation of the distribution, which is often used as a measure of the level of uncertainty. The uncertainty associated to the indicators will be inferred from the characteristics of the databases (e.g., spread of climate model results).
For those indicators for which a central value could not be identified or even for which there is no information, an homogeneous PDF can be used:
where xmax and xmin determine the maximum and minimum possible values.
For instance, in the case of the hazard, the type-1 source of uncertainty (i.e., those related to the datasets used to define the different indicators) is typically determined by the probability of occurrence of a climatic driver. This can be measured from sample observations of the climate state or from physical model outputs. An example is the case of climate change projections, which are based on climate model simulations. Model outputs are inherently uncertain due to our incomplete knowledge about the climate system (Maher et al., 2019), including the internal variability (e.g., El Niño) and external variations in the forcing factors outside the climate system (e.g., solar activity or volcanoes). In addition, scenarios of global development describing societal futures and greenhouse gases emission are developed from assumptions of different socioeconomic developments and future societal conditions, which are made to span a range of possible futures of warming (O'Neill et al., 2017). The assessment of these types of uncertainties is usually done with the use of ensembles of simulations that provide a range of possible future scenarios of the climate state in a probabilistic framework (Taylor et al., 2012). In this case, the hazard indicator would be computed as the ensemble average while the uncertainty would be computed from the ensemble spread (see Figure 2A). In other cases, the number of inputs is not large enough to fit an analytical function (e.g., the results of a poll to a limited number of experts). In this case, we propose to keep all the expert opinions using a homogeneous PDF with the limits defined by the range of values obtained in the poll (see Figure 2B).
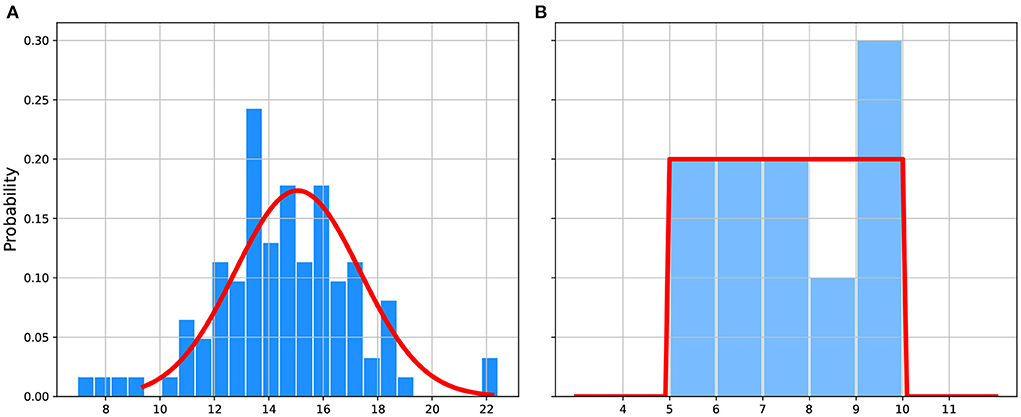
Figure 2. (A) Example of the fitting of a Gaussian function to the outputs of an ensemble of climate models providing the heat index in the Balearic Islands. (B) Example of the fitting of a homogeneous pdf to the outputs of a poll to experts about the quality of information for tourists.
Furthermore, it is possible that for some indicators there is no clear information about the associated uncertainty. An example could be when the information is retrieved from databases that do not specify the methodology followed or a measure for the reliability of the data. A possible alternative would be to use the temporal variability of the indicator as a measure of the uncertainty associated to the mean value provided.
It is important to remark that this formalism naturally accommodates the gaps of knowledge. It should be kept in mind that the IC is a conceptual framework that does not require all all information to be available. Thus, if no information is found for any of the indicators defined in the IC, they can simply be set to a value of 0.5 with a range of uncertainty of ± 0.5 following a homogeneous PDF. This would be equivalent to assume that the indicator may have any value between 0 and 1. This will propagate through the risk computation and enlarge the final uncertainty. If that missing information was from an indicator with little weight, the consequences will be negligible. Conversely, if that piece of information corresponded to something that experts considered was important, and thus had a strong weight, will result in a large uncertainty in the final risk.
Finally, it is also worth mentioning that qualitative information can also be naturally included in this approach. It would be enough to discretize the expert's judgement to a limited number of classes and to assign a numerical value to each class with a corresponding uncertainty. For instance, if the experts have to assign a low, mid or high value to a certain indicator, this can be transformed to 0.16, 0.5, and 0.84 with a homogeneous uncertainty of ± 0.16.
Regarding the level-2 uncertainties, those associated to the weights, the same approach can be followed if they are based on expert judgement. In our case we propose to use the Analytical Hierarchal Protocol (AHP; Saaty, 1990) although other approaches are also valid as long as a range of uncertainty is provided for all the weights used in the IC. Analytical Hierarchal Protocol is widely used in the risk assessment (e.g., Hsu et al., 2017; Tascón-González et al., 2020) and aims at deriving ratio scales from paired comparisons. It allows converting subjective opinions to a numeric scale that can be used in the risk assessment process. To do so, a pairwise comparison of either the risk components or between indicators in each group is presented to the expert. The former provides an estimate of the overall weight, while the latter indicates the weights among indicators of each type. For each pairwise comparison, the expert selects the option he/she considers to be more important, using a numeric scale. Then, the results are organized in a matrix and the weights are obtained by computing the normalized principal eigenvector (Saaty, 1990). As this is repeated for several experts, an ensemble of values is obtained for each weight. Thus, the average is used as the final weight and the spread of the values as the uncertainty (e.g., the standard deviation of the values can be used as a measure of the uncertainty). If the number of experts is large, an analytical function (e.g., a Gaussian function) can be fitted. If not, an homogeneous PDF should be preferred, as mentioned above.
Once all the indicators and weights are defined, they are combined using Equation (1)/(2) with the functional form chosen for the IC (weighted arithmetic aggregation, geometric aggregation, conditional combinations, etc...). To propagate the uncertainties to the final risk, we use a classical Monte-Carlo technique. Namely, each indicator and weight is transformed from a single value to a range of values randomly sampled from a distribution described by the chosen PDF. All these values are used to compute a large number of risk estimates. As a result, a PDF for the final risk estimate is obtained (see Figure 1B).
Another important aspect of the risk assessments is to evaluate the sensitivity of the final risk to the single indicators. This can help to guide the adaptation strategies by focusing on those indicators that have the largest impact on the final risk, so a reduction of them would lead to a meaningful reduction of the final risk. To illustrate this, we can assume a linear form for the IC and neglect by the moment the uncertainties in the weights or the indicators, as in Equation (1). The sensitivity to the indicator I(S(I)) can be formulated as:
In other words, the relative change of the final risk with respect to a change in the indicator I can be estimated as the product between the weight of the indicator w and the weight of the aggregated component W. By multiplying S(I) by the expected change in a given indicator ΔI one can obtain what would be the change in the final risk:
This has been shown for a relatively simple linear case without uncertainties. In our case, the sensitivity is numerically computed using the Monte Carlo approach and thus the associated uncertainty is also provided. Moreover, more complex functional forms for the risk can be easily considered when computing the sensitivity.
2.3. A web-based tool
In the framework of the UNCHAIN project, a web application has been developed to simplify the application of the described methodology, the UNTIC tool, hosted in: untic.pythonanywhere.com. The UNTIC tool has been designed as a very simple and user-friendly interface, in which the final user is only required to fill in an Excel spreadsheet with the information of Equation (1)/(2) (i.e., the overall weights, the aggregation formula, the weights for the indicators within any risk component, and the value of the indicators with their associated uncertainty). The web tool also helps in the generation of a template for the Excel file once the number of components and indicators are defined by the user. Once the file is uploaded to the web, the Python code generates the PDF for each element in the composite index based on a Monte Carlo approach and provides numerical and graphical outputs. Figure 3 shows a schematic representation of the UNTIC structure for the case of a Risk assessment. The box on the left-hand side (Figure 3A) represents the input spreadsheet, in which the user is asked to provide the value (V), the uncertainty measure (U), and the shape of the probability distribution (S) for each element of Equation (1)/(2), and for each location or timeframe in which the assessment is conducted. The UNTIC tool reads in this information and randomly generates the samples based on the user-defined S to be used in the MonteCarlo simulation. Then, the final composite index is estimated using the functional form chosen for the risk [i.e., arithmetic/geometric aggregation; Equation (1)/(2), respectively] while uncertainties are propagated to provide the risk in a probabilistic framework. The UNTIC tool will automatically generate some outputs (Bottom box; Figure 3C) including a report in Excel format and a set of plots illustrating the main results. The former includes the results of the composite index (i.e., mean and standard deviation values of the composite index and each component) and those of a sensibility test in the final risk estimate to variations in the values of individual indicators (i.e., the minimum and maximum risk values that would be obtained if the indicator ranged from 0 to 1).

Figure 3. Schematic representation of the UNTIC tool. (A) Panel illustrates the required input fields that are provided in the Excel spreadsheet. (B) Web interface. (C) Outputs: the UNTIC tool provides numerical and graphical outputs for the index composite and each of its components.
In the following, we describe the practical implementation of the formalism for the specific case of the risk of loss of attractiveness by heat stress in the Balearic Island, Spain. This implies the aggregation of three components (i.e., Hazard, Exposure, and Vulnerability), but, as mentioned before, the UNTIC tool has been designed for any type of composite index, regardless of the numbers of components and indicators.
3. Example of application
In this section, we illustrate the application of the above-mentioned concepts using a case study for the risk of loss of attractiveness by heat stress on the Balearic Island, Spain. The full description of the development of the IC is included in a companion paper (“Risk of loss of tourism attractiveness in the Western Mediterranean under climate change.” Agulles et al., this issue), thus, here we focus on detailing the process of dealing with uncertainties in the final risk assessment and only a brief overview of the case study is presented. The results presented herein have been generated with the UNTIC tool; the input Excel spreadsheet can be accessed from untic.pythonanywhere.com.
The IC has been defined from expert knowledge through participatory activities with relevant stakeholders in the tourism sector in the Balearic Islands, involving people from academia, government, and industry. This was a user and stakeholder-centric, process-oriented, and demand-driven approach, commonly referred to as “co-production of knowledge,” which has been recognized as a key factor to promote sustainable development outcomes (Norström et al., 2020).
The resulting IC contains indicators for each of the three risk components that were identified by working interactively with the stakeholders, mainly through online meetings due to the restrictions associated to the COVID pandemics. Once the IC was defined, the indicators were selected. Regarding the hazard, it is represented by the National Oceanic and Atmospheric Administration (NOAA) heat index (HI), which is a heat stress indicator used for issuing heat warnings. For the Exposure and Vulnerability components, a total of five and nine indicators are included in the IC, respectively (see Table 1).
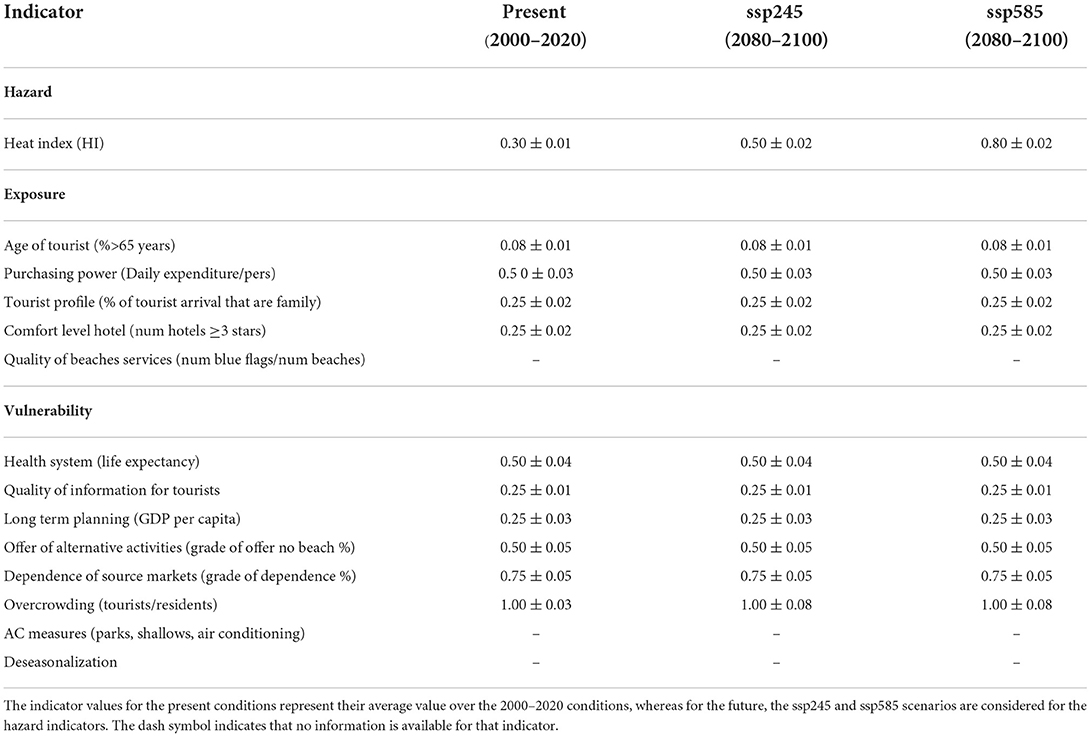
Table 1. List of indicators for the hazard, exposure, and vulnerability components and their respective normalized values and corresponding uncertainty.
Data to quantify the HI under present and future conditions have been obtained from global climate model runs in the framework of the sixth phased of the Coupled Model Intercomparison Project (CMIP6; Eyring et al., 2016). The data have been retrieved from Schwingshackl et al. (2021) for the present climate and projections for the end of the century under two Shared Socioeconomic Pathways (SSP245 and SSP585; Riahi et al., 2017). The hazard indicator for present and future has been obtained as the model ensemble average and the uncertainty as the ensemble spread (Figure 4).
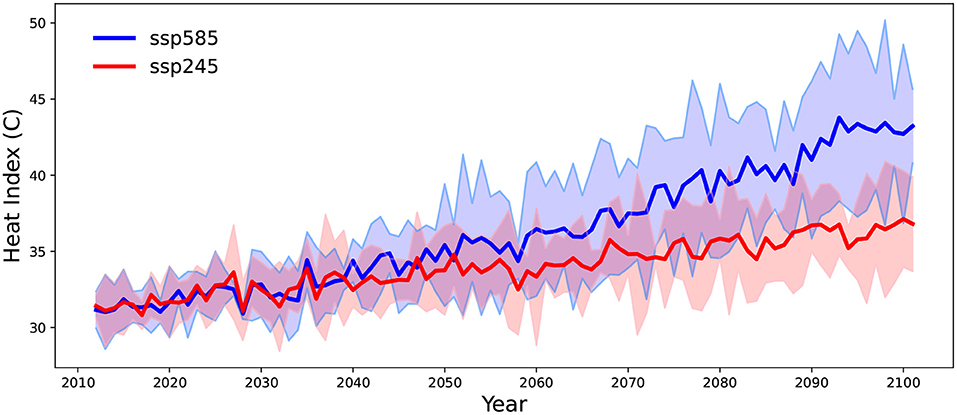
Figure 4. Evolution of heat index over the 2015–2100 period for the ssp585 and ssp245 scenarios. The thick line shows the ensemble mean, whereas the shaded area illustrates the uncertainty estimate (± std).
For the exposure and vulnerability, the information to quantify the indicators is obtained from official statistics services at regional and national levels. These data are usually provided as yearly values, but we were unable to find details on the associated uncertainty. Therefore, the indicators were computed as the average for the period 2000–2020 and the temporal standard deviation is considered as a measure of the uncertainty associated to these values. It has to be noted that no future projections have been done for the exposure and vulnerability indicators (i.e., they are set constant in time), as the goal was to assess how changes in the hazards may impact the risk. This represents the risk if adaptation measures were not considered. Although this is an unrealistic case, it will provide a first-order view of the risk for the tourism sector if no actions are considered to deal with the projected climate change hazards.
The following step has been to normalize the indicators in order to make them comparable. In our case, we have chosen a linear transformation where data below a predefined minimum threshold correspond to a value of 0 and data above a pre-defined maximum threshold correspond to a maximum value of 1. For the values in the middle, the following formula has been applied:
where I is the original value of the indicator and Imin and Imax are the minimum and maximum thresholds, which have been subjectively set by the experts. It must be noted that all indicators have been defined in a way that higher values imply higher risk. The values for the indicators along with their associated uncertainties are presented in Table 1.
The computation of the weights has been done using the AHP. Table 2 contains the results of the AHP evaluated by one stakeholder involved in the process for the weighting of the exposure indicators as an example. The same procedure was applied to the vulnerability components, as well as to obtain the overall weight between risk components. In this example, the tourist age emerges as the most important indicator of exposure (45%) followed by the origin of the tourists (17%). The same procedure was applied to all the participating stakeholders. The final weight was obtained as the mean value of those results, while the spread in the values of the weights (i.e., the standard deviation) was used as a measure of the uncertainty (see Tables 3, 4 for the resulting weights).
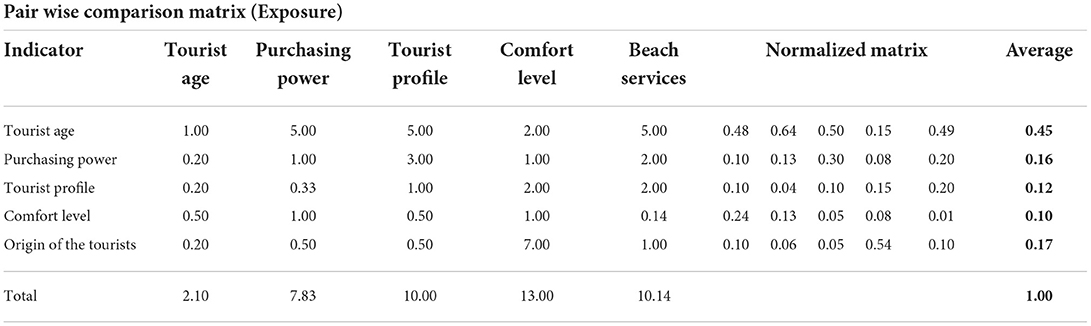
Table 2. Matrix containing the AHP evaluation process to obtain the weights associated to the exposure components from the survey with a single stakeholder as an example.
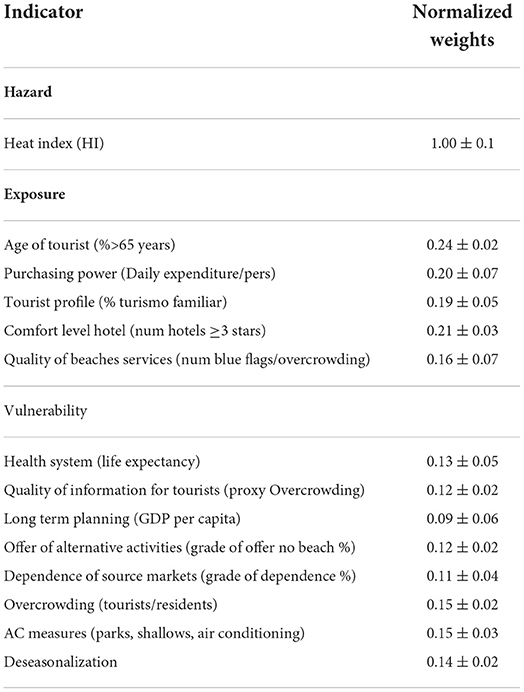
Table 3. Normalized weight of indicators for the hazard, exposure, and vulnerability components obtained from the AHP procedure and their corresponding uncertainty.
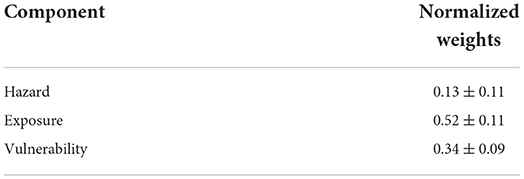
Table 4. Normalized values of the relative weights among the three risk components (i.e., hazard, exposure, and vulnerability) and their corresponding uncertainty, obtained from the AHP procedure.
The estimation of the final risk is done by combining the normalized indicator values with the weights of each of the risk components, following Equation (1). The uncertainty in the final risk estimation is analyzed by performing a Monte Carlo-based simulation with 1,000 samples. Figure 5 illustrates the resulting histograms for the risk estimation distribution, as well as for each component for present conditions and two future scenarios. As expected, the hazard increases in the future, specially under scenario SPS585. The exposure has a mean value of 0.3 and vulnerability of 0.55. Note that the largest source of uncertainty is represented by the vulnerability component (last column in Figure 5). The final risk ranges from 0.38 under present conditions to 0.41 and 0.45 in the future under scenarios SPS245 and SPS585, respectively. Despite the large increase in the hazard, the final risk estimate is not affected as the hazard weight is relatively small (see Table 4).
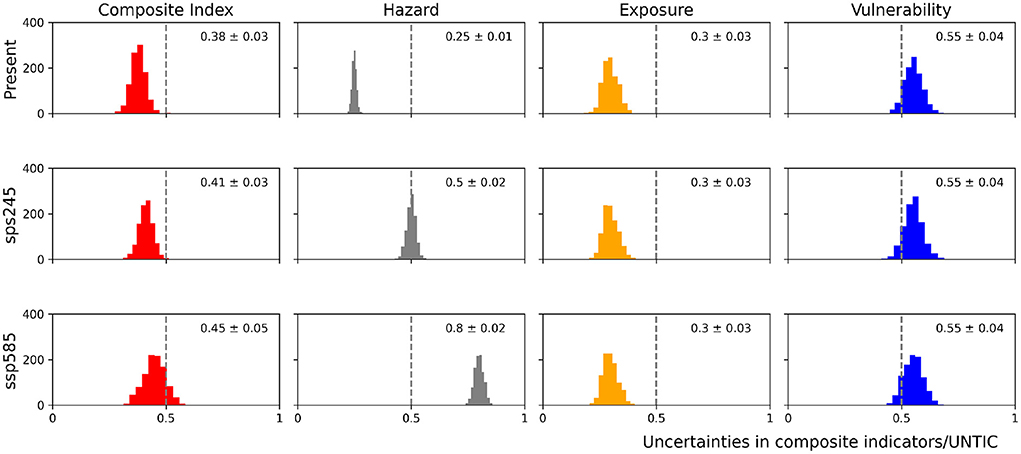
Figure 5. Probability distribution function for the risk estimate, the hazard, exposure, and vulnerability components under present conditions (top), SSP245 scenario (middle), and SSP585 scenario (bottom). The mean and the standard deviation are indicated in the inset.
The sensitivity of the final risk to each individual indicator as well as for the aggregated hazard, exposure, and vulnerability has also been assessed (Figure 6). It can be seen that variations in the aggregated exposure would translate into large variations of the final risk, while variations in the hazard produce the smallest contribution to the risk. This is an expected result as it reflects the weight of each component (Table 4). The sensitivity analysis also highlights that some indicators could not be used to reduce the risk, as they are already contributing little to it (e.g., Indicator “age,” whose lower end is close to the red line in Figure 6). Conversely, the same indicators could significantly increase the final risk if they were increased. Also, it is interesting to notice that if a risk reduction is aimed at through a reduction of the exposure, for instance, that would require a reduction in several indicators. In other words, acting on a single aspect of tourist typology would not be enough to reduce the final risk.
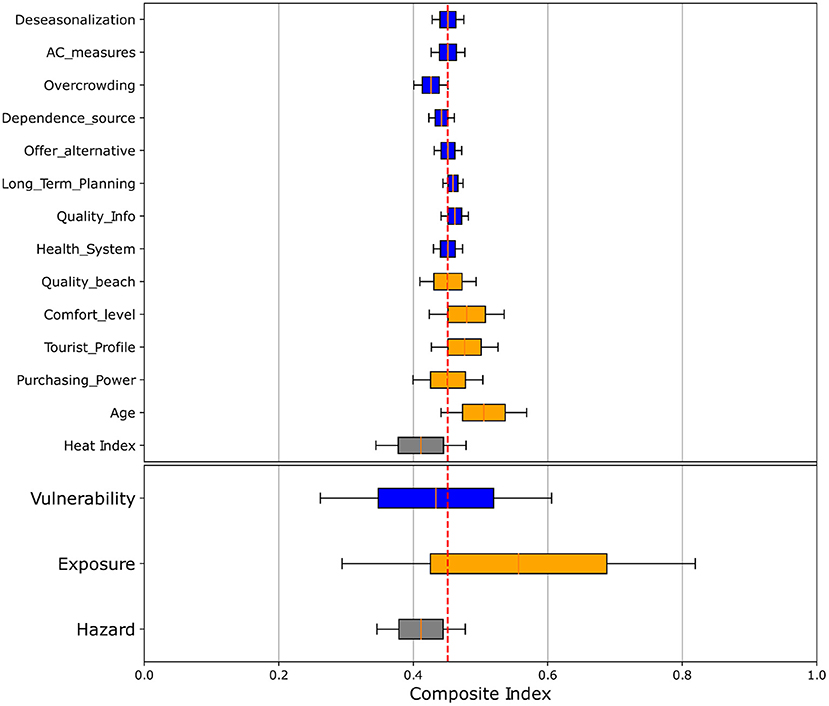
Figure 6. Sensitivity of the final risk under future scenario SSP585 to different values of each indicator and the aggregated indicators. The vertical red line indicates the computed risk while the bars denote the range of risk values that could be obtained for the whole range of values of a given indicator.
Discussion
In this study, we propose a flexible framework for incorporating uncertainties into the computation of composite indices under a probabilistic approach. By considering that any component of the CI (indicators and weights) can be described through a PDF, uncertainties are easily propagated through the CI computation. Our approach to perform this propagation is to use a Monte Carlo method to randomly simulate N number of samples based on the prescribed probability distribution function. This has been shown to be a good approximation of the true distribution (Johansen, 2010) and provides a PDF for the final index. In the test case used to illustrate how the method works, we use a relatively simple function to combine the weights and the indicators and two types of PDF (e.g., Gaussian and homogeneous). However, any functional form for the combination of indicators or any definition of the PDFs could be easily implemented. Moreover, the inclusion of qualitative indicators can also be done by simply assigning a numerical value to each qualitative value (e.g., low, mid, or high) along with a range of homogeneous uncertainties.
The UNTIC tool can be used to evaluate uncertainties in any type of composite index without any limitation in the number of components and indicators. To do so, the user is simply required to modify the default template file that can be downloaded from the web application, or create a custom template automatically from the web application. The tool has also been designed as a very simple web-based application written in Python, where users do not have to learn or master any specific software. Thus, the UNTIC tool can be implemented by a wide community of users. Among all the potential applications of UNTIC, it can be employed to assess any type of climate-related risk, from local to regional scales, or even be extended to other fields as long as the three components of risk (i.e., hazard, exposure, and vulnerability) can be characterized. Due to the inclusion of uncertainties, it would potentially contribute to improve the way climate risk is communicated to the general public and to policymakers, and, ultimately to contribute to the development of more informed adaptation strategies.
In addition to its flexibility and ease of use, one of the main strengths of our proposed approach is that gaps of knowledge in some of the aspects of the CI are also naturally incorporated in the assessment. For instance, the impact chain approach is often view as a conceptual description of a system and does not necessarily require that all the components can be quantified. For instance, experts may consider that hotel services may affect the tourist perception of attractiveness, but that is difficult to quantify. In previous assessments, those indicators that could not be quantified were discarded, so strongly jeopardizing the relevance of the assessment. Now, such unquantified indicators can be incorporated by simply assigning a very large uncertainty to it. This would propagate to the final risk, increasing its uncertainty. As an example, in Figure 7 we show the results of the IC under three cases. The first one is assigning values to all the components of the IC (reference); in the second one 4 out of 14 indicators have been considered as unknown (low uncertainty); and in the third one 8 out of 14 indicators have been considered as unknown (high uncertainty). It can be seen, that increasing the knowledge gaps makes the aggregated components to be more uncertain. The exposure uncertainty shifts from 0.03 in the reference case to 0.12 and 0.15 in the second and third case, respectively. The same happens with the vulnerability. Consequently, the final risk distribution becomes wider as more gaps of knowledge are included, going from a standard deviation of 0.04, to 0.07 and 0.09 in the second and third cases, respectively.
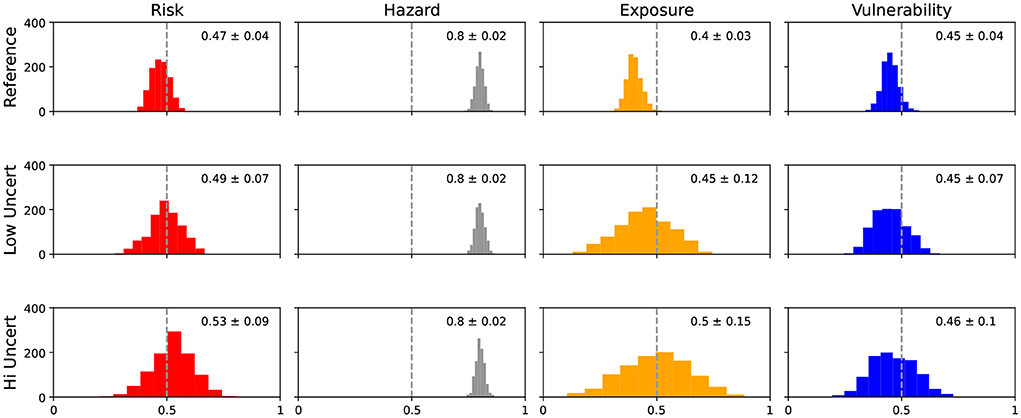
Figure 7. Sensitivity of the final risk under future scenario SSP585 to different level of incomplete knowledge of the indictors defined in the Impact Chain. The “reference” case (top) illustrates the case when values are assigned to all the indicators for the three components. In the “low uncertainty” case (middle) 4 out of 14 indicators have been considered as unknown, whereas the “high uncertainty” case (bottom) 8 out of 14 indicators have been considered as unknown.
The sensitivity analysis included in the UNTIC tool can help to design adaptation measures and to foster better-informed decision-making. Herein, we have evaluated the risk of losing tourist attractiveness due to global warming, setting the exposure, and vulnerability indicators constant. That is, no future change or investment in the touristic sector are considered to cope with climate change impacts. However, let us suppose that a high investment is projected to improve the air conditioning measures or to expand the offer of alternatives tourism activities focused on reducing the dependance on sun and beach tourism. These types of measures would reduce the value of some exposure and vulnerability indicators, which in turn, may reduce the estimate of the final risk. The opposite case in which no investments are planned, leading to worsen the conditions of some of the indicators, such as overcrowding or safety levels could be also evaluated. The sensitivity analysis provides a quantification of up to what extent those actions would affect the final risk. Some of the indicators may have little room for improvement (e.g., lower bound close to the red line in Figure 6) or have a little impact in the final risk. In those cases it would not be worth dedicating much efforts on reducing them.
A word of caution is also needed regarding a shortcoming of all composite index: the strong dependence of the final value on the definition of weights (i.e., the importance that is given to a certain indicator). We have proposed a way to reduce the subjectivity of the weight selection by applying the AHP. However, we recognize that this is not the final solution as it may be subject to biases. For instance, experts may underestimate the importance of a climate hazard (e.g., quasi-permanent heat waves) that are not that frequent in present climate.
Additionally, there is the third-level of uncertainty, mentioned in section 2.2, which is related to incomplete impact chains. That is, experts may have not identified some aspects that may play a role in the actual risk. Therefore, a calibration/validation process should be carried out to ensure the relevance of the assessment. Unfortunately, this is not easy at all. A possible option would be to analyze analog situations in time or space to infer a pseudo-risk that can be compared to the computed risk. To do that, a measure of a cost (C) should be defined. In our example this can be the degree of satisfaction the tourists have after their stay in a given location. Then, long time series of C can be analyzed comparing them with the hazard levels at that time (e.g., in our case the heat stress suffered by the tourists). After this, a measure of the probability of changes in C due to a certain hazard can be computed and compared to the estimated risk. The same could be done by comparing different locations where the corresponding IC is the same.
In our case study this calibration step was not possible since the historical record does not contain the required information or it is not homogenized. However, that is not the case for other climate-related risks, where historical data certainly contains information on this relationship. For instance, let us suppose one is analyzing the potential risk to agricultural production of droughts. Even if this type of climatic event is expected to be more frequent and intense in the future (Seneviratne et al., 2022), there is evidence of agricultural losses induced by extreme drought condition in different parts of the world. The historical data can be used to constrain the hazard–exposure–vulnerability relationships and to calibrate the final risk. Such “calibrated risk” can be used to communicate climate change knowledge to the final users, which is still one of the main limitations to effectively translate risk analysis into decision making (Vaughan and Dessai, 2014).
Conclusion
In this study, a probabilistic framework for the computation of composite indices is proposed. As an example, the framework has been applied to the risk assessment based on the impact chain approach (Fritzsche et al., 2014). The new framework allows to accommodate in a natural way the gaps of knowledge associated to the operationalization of composite indices. In particular, the different components of the index including the indicators and their corresponding weights are not described by scalar quantities but by PDFs. These PDFs can be defined as analytical functions (e.g., Gaussian or homogeneous) with parameters representing the uncertainties associated to a given quantity. These uncertainties can be quantified from the datasets used to retrieve the indicators (e.g., climate model ensemble spread) or from expert knowledge. Through this approach, gaps of knowledge in some aspects of the composite indicator (e.g., the impact chain definition) can be easily considered in the assessment. This allows to quantify how those gaps affect the reliability of the estimated index.
In the framework of the UNCHAIN project, UNTIC, a web-based tool has been developed to ease the task of implementing the proposed methodology. The tool has been applied to a study case to illustrate how the uncertainties in different components of the impact chain can affect the robustness of the final risk assessment. Also, the tool provides an estimate of the sensitivity of the final risk to each component, which can be used, for instance, to guide risk adaptation or mitigation strategies.
Data availability statement
The datasets presented in this study can be found in online repositories. The names of the repository/repositories and accession number(s) can be found below: https://untic.pythonanywhere.com/.
Author contributions
CM-A, MA, and GJ designed the study and the experiments, responsible for data processing and analysis, and reviewed the manuscript. GJ organized the structure of the manuscript. CM-A and GJ wrote the manuscript. All authors contributed to the article and approved the submitted version.
Funding
This work was supported by the Spanish Ministry of Science and Innovation through the grant PCI2019-103680 funded by MCIN/AEI/10.13039/501100011033 and by the European Union.
Acknowledgments
The authors would like to thank all the UNCHAIN partners for their support and constructive comments. The authors also appreciate the time and attention dedicated by the stakeholders for providing their expert opinions. Also, we thank to the INE for providing almost all the datasets used in this study and the CMIP project and the Copernicus Climate Data center for making available the CMIP6 simulations.
Conflict of interest
The authors declare that the research was conducted in the absence of any commercial or financial relationships that could be construed as a potential conflict of interest.
Publisher's note
All claims expressed in this article are solely those of the authors and do not necessarily represent those of their affiliated organizations, or those of the publisher, the editors and the reviewers. Any product that may be evaluated in this article, or claim that may be made by its manufacturer, is not guaranteed or endorsed by the publisher.
References
Aall, C., and Korsbrekke, M. (2020). Methods for Climate Change Risk Assessments: An International Knowledge Review. Technical Report. Available online at: https://www.vestforsk.no/en/publication/methods-climate-change-risk-assessments-international-knowledge-review (accessed August 13, 2022).
Adler, C. E., and Hirsch Hadorn, G. (2014). The IPCC and treatment of uncertainties: topics and sources of dissensus. WIREs Clim. Change 5, 663–676. doi: 10.1002/wcc.297
Ara Begum, R., Lempert, R., Ali, E., Benjaminsen, T., Bernauer, T., Cramer, W., et al. (2022). “chapter 1: Point of departure and key concepts,” in Climate Change 2022: Impacts, Adaptation, and Vulnerability. Contribution of Working Group II to the Sixth Assessment Report of the Intergovernmental Panel on Climate Change, eds R. Rodríguez and M. Sutherland (Cambridge, UK; New York, NY: Cambridge University Press), 3–77. doi: 10.1017/9781009325844.003
Aven, T. (2020). Climate change risk – what is it and how should it be expressed? J. Risk Res. 23, 1387–1404. doi: 10.1080/13669877.2019.1687578
Aznar-Siguan, G., and Bresch, D. N. (2019). Climada v1: a global weather and climate risk assessment platform. Geosci. Model Dev. 12, 3085–3097. doi: 10.5194/gmd-12-3085-2019
Burkett, V., Suarez, A., Bind, M., Conde, C., Mukerji, R., Prather, M., et al. (2014). “Point of departure,” in Climate Change 2014: Impacts, Adaptation, and Vulnerability. Part A: Global and Sectoral Aspects. Contribution of Working Group II to the Fifth Assessment Report of the Intergovernmental Panel on Climate Change, eds C. B. Field, V. R. Barros, D. J. Dokken, K. J. Mach, M. D. Mastrandrea, T. E. Bilir, M. Chatterjee, K. L. Ebi, Y. O. Estrada, R. C. Genova, B. Girma, E. S. Kissel, A. N. Levy, S. MacCracken, P. R. Mastrandrea, and L.L. White (Cambridge, UK; New York, NY: Cambridge University Press), 169–194. doi: 10.1017/CBO9781107415379.006
Cardona, O., Ordaz, M., Reinoso, E., Yamin, L., and Barbat, A. (2012). “Capra - comprehensive approach to probabilistic risk assessment: international initiative for risk management effectiveness,” in 15th World Conference on Earthquake Engineering (Lisbon).Available online at: https://www.researchgate.net/publication/259598259_CAPRA_-_Comprehensive_Approach_to_Probabilistic_Risk_Assessment_International_Initiative_for_Risk_Management_Effectiveness
Eyring, V., Bony, S., Meehl, G. A., Senior, C. A., Stevens, B., Stouffer, R. J., et al. (2016). Overview of the coupled model intercomparison project phase 6 (CMIP6) experimental design and organization. Geosci. Model Dev. 9, 1937–1958. doi: 10.5194/gmd-9-1937-2016
Fritzsche, K., Schneiderbauer, S., Bubeck, P., Kienberger, S., Buth, M., Zebisch, M., et al. (2014). The Vulnerability Sourcebook: Concept and Guidelines for Standardised Vulnerability Assessments. Federal Ministry for Economic Cooperation and Development. Available online at: https://www.adaptationcommunity.net/download/va/vulnerability-guides-manuals-reports/vuln_source_2017_EN.pdf
Greco, S., Ishizaka, A., Tasiou, M., and Torrisi, G. (2019). On the methodological framework of composite indices: a review of the issues of weighting, aggregation, and robustness. Soc. Indic. Res. 141, 61–94. doi: 10.1007/s11205-017-1832-9
Hsu, T.-W., Shih, D.-S., Li, C.-Y., Lan, Y.-J., and Lin, Y.-C. (2017). A study on coastal flooding and risk assessment under climate change in the mid-western coast of Taiwan. Water 9:390. doi: 10.3390/w9060390
Huang, L., Wu, J., and Yan, L. (2015). Defining and measuring urban sustainability: a review of indicators. Landscape Ecol. 30, 1175–1193. doi: 10.1007/s10980-015-0208-2
Johansen, A. (2010). “Monte Carlo methods,” in International Encyclopedia of Education, 3rd Edn., eds E. Baker, P. Peterson, and B. McGraw (Burlington, NJ: Elsevier Science), 296–303. doi: 10.1016/B978-0-08-044894-7.01543-8
Kropf, C. M., Ciullo, A., Otth, L., Meiler, S., Rana, A., Schmid, E., et al. (2022). Uncertainty and sensitivity analysis for probabilistic weather and climate risk modelling: an implementation in climada v.3.1.0. Geosci. Model Dev. Discuss. 2022, 1–32. doi: 10.5194/gmd-2021-437
Leis, J.-L., and Kienberger, S. (2020). Climate risk and vulnerability assessment of floods in austria: Mapping homogenous regions, hotspots and typologies. Sustainability 12:6458. doi: 10.3390/su12166458
Maher, N., Milinski, S., Suarez-Gutierrez, L., Botzet, M., Dobrynin, M., Kornblueh, L., et al. (2019). The Max Planck Institute grand ensemble: enabling the exploration of climate system variability. J. Adv. Model. Earth Syst. 11, 2050–2069. doi: 10.1029/2019MS001639
Mastrandrea, M., Field, C., Stocker, T., Edenhofer, O., Ebi, K., Frame, D., et al. (2010). Guidance Note for Lead Authors of the IPCC Fifth Assessment Report on Consistent Treatment of Uncertainties. Cambridge, UK: Cambridge University Press. doi: 10.1007/s10584-011-0178-6
Nardo, M., Saisana, M., Saltelli, A., Tarantola, S., Hoffmann, A., and Giovannini, E. (2008). Handbook on Constructing Composite Indicators: Methodology and User Guide, 2nd Edn. Paris: OECD Publishing. Available online at: https://www.oecd.org/sdd/42495745.pdf
Norström, A. V., Cvitanovic, C., Löf, M. F., West, S., Wyborn, C., Balvanera, P., et al. (2020). Principles for knowledge co-production in sustainability research. Nat. Sustain. 3, 182–190. doi: 10.1038/s41893-019-0448-2
O'Neill, B. C., Kriegler, E., Ebi, K. L., Kemp-Benedict, E., Riahi, K., Rothman, D. S., et al. (2017). The roads ahead: narratives for shared socioeconomic pathways describing world futures in the 21st century. Glob. Environ. Change 42, 169–180. doi: 10.1016/j.gloenvcha.2015.01.004
Reisinger, A., Howden, M., Vera, C., Garschagen, M., Hurlbert, M., Kreibiehl, S., et al. (2020). The Concept of Risk in the IPCC Sixth Assessment Report: A Summary of Cross-Working Group Discussions Guidance for IPCC Authors. Cambridge, UK: Cambridge University Press.
Riahi, K., van Vuuren, D. P., Kriegler, E., Edmonds, J., O'Neill, B. C., Fujimori, S., et al. (2017). The shared socioeconomic pathways and their energy, land use, and greenhouse gas emissions implications: an overview. Glob. Environ. Change 42, 153–168. doi: 10.1016/j.gloenvcha.2016.10.009
Rosen, R. (1991). Life Itself a Comprehensive Inquiry into the Nature, Origin, and Fabrication of Life (Complexity in Ecological Systems). New York, NY: Columbia University Press.
Saaty, T. L. (1990). How to make a decision: the analytic hierarchy process. Eur. J. Operat. Res. 48, 9–26 (Desicion making by the analytic hierarchy process: Theory and applications). doi: 10.1016/0377-2217(90)90057-I
Schwingshackl, C., Sillmann, J., Vicedo-Cabrera, A. M., Sandstad, M., and Aunan, K. (2021). Heat stress indicators in CMIP6: estimating future trends and exceedances of impact-relevant thresholds. Earth's Fut. 9:e2020EF001885. doi: 10.1029/2020EF001885
Seneviratne, S. I., Zhang, X., Adnan, M., Badi, W., Dereczynski, C., Di Luca, A., et al. (2022). “Chapter 1: Weather and climate extreme events in a changing climate,” in Climate Change 2021: The Physical Science Basis. Contribution of Working Group I to the Sixth Assessment Report of the Intergovernmental Panel on Climate Change, eds J. Chan, A. Sorteberg, and C. Vera (Cambridge, UK; New York, NY: Cambridge University Press), 1513–1766.
Tascón-González, L., Ferrer-Juliá, M., Ruiz, M., and García-Meléndez, E. (2020). Social vulnerability assessment for flood risk analysis. Water 12:558. doi: 10.3390/w12020558
Taylor, K. E., Stouffer, R. J., and Meehl, G. A. (2012). An overview of CMIP5 and the experiment design. Bull. Am. Meteorol. Soc. 93, 485–498. doi: 10.1175/BAMS-D-11-00094.1
Toimil, A., Losada, I. J., Díaz-Simal, P., Izaguirre, C., and Camus, P. (2017). Multi-sectoral, high-resolution assessment of climate change consequences of coastal flooding. Clim. Change 145, 431–444. doi: 10.1007/s10584-017-2104-z
UNDP (United Nations Development Programme). (2022). Human Development Report 2021-22: Uncertain Times, Unsettled Lives: Shaping our Future in a Transforming World. New York, NY: United Nations. Available online at: https://hdr.undp.org/content/human-development-report-2021-22?utm_source=EN&utm_medium=GSR&utm_content=US_UNDP_PaidSearch_Brand_English&utm_campaign=CENTRAL&c_src=CENTRAL&c_src2=GSR&gclid=CjwKCAiA68ebBhB-EiwALVC-Nmt8DV5fTFPH85IXmzColwOjbOLgOUbVQvcYhwEJdf7ouXGOVy8fiBoC28oQAvD_BwE
Vaughan, C., and Dessai, S. (2014). Climate services for society: origins, institutional arrangements, and design elements for an evaluation framework. WIREs Clim. Change 5, 587–603. doi: 10.1002/wcc.290
Wiréhn, L., Danielsson, A., and Neset, T.-S. S. (2015). Assessment of composite index methods for agricultural vulnerability to climate change. J. Environ. Manage. 156, 70–80. doi: 10.1016/j.jenvman.2015.03.020
Wu, J., and Wu, T. (2012). “Sustainability indicators and indices: an overview,” in Handbook of Sustainability Management, eds C. N. Madu and C.-H. Kuei (Singapore: World Scientific Publishing Co.), 65–86. doi: 10.1142/9789814354820_0004
Zachariah, M., T, A., AchutaRao, K., Saeed, F., Jha, R., Dhasmana, M., et al. (2022). Climate change made devastating early heat in India and Pakistan 30 times more likely. World Weather Attribution. 1–43. doi: 10.1038/d41586-022-01444-1
Keywords: uncertainty, climate risk assessment, impact chains, climate change risk, tourism risk management, heat index, composite index
Citation: Melo-Aguilar C, Agulles M and Jordà G (2022) Introducing uncertainties in composite indicators. The case of the Impact Chain risk assessment framework. Front. Clim. 4:1019888. doi: 10.3389/fclim.2022.1019888
Received: 15 August 2022; Accepted: 08 November 2022;
Published: 23 November 2022.
Edited by:
Emmanuel M. N. A. N. Attoh, Wageningen University and Research, NetherlandsReviewed by:
Gernot Wagner, Columbia University, United StatesKiyomine Terumoto, Kwansei Gakuin University, Japan
Copyright © 2022 Melo-Aguilar, Agulles and Jordà. This is an open-access article distributed under the terms of the Creative Commons Attribution License (CC BY). The use, distribution or reproduction in other forums is permitted, provided the original author(s) and the copyright owner(s) are credited and that the original publication in this journal is cited, in accordance with accepted academic practice. No use, distribution or reproduction is permitted which does not comply with these terms.
*Correspondence: Camilo Melo-Aguilar, camelo@ucm.es