Investigating the Impacts of Feedstock Variability on a Carbon-Negative Autothermal Pyrolysis System Using Machine Learning
 Arna Ganguly
 Robert C. Brown
 Mark Mba Wright
- 1Mechanical Engineering Department, Iowa State University, Ames, IA, United States
- 2Mechanical Engineering Department, Bioeconomy Institute, Iowa State University, Ames, IA, United States
Feedstock properties impact the economic feasibility and sustainability of biorefinery systems. Scientists have developed pyrolysis kinetics, process, and assessment models that estimate the costs and greenhouse gas (GHG) emissions of various biorefineries. Previous studies demonstrate that feedstock properties have a significant influence on product costs and lifecycle emissions. However, feedstock variability remains a challenge due to a large number of possible feedstock property combinations and limited public availability of feedstock composition data. Here, we demonstrate the use of machine learning (ML) models to generate large feedstock sample data from a smaller sample set for sustainability assessment of biorefinery systems. This study predicts the impact of feedstock properties on the profitability and sustainability of a lignocellulosic biomass autothermal pyrolysis (ATP) biorefinery producing sugar, phenolic oil, and biochar. Generative Adversarial Networks and Kernel Density Estimation machine learning models are used to generate 3,000 feedstock samples of diverse biochemical compositions. Techno-economic and lifecycle assessments estimated that the ATP minimum sugar selling price (MSSP) ranges between $66/metric ton (MT) and $280/MT, and the greenhouse gas (GHG) range from a net negative GHG emission(s) of −0.56 to −0.74 kg CO2e/kg lignocellulosic biomass processed. These results show the potential of ML to enhance sustainability analyses by replacing Monte Carlo-type approaches to generate large feedstock composition datasets that are representative of empirical data.
Introduction
The emission of CO2 into the atmosphere from the burning of fossil fuels has contributed to climate change. Atmospheric CO2 concentration reached 419 parts per million in 2021 (Rees and Columbia, 2021). Carbon dioxide removal from the atmosphere has been proposed to keep global temperature rise within 1.5°C (IPCC, 2021). Production of bioenergy with carbon capture and storage (BECCS) is one approach to carbon removal. This can be accomplished by growing lignocellulosic crops and converting them to useful bioproducts while capturing the CO2 emitted (Hickman, 2016; Rees and Columbia, 2021). Production and land sequestration of biochar via pyrolysis of biomass is another promising approach to carbon removal (Laird et al., 2009). The sustainability of biomass pyrolysis systems depends on feedstock availability and economic and life cycle performance specific to enterprise location and technology employed (Li et al., 2019).
According to the Billion-Ton Study, lignocellulosic resources, comprising mainly agricultural and forest residues, are presently about 365 million dry tons and are expected to rise to around 826 million dry tons by 2040 (Langholtz et al., 2016). Lignocellulosic biomass like corn stover (Ganguly et al., 2020), red oak (Elliott et al., 2015), soy hulls (Oliveira et al., 2015), switchgrass (Mullen and Boateng, 2008), etc. have been widely studied for thermochemical processing. Techno-economic assessment (TEA) of biomass-fed fast pyrolysis systems has demonstrated their economic and environmental viability. Wright et al. (2010) reported that naphtha and diesel range fuel could be produced in a 2,000 metric ton (MT)/day corn stover fed biorefinery at a minimum fuel selling price (MFSP) of $2.11/gallons. Hu et al. (2016) investigated the economic feasibility of a red oak-fed biorefinery producing biofuels and biochemicals. The study estimated a minimum selling price of $3.09/gallon and $433.7/MT for biofuels and biochemicals, respectively. It was observed that the co-production of biochemicals and biofuels was more profitable than the production of biofuels alone. In a study by Meyer et al. (2020) on the economics and life cycle performance of plants pyrolyzing woody and herbaceous biomass (six pure feedstocks—tulip, pine, corn stover, switchgrass, etc.), calculated MFSP of between $3.7/gge to $5.1/gge. They also observed that woody biomass produced more biofuel than herbaceous feedstock. LCA results of this study observed GHG reductions of around 72% compared to petroleum-based systems with the GHG emissions depending mostly on the feedstock type and other process parameters.
Scientists have investigated the impacts of feedstock properties on the bio-oil yield (Li et al., 2016), which affects the economic feasibility Ou et al. (2018). Li et al. (2017) reported that biomass ash content varying between 0.3 and 7.7 wt.% decreased the biofuel yield from 87.3 to 40.7 gallons/ton and increased the corresponding MFSP from $2.3/gallons to $4.8/gallons. Ou et al. (2018) developed a fast pyrolysis process model sensitive to feedstock characteristics obtained from experimentations. It was found that increasing the ash content from 1 to 7 % increased the MFSP from $0.97/liter to $1.06/liter due to lower biofuel yields. Although these findings show the importance of feedstock properties on biofuel production, few studies have explored the economics and environmental performance of pyrolysis applied to carbon removal.
The versatility of pyrolysis systems allows for the production of various bioproducts including bioasphalt (Peralta et al., 2012), sugars (Rover et al., 2014), and levoglucosan (Rover et al., 2019). Levoglucosan-rich pyrolytic sugars have gained attention due to their wide range of applications, like the fermentation of pyrolytic sugars to produce ethanol (Ganguly et al., 2020), biodegradable plastics, and pharmaceuticals (Junior et al., 2020). Rover et al. (2019) observed levoglucosan crystal production, along with phenolic compounds and biochar via autothermal pyrolysis (ATP) of red oak at a minimum selling price of $1,333/ton, which is much lesser than the market price. Autothermal pyrolysis has advantages of process simplification and intensification compared to conventional fast pyrolysis (Polin et al., 2019). LCA of an integrated fast pyrolysis-anaerobic digestion-fermentation plant producing ethanol, phenolic compounds, and power observed greenhouse gas emission of −16.6 g CO2e/MJ of ethanol (Ganguly et al., 2020). Other studies evaluated the simultaneous production of multiple products in integrated pyrolysis biorefineries (Dang et al., 2016; Hu et al., 2016).
Researchers have mostly employed regression and interpolation-based models on laboratory experiments to further predict pyrolysis output (Gronli and Melaaen, 2000; Neves et al., 2011; Li et al., 2017). Hansen and Mirkouei (2018) noted that typical mathematical models are not able to capture the complexities of biomass pyrolysis and bio-oil upgrading and suggested the adoption of machine intelligence techniques to overcome these shortcomings. They compared three types of models: a cyber physical system, an artificial neural network, and a “k-Nearest Neighbor” model of pyrolysis-based systems. They found the “k-Nearest Neighbor” model to be the most promising. The “k-Nearest Neighbor” successfully classified 214 biomass datasets obtained from various published resources with an accuracy of around 71% (Olatunji et al., 2020). To the best of our knowledge, machine learning has not been previously used to generate biochemical properties data sets for biomass feedstocks. This study introduces a novel approach to generating the biochemical composition of lignocellulosic biomass samples and demonstrates its application to economic and environmental technology assessment with the case study of a carbon removal pyrolysis system. The objective of this paper is to elucidate relationships between feedstock properties and the economic and environmental performance of an ATP biorefinery that produces sugars, phenolic oil, and biochar.
Methodology
This study describes the application of Machine Learning (ML) models to process modeling, TEA, and LCA assessment of biomass ATP to produce sugars, phenolic oil, and biochar. Two ML models are compared for the generation of datasets containing 3,000 lignocellulosic feedstock samples with unique cellulose, hemicellulose, and lignin composition. An Aspen Plus™ chemical process model predicts the mass and energy balance of a 250 tons per day ATP system. Process simulations are conducted using Aspen Simulation Workbook to gather simulation results based on the 3,000 feedstock samples. A range of minimum sugar selling prices (MSSP), lifecycle GHG emissions, and carbon removal rates are estimated from the simulation results. The results are interpreted using regression and sensitivity analyses to understand the influence of various parameters on the MSSP and environmental footprint. The MSSP values are compared to historical prices to evaluate the economic feasibility of the ATP to sugars platform.
Process Modeling
Figure 1 shows the flow diagram of the 250 ton/day lignocellulosic biomass-fed ATP system producing sugar, phenolic oil, and biochar. Table 1 shows the name of each block numbered in the flow diagram (Figure 1). Biomass, firstly undergoes chopping, drying and grinding to increase biomass to bio-oil conversion efficiency. The biomass is also pretreated by employing FeSO4 because of its ability to facilitate the depolymerization of lignin, thus helping in increasing sugar production (Rollag et al., 2020). FeSO4 leaves with the biochar, which is separated from the pyrolytic vapor stream via a gas cyclone, after thermochemical decomposition of the biomass in the ATP reactor. After separation of solid biochar, the pyrolytic vapors are condensed to recover so-called heavy ends, consisting of sugars and phenolic compounds, while the remaining stream, referred to as “tail gas” and consisting of light oxygenated compounds, moisture, and non-condensable gases (NCG), are burned for the purpose of providing process heat for biomass drying. Liquid-liquid extraction is used to separate the heavy ends into a sugar-rich aqueous stream of water-soluble compounds known as the sugar solution and a water-insoluble stream of mostly phenolic compounds referred to as phenolic oil. A simulated moving bed (SMB) is used to remove phenolic monomers that contaminate the sugar solution. The biochar represents a carbon sequestration product to be applied to croplands where it also serves as a soil amendement (Laird et al., 2009). The phenolic oil is sold for production of bioasphalt (Peralta et al., 2012). Aspen Plus™ was employed to model the system's major unit operations, particularly the ATP reactor and the sugar recovery block.
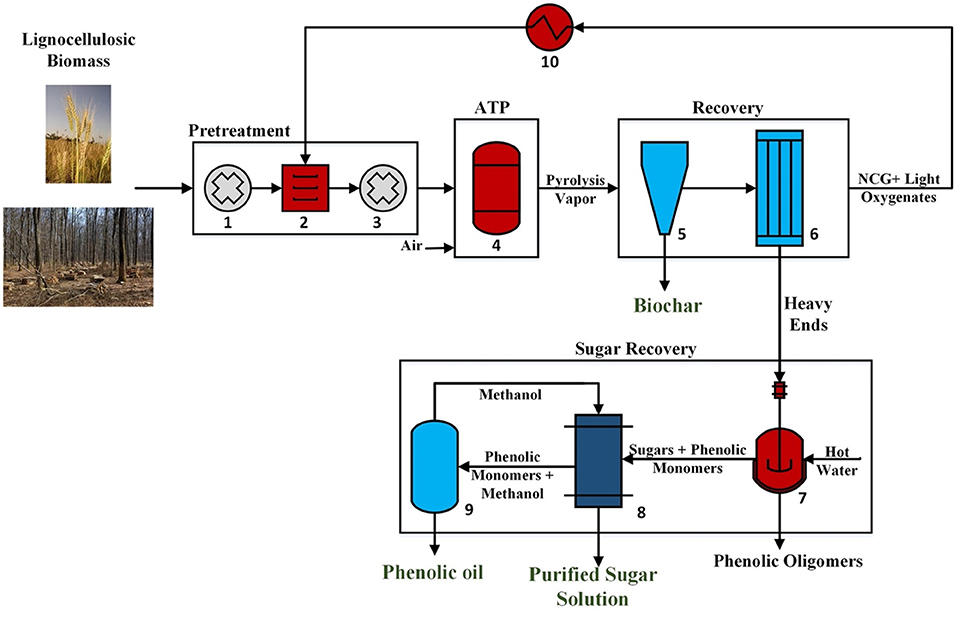
Figure 1. Flow diagram of 250 ton/day lignocellulosic biomass-driven ATP system producing sugar, phenolic oil, and biochar.
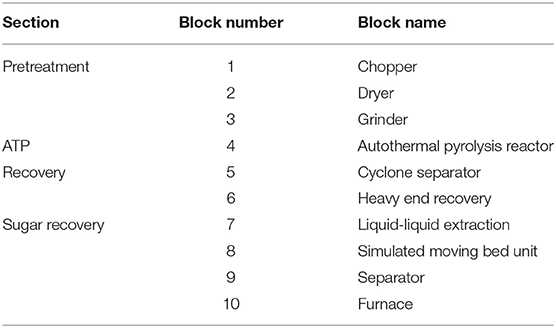
Table 1. Autothermal pyrolysis flow diagram sections, block numbers, and names.
The product yields from ATP were predicted using a Kriging ML model, which is particularly useful in predicting temporally and spatially co-related data. Kriging is a method of statistical interpolation modeled by a Gaussian process based on prior co-variances (Kriging Model, 2017). This interpolation gives more weight to nearby sample locations with the aim of reducing the expected error for a given point (Esri, 2021). Olafasakin et al. (2021) developed a Kriging-based reduced-order model built on Ranzi et al.'s kinetic model (Ranzi et al., 2008, 2017) to predict pyrolysis yields. For this study, we considered the more recent Caudle et al. (2020) kinetic model as our basis. The model by Caudle et al. (2020), which is also based on Ranzi's kinetic model, takes biomass biochemical composition (cellulose, hemicellulose, and lignin) and predicts the yields of 35 pyrolysis products, intermediate compounds, and unconverted biomass, including levoglucosan, phenols, biochar, and others, as shown in Table 2.
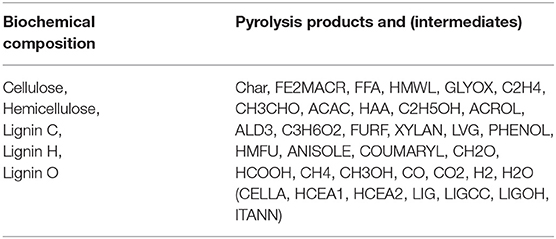
Table 2. Kriging machine learning model biochemical composition input and pyrolysis product output (Caudle et al., 2020).
For this study, we gathered feedstock dataset from the publicly available phyllis2 database (ECN, 2012) and samples provided by Idaho National Laboratory. This dataset consists of 400 samples containing the biochemical composition (cellulose, hemicellulose, and lignin) as measured in laboratory settings. We followed the commonly used 80–20 split for training and testing the dataset, respectively. The training data was used to train the Kriging model with the target of predicting the pyrolysis yields. The Kriging model product predictions were compared to Caudle et al. (2020) kinetic model results for validation. A unique approach employed in this study is the combined prediction of all 35 possible outputs. Usually, for predicting biochemical product outputs, to the best of our knowledge, the yields of each product are predicted one at a time from the input cellulose, hemicellulose, and lignin content (Debiagi et al., 2018; Dussan et al., 2019; Gorensek et al., 2019). Zhong et al. (2019) used a Kriging-based model in a single-stage hydrocracking process of an oil refinery. They used the primary input parameters of four kinds of raw materials to predict the mass yields of the output products like kerosene, diesel, light naphtha, heavy naphtha, light end, and tail oil. For our study, we have predicted all 35 output products from the kinetic model at once to capture the correlations better, if any, between the output yield products. A comparison of the Kriging model to Caudle et al. (2020) kinetic model results achieved an accuracy of 99%. The predicted yield data were imported into ASW, coupled with the pyrolysis yield reactor unit operation block within the Aspen Plus™ model. ASW obtained a set of sugar, biochar, and phenolic oil output flow rates for each feedstock sample. These output flow rates were employed for economic and environmental analysis. For this analysis, we assumed that ash content of biomass is not a major factor (specifically due to the use of FeSO4 pretreatment). We also assumed that the reactor operates at a uniform temperature and all biomass particles have relatively similar mechanical properties which do not affect the final output yield.
Techno-Economic Analysis (TEA)
A techno-economic analysis is performed to estimate the commercial viability of the pyrolytic sugars. TEA was used to quantify the minimum sugar selling price (MSSP) of a 250 tons/day lignocellulosic biomass ATP system. The economic performance of this study was analyzed based on a multiyear Discounted Cash Flow Rate of Return (DCFROR) method developed by the National Renewable Energy Laboratory (NREL). The financial assumptions of this study are from Rover et al. (2019). Table 3 points out all the essential financial assumptions used to evaluate the MSSP of the plant, and all monetary assumptions are on a 2015$ basis. The installation factors for the project were taken from Peters and Peters (1959). The internal rate of return (IRR) and project lifetime were 10% and 10 years, respectively. Capital costs include equipment costs and installation costs, and operating costs include raw material, labor, overhead, maintenance costs, and others.
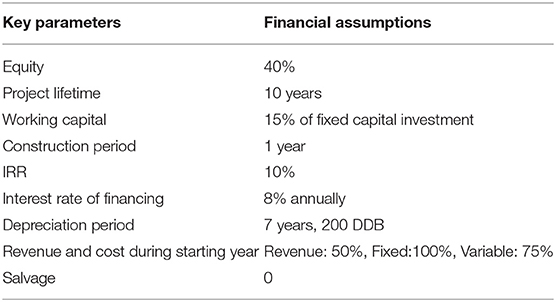
Table 3. Financial assumptions for a 250 tons/day ATP biorefinery facility producing sugar, phenolic oil, and biochar.
The price of lignocellulosic biomass was assumed an average price of $41/ton Rover et al. (2019) based on the projected costs to of biomass collection at a 250 ton/day scale. The prices of phenolic oil and biochar are assumed as $300/ton (Wang et al., 2020), and $80/ton (Dai et al., 2020), respectively. The market price for FeSO4 ranges between $520-$650/ton (obtained from Crown Technology, Inc. August 29th, 2019), and we assumed a price of $550/ton. It was assumed that 99% of the methanol was recycled for reutilization in the SMB unit (Li et al., 2018), incurring a cost of $500/ton (Rover et al., 2019). The FeSO4 pretreatment input rate was considered 4.5 wt.% (kg/kg of lignocellulosic biomass). Experiments show that effective FeSO4 input rates range between 1 and 9 wt.% depending on the feedstock properties (Rollag et al., 2020). The process model supplied the performance and operating parameters employed for sizing and equipment selection purposes. Table 4 tabulates the material and energy expenditure for the system and the revenue earned from selling the byproducts.
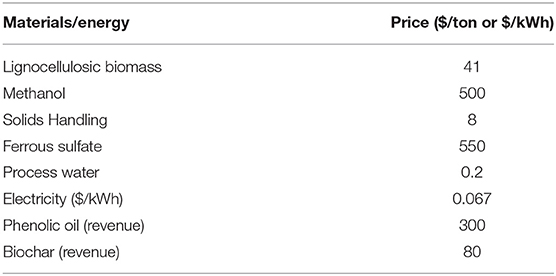
Table 4. Material/Energy costs and revenues earned for a 250 ton/day ATP biorefinery facility producing sugar, phenolic oil, and biochar.
Life Cycle Analysis (LCA)
Life cycle analysis (LCA) is a common and well-established technique for estimating the environmental impacts throughout a product's life cycle. This study employs a cradle-to-grave analysis based on the Greenhouse Gases, Regulated Emissions, and Energy Use in Transport (GREET) model developed by Argonne National Laboratory to evaluate the GHG emissions for lignocellulosic biomass ATP to sugar, phenolic oil, and biochar.
All the 3,000 samples of lignocellulosic biomass were assumed to be available within a 20-mile radius from the ATP-sugar plant. The emission factor for all the lignocellulosic biomass considers GHG emissions from feedstock production, harvesting, delivery to the plant gate, and includes direct and indirect land-use emissions. Electricity emission factors are based on the US National Grid mixture. Biochar was assumed to be used for soil amendment purposes with a carbon retention capability of 70% for 100 years (Söderqvist, 2019). We accounted for the 4.5 wt.% of FeSO4 and applied the FeSO4 free basis of biochar yield to the biochar emission factor. Phenolic oil was assumed as feedstock for bioasphalt production to be used in the highway industry. For the phenolic oil upgraded to bioasphalt, we assumed a carbon retention capability of 100% after 100 years (Zhou et al., 2020).
The functional unit for this study was 1 kg of lignocellulosic biomass input. Table 5 depicts the parameters responsible for material/energy input, i.e., lignocellulosic biomass and electricity, and the key outputs, i.e., biochar and phenolic oil.
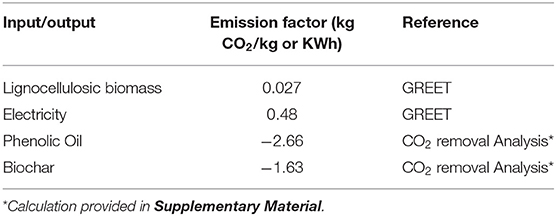
Table 5. Greenhouse gas emission factors of key material and energy flows of the autothermal pyrolysis to sugar, phenolic oil, and biochar biorefinery.
Machine Learning (ML) Analysis
We developed a machine learning (ML) analysis to quantify the impact of feedstock variability on the MSSP and GHG emissions. Previous studies employed Monte Carlo analysis to show that pyrolysis profitability and sustainability are highly sensitive to the feedstock composition (Li et al., 2017; Meyer et al., 2020). Our ML approach improves the Monte Carlo approach by generating feedstock composition samples that closely reflect experimental datasets. The biochemical-based feedstock dataset used to predict the pyrolysis yield data were generated using ML Generative Adversarial Network (GAN) and Kernel Density Estimation (KDE) models. These ML models have been proven to effectively replicate a wide range of datasets for a variety of applications (Aggarwal et al., 2021) but, to our knowledge, have not been applied to feedstock sample generation.
GAN is a deep learning-based generative modeling technique. Generative modeling is a procedure where a model learns from patterns in input data to produce data samples that are similar to the original input data. Unlike most generative models, GANs consist of two separate models; a generative model G that captures the input data distribution and a discriminative model D that aims to predict whether the data came from the initial training data or the G model. This approach corresponds to a minimax two-player game. The aim of a GAN model is for G to learn the training data distribution to maximize the probability of D confusing the generated sample for an original data input. GANs are usually modeled as supervised learning problems. This adversarial modeling framework consists of two models, both of which are usually multilayer perceptrons—layers of neural networks. A neural network is a collection of functions that respond to a given output based on a set of rules (Cross et al., 1995). Mathematically, the generator G is a differentiable function G(z; θg) represented by a multilayer perceptron with parameters θg. The discriminator D is also a multilayer perceptron D(x; θd) that produces a single scalar. D is trained with the intention of improving its ability to correctly classify samples from the training data and the data from G. G, on the other hand, is trained to minimize log(1−D(G(z))). The tasks of D and G can be expressed using the following equation:
During the early learning phase, D can make predictions with high confidence as the initially generated samples are quite different from the training data. With gradual training, G learns to generate samples that are more in line with the training data. After a sufficient learning period, G and D will reach a point where their performance cannot be improved. This usually happens when the discriminator is unable to differentiate between the two distributions (Goodfellow et al., 2020). GAN and its variants have been used for image texture synthesis to improve the resolution of an image, text to image synthesis, image generation or translation, video generation, etc. (Ghosh et al., 2020). To the best of our knowledge, GANs have not been used to generate a biomass feedstock dataset.
Kernel Density Estimation (KDE) is an alternative to GAN that employs a statistical approach for estimating the probability density function of a random variate. KDE is a data smoothing problem aiming to create a smooth curve over the given finite data points, unlike the more discrete data representations of histograms (Weglarczyk, 2018). For a given set of data points, KDE builds up an estimate of the underlying data distribution of the dataset. Mathematically, the kernel density estimator can be given by:
where K is the kernel function used for estimation, xi represents the samples drawn from a distribution with unknown density f. h is a parameter called bandwidth that controls the smoothness of the resulting curve (Scott, 2018). For estimating the kernel density, the data points are divided into bins of specified intervals. The number of data points inside a particular bin represents the probability of an unseen data lying in that interval. The higher the number of data points in an interval, the higher the probability of a data point lying in that interval. Thus, KDE is useful for generating synthetic data with a distribution similar to a given dataset. KDE finds uses in a variety of fields like signal processing-based applications (Baranowski et al., 2012), population density estimation (Müller and Petersen, 2016), and climate prediction (Weglarczyk, 2018). The KDE was trained and tested in a similar fashion to the GAN, and the outputs of both models were visually compared (see Supplementary Material).
The GAN and KDE models were trained using data from the Phyllis 2 and Idaho National Laboratory (INL) databases. Phyllis 2, developed by the Energy Research Center of Netherland (ECN), is a database of biomass compositions based on plant physiology mixture and other practical considerations [(ECN, 2012)]. We collected data corresponding to lignocellulosic biomass feedstock from this dataset and grouped them into different kinds of biomass samples based on their cellulose, hemicellulose, and lignin content. These samples included biomass composition data of untreated wood, treated wood, straw (stalk/cob/ear), grass/plant, organic residue/product, and husk/shell/pit. In addition, we also received 14 commercial feedstock samples type of pine, juniper, and poplar from Idaho National Laboratory (INL). By combining these two datasets, we had a total of 518 real sample data of lignocellulosic biomass consisting of their cellulose, hemicellulose, and lignin content. The models were constrained to yield cellulose and hemicellulose contents ranging between 0 and 1. The lignin content was calculated by difference to generate a total biochemical composition of 1.
We have considered both GAN and KDE for generating biomass feedstock composition for our study. Our computational experiments showed that the synthetic data produced by GAN better resembles the real data samples. We generated 3,000 GAN synthetic samples for the final dataset.
Results and Discussion
The GAN ML model generated 3,000 samples of feedstock biochemical data. Figures 2, 3 show the similarity of the GAN ML samples to the original input data set through Van Krevelen-type diagrams. These diagrams describe the relationship between each sample's hemicellulose/cellulose (HC) and lignin/cellulose (LC) mass ratios. These diagrams facilitate visual inspection of the data to support the statistical metrics.
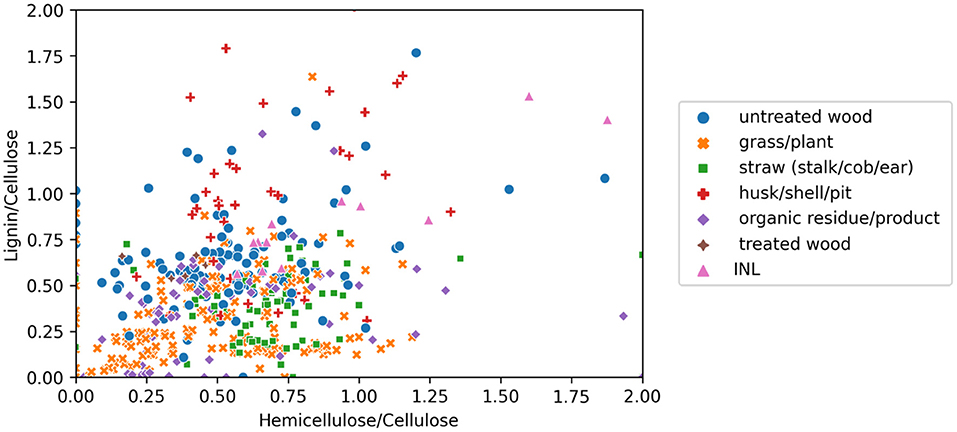
Figure 2. Feedstock lignin/cellulose vs. hemicellulose/cellulose ratios [adapted from INL and Phyllis 2 (ECN, 2012). database].
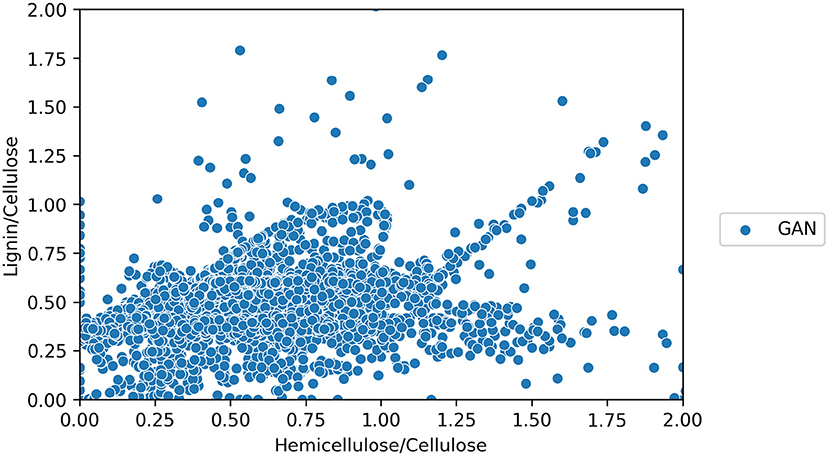
Figure 3. Feedstock lignin/cellulose to hemicellulose/cellulose ratios of the Generative Adversarial Network (GAN) sample data.
Figure 2 includes the 400 input data's biomass type classification: untreated wood, grass/plant, straw, husk/shell/pit, organic residue, treated wood, and INL samples. As shown, there are a few clusters, including most grass plants having LC ratios of <0.75 and most untreated wood having HC ratios of <1. There are several outliers in the top right corner with high HC and LC ratios due to the samples' low cellulose content.
Figure 3 shows a Van Krevelen-type diagram of the 3,000 GAN-generated data samples, compared to Figure 2. The HC and LC values of the GAN data are closer to the input data than the KDE data. GAN generated fewer outliers and more samples around the clusters in the original data. Henceforth, the result section focuses on the GAN results. KDE results are included in Supplementary Material.
We predicted biomass pyrolysis yields for the 3,000 ML samples using the Kriging-ML model of the ATP system. Figure 4 shows the ATP product yield relationships to cellulose content. We observe that sugar, phenolic oil, and biochar yields have an approximately linear relationship with cellulose content. Sugar and phenolic oil yields increased with cellulose content, but biochar yield decreased. This finding agrees with experimental observations where cellulose pyrolysis produces more pyrolysis oil than lignin, which favors biochar production. Cellulose decomposes at a temperature between 315 and 400°C, which is lower than pyrolytic temperature (typically 500°C), and quickly converts to pyrolytic vapors (Yang et al., 2007; Lee et al., 2013).
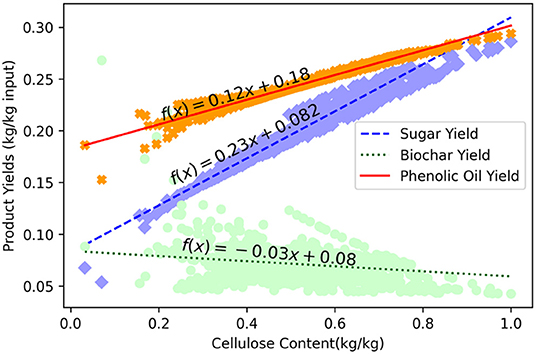
Figure 4. Sugar, biochar, and phenolic oil autothermal pyrolysis yield vs. cellulose content.
As shown in Figure 5, sugar and phenolic oil yields exhibit an exponential decay with increasing hemicellulose/cellulose (top) and lignin/cellulose ratios (bottom) while biochar yields increase in a logarithmic manner. The machine learning yield-based trends were similar to those reported in other studies (Zhou et al., 2018; Tomczyk et al., 2020). Unlike the hemicellulose/cellulose ratio, the biochar yield had an increasing pattern at a high lignin/cellulose ratio. Higher lignin content in a feedstock induces char production (Demirbas, 2004; Shariff et al., 2016; Tomczyk et al., 2020). These results do not account for ash content, reaction temperature changes, differences in particle mechanical properties, and others that might affect ATP yield.
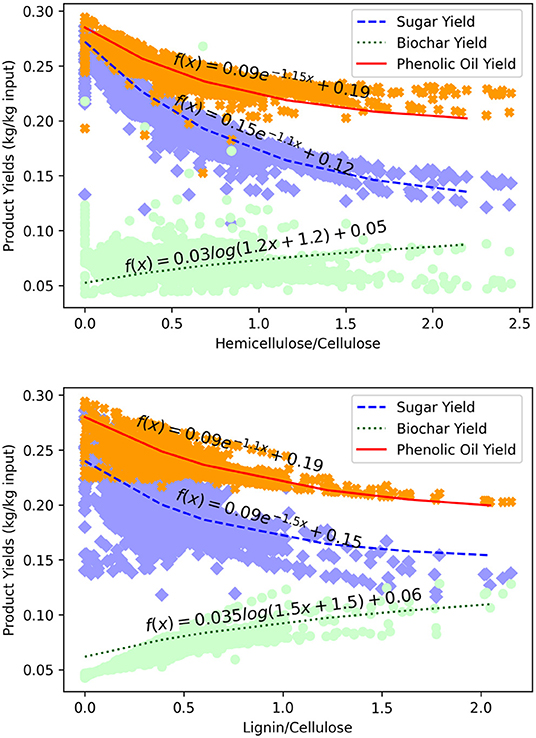
Figure 5. Sugar, phenolic oil, and biochar autothermal pyrolysis product yield trends vs. hemicellulose/cellulose ratios (Top) and lignin/cellulose ratios (Bottom).
Figure 6 shows the MSSP obtained from evaluating the 3,000 plus sample data gathered from the GAN feedstock database. The ATP system incurs a total fixed capital investment of $16 MM. We compared the generated values of MSSP with the historical price of sugar obtained from the U.S. Department of Agriculture. The blue dashed line is the current price of sugar which is around $369/MT (Hunt, 2021), and the red dashed-dot line represents the average sugar price over the last 5 years. The result showed that the MSSP generated using the GAN model was expected to be lower than the historical sugar price over the last 5 years.
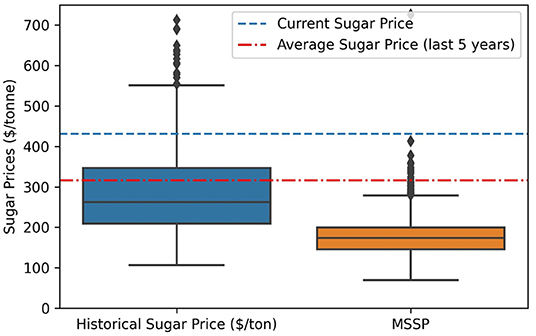
Figure 6. Boxplot comparison of the historical sugar prices (Left) and Generative Adversarial Network (GAN) Minimum Sugar Selling Price (MSSP) estimates (Right).
Figure 7 shows the probability density of GHG emissions obtained from the GAN values expressed in kg CO2e/kg of lignocellulosic biomass. The GHG emissions varied between −0.56 and −0.74 kg CO2e/kg lignocellulosic biomass. It was observed that all the values obtained show negative emissions. Based on the global market demand for sugars (Statistica, n.d.), phenolic oil (asphalt) (Freedonia Group, World Asphalt (Bitumen), 2020), and biochar (Grand View Rearch, 2019), ATP systems could achieve a potential removal of 0.0006 to 0.8 billion-tons CO2 per year if these markets are completely saturated by ATP products. This supports the classification of lignocellulosic biomass ATP plant producing sugar, phenolic oil, and biochar as a carbon-negative system.
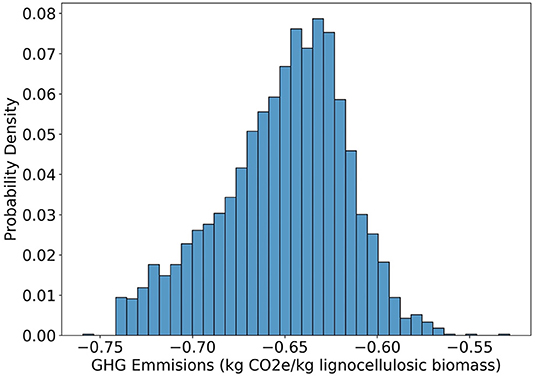
Figure 7. Probability density of greenhouse gas emissions from a lignocellulosic autothermal pyrolysis system producing sugar, phenolic oil, and biochar. Negative emissions represent net carbon removal of atmospheric CO2.
There are several techno-economic and lifecycle assessment assumptions that could vary significantly depending on the location of the facility. For example, electricity costs and emissions vary based on the predominant resource available. Switching from the US grid mixture to wind power generation could lower costs from $185 to $183/MT of sugar and emissions from −0.65 to −0.67 kg CO2e/kg corn stover. A detailed analysis of regional factors is beyond the scope of this study.
Conclusions
This study investigated the impact of feedstock variability on a 250 ton/day lignocellulosic biomass-driven autothermal pyrolysis biorefinery producing sugar, phenolic oil, and biochar. This study utilized GAN and KDE models for generating biochemical feedstock data samples based on real samples obtained from Phyllis 2 and INL. We compared the GAN and KDE biochemical composition to the real samples. GAN-generated samples showed a closer agreement with the input data. Pyrolysis yield predictions based on the GAN samples showed a linear relationship between the biomass cellulose content and the sugar and phenolic oil yields. Biochar yield showed a logarithmic relationship with an increase in the lignin content of biomass feedstock. The MSSP and GHG emissions from the GAN generated model varied between $66/MT and $280/MT and −0.56 kg CO2e/kg and −0.74 kg CO2e/kg lignocellulosic biomass used for the ATP system, respectively. These findings suggest that lignocellulosic biomass autothermal pyrolysis produces pyrolytic sugars, phenolic oil, and biochar is an economic and sustainable carbon-negative system.
However, this study does not explicitly consider the underlying uncertainty in the experimental data. We also assume that ash content does not play a major factor in the output yields, and the pyrolytic reactor operates at a uniform temperature. Additionally, we also assume that all particles have relatively similar characteristics and do not consider the impact of particle variability on the output yield.
Future studies will investigate the impact of facility location on costs and emissions due to regional factors like local feedstock, fuel, and electricity resources. We are also interested in comparing the ATP carbon-negative platform to alternative carbon capture and sequestration systems. The machine learning techniques from this study could be applied to other systems to evaluate their potential for improving sustainability assessments. ML could also be used to directly predict the sugar, phenolic oil, and biochar output from the 35 pyrolysis intermediate products instead of using Aspen Plus. Machine learning models could also be applied to look into how other experimental factors like reactor temperature changes mechanical particle properties affect the product yield and, in turn affect the economical and environmental aspects of the considered system.
Data Availability Statement
The original contributions presented in the study are included in the article/Supplementary Materials, further inquiries can be directed to the corresponding author/s.
Author Contributions
This study's supervision and concept building were provided by MW and RB. Methodology and analysis of this study were done by AG and MW. Writing and editing were performed by AG, MW, and RB. All authors contributed to the article and approved the submitted version.
Funding
This research was funded in part by the American Institute of Chemical Engineers as part of the Department of Energy sponsored RAPID Institute [subcontract #138846].
Conflict of Interest
The authors declare that the research was conducted in the absence of any commercial or financial relationships that could be construed as a potential conflict of interest.
Publisher's Note
All claims expressed in this article are solely those of the authors and do not necessarily represent those of their affiliated organizations, or those of the publisher, the editors and the reviewers. Any product that may be evaluated in this article, or claim that may be made by its manufacturer, is not guaranteed or endorsed by the publisher.
Acknowledgments
The authors would like to thank Drs. Vicki Thompson and Rachel Emerson from Idaho National Laboratory for providing the lignocellulosic biomass data. The authors would also like to thank Crown Technology Inc., for providing the FeSO4 price range.
Supplementary Material
The Supplementary Material for this article can be found online at: https://www.frontiersin.org/articles/10.3389/fclim.2022.842650/full#supplementary-material
References
Aggarwal, A., Mittal, M., and Battineni, G. (2021). Generative adversarial network: An overview of theory and applications. Int. J. Inf. Manag. Data Insights 1, 100004. doi: 10.1016/j.jjimei.2020.100004
Baranowski, J., Piatek, P., Kawala-Janik, A., Pelc, M., and Anthony, R. J. (2012). “Application of kernel density estimators for analysis of EEG signals,” in Proceedings of the 6th International Conference on Ubiquitous Computing and Ambient Intelligence (UCAmI'12) (Vitoria-Gasteiz; Berlin; Heidelberg: Springer-Verlag), 403–406. doi: 10.1007/978-3-642-35377-2_56
Caudle, B., Gorensek, M. B., and Chen, C. C. (2020). A novel approach to modeling biomass pyrolysis in a fluidized bed reactor. ACS Sustain. Chem. Eng. 8, 14605–14615. doi: 10.1021/acssuschemeng.0c05783
Cross, S. S., Harrison, R. F., and Kennedy, R. L. (1995). Introduction to Neural Networks. CRC Press. doi: 10.1016/S0140-6736(95)91746-2
Dai, Y., Wang, W., Lu, L., Yan, L., and Yu, D. (2020). Utilization of biochar for the removal of nitrogen and phosphorus. J. Clean. Prod. 257, 120573. doi: 10.1016/j.jclepro.2020.120573
Dang, Q., Hu, W., Rover, M., Brown, R. C., and Wright, M. M. (2016). Economics of biofuels and bioproducts from an integrated pyrolysis biorefinery. Biofuels Bioprod. Biorefining 10, 790–803. doi: 10.1002/bbb.1681
Debiagi, P., Gentile, G., Cuoci, A., Frassoldati, A., Ranzi, E., and Faravelli, T. (2018). A predictive model of biochar formation and characterization. J. Anal. Appl. Pyrolysis 134, 326–335. doi: 10.1016/j.jaap.2018.06.022
Demirbas, A.. (2004). Effects of temperature and particle size on bio-char yield from pyrolysis of agricultural residues. J. Anal. Appl. Pyrolysis 72, 243–248. doi: 10.1016/j.jaap.2004.07.003
Dussan, K., Dooley, S., and Monaghan, R. F. D. (2019). A model of the chemical composition and pyrolysis kinetics of lignin. Proc. Combustion Instit. 37, 2697–2704. doi: 10.1016/j.proci.2018.05.149
ECN (2012). Phyllis2 - ECN Phyllis classification. Energy Res. Cent. 2–4. Available online at: https://www.ecn.nl/phyllis2/Browse/Standard/ECN-Phyllis#willow
Elliott, D. C., Wang, H., Rover, M., Whitmer, L., Smith, R., and Brown, R. (2015). Hydrocarbon liquid production via catalytic hydroprocessing of phenolic oils fractionated from fast pyrolysis of red oak and corn stover. ACS Sustain. Chem. Eng. 3, 892–902. doi: 10.1021/acssuschemeng.5b00015
Esri (2021). ArcMap Documentation. Available online at: https://desktop.arcgis.com/en/arcmap/latest/tools/spatial-analyst-toolbox/sink.htm (accessed July 10, 2021).
Freedonia Group World Asphalt (Bitumen). (2020). Available online at: https://www.freedoniagroup.com/industry-study/world-asphalt-bitumen-3351.htm#:~:text=Through2019%2Cglobaldemandfortons (accessed March 10, 2022).
Ganguly, A., Martin, I. M., Brown, R. C., and Wright, M. M. (2020). Application of hydroprocessing, fermentation, and anaerobic digestion in a carbon-negative pyrolysis refinery. ACS Sustain. Chem. Eng. 8, 16413–16421. doi: 10.1021/acssuschemeng.0c03905
Ghosh, B., Dutta, I. K., Totaro, M., and Bayoumi, M. (2020). “A survey on the progression and performance of generative adversarial networks,” in 2020 11th International Conference on Computing, Communication and Networking Technologies, ICCCNT 2020 (Kharagpur: IEEE). doi: 10.1109/ICCCNT49239.2020.9225510
Goodfellow, I., Pouget-Abadie, J., Mirza, M., Xu, B., Warde-Farley, D., Ozair, S., et al. (2020). Generative adversarial networks. Commun. ACM 63, 139–144. doi: 10.1145/3422622
Gorensek, M. B., Shukre, R., and Chen, C. C. (2019). Development of a thermophysical properties model for flowsheet simulation of biomass pyrolysis processes. ACS Sust Chem Eng. 7, 9017–9027. doi: 10.1021/acssuschemeng.9b01278
Grand View Rearch (2019). Biochar Market Size, Share & Trends Analysis Report By Technology (Gasification, Pyrolysis), By Application (Agriculture (Farming, Livestock)), By Region, And Segment Forecasts, 2019—2025. Biochar Mark. Size, Share, Trends, Glob. Ind. Rep. Available online at: https://www.grandviewresearch.com/industry-analysis/biochar-market#
Gronli, M. G., and Melaaen, M. C. (2000). Mathematical model for wood pyrolysis-comparison of experimental measurements with model predictions. Energy Fuels 14, 791–800. doi: 10.1021/ef990176q
Hansen, S., and Mirkouei, A. (2018). “Past infrastructures and future machine intelligence (mi) for biofuel production: a review and mi-based framework,” in Proceedings of the ASME 2018 International Design Engineering Technical Conferences and Computers and Information in Engineering Conference. Volume 4: 23rd Design for Manufacturing and the Life Cycle Conference; 12th International Conference on Micro- and (Quebec City, QC: ASME). doi: 10.1115/detc2018-86150
Hickman, L.. (2016). Timeline: How BECCS became climate change's “saviour” technology. CarbonBrief, 1–10. Available online at: http://www.carbonbrief.org/beccs-the-story-of-climate-changes-saviour-technology?utm_content=buffer79430&utm_medium=social&utm_source=twitter.com&utm_campaign=buffer (accessed August 3, 2021).
Hu, W., Dang, Q., Rover, M., Brown, R. C., and Wright, M. M. (2016). Comparative techno-economic analysis of advanced biofuels, biochemicals, and hydrocarbon chemicals via the fast pyrolysis platform. Biofuels 7, 87–103. doi: 10.1080/17597269.2015.1118780
Hunt, N.. (2021). SOFTS-Raw sugar prices ease, cocoa regains some ground. Available online at: https://www.nasdaq.com/articles/softs-raw-sugar-prices-ease-cocoa-regains-some-ground-2021-04-21 (accessed July 10, 2021).
IPCC (2021). Climate Change 2021: The Physical Science Basis Contribution of Working Group I to the Sixth Assessment Report of the Intergovernmental Panel on Climate Change, eds V. Masson-Delmotte, P. Zhai, A. Pirani, S. L. Connors, C. Péan, S. Berger, N. Caud, Y. Chen (Cambridge University Press). Available online at: https://www.ipcc.ch/report/ar6/wg1/downloads/report/IPCC_AR6_WGI_Full_Report.pdf (accessed November 3, 2021).
Junior, I. I., Avelar Do Nascimento, M., De Souza, R. O. M. A., Dufour, A., and Wojcieszak, R. (2020). Levoglucosan: A promising platform molecule? Green Chem. 22, 5859–5880. doi: 10.1039/d0gc01490g
Kriging Model (2017). Available online at: https://abaqus-docs.mit.edu/2017/English/IhrUserMap/ihr-c-Reference-Kriging.htm (accessed July 10, 2021).
Laird, D. A., Brown, R. C., Amonette, J. E., and Lehmann, J. (2009). Review of the pyrolysis platform for coproducing bio-oil and biochar. Biofuels, Bioprod. Biorefining 3, 547–562. doi: 10.1002/bbb.169
Langholtz, M., Stokes, B., and Eaton, L. (2016). 2016 billion-ton report: Advancing domestic resources for a thriving bioeconomy (Executive Summary). Industr. Biotechnol. 12, 282–289. doi: 10.1089/ind.2016.29051.doe
Lee, Y., Park, J., Ryu, C., Gang, K. S., Yang, W., Park, Y. K., et al. (2013). Comparison of biochar properties from biomass residues produced by slow pyrolysis at 500°C. Bioresour. Technol. 148, 196–201. doi: 10.1016/j.biortech.2013.08.135
Li, C., Aston, J. E., Lacey, J. A., Thompson, V. S., and Thompson, D. N. (2016). Impact of feedstock quality and variation on biochemical and thermochemical conversion. Renew. Sustain. Energy Rev. 65, 525–536. doi: 10.1016/j.rser.2016.06.063
Li, W., Dang, Q., Brown, R. C., Laird, D., and Wright, M. M. (2017). The impacts of biomass properties on pyrolysis yields, economic and environmental performance of the pyrolysis-bioenergy-biochar platform to carbon negative energy. Bioresour. Technol. 241, 959–968. doi: 10.1016/j.biortech.2017.06.049
Li, W., Dumortier, J., Dokoohaki, H., Miguez, F. E., Brown, R. C., Laird, D., et al. (2019). Regional techno-economic and life-cycle analysis of the pyrolysis-bioenergy-biochar platform for carbon-negative energy. Biofuels. Bioprod. Biorefining 13, 1428–1438. doi: 10.1002/bbb.2043
Li, W., Ghosh, A., Bbosa, D., Brown, R., and Wright, M. M. (2018). Comparative techno-economic, uncertainty and life cycle analysis of lignocellulosic biomass solvent liquefaction and sugar fermentation to ethanol. ACS Sustain. Chem. Eng. 6, 16515–16524. doi: 10.1021/acssuschemeng.8b03622
Meyer, P. A., Snowden-Swan, L. J., Jones, S. B., Rappé, K. G., and Hartley, D. S. (2020). The effect of feedstock composition on fast pyrolysis and upgrading to transportation fuels: Techno-economic analysis and greenhouse gas life cycle analysis. Fuel 259, 116218. doi: 10.1016/j.fuel.2019.116218
Mullen, C. A., and Boateng, A. A. (2008). Chemical composition of bio-oils produced by fast pyrolysis of two energy crops. Energy Fuels 22, 2104–2109. doi: 10.1021/ef700776w
Müller, H.-G., and Petersen, A. (2016). Density Estimation Including Examples. Wiley StatsRef: Statistics Reference Online, 1–12. doi: 10.1002/9781118445112.stat02808.pub2
Neves, D., Thunman, H., Matos, A., Tarelho, L., and Gómez-Barea, A. (2011). Characterization and prediction of biomass pyrolysis products. Prog. Energy Combust. Sci. 37, 611–630. doi: 10.1016/j.pecs.2011.01.001
Olafasakin, O., Chang, Y., Passalacqua, A., Subramaniam, S., Brown, R. C., and Mba Wright, M. (2021). Machine learning reduced order model for cost and emission assessment of a pyrolysis system. Energ Fuels. 35, 9950–9960. doi: 10.1021/acs.energyfuels.1c00490
Olatunji, O. O., Akinlabi, S., Madushele, N., and Adedeji, P. A. (2020). Property-based biomass feedstock grading using k-nearest neighbour technique. Energy 190, 116346. doi: 10.1016/j.energy.2019.116346
Oliveira, T. J. P., Cardoso, C. R., and Ataíde, C. H. (2015). Fast pyrolysis of soybean hulls: Analysis of bio-oil produced in a fluidized bed reactor and of vapor obtained in analytical pyrolysis. J. Thermal Anal. Calorimetry 120, 427–438. doi: 10.1007/s10973-015-4600-6
Ou, L., Kim, H., Kelley, S., and Park, S. (2018). Impacts of feedstock properties on the process economics of fast-pyrolysis biorefineries. Biofuels, Bioprod. Biorefining 12, 442–452. doi: 10.1002/bbb.1860
Peralta, J., Wiliams, R. C., Rover, M., and Silva, H. M. R. D. (2012). Development of Rubber-Modified Fractionated Bio-Oil for Use as Noncrude Petroleum Binder in Flexible Pavements. Available online at: https://repositorium.sdum.uminho.pt/bitstream/1822/22357/1/Artigo_TRB-Circular-ec165-mypaper.pdf
Peters, M. S., and Peters, J. I. (1959). Plant Design and Economics for Chemical Engineers, 4th Edn. New York, NY: McGraw-Hill. doi: 10.1080/00137915908965075
Polin, J. P., Peterson, C. A., Whitmer, L. E., Smith, R. G., and Brown, R. C. (2019). Process intensification of biomass fast pyrolysis through autothermal operation of a fluidized bed reactor. Appl. Energy 249, 276–285. doi: 10.1016/j.apenergy.2019.04.154
Ranzi, E., Cuoci, A., Faravelli, T., Frassoldati, A., Migliavacca, G., Pierucci, S., et al. (2008). Chemical kinetics of biomass pyrolysis. Energ. Fuels 22, 4292–4300. doi: 10.1021/ef800551t
Ranzi, E., Debiagi, P. E. A., and Frassoldati, A. (2017). Mathematical modeling of fast biomass pyrolysis and bio-oil formation. note i: kinetic mechanism of biomass pyrolysis. ACS Sust. Chem. Eng. 5, 2867–2881. doi: 10.1021/acssuschemeng.6b03096
Rees, B. W. E., and Columbia, B. (2021). COP-26: Stopping Climate Change and Other Illusions – Commentaries, 1–3. Available online at: https://www.buildingsandcities.org/insights/commentaries/cop26-illusions.html (accessed December 22, 2021).
Rollag, S. A., Lindstrom, J. K., and Brown, R. C. (2020). Pretreatments for the continuous production of pyrolytic sugar from lignocellulosic biomass. Chem Eng. J. 385, 123889. doi: 10.1016/j.cej.2019.123889
Rover, M. R., Aui, A., Wright, M. M., Smith, R. G., and Brown, R. C. (2019). Production and purification of crystallized levoglucosan from pyrolysis of lignocellulosic biomass. Green Chem. 21, 5980–5989. doi: 10.1039/c9gc02461a
Rover, M. R., Johnston, P. A., Jin, T., Smith, R. G., Brown, R. C., and Jarboe, L. (2014). Production of clean pyrolytic sugars for fermentation. ChemSusChem 7, 1662–1668. doi: 10.1002/cssc.201301259
Scott, D. W.. (2018). Kernel Density Estimation. Wiley StatsRef Stat. Ref. Online 1–7. doi: 10.1002/9781118445112.stat07186.pub2
Shariff, A., Mohamad Aziz, N. S., Md Saleh, N., and Ruzali, N. S. I. (2016). The effect of feedstock type and slow pyrolysis temperature on biochar yield from coconut wastes. Int. J. Chem. Mol. Eng. 10, 1410–1414. doi: 10.5281/zenodo.1127426
Söderqvist, H.. (2019). Carbon stability of biochar methods for assessment and indication. Available online at: http://kth.diva-portal.org/smash/get/diva2:1334635/FULLTEXT01.pdf
Tomczyk, A., Sokołowska, Z., and Boguta, P. (2020). Biochar physicochemical properties: pyrolysis temperature and feedstock kind effects. Rev. Environ. Sci. Biotechnol. 19, 191–215. doi: 10.1007/s11157-020-09523-3
Wang, H., Ma, Z., Chen, X., and Mohd Hasan, M. R. (2020). Preparation process of bio-oil and bio-asphalt, their performance, and the application of bio-asphalt: A comprehensive review. J. Traffic Transp. Eng. 7, 137–151. doi: 10.1016/j.jtte.2020.03.002
Weglarczyk, S.. (2018). “Kernel density estimation and its application,” in ITM Web of Conferences (Boguszó-Gorce: EDP Sciences). doi: 10.1051/itmconf/20182300037
Wright, M. M., Daugaard, D. E., Satrio, J. A., and Brown, R. C. (2010). Techno-economic analysis of biomass fast pyrolysis to transportation fuels. Fuel 89, S2–S10. doi: 10.1016/j.fuel.2010.07.029
Yang, H., Yan, R., Chen, H., Lee, D. H., and Zheng, C. (2007). Characteristics of hemicellulose, cellulose and lignin pyrolysis. Fuel 86, 1781–1788. doi: 10.1016/j.fuel.2006.12.013
Zhong, W., Qiao, C., Peng, X., Li, Z., Fan, C., and Qian, F. (2019). Operation optimization of hydrocracking process based on Kriging surrogate model. Control Eng. Pract. 85, 34–40. doi: 10.1016/j.conengprac.2019.01.001
Zhou, X., Li, W., Mabon, R., and Broadbelt, L. J. (2018). A mechanistic model of fast pyrolysis of hemicellulose. Energy Environ. Sci. 11, 1240–1260. doi: 10.1039/c7ee03208k
Keywords: machine learning, negative emission technology, autothermal pyrolysis, techno-economic analysis (TEA), lifecycle analysis (LCA)
Citation: Ganguly A, Brown RC and Wright MM (2022) Investigating the Impacts of Feedstock Variability on a Carbon-Negative Autothermal Pyrolysis System Using Machine Learning. Front. Clim. 4:842650. doi: 10.3389/fclim.2022.842650
Received: 24 December 2021; Accepted: 31 March 2022;
Published: 09 May 2022.
Edited by:
Ben W. Kolosz, University of Pennsylvania, United StatesReviewed by:
Rafael Mattos Dos Santos, University of Guelph, CanadaCharithea Charalambous, Heriot-Watt University, United Kingdom
Copyright © 2022 Ganguly, Brown and Wright. This is an open-access article distributed under the terms of the Creative Commons Attribution License (CC BY). The use, distribution or reproduction in other forums is permitted, provided the original author(s) and the copyright owner(s) are credited and that the original publication in this journal is cited, in accordance with accepted academic practice. No use, distribution or reproduction is permitted which does not comply with these terms.
*Correspondence: Mark Mba Wright, markmw@iastate.edu