Carbon Accounting for Enhanced Weathering
 Thorben Amann
 Jens Hartmann
- Institute for Geology, Center for Earth System Sciences and Sustainability, Universität Hamburg, Hamburg, Germany
The inevitable deployment of negative emission technologies requires carbon accounting to incentivise the investment and to foster an active CO2 certificate trading schema. Enhanced Weathering as one of the negative emission technologies is being tested in the field now, but lacks a verifiable and cost-effective carbon accounting approach. Based on results from a lab scale column experiment and field observations, it is hypothesized that the observed stable positive correlation between total alkalinity and electrical conductivity may present a way to easily predict the initial CO2 sequestration at the application site by chemical mineral weathering at low costs. Alkalinity is a measure to track weathering products. It is not difficult to measure, yet continuous and mid- to high-frequency sampling and analyses are expensive and time consuming. The observed strong correlation of alkalinity with electrical conductivity could be harnessed and enable a CO2 uptake monitoring by simple electrical conductivity measurements in soils or any point in the discharge system. For a successful implementation and calibration, data are needed, covering the most likely employment scenarios of soil, climate, hydrology, rock product, application scenario and plant abundance. Incorporated in a growing public database, this could be used as an assessment and benchmark system for future EW deployment.
Introduction
To limit effects of global warming, the 1.5° target was stipulated in the Paris Agreement (United Nations, 2015). By now it is almost impossible to reach the target by mitigation, without the help of negative emission technologies (NET) (Gasser et al., 2015; Sanderson et al., 2016; IPCC, 2018). When these negative emission technologies are integrated in a global carbon emission trading scheme that compensates entities for their costs in carbon capture undertakings, it will be an important issue to monitor, report and verify the removal of CO2 and its permanence (Mclaren, 2012; Brander et al., 2021; Carton et al., 2021). While some methods capture CO2 and create a point source, like Direct Air Capture and Storage (DACS), which makes it easy to quantify the mass of CO2 captured, other methods rely on the diffuse uptake and sequestration of CO2, like afforestation or Enhanced Weathering (EW). Exemplary, afforestation may have an advantage in proving the CO2 uptake by the simple quantification of grown biomass, yet accounting of actual carbon stocks in growing forests includes more, e.g., soil carbon changes and further greenhouse gas emissions (Lefebvre et al., 2021).
The inorganic sequestration of CO2 by EW on the other hand, relies on the natural process of chemical weathering (Ebelmen, 1845), which is, in principle, a well-understood process. To counteract climate change by removal of CO2 from the atmosphere through chemical weathering, the use of rock products was briefly proposed by Seifritz (1990) but made prominent in the climate science community by Schuiling and Krijgsman (2006).
Since, the assessment of a realistic potential of EW as a tool for carbon dioxide removal (CDR) was in the focus of literature reviews (Hartmann and Kempe, 2008; Hartmann et al., 2013), a few laboratory (e.g., Renforth et al., 2015), micro- to mesocosm studies (Ten Berge et al., 2012; Dietzen et al., 2018; Amann et al., 2020), and field trials (e.g., Haque et al., 2020). Globally representative field data coverage for the various combinations of soil, climate, plant abundance, and applied rock source (including rate and quality) is still missing.
Besides the assessment of realistic CDR boundaries of EW under lab or field conditions, it remains an open question of how to track and prove inorganic and organic CO2 removal by EW with cheap and robust methods. Organic carbon captured due to EW application may be assessed by measuring the carbon content in plants and soils. The inorganic CO2 sink in the form of alkalinity (predominantly as ) is determined by the hydrochemistry of percolating waters leaving the soil system. But frequent sampling and analyses in the laboratory is expensive. Reports on co-variation of total alkalinity (TA) and electrical conductivity (EC) (Sechriest, 1960; Bouillon et al., 2014; Proulx et al., 2018) suggest that the EC may be a good predictor for TA under given soil and land use settings, thus rendering it an interesting tool to identify and track the initial CO2 uptake by EW at the application site. Results from EW laboratory column experiments with dunite (rich in olivine), a basaltic rock (rich in nepheline), and a mixture of laterite with the basaltic rock are reviewed in this respect and compared to field data from basaltic catchments as basalt is the proposed rock type for EW. In addition, data from a loess column experiment and loess catchments are discussed as an analogy for natural EW due to the deposition of glacially-derived fine (silty) rock dust. Considered data also contains samples from agricultural catchments with partly elevated nitrate fluxes, which are compared to the silicate material columns and basalt catchments to assess the impact of fertilization on the EC-TA relationship.
Methods
In a small-scale laboratory experiment, multiple columns were filled with varying materials and watered periodically to simulate intensive tropical rainfall (8,000 mm a−1). The columns contained dunite, basaltic rock [basanite, after Streckeisen (1980) and TAS (Total Alkaline Silica) classification (Le Bas et al., 1986)], lateritic soil (oxisol), and a blend of this soil and the basanite. One set of columns was treated under ambient CO2 concentrations (~0.046%) while a second set was put under 100% CO2 atmosphere. Details on the setup and the used materials can be found Supplementary Material S1.
To test the EC-TA relationship, water chemistry data from rivers draining basaltic catchments on Madeira Island, Portugal, and loess dominated catchments in Germany were collected (Supplementary Material S3).
Temperature, pH, and EC of field samples were measured in situ with a handheld multimeter probe (WTW Multimeter 350i). Samples from the lab experiment were measured similarly in the bottles collecting the outflow water.
In the lab, TA was measured by automated titration (Metrohm Titrando) with 0.005 N HCl. Major anions and cations were determined by ion chromatography (Metrohm 881 Compact IC Pro system).
Individual sample tables and more specific method descriptions are given Supplementary Materials S1, S3.
The contributions of ion specific electrical conductivities were calculated using the empirical equations from Mccleskey et al. (2012) after modeling the speciation in each solution with PhreeqC and the phreeqc.dat database (Parkhurst and Appelo, 2013) using the Python package PhreeqPython (Vitens, 2021). Calculated EC (based on available major ion data) is in good agreement with measured EC (Supplementary Figure S4-4).
Linear least squares regressions were calculated using Python and the scipy.stats.linregress function of SciPy (Virtanen et al., 2020). Regression equation and parameters are given in Supplementary Material S5.
Results
With the start of the column experiment, an initial flush of cations and TA can be observed due to the experimental setup, with stabilizing concentrations after 3 weeks (Supplementary Material S2). Looking at the entire experiment phase, including the initial flushing phase, EC correlates very well with TA in most cases (Figure 1). The experiments with laterite and loess showed, at the first glance, no or limited correlation (Figures 1A,D). However, disregarding the initial 21 day flushing phase, the correlations between TA and EC improved markedly, except for dunite under the atmospheric treatment and loess under the extreme scenario with a saturated CO2 treatment, showing relatively constant high TA levels in the leached water from this carbonate rich soil (Figures 1B,D).
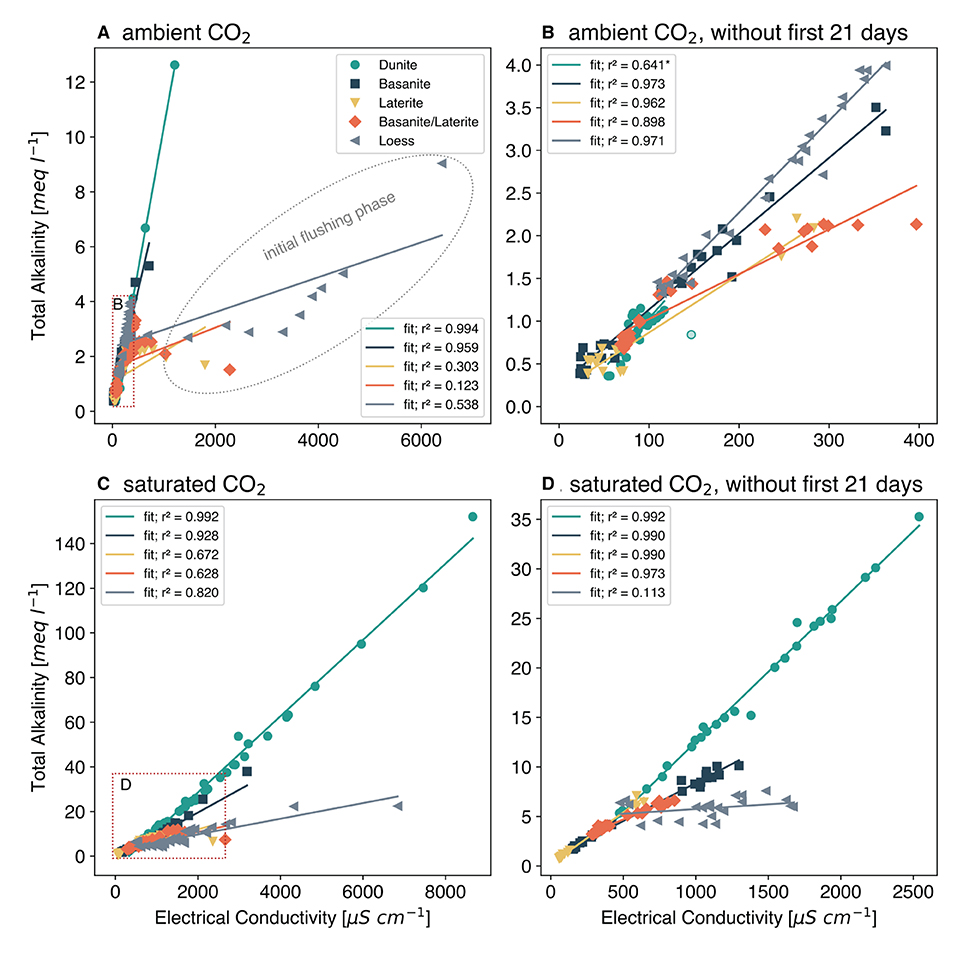
Figure 1. Relationship between alkalinity and electrical conductivity in the outflow of columns which were filled with different rock and soil materials and watered for about 300 days. Data fit: linear least squares fit with the coefficient of determination r2 given in the legend. *One outlier data point (transparent green circle) was removed to calculate this regression. Red rectangles indicate the areas of figures (B,D). (A) Experiment under ambient (~0.046%) CO2. (B) Ambient CO2, without first 21 days. (C) Experiment under saturated (100%) CO2. (D) Saturated CO2, without first 21 days.
Discussion
The relationship between concentrations of TA and EC clearly reflects the underlying physical principle, that all elements dissolved in the water carry an electrical current which can be put into relation with the TA, sensu stricto the carbonate alkalinity, i.e., equivalent concentrations of and , produced during the chemical weathering and dissolution of rock material. This linkage is known and utilized in the characterization of natural waters (Sechriest, 1960; Krawczyk and Ford, 2006; Thompson et al., 2012; Proulx et al., 2018). Other processes like respiration and nitrification may influence the TA but not the carbonate alkalinity. As such TA is a sum parameter that is most likely dominated by bicarbonate, but may, especially in agricultural settings, be manipulated by fertilizer addition.
Co-variation between TA and dominating cations are causing the clear relationship between TA levels and EC. This effect points toward a potential method to track and report site-specific CO2 consumption rates. Carbon accounting is important when it comes to the field application of NETs (Brander et al., 2021), as it provides a base for comparison between methods. As for EW, the use of established methods should allow for the settlement and validation of pay-outs within a CO2 certification scheme (Hartmann and Kempe, 2008; Peters and Geden, 2017), which is required to incentivise negative emission approaches (Peters and Geden, 2017).
Each of the released ions contributes specifically to the overall EC of a solution (Gustafson and Behrman, 1939) based on its specific ionic molar conductivity. The ionic composition of water draining the columns creates an individual EC signal (e.g., Pawlowicz, 2008). This explains the slope differences in the regression lines of TA and EC because the column material compositions and resulting chemical composition of the draining waters are different. The higher r2 of the saturated CO2 setups (except for loess) are the effect of overall higher TA generated and accompanying released cations, resulting in higher EC values assuming that measurement errors and individual fluctuations remain constant. Because the water addition to columns was constant with time the slope of TA-EC relationship represents predominantly the evolution of the system with time, as can be seen by the TA-concentration change during the experiments (Supplementary Figure S2-1).
The column experiments had idealized properties with intensive watering, to simulate extreme conditions. To test if the TA-EC-relationship is also observable in field data more comparable to EW application sites, exemplary waters of basaltic and loess catchments were evaluated. The contribution of bicarbonate (as the major component of TA) to EC can be high - in the selected samples around 30% (Figure 2D). Therefore, the deduction of TA from EC should be possible if released cations (by EW) covary with TA, adding proportionally to the added EC. This is further corroborated by observations from a field trial in which wollastonite (CaSiO3) rock flour was spread on a controlled forested watershed (Peters et al., 2004), basically simulating EW application. Here, EC and TA signals clearly increase after the onset of the experiment (Figures 2A,B) and the modeled contribution of bicarbonate to overall EC increases notably (Figure 2C). As the draining waters from this watershed are naturally very low in TA (around zero in the control watershed, Figure 2B), the observed signal is pinpointed to the wollastonite application.
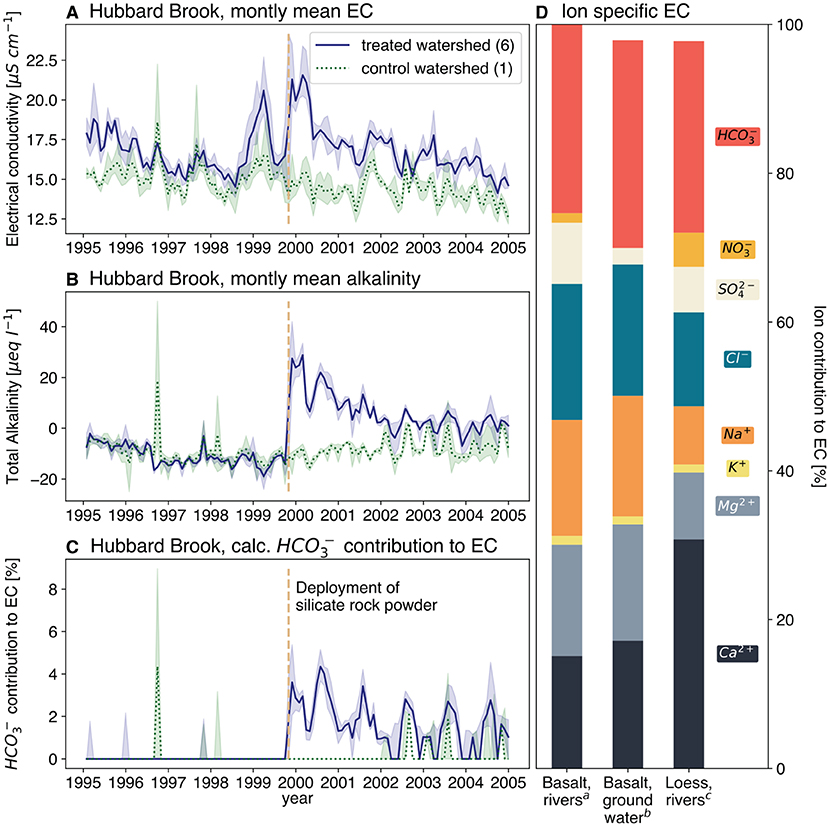
Figure 2. Selective time series of two Hubbard Brook experimental forest watershed (Likens, 2017), watershed 1 data as control baseline (dotted, green) and watershed 6 data representing effects of silicate rock powder spreading (solid, blue): monthly mean and 10 and 90 percentiles for electrical conductivity (A), total alkalinity (B) and the calculated contribution to the electrical conductivity (C); Individual ionic conductivity contributions to overall electrical conductivity, mean values (D), individual sample results, can be found in Supplementary Material S4. adata from rivers of Madeira island, collected by the authors; bdata from Van Der Weijden and Pacheco (2003); cdata from rivers of a loess dominated catchment in Germany, collected by the authors.
From these data, the link between TA and EC can be well-demonstrated (Figure 3A), with a clear, yet low r2 of 0.531, probably due to the unique composition of the waters, with very low conductivities and near zero TA at the start. Here, the abundance of organic acids, sulfate and nitrate in the watershed, partly lead to dissolution of rock material without TA generation (Taylor et al., 2021). Furthermore, under such low TA conditions slight absolute variations have a high relative impact on the coefficient of determination. As the higher TA values indicate, the correlation might become stronger, if the baseline level of TA and therefore EC would be elevated for longer times (in the case of the Hubbard Brook experiment, treated and control values converge because of the one-time deployment of rock dust).
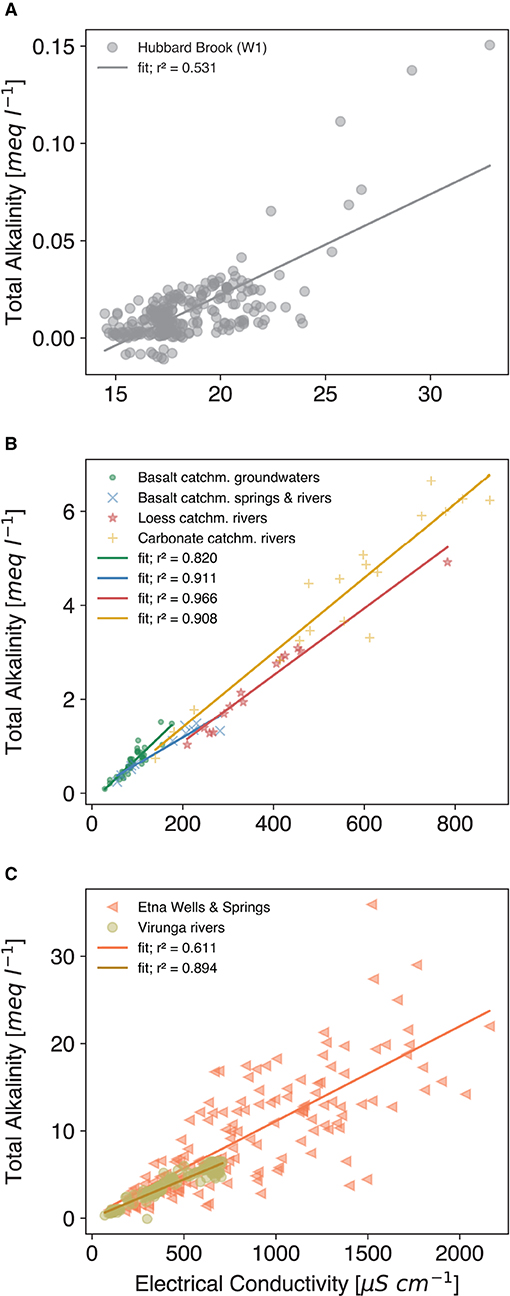
Figure 3. Data fit: linear least squares fit with the coefficient of determination r2 given in the legend. Regression parameters are provided in Supplementary Material S5. (A) Data from Likens (2017) for watershed 1 of the Hubbard Brook experimental forest, which was amended with wollastonite rock flour, considered period from 1999-10-24 to 2004-10-24, cf. Figures 2A–C; (B) Groundwater data from Van Der Weijden and Pacheco (2003) (green dot); Observations from river water and springs from basaltic catchments on Madeira island (blue x); river water data from a loess dominated catchment in central Germany (see Methods section) (red *); averaged river water data from Perrin et al. (2008) from the calcareous molassic Gascogne area located in the Garonne river basin (south-western France) (yellow +); (C) Data from active volcanoes: water from wells and springs of the Etna, Italy (Brusca et al., 2001) (red triangles); Virunga National Park, Kongo: river water from basaltic catchments (Balagizi et al., 2015) (brown circles).
Basalt is a material more recently discussed for EW application (e.g., Beerling et al., 2018; Amann and Hartmann, 2019). Therefore, ground- and river water samples from catchments in Madeira, a basaltic volcanic island (Gardner, 1882), were tested for the TA-EC relationship, with a distinctly positive result (Figure 3B). Loess as a very reactive material, here considered as a natural EW analog, supports the TA-EC correlation hypothesis, too (Figure 3B). Even in watersheds with elevated nitrate levels due to agriculture, the relationship is maintained (Loess and carbonate catchment rivers in Figure 3B) and NO3 is not conclusively impacting EC (Figure 4A). Measurements from highly active volcanic systems with fresh mafic to ultramafic material (Virunga and Etna volcanic systems) also confirm the relationship (Figure 3C). However, groundwater data of the Etna area are more scattered, likely due to the influence of acidic volcanic gases, which would not be present in regular EW application scenarios on agricultural or forested land. In summary, the field data results corroborate the findings from the column experiment (Figure 1).
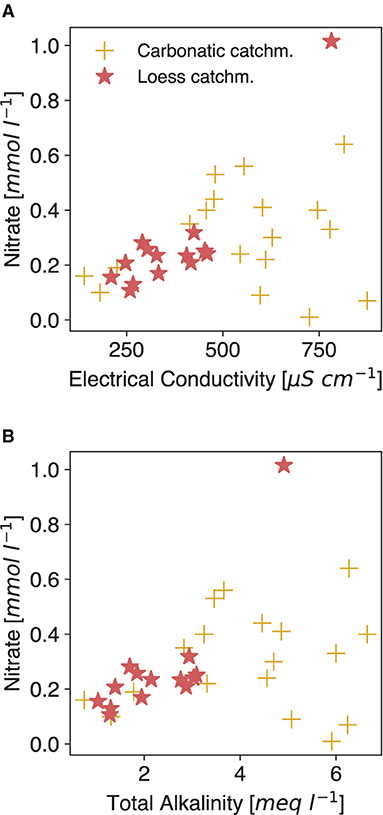
Figure 4. Relation between nitrate and electrical conductivity (A) and total alkalinity (B). Data from rivers draining carbonatic catchments from Perrin et al. (2008) and loess catchment data as in Figure 3B. Both datasets contain water from catchments which are influenced by agricultural activities.
From these observations, it is suggested that EC is a promising proxy for tracking EW related inorganic CO2 consumption via TA production. The slope differences of the regression lines from the TA-EC relationship of the different treatments in the lab experiment as well in the field observations suggest that no generalized equation could be derived to be used in a carbon accounting scheme. However, after an initial calibration period, easily to perform EC measurements may enable local farmers to track and report CO2 consumption based on EC measurements in water from their individual land, with an uncertainty, which might be averaged for specific conditions over a larger area of land. Because catchment runoff is possibly underestimating the TA produced by EW, as some TA remains in the soil and groundwater for a longer time, soil bulk EC might be used to more precisely track EC increases, as it is right within the application area.
Water EC from streams is different to interpret than soil bulk EC, as latter is naturally impacted by a plethora of factors (Corwin and Lesch, 2005), which are not necessarily connected with TA in the first instance. As such, changes in those independent factors must be closely monitored and evaluated to single out the weathering signal. EC might be most prominently influenced by periodical fertilization, which adds ions that don't contribute to TA (Phong et al., 2020). These fertilizers may alter the slope of the TA-EC relationship temporarily, as they can consist of compounds that release ions, which do not change TA (like K+ and Cl− from muriate of potash (MOP), a commonly applied K fertilizer). Looking at N fertilizer, in the data at hand, the elevated nitrate levels are not clearly related to EC, nor is there a negative tendency with TA (Figure 4), even though the data contains waters from agriculturally impacted areas. The specific molar conductivity of fertilizer-released compounds (, , Cl−) is not distinctly high (Adamson, 1979) but spikes from the periodic application of fast dissolving fertilizer could alter the signal temporarily. Transformation processes like (de-)nitrification can alter the TA in soil solution (Gandois et al., 2011), without changing the EC in the same proportion. As an additional effect, fertilizer dissolution can lead to the formation of strong acids, which dissolve added rock material (Perrin et al., 2008; Pierson-Wickmann et al., 2009) without increasing TA. Intense rain events may also lead to a wash-out effect marked by nitrate peaks, which level out within a few days (Ferrant et al., 2013).
Once the likely additional sources and sinks for TA and impacts on EC are identified, a correction function could be applied, as the influencing factors should be rather controllable on a well-defined agricultural soil under standardized agricultural practices. Exemplary, a study on weathering of the Aso caldera, Japan, with intensive rice agriculture revealed low nitrate loads (average: 0.03 mmol l−1), probably due to optimized application procedures (Hosono et al., 2018). In EW application areas not impacted by agricultural activities and with human interferences at a minimum, like tropical hinterland as discussed in Goll et al. (2021), the aforementioned influences should be low and as such, EC less impacted by anthropogenic activities. Here the measurement of EC changes may be an even more reliable approach to monitor CO2 uptake.
At the catchment scale, EC measurements using low-cost equipment is possible (e.g., Hund et al., 2016). This method requires a sampling point which represents the catchment outflow, and thus the water draining the rock flour amended land. This approach may prove to be difficult as individual fields may not have confined catchments with controlled outflow, yet the signal should also be visible in the greater discharge system and could be measured there. Alternatively, in a more detailed approach, EC sensors could be buried in the field (Scudiero et al., 2012), tracking the percolating soil solution. In this case further model development is needed, as soil bulk EC depends also on soil humidity and other physical properties and is therefore different from EC measured in sample water. The relationship between both parameters needs to be used to calibrate functions for TA production by EW in the soil system. This requires further research, before soil bulk EC might be used as a proxy for and therefore its use as a carbon accounting tool.
As the technology for soil bulk EC and humidity monitoring to track agricultural productivity is already available (Noborio, 2001; Kitchen et al., 2003; Fortes et al., 2014; Akanji et al., 2018), it could be used for CDR accounting without additional investment costs. Newer developments suggest the use of simple easy-to-deploy EC probes to monitor soil conditions in smart and precision farming applications (Othaman et al., 2020). With this, the transfer of data from field to user via wireless networks is possible (Citoni et al., 2019; Terence and Purushothaman, 2020). This provides perspectives for the remote monitoring of EW and achieved carbon sequestration.
As carbon sequestration must be tracked and verified for carbon accounting, simple and cost-efficient physical measurement of waters draining the treated areas is necessary ensure sustained monitoring. The application of one technique for two purposes would therefore create a win-win-situation.
The TA prediction approach described here, would not account for carbon bound in precipitated carbonate minerals as particulate inorganic carbon (PIC) in the soil system. To account for this carbon fraction, additional soil PIC analyses would be necessary, which could be done during mandatory or cross compliance routine sampling for soil quality monitoring (i.e., based on the framework of common agricultural policy of the EU).
In addition to the CDR purpose, the application of rock products was much earlier suggested to improve soil conditions for agricultural production (Missoux, 1853; Leonardos et al., 1987; Van Straaten, 2002). Improved biomass growth leads to additional CO2 uptake and storage as organic carbon, propelling the overall CDR potential of EW (Amann and Hartmann, 2019; Goll et al., 2021). This effect would necessitate an additional tracking of yield/biomass increases to account for the complete CO2 sequestration potential of EW. Current techniques of remote plant monitoring for carbon accounting in above ground biomass would add to a scenario, in which the additional organic carbon sequestration path of EW could be tracked and monitored remotely.
Conclusion
Proper accounting for deliberate carbon sequestration is inevitable. All CDR methods have to solve this issue before entering the emission trading market. Experimental studies show that the weathering signal can be tracked well in confined column setups by measuring outflow cation concentrations (Renforth et al., 2015; Amann et al., 2020; Kelland et al., 2020). Yet it remains an open question how the signal can be tracked reliably in the field and how the CO2 uptake can be quantified with low-cost and robust methods.
To provide a means of monitoring the initial CO2 drawdown at the application site, we propose a deeper investigation into the use of EC measurements to derive TA levels which indicate CO2 sequestration. Data from a lab experiment and selected natural waters support the approach by showing very clear relationships between EC and TA.
It remains to be investigated how this new approach of carbon accounting can be implemented in the field. Practical issues to be solved are sensor placement in the ground and calibration, considering seasonal variability of soil humidity, and the application of fertilizer or other soil amendments which might affect the EC.
The general caveat of the described approach is that the tracking of EC in waters from agricultural land represents only the initial uptake of CO2 from the atmosphere. Downstream processes in groundwater, rivers, and the ocean are not covered by the proposed approach and require separate recognition.
Globally representative field data covering various combinations of soil, climate, plant abundance and applied rock source (including rate and quality) would be needed to create a framework for easy implementation of a functional carbon accounting scheme after testing and verification. Ideally, a global database for case scenarios is established, fostering business models for farmers. A high-quality monitoring database covering typical application scenarios may enable a reliable pre-application assessment of the efficiency, based on standardized conditions delivering a reliable, statistically grounded base reference of the amount of CO2 transferred to alkalinity.
Ideally, a set of coordinated global field campaigns will provide these data, so that low-cost conductivity and humidity measurements can replace more expensive hydrochemical sampling and analysis of CO2 consumption by EW.
The approach to remove CO2, monitor, and verify (RMV) must be simple, robust, cost-efficient, and reproducible. As such, applicability of EW for CDR could benefit from the expanding remote sensor utilization.
Data Availability Statement
The original contributions presented in the study are included in the article/Supplementary Material, further inquiries can be directed to the corresponding author/s.
Author Contributions
TA and JH conceived the study design and wrote the text. Both authors contributed to the article and approved the submitted version.
Funding
This work was funded by Germany's Excellence Strategy – EXC 2037 ‘Climate, Climatic Change, and Society’ – project number 390683824, contribution to the Center for Earth System Research and Sustainability (CEN) of Universität Hamburg.
Conflict of Interest
The authors declare that the research was conducted in the absence of any commercial or financial relationships that could be construed as a potential conflict of interest.
Publisher's Note
All claims expressed in this article are solely those of the authors and do not necessarily represent those of their affiliated organizations, or those of the publisher, the editors and the reviewers. Any product that may be evaluated in this article, or claim that may be made by its manufacturer, is not guaranteed or endorsed by the publisher.
Acknowledgments
We acknowledge the help of Tom Jäppinen, Peggy Bartsch, Aman Malik, Rhiannon Breider, Mark Brosell, Marvin Keitzel, Eric Marques, and Walid Karimi for valuable contributions from the wet lab. We thank the Carbon Drawdown Initiative (Project Carbdown) for fruitful discussions and support around the need for carbon accounting methods.
Supplementary Material
The Supplementary Material for this article can be found online at: https://www.frontiersin.org/articles/10.3389/fclim.2022.849948/full#supplementary-material
References
Adamson, A. W. (1979). A Textbook of Physical Chemistry. New York, NY; San Francisco, CA: Academic Press.
Akanji, M. A., Oshunsanya, S. O., and Alomran, A. (2018). Electrical conductivity method for predicting yields of two yam (Dioscorea alata) cultivars in a coarse textured soil. Int. Soil Water Conserv. Res. 6, 230–236. doi: 10.1016/j.iswcr.2018.03.006
Amann, T., and Hartmann, J. (2019). Ideas and perspectives: synergies from co-deployment of negative emission technologies. Biogeosciences 16, 2949–2960. doi: 10.5194/bg-16-2949-2019
Amann, T., Hartmann, J., Struyf, E., De Oliveira Garcia, W., Fischer, E. K., Janssens, I., et al. (2020). Enhanced Weathering and related element fluxes – a cropland mesocosm approach. Biogeosciences 17, 103–119. doi: 10.5194/bg-17-103-2020
Balagizi, C. M., Darchambeau, F., Bouillon, S., Yalire, M. M., Lambert, T., and Borges, A. V. (2015). River geochemistry, chemical weathering, and atmospheric CO2consumption rates in the Virunga Volcanic Province (East Africa). Geochem. Geophys. Geosyst. 16, 2637–2660. doi: 10.1002/2015GC005999
Beerling, D. J., Leake, J. R., Long, S. P., Scholes, J. D., Ton, J., Nelson, P. N., et al. (2018). Farming with crops and rocks to address global climate, food and soil security. Nat Plants. 4, 138–147. doi: 10.1038/s41477-018-0108-y
Bouillon, S., Yambele, A., Gillikin, D. P., Teodoru, C., Darchambeau, F., Lambert, T., et al. (2014). Contrasting biogeochemical characteristics of the Oubangui River and tributaries (Congo River basin). Sci. Rep. 4, 5402. doi: 10.1038/srep05402
Brander, M., Ascui, F., Scott, V., and Tett, S. (2021). Carbon accounting for negative emissions technologies. Clim. Policy. 21, 1–19. doi: 10.1080/14693062.2021.1878009
Brusca, L., Aiuppa, A., D'alessandro, W., Parello, F., Allard, P., and Michel, A. (2001). Geochemical mapping of magmatic gas-water-rock interactions in the aquifer of Mount Etna volcano. J. Volcanol. Geothermal Res. 108, 199–218. doi: 10.1016/S0377-0273(00)00286-9
Carton, W., Lund, J. F., and Dooley, K. (2021). Undoing equivalence: rethinking carbon accounting for just carbon removal. Front. Clim. 3, 664130. doi: 10.3389/fclim.2021.664130
Citoni, B., Fioranelli, F., Imran, M. A., and Abbasi, Q. H. (2019). Internet of things and LoRaWAN-enabled future smart farming. IEEE Int. Things Mag. 2, 14–19. doi: 10.1109/IOTM.0001.1900043
Corwin, D. L., and Lesch, S. M. (2005). Apparent soil electrical conductivity measurements in agriculture. Comp. Electron. Agric. 46, 11–43. doi: 10.1016/j.compag.2004.10.005
Dietzen, C., Harrison, R., and Michelsen-Correa, S. (2018). Effectiveness of enhanced mineral weathering as a carbon sequestration tool and alternative to agricultural lime: an incubation experiment. Int. J. Greenhouse Gas Control 74, 251–258. doi: 10.1016/j.ijggc.2018.05.007
Ebelmen, J. J. (1845). Sur les produits de la décomposition des espèces minérales de la famille des silicates. Paris: Carilian-G.ury et Vor Dalmont, Libraires des Corps Royaux des Ponts et Chausees et dus Mines.
Ferrant, S., Laplanche, C., Durbe, G., Probst, A., Dugast, P., Durand, P., et al. (2013). Continuous measurement of nitrate concentration in a highly event-responsive agricultural catchment in south-west of France: is the gain of information useful? Hydrol. Process. 27, 1751–1763. doi: 10.1002/hyp.9324
Fortes, R., Prieto, M. H., Terron, J. M., Blanco, J., Millan, S., and Campillo, C. (2014). Using apparent electric conductivity and Ndvi measurements for yield estimation of processing tomato crop. Transact. Asabe 57, 827–835. doi: 10.13031/trans.57.10456
Gandois, L., Perrin, A.-S., and Probst, A. (2011). Impact of nitrogenous fertiliser-induced proton release on cultivated soils with contrasting carbonate contents: a column experiment. Geochim. Cosmochim. Acta 75, 1185–1198. doi: 10.1016/j.gca.2010.11.025
Gardner, J. S. (1882). The geology of madeira. Q. J. Geol. Soc. 38, 277–281. doi: 10.1144/GSL.JGS.1882.038.01-04.30
Gasser, T., Guivarch, C., Tachiiri, K., Jones, C. D., and Ciais, P. (2015). Negative emissions physically needed to keep global warming below 2°C. Nat. Commun. 6, 7958. doi: 10.1038/ncomms8958
Goll, D. S., Ciais, P., Amann, T., Buermann, W., Chang, J., Eker, S., et al. (2021). Potential CO2 removal from enhanced weathering by ecosystem responses to powdered rock. Nat. Geosci. 14, 545–549. doi: 10.1038/s41561-021-00798-x
Gustafson, H., and Behrman, A. S. (1939). Determination of total dissolved solids in water by electrical conductivity. Ind. Eng. Chem. Anal. Ed. 11, 355–357. doi: 10.1021/ac50135a001
Haque, F., Santos, R. M., and Chiang, Y. W. (2020). CO2 sequestration by wollastonite-amended agricultural soils – An Ontario field study. Int. J. Greenhouse Gas Control 97:103017. doi: 10.1016/j.ijggc.2020.103017
Hartmann, J., and Kempe, S. (2008). What is the maximum potential for CO(2) sequestration by “stimulated” weathering on the global scale? Naturwissenschaften 95, 1159–1164. doi: 10.1007/s00114-008-0434-4
Hartmann, J., West, A. J., Renforth, P., Köhler, P., De La Rocha, C. L., Wolf-Gladrow, D. A., et al. (2013). Enhanced chemical weathering as a geoengineering strategy to reduce atmospheric carbon dioxide, supply nutrients, and mitigate ocean acidification. Rev. Geophys. 51, 113–149. doi: 10.1002/rog.20004
Hosono, T., Hartmann, J., Louvat, P., Amann, T., Washington, K. E., West, A. J., et al. (2018). Earthquake-induced structural deformations enhance long-term solute fluxes from active volcanic systems. Sci. Rep. 8, 14809. doi: 10.1038/s41598-018-32735-1
Hund, S. V., Johnson, M. S., and Keddie, T. (2016). Developing a hydrologic monitoring network in data-scarce regions using open-source arduino dataloggers. Agric. Environ. Lett. 1:160011. doi: 10.2134/ael2016.02.0011
IPCC. (2018). “Global warming of 1.5°C,” in An IPCC Special Report on the Impacts of Global Warming of 1.5°C Above Pre-Industrial Levels and Related Global Greenhouse Gas Emission Pathways, in the Context of Strengthening the Global Response to the Threat of Climate Change, Sustainable Development, and Efforts to Eradicate Poverty, eds V. Masson-Delmotte, P. Zhai, H. -O. Pörtner, D. Roberts, J. Skea, P. R. Shukla, A. Pirani, W. Moufouma-Okia, C. Péan, R. Pidcock, S. Connors, J. B. R. Matthews, Y. Chen, X. Zhou, M. I. Gomis, E. Lonnoy, T. Maycock, M. Tignor, and T. Waterfield. [In Press].
Kelland, M. E., Wade, P. W., Lewis, A. L., Taylor, L. L., Sarkar, B., Andrews, M. G., et al. (2020). Increased yield and CO2 sequestration potential with the C4 cereal Sorghum bicolor cultivated in basaltic rock dust-amended agricultural soil. Glob. Chang. Biol. 26, 3658–3676. doi: 10.1111/gcb.15089
Kitchen, N. R., Drummond, S. T., Lund, E. D., Sudduth, K. A., and Buchleiter, G. W. (2003). Soil electrical conductivity and topography related to yield for three contrasting soil-crop systems. Agron. J. 95, 483–495. doi: 10.2134/agronj2003.4830
Krawczyk, W. E., and Ford, D. C. (2006). Correlating specific conductivity with total hardness in limestone and dolomite karst waters. Earth Surf. Process. Landforms 31, 221–234. doi: 10.1002/esp.1232
Le Bas, M. J., Maitre, R. W. L., Streckeisen, A., and Zanettin, B. (1986). A chemical classification of volcanic rocks based on the total alkali-silica diagram. J. Petrol. 27, 745–750. doi: 10.1093/petrology/27.3.745
Lefebvre, D., Williams, A. G., Kirk, G. J. D., Paul Burgess, J., Meersmans, J., Silman, M. R., et al. (2021). Assessing the carbon capture potential of a reforestation project. Sci. Rep. 11, 19907. doi: 10.1038/s41598-021-99395-6
Leonardos, O. H., Fyfe, W. S., and Kronberg, B. I. (1987). The use of ground rocks in laterite systems: an improvement to the use of conventional soluble fertilizers? Chem. Geol. 60, 361–370. doi: 10.1016/0009-2541(87)90143-4
Likens, G. E. (2017). Fifty years of continuous precipitation and stream chemistry data from the Hubbard Brook ecosystem study (1963-2013). Ecology 98, 2224. doi: 10.1002/ecy.1894
Mccleskey, R. B., Nordstrom, D. K., Ryan, J. N., and Ball, J. W. (2012). A new method of calculating electrical conductivity with applications to natural waters. Geochim. Cosmochim. Acta 77, 369–382. doi: 10.1016/j.gca.2011.10.031
Mclaren, D. (2012). A comparative global assessment of potential negative emissions technologies. Process Saf. Environ. Protect. 90, 489–500. doi: 10.1016/j.psep.2012.10.005
Missoux, M. (1853). Sur l'emploi de la poudre des roches granitiques comme excitant de la vegetation. Compt. Rend. Acad. Sci. 36, 1136.
Noborio, K. (2001). Measurement of soil water content and electrical conductivity by time domain reflectometry: a review. Comp. Electron. Agric. 31, 213–237. doi: 10.1016/S0168-1699(00)00184-8
Othaman, N. N. C., Isa, M. N. M., Ismail, R. C., Ahmad, M. I., and Hui, C. K. (2020). “Factors that affect soil electrical conductivity (EC) based system for smart farming application,” in The 2nd International Conference on Applied Photonics and Electronics 2019 (InCAPE 2019).
Parkhurst, D. L., and Appelo, C. A. J. (2013). “Description of input and examples for PHREEQC version 3—A computer program for speciation, batch-reaction, one-dimensional transport, and inverse geochemical calculations,” in U. S. Geological Survey Techniques and Methods. U.S. Geological Survey.
Pawlowicz, R. (2008). Calculating the conductivity of natural waters. Limnol. Oceanogr. Methods 6, 489–501. doi: 10.4319/lom.2008.6.489
Perrin, A.-S., Probst, A., and Probst, J.-L. (2008). Impact of nitrogenous fertilizers on carbonate dissolution in small agricultural catchments: implications for weathering CO2 uptake at regional and global scales. Geochim. Cosmochim. Acta 72, 3105–3123. doi: 10.1016/j.gca.2008.04.011
Peters, G. P., and Geden, O. (2017). Catalysing a political shift from low to negative carbon. Nat. Clim. Chang. 7, 619–621. doi: 10.1038/nclimate3369
Peters, S. C., Blum, J. D., Driscoll, C. T., and Likens, G. E. (2004). Dissolution of wollastonite during the experimental manipulation of hubbard brook watershed 1. Biogeochemistry 67, 309–329. doi: 10.1023/B:BIOG.0000015787.44175.3f
Phong, P. H., Anh, P. B. V., Ha, V. T. T., Hung, L. Q., and Thanh, L. M. (2020). Simulating and monitoring the temporal and spatial transfer of NPK Fertilizer In Agricultural Soils Using A Mathematical Model And Multi-Channel Electrical Conductivity Measurement. J. Soil Sci. Plant Nutr. 21, 374–388. doi: 10.1007/s42729-020-00367-y
Pierson-Wickmann, A. C., Aquilina, L., Martin, C., Ruiz, L., Molénat, J., Jaffrézic, A., et al. (2009). High chemical weathering rates in first-order granitic catchments induced by agricultural stress. Chem. Geol. 265, 369–380. doi: 10.1016/j.chemgeo.2009.04.014
Proulx, C. L., Kilgour, B. W., Francis, A. P., Bouwhuis, R. F., and Hill, J. R. (2018). Using a conductivity–alkalinity relationship as a tool to identify surface waters in reference condition across Canada. Water Qual. Res. J. 53, 231–240. doi: 10.2166/wqrj.2018.030
Renforth, P., Pogge Von Strandmann, P. A. E., and Henderson, G. M. (2015). The dissolution of olivine added to soil: implications for enhanced weathering. Appl. Geochem. 61, 109–118. doi: 10.1016/j.apgeochem.2015.05.016
Sanderson, B. M., O'neill, B. C., and Tebaldi, C. (2016). What would it take to achieve the Paris temperature targets? Geophys. Res. Lett. 43, 7133–7142. doi: 10.1002/2016GL069563
Schuiling, R. D., and Krijgsman, P. (2006). Enhanced weathering: an effective and cheap tool to sequester CO2. Clim. Change 74, 349–354. doi: 10.1007/s10584-005-3485-y
Scudiero, E., Berti, A., Teatini, P., and Morari, F. (2012). Simultaneous monitoring of soil water content and salinity with a low-cost capacitance-resistance probe. Sensors 12, 17588–17607. doi: 10.3390/s121217588
Sechriest, R. E. (1960). Relationship between total alkalinity, conductivity, original pH, and buffer action of natural water. Ohio J. Sci. 60, 303–308.
Streckeisen, A. (1980). Classification and nomenclature of volcanic rocks, lamprophyres, carbonatites and melilitic rocks IUGS subcommission on the systematics of igneous rocks. Geol. Rundschau 69, 194–207. doi: 10.1007/BF01869032
Taylor, L. L., Driscoll, C. T., Groffman, P. M., Rau, G. H., Blum, J. D., and Beerling, D. J. (2021). Increased carbon capture by a silicate-treated forested watershed affected by acid deposition. Biogeosciences 18, 169–188. doi: 10.5194/bg-18-169-2021
Ten Berge, H. F. M., Van Der Meer, H. G., Steenhuizen, J. W., Goedhart, P. W., Knops, P., and Verhagen, J. (2012). Olivine weathering in soil, and its effects on growth and nutrient uptake in ryegrass Lolium perenne L.: a pot experiment. PLoS ONE 7, e42098. doi: 10.1371/journal.pone.0042098
Terence, S., and Purushothaman, G. (2020). Systematic review of Internet of Things in smart farming. Transact. Emerg. Telecommun. Technol. 31:e3958. doi: 10.1002/ett.3958
Thompson, M. Y., Brandes, D., and Kney, A. D. (2012). Using electronic conductivity and hardness data for rapid assessment of stream water quality. J. Environ. Manage. 104, 152–157. doi: 10.1016/j.jenvman.2012.03.025
Van Der Weijden, C. H., and Pacheco, F. A. L. (2003). Hydrochemistry, weathering and weathering rates on Madeira island. J. Hydrol. 283, 122–145. doi: 10.1016/S0022-1694(03)00245-2
Van Straaten, P. (2002). Rocks for Crops: Agrominerals of sub-Saharan Africa. Nairobi, Kenya: ICRAF.
Virtanen, P., Gommers, R., Oliphant, T. E., Haberland, M., Reddy, T., Cournapeau, D., et al. (2020). SciPy 1.0: fundamental algorithms for scientific computing in Python. Nat. Methods 17, 261–272. doi: 10.1038/s41592-019-0686-2
Vitens (2021). PhreeqPython. Available online at: https://github.com/Vitens/phreeqpython (accessed December 15, 2021).
Keywords: CO2, carbon dioxide removal, carbon accounting, negative emissions, enhanced weathering, climate change
Citation: Amann T and Hartmann J (2022) Carbon Accounting for Enhanced Weathering. Front. Clim. 4:849948. doi: 10.3389/fclim.2022.849948
Received: 06 January 2022; Accepted: 21 March 2022;
Published: 05 May 2022.
Edited by:
Keith Paustian, Colorado State University, United StatesReviewed by:
Grace Andrews, University of Southampton, United KingdomCurtis Monger, New Mexico State University, United States
Copyright © 2022 Amann and Hartmann. This is an open-access article distributed under the terms of the Creative Commons Attribution License (CC BY). The use, distribution or reproduction in other forums is permitted, provided the original author(s) and the copyright owner(s) are credited and that the original publication in this journal is cited, in accordance with accepted academic practice. No use, distribution or reproduction is permitted which does not comply with these terms.
*Correspondence: Thorben Amann, science@thorbenamann.de
†ORCID: Thorben Amann orcid.org/0000-0001-9347-0615
Jens Hartmann orcid.org/0000-0003-1878-9321