The Nationally Determined Contribution Expert Tool (NEXT): A Comprehensive Greenhouse Gas Accounting Tool to Support Annual Environmental Impact Assessment Over a 30-Year Time Series in the Agriculture, Forestry and Other Land Use Sector
 Laure-Sophie Schiettecatte
 Philip Audebert2
  Martial Bernoux
- 1Food and Agriculture Organization of the United Nations, Rome, Italy
- 2International Fund for Agricultural Development, Rome, Italy
The Nationally Determined Contribution Expert Tool (NEXT) is a greenhouse gas accounting tool developed by the Food and Agriculture Organization of the United Nations (FAO) to support annual environmental impact assessment for the Agriculture, Forestry and Other Land Use sector (AFOLU). It provides a 30-year time series of annual and cumulated estimates of carbon removal and greenhouse gas emission reductions from actions determined by Parties in their climate policies. NEXT was developed using the Intergovernmental Panel on Climate Change (IPCC) methodologies, and estimates can be made using either the IPCC 2006 guidelines or the IPCC 2019 refinement to the IPCC 2006 which are both complemented with the IPCC 2013 Wetlands Supplement. The tool was designed to provide results that directly respond to the provisions of the Enhanced Transparency Framework and support the Nationally Determined Contributions (NDC) development as required by the modalities, procedures and guidelines. NEXT provides a detailed temporal series of results and a wide set of indicators, including the social value of carbon, enabling a comprehensive environmental and economic overview of climate actions in achieving mitigation targets. The tool helps countries to interpret, track and scale up ambition of their NDCs which could ultimately inform the global stocktake of the Paris Agreement in a harmonized way.
Introduction
In 2015, at the 21st Conference of the Parties (COP) to the United Nations Framework Convention on Climate Change (UNFCCC), the adoption of the Paris Agreement (PA) brought together developed and developing nations in a common cause to undertake ambitious efforts to combat climate change and adapt to its effects. Based on their national circumstances, priorities and historical responsibilities, each Party made a commitment to address its national greenhouse gas (GHG) emissions, possibly from all economic sectors, enhance removals, and adapt to the impacts of climate change as part of a global effort to tackle climate change. Their commitments are engraved in the Nationally Determined Contributions (NDCs) which have to be revised and strengthened every 5 years starting from 2020 on the basis of their respective mitigation and adaptation plans (article 4.3 of the PA). NDCs are one element of reporting to the UNFCCC, under the Enhanced Transparency Framework (ETF), which was designed to “provide a clear understanding of climate actions in the light of the objective of the Convention […] including clarity and tracking of progress toward achieving Parties' NDC […], and Parties' adaptation actions under Article 7, including good practices, priorities, needs and gaps, to inform the global stocktake under Article 14”, (article 13, paragraph 5). The ETF arrangements include “national communications, biennial reports and biennial update reports, international assessment and review and international consultation and analysis” (article 13, paragraph 4), which are submitted to the UNFCCC every 2 to 5 years according to their cycle and national capacities. To better frame the efforts toward the long-term goal, the PA encouraged countries to formulate their long-term low greenhouse gas emission development strategies (LT-LEDS) (Article 4, paragraph 19) (UNFCCC, 2022a). LT-LEDS provide the long-term horizon for NDCs, but unlike NDCs, they are not mandatory.
While extreme climatic events around the world are increasingly causing crop failure, dramatic human losses, displacement of thousands of people and severe economic losses (IPCC, 2022), global GHG emissions have been rising since 2015 despite strengthened international efforts. In 2018, the report from the Intergovernmental Panel on Climate Change (IPCC) on 1.5°C (IPCC, 2018) was a stark warning that global GHG emissions need to reach net-zero by 2050 to avoid catastrophic impacts from climate change. With the first part of the 6th assessment report (IPCC, 2021) published before the COP 26 in Glasgow, the IPCC warned of a red code for humanity. The Earth's surface has already warmed by 1.1°C compared to pre-industrial levels, and unless immediate, rapid and large-scale reductions in GHG emissions are undertaken, the goal to limit global warming to 2°C, let alone 1.5°C, will be beyond reach.
In 2021, Parties were invited to submit their revised and enhanced NDCs. Yet, the new set of mitigation pledges, expressed as unconditional and conditional contributions, is seen as insufficient to achieve the GHG emission reductions objectives by 2030 and the PA's temperature goals by mid-century (UNEP, 2021; UNFCCC, 2021). Current GHG emissions are 13.7 percent above 2010 levels (UNFCCC, 2022b) and new unconditional contributions would only lead to an emission reduction of 7.5 percent in 2030, which is far off the 30 percent and 55 percent needed for 2 and 1.5°C, respectively (UNEP, 2021). The Glasgow Climate Pact adopted by the COP26 stressed “the urgency of enhancing ambition and action in relation to mitigation, adaptation and finance in this critical decade to address the gaps in the implementation of the goals of the Paris Agreement” and requested “[...] Parties to revisit and strengthen the 2030 targets in their nationally determined contributions as necessary to align with the Paris Agreement temperature goal by the end of 2022, taking into account different national circumstances” (UNFCCC, 2022c).
To avoid any worst-case scenario before 2050, the world must be able to estimate its GHG emission reductions strategies using a strong and possibly harmonized GHG accounting methodology where the path of each GHG fluxes can be tracked at least until 2050 (UNFCCC, 2022a). By doing so governments, International Financial Institutions (IFIs), private sector and civil society will have the necessary information to develop appropriate responses, policies, financial incentives and behavior changes.
The scientific community already developed tens of GHG accounting tools covering the Agriculture, Forestry and Other Land Use (AFOLU) sector. Most of them have been designed to serve a specific purpose, i.e., food value chains, carbon footprint of a commodity, project evaluation, sustainable land management, the resource impact of an organization, a region or a country (see reviews by Denef et al., 2012; Milne et al., 2012; Colomb et al., 2013; Toudert et al., 2018). These tools are usually used by IFIs and Multilateral Development Banks (MDBs) either in ex-ante assessments to raise awareness or to help select climate strategies along with their economic and financial potential; or in ex-post assessments to estimate GHG emission reductions from the implemented climate strategies. Their main output is a carbon balance, which is the difference between a scenario considering the implementation of a climate strategy and its counterfactual, or a carbon footprint, over a given period, usually 20 years which is “the time period assumed for carbon stocks to come to equilibrium” (Chapter 2 volume 4, Intergovernmental Panel on Climate Change (IPCC) Guidelines for National Greenhouse Gas Inventories 2006 the Refinement to the 2006 IPCC). The existing GHG accounting tools use these carbon balances or footprints to derive an annual average of GHG emission reductions. Yet, the international climate commitments require Parties to track climate ambitions and associated GHG emission reductions over time. The PA established key milestones such as the biennial update and transparency reports (to be submitted every 2 years starting from 2024), the national communications (to be submitted every 4 years) and the NDCs (to be submitted every 5 years). These reporting requirements call for a shift toward the estimation of annual GHG emission reductions of implemented climate actions. This will enable stakeholders to make more informed decisions and adequately plan the near, medium and long-term policy and investment necessary to maintain the PA's temperature goal and to develop solid requests for additional international financial support to the AFOLU sector.
Climate finance is a fundamental element of the global development agenda and has been accelerating in the past years as recently quantified by FAO (Buto et al., 2021a,b), reaching USD 79 billion in 2019 (Buto et al., 2021b). However, the analysis identified that between 2000 and 2018 the share of global climate finance in the agriculture and land use sector decreased, passing from an average of 45% of the total flows at the beginning of the millennium, to 24% in 2013 where it has remained since (Buto et al., 2021a). In 2019, USD 18.4 billion, or 23% of climate finance was allocated to the agriculture and land use sector (Buto et al., 2021b).
Recognizing the pressing need for a tailored and standardized approach to estimate and track the low-carbon transition of the AFOLU sector in the context of the NDC and LT-LEDS, and in line with the transparency framework, the Food and Agriculture Organization of the United Nations (FAO) developed the NDC Expert Tool (NEXT). NEXT was designed to support government, national experts, and practitioners to estimate and track their ambitions in the AFOLU sector, and eventually revise their climate goals to meet national and international commitments made under the PA. NEXT is the first tool to propose a detailed time-series approach on GHG emissions and carbon stock changes over 30 years, enabling the estimation of carbon stock changes and GHG emissions on an annual basis. Practitioners in the AFOLU sector can therefore measure, oversee and plan their climate change mitigation actions in this sector and their contribution to achieve economy-wide carbon neutrality.
Materials and Methods
NEXT is a comprehensive GHG accounting tool to assess national and subnational GHG emission reduction and carbon removals of actions and policies. The tool estimates annual carbon stock changes per unit of land (in hectare, ha), and emissions of carbon dioxide (CO2), methane (CH4) and nitrous oxide (N2O), all expressed in metric tons of carbon dioxide equivalent per year (tCO2e/year). The main output of the tool is the annual, and cumulated, estimation of the potential changes in GHG emissions from a set of climate actions against their counterfactual scenarios over a 30-year reading framework.
NEXT aligns with the ETF requirements and its modalities, procedures and guidelines (MPGs) II on “national inventory report of anthropogenic emissions by sources and removals by sink of greenhouse gases (GHGs)” and MPG III on “tracking progress of implementation and achievement of NDC under Article 4 of the Paris Agreement”.
NEXT's General Concept
NEXT is an excel-based tool and comprises nine modules as described in Table 1. The tool includes a “Home” module, six modules on the different components of the AFOLU sector, a results module, and a “Help” module with different maps and national characteristics. NEXT estimates the climate change mitigation potential of implemented climate actions over a 30-year period compared to a counterfactual or reference scenario. The climate action or target under NEXT's terminology, can be a policy or a measure, a Nationally Appropriate Mitigation Action (NAMA), a component of a LT-LEDS among other low-carbon measures implemented within the country. The reference scenario refers to scenarios based on the assumption that no mitigation policies or measures will be implemented beyond those already in force or planned to be adopted. The reference scenario is not a prediction of the future, but rather a counterfactual projection based on information retained as indicative of what the level of emissions could be without any mitigation policy. The term reference scenario can be used interchangeably with baseline or no policy scenario and can take the form of a business-as-usual (BAU) scenario.
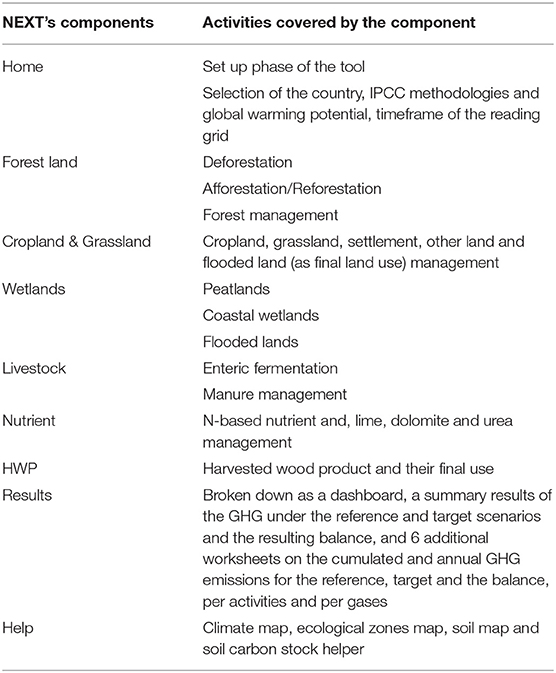
Table 1. NEXT components and associated activities.
NEXT estimates GHG emissions and carbon removals from basic information provided for each action in the respective modules. The main input data are the area in ha (or quantity of agricultural inputs, or the number of heads for livestock), the start and end year of the climate action, and the associated climate and soil type. In the case of land management, additional data is required on the soil management practices, the residue management, and the water table for organic soils, if applicable. Based on these information inputs, NEXT estimates the annual and cumulated GHG fluxes and carbon stock changes from (i) the initial land management practices, (ii) the transition to the initial land use or management practices to the final land use or management practices, and (iii) the final land use and associated management practices until the last converted area reaches equilibrium (Figure 1). These computations are performed to provide cumulated and annual GHG emissions for the target, the reference scenario and the balance (see Figure 2). NEXT also provides highly disaggregated results on GHG emissions per scenario, per activities, per gas, per gas per activities and per gas per scenarios, per pools and GHG fluxes categories and per scenarios.
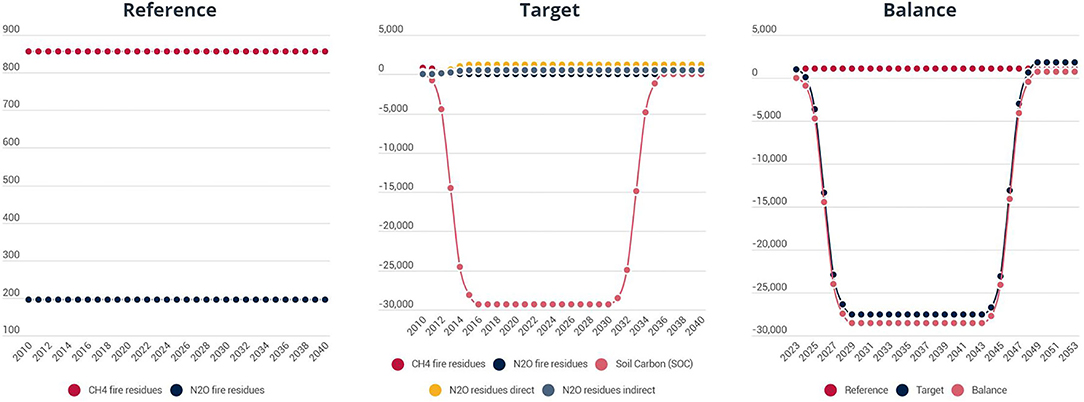
Figure 1. Illustration of GHG fluxes and carbon stock changes following the adoption of sustainable soil management practices (target scenario) over 5 years assuming a S-curve dynamic adoption.
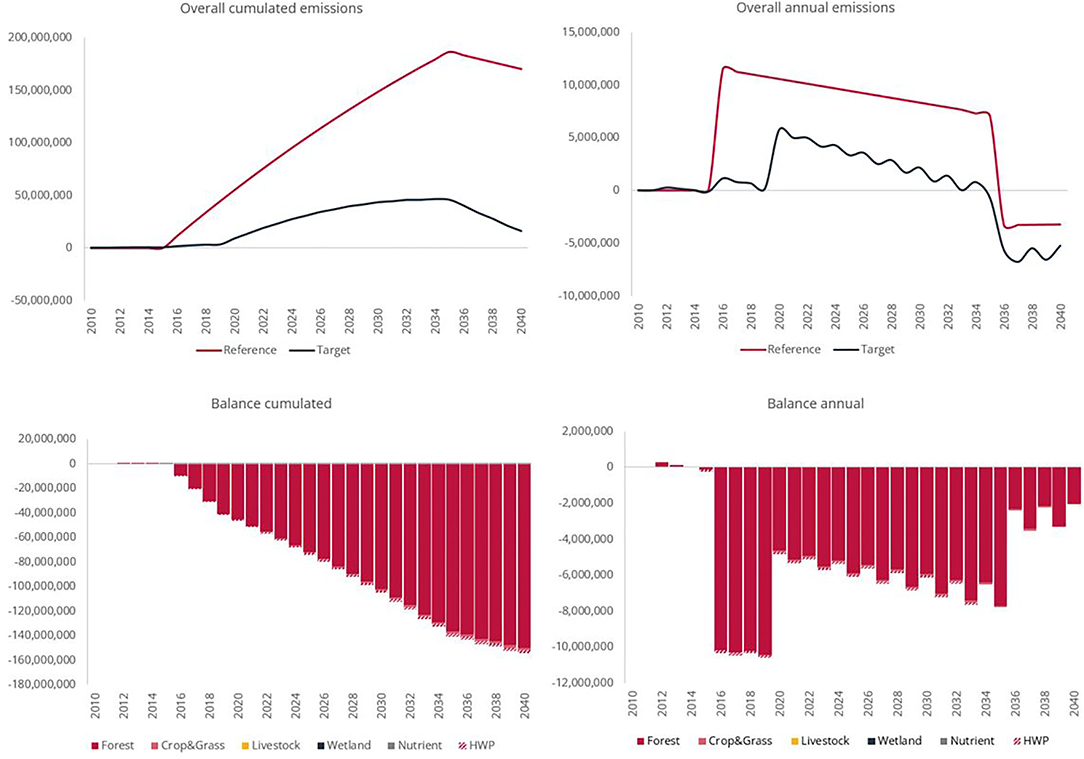
Figure 2. Screenshot of NEXT dashboard on cumulated and annual greenhouse gas fluxes and carbon stock changes for the target, reference scenario, and the balance, in tCO2-e/year.
Methodologies
NEXT was developed using the Intergovernmental Panel on Climate Change (IPCC) Guidelines for National Greenhouse Gas Inventories 2006 (IPCC, 2006), the 2013 Supplement to the 2006 IPCC (IPCC, 2013), and the Refinement to the 2006 IPCC (IPCC, 2019a).
The main entry point in NEXT is the country. Once it is defined, NEXT is tailored for several national key parameters of which: the annual crops and livestock categories both retrieved from FAOSTAT (FAO, 2021), the associated climate from IPCC (2019a) revised after Audebert et al. (2021a,b), the soil types according to the Harmonized World Soils Database (HWSD) (Batjes, 2010) and the global ecological zones, (FAO, 2012). The perennial agroforestry and perennial monoculture are disaggregated at regional level according to Cardinael et al. (2018).
The tool offers the possibility to use either the IPCC (2006) or IPCC (2019a) methodology both complemented with IPCC (2013). The IPCC guidelines provide recommendations on methods and default estimates for assessing carbon stock changes and GHG fluxes at three tiers of details, from tier 1 up to tier 3. NEXT uses the tier 1 methodological approach and its associated and default emission and carbon stock changes factors, but allows to use tier 2 factors if users have the necessary data.
NEXT is based on the six broad land categories proposed by the IPCC when reporting on GHG inventories, i.e., forest land, cropland, grassland, wetlands, settlement and other land. Some categories include sub-categories describing specific characteristics that may have significant impacts on the estimation of GHG emissions and carbon sequestration, such as settlement which can be disaggregated into settlement–settlement, settlement–cultivated areas, settlement–turf grass, settlement–urban green. Three approaches can be used to represent land use categories and areas, and conversions between land-use categories (IPCC, 2006, 2019a). NEXT retains approach 2 to track the conversions between land categories (i.e., not land sub-categories) over the 30-year period of analysis. The tracking of land use changes is performed on an annual basis for both the reference and target scenarios. The results are presented as a matrix of land use and land use change tracking.
Dynamics of Change in Land Use and or Management Practices
NEXT proposes different dynamics of implementation of the climate actions, i.e., linear, S-shaped or sigmoid curve, or exponential (Figure 3). A linear dynamic considers a constant annual implementation of the activities. The S-shaped curve considers a smooth implementation of the climate action, followed by a strong increase, before reaching the maximum of the action. The exponential dynamic considers a steep implementation of the climate action at its beginning before reaching a “plateau” by its end.
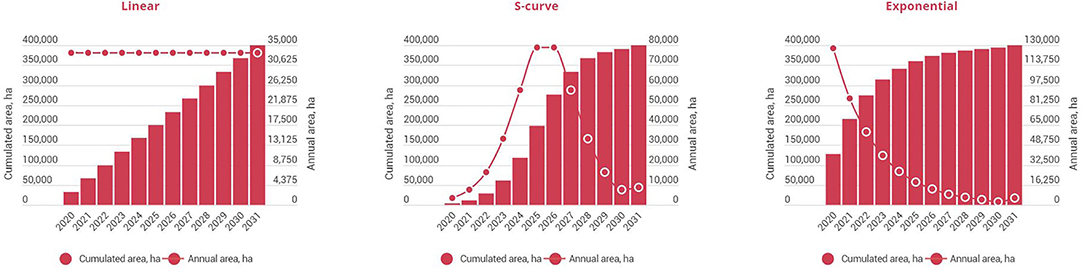
Figure 3. Illustration of the dynamic of implementation of a climate action, cumulated and annual, over a period of 5 years.
Generic Methodologies for Estimating Carbon Pool Changes
Chapters 2 of Volumes 4 of IPCC (2006) and IPCC (2019a) provide detailed information on generic methodologies. The generic methodologies are used principally to account for carbon stock changes and biomass burning during conversion between 2 categories. Carbon stock changes are addressed using the stock difference method for the 6 pools: above-ground biomass, below-ground biomass, soil, deadwood, litter and in some specific cases harvested wood product (HWP), see Equation 2.3 IPCC (2006) and IPCC (2019a).
Above-Ground Biomass
Default values for above-ground biomass (AGB) are estimates expressed in metric tons of dry matter per hectare (t d.m./ha), (IPCC, 2006, 2019a). The corresponding carbon stock, in metric ton of carbon per hectare (tC/ha) is calculated using the default carbon content, e.g. 0.47 for above-ground forest biomass (see Table 4.3, IPCC, 2006, 2019a) and 0.451 for mangrove forest biomass (see Table 4.2, IPCC, 2013). These carbon stocks are referenced in each module.
Below-Ground Biomass
For forest and plantations, below-ground biomass is derived from the above-ground biomass using a root to shoot ratio of below-ground biomass to above-ground biomass (R) expressed in metric ton root d.m/metric ton shoot d.m. The below-ground biomass is estimated only for natural forests and forest plantations and, when using the IPCC (2019a) methodologies, also for perennial agroforestry and perennial monoculture. R is additionally disaggregated between natural forests and forest plantations in IPCC (2019a), while this is not the case for the IPCC (2006).
Litter and Deadwood
The tier 1 approach assumes that litter and deadwood pools are zero in all non-forest categories. For mangroves carbon stocks in litter and deadwood are respectively 0.7 and 10.7 tC/ha (see Table 4.7, IPCC, 2013).
Mineral Soil Carbon
For the soil organic carbon (SOC) estimates, the default values are based on default references for soil organic carbon (SOCref) stocks for mineral soils to a depth of 30 cm (Table 2.3, IPCC, 2006, 2019a). When SOC changes over time, in case of land use change or changes in soil management practices, see Equation 2.25 IPCC (2006) and IPCC (2019a), a default time period of 20 years is assumed for transitions between equilibria. Some modules use carbon change rates instead of the SOC stock difference and therefore do not require information on absolute SOC stock.
The Harvested Wood Products
There are four approaches to account for the contribution of the HWP to the AFOLU sector: (i) the stock-change, (ii) the production, (iii) the atmospheric, and (iv) the simple decay approach (IPCC, 2006, 2019a). The stock-change and production approaches are based on a conceptual framework which focuses on carbon stock changes within defined HWP pools and deriving estimates of CO2 emissions and removals from these. The atmospheric flow and simple decay approaches are based on a conceptual framework that focuses on identifying and tracking CO2 fluxes (IPCC, 2006 and IPCC, 2019a). The stock-change and atmospheric-flow approaches cover stock changes or CO2 fluxes associated within a consuming country, whereas the production and simple-decay approaches cover those associated with a producing country. NEXT retains the production approach, estimating changes in carbon stocks in the HWP pool consisting of products made from wood harvested in a given country, i.e., products that are consumed domestically and also products that are made in the country and later exported and used in other countries.
NEXT Carbon Stock Changes Estimates During a Land Use Change
The conversion to another land category or changes in land use management may be associated with a change of carbon from the biomass, the soil, and possibly litter and deadwood, and transfer of new biomass to the HWP pool. In the year of the conversion, NEXT assumes carbon stock of the initial land are at equilibrium, and that all this carbon will be lost and returned to the atmosphere if not transferred to the HWP. In the new land use, the carbon sequestered in the biomass, and the loss or gain of carbon in non-flooded soil is accounted for the year following the conversion. The default values (tier 1) are available for each pool of each category (i.e., vegetation type) in the “Tier 2” section, which is to the right of the main module. The following equation describes the carbon stock changes occurring from 1 year to the next as a result of the conversion to another land use or changes in management practices in a given area.
Where:
ΔC = the annual carbon stock change in the initial and final land use following a conversion to a new land use, in tC/ha
Ctn = the carbon stock in the pool at year n, in tC/ha, and
Ctn+1 = the carbon stock in the pool at year n+1, in tC/ha.
Regardless of the period of implementation of climate actions, NEXT estimates carbon stock changes in the soil compartment over 20 years following changes in management practices and or land use changes on a given land and area.
All carbon stock changes, except for the harvested wood product, are converted into CO2-e using a conversion factor of 44/12. A positive change from 1 year to the next will mean a loss of carbon stock and thus CO2 emissions would be returned to the atmosphere. A negative carbon stock change will correspond to carbon sequestration and carbon removal from the atmosphere.
Generic Methodologies for Estimating GHG Fluxes
Biomass burning (via crop residues, conversion to a new land use, forest disturbances such as wildfire and insects), enteric fermentation, rewetting of inland wetland mineral soils (IWMS), aquaculture, soil management, land use change, water quality management, among others, are significant sources of CH4 and N2O emissions. For these emissions, NEXT adopted the generic approach as proposed in IPCC, which considers a simple multiplication of activity data with the emission factor for CH4 and N2O (Equation 2.6 IPCC, 2006 and IPCC, 2019a). Emissions from N2O and CH4 are then converted to CO2-e using their global warming potential over a 100-year horizon from the IPCC Fifth Assessment Report, AR5 (Myhre et al., 2013) (Table 2).
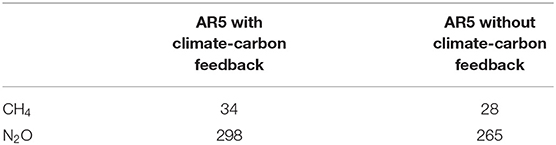
Table 2. Global warming potential over 100-years horizon for CH4 and N2O.
Table 3 also provides the mapping of all the activities and associated GHG emissions and carbon removals associated to the different NEXT modules. A more thorough description of the methodologies used in NEXT is provided in its technical guidance (Schiettecatte, 2022).
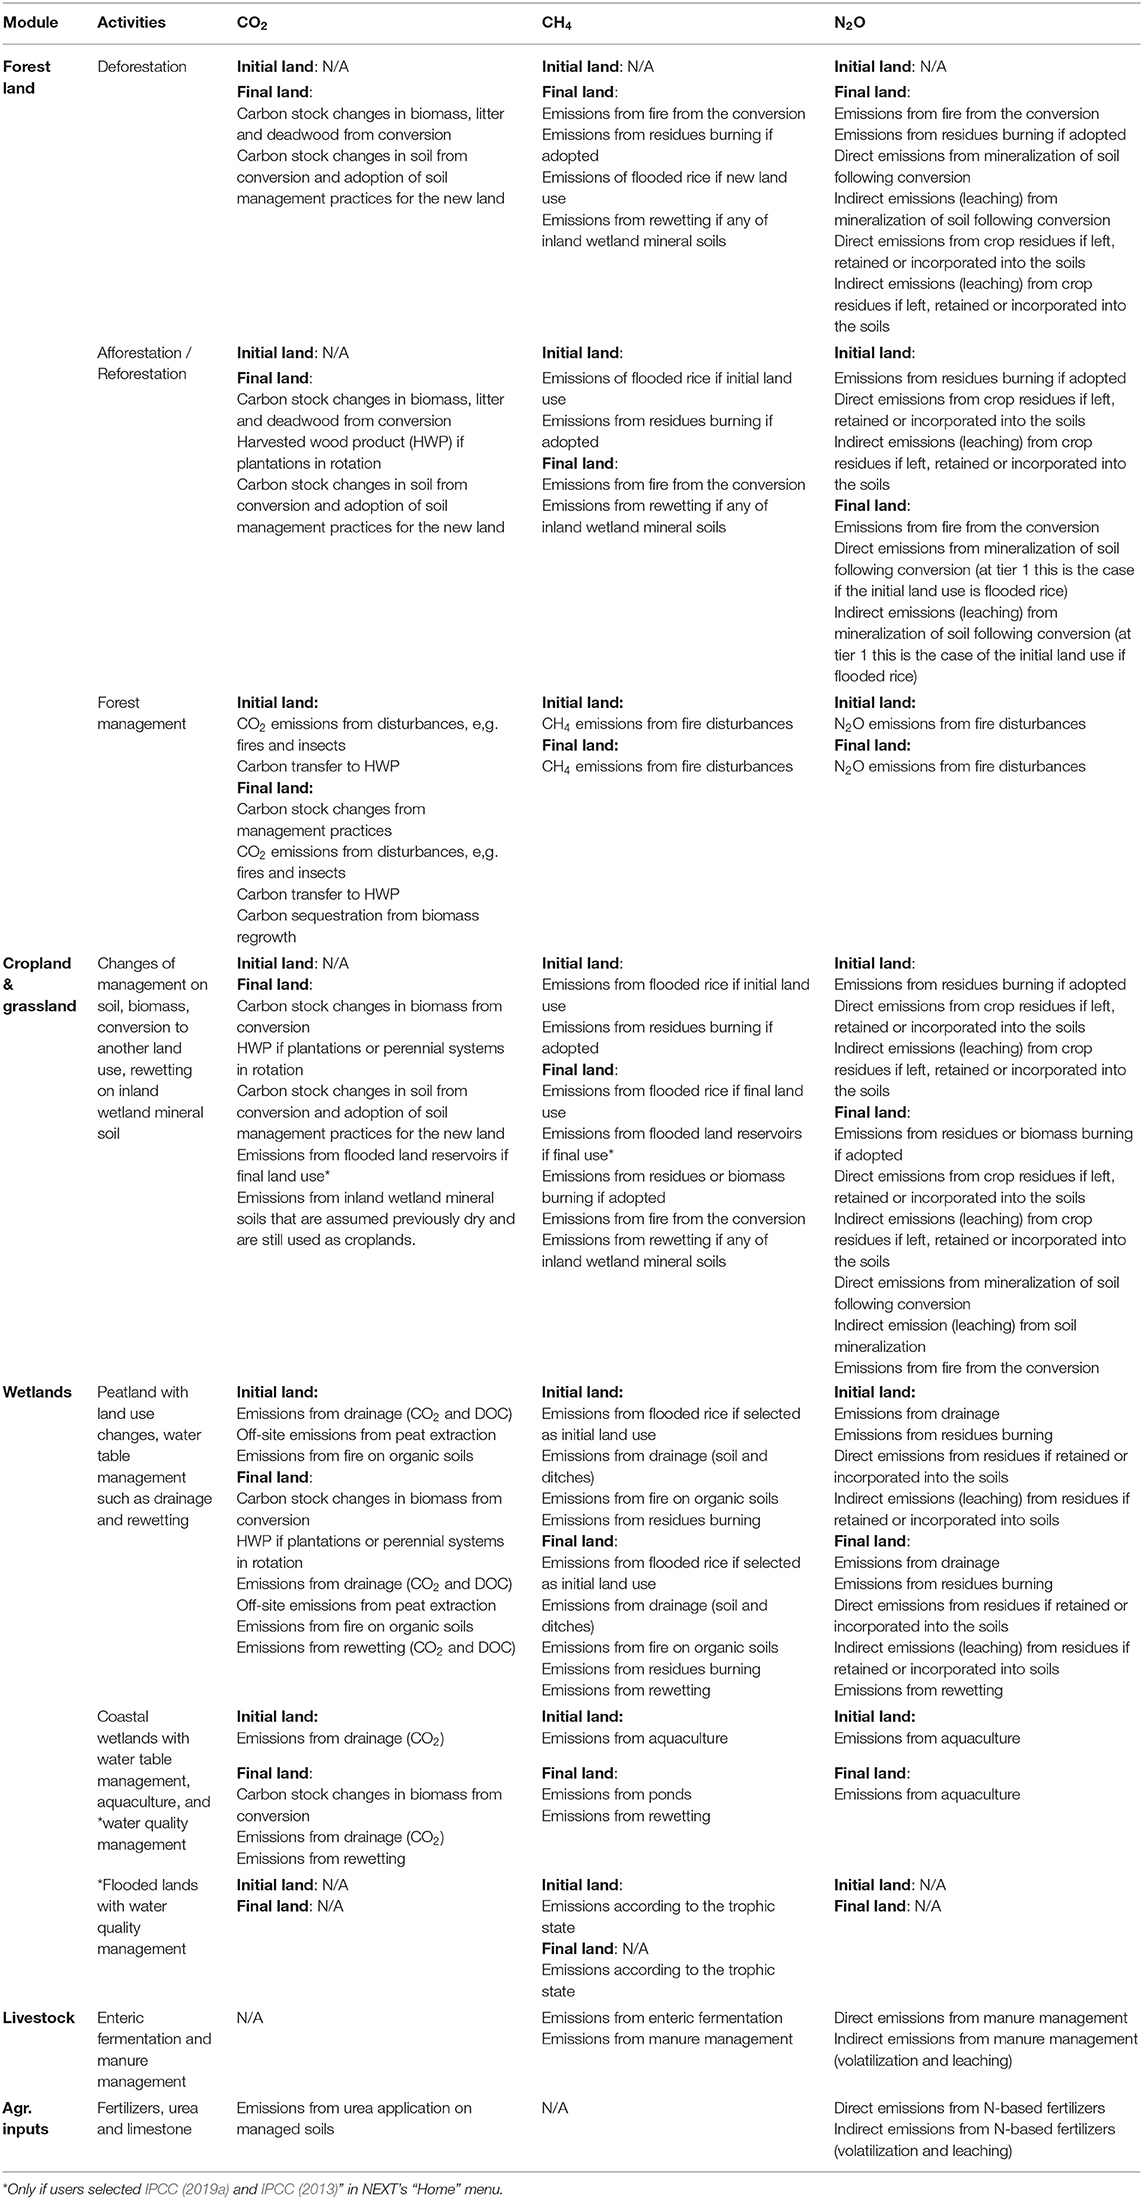
Table 3. Mapping of the different greenhouse gas and their sources in the different NEXT modules.
Results
NEXT has been tested on several case studies, ranging from intended NDCs (iNDCs) to LT-LEDS and investments in sustainable land management. The following case study is an analysis of relevant AFOLU sections of Ghana's iNDC submitted in 2015 (UNFCCC, 2022d), and complemented with data from national documentation of different ministries, communications submitted to the UNFCCC, and relevant publications.
Despite significant improvements in the second NDC submitted in 2021, notably the inclusion of 14 additional policy activities related to mitigation (with no further description), a revision of the GHG emissions baseline, a change of the base year, and the GHG emission reductions targeted, the level of information was insufficient to run a climate change mitigation analysis with this updated NDC.
iNDC Description
Ghana's iNDC entails 31 NDC actions, of which 11 are related to adaptation and 20 are related to mitigation. It covers 7 priority areas: energy, transport, agriculture, water and climate services, industry, health and forestry. The 2010 baseline GHG emissions is derived from the 1990–2012 time series and the GWP over a 100-year horizon used are 21 for CH4 and 310 for N2O. Ghana set an unconditional target of reducing its national GHG emissions by 12% in 2025 to reach a 15% reduction by 2030. Under the guarantee of international financial support (conditional), Ghana's overall mitigation reduction goal is to lower its GHG emissions by 45% relative to a business as usual (BAU) scenario, corresponding to about −74 million tCO2-e by 2030. These targets translate into −33.3 million tCO2-e between 2020 and 2030, i.e., −11 million tCO2-e unconditional and −22.2 million tCO2-e conditional emissions reduction (Table 4) (UNFCCC, 2022d).
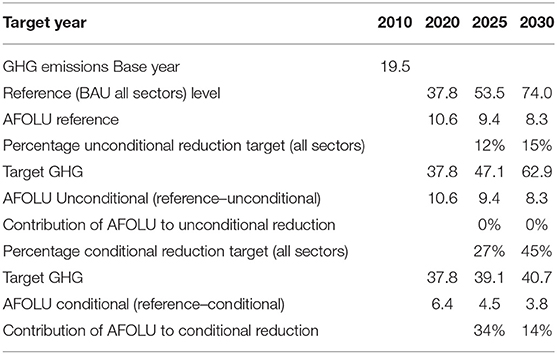
Table 4. Ghana's baseline of 2015 NDC commitments and contribution of the climate actions analyzed in the present study.
Whilst Ghana did not specify a specific target in the agriculture, forestry, land use and land-use change (LULUCF) sector (now referred to as AFOLU), the country identifies five programmes of action in the AFOLU sector, and two in the energy and waste sectors with climate co-benefits for AFOLU (see Table 5). Four AFOLU actions are focusing at the forestry sector where the abatement potential is higher. Ghana aims to reduce forest degradation and deforestation, which are posing significant threat to the livelihoods of forest fringe communities, ecosystem services and the country's agrarian economy. Deforestation and forest degradation are currently reaching 135,000 ha per year, and are primarily driven by agricultural expansion (e.g., cocoa expansion, tree crops among others), wood harvesting, population and development pressures, and mining and mineral exploitation (FAO, 2022). In addition, the production of compost from waste and the use of more efficient cook stoves help to reduce the use of synthetic fertilizers and fuelwood consumption and have other environmental benefits.
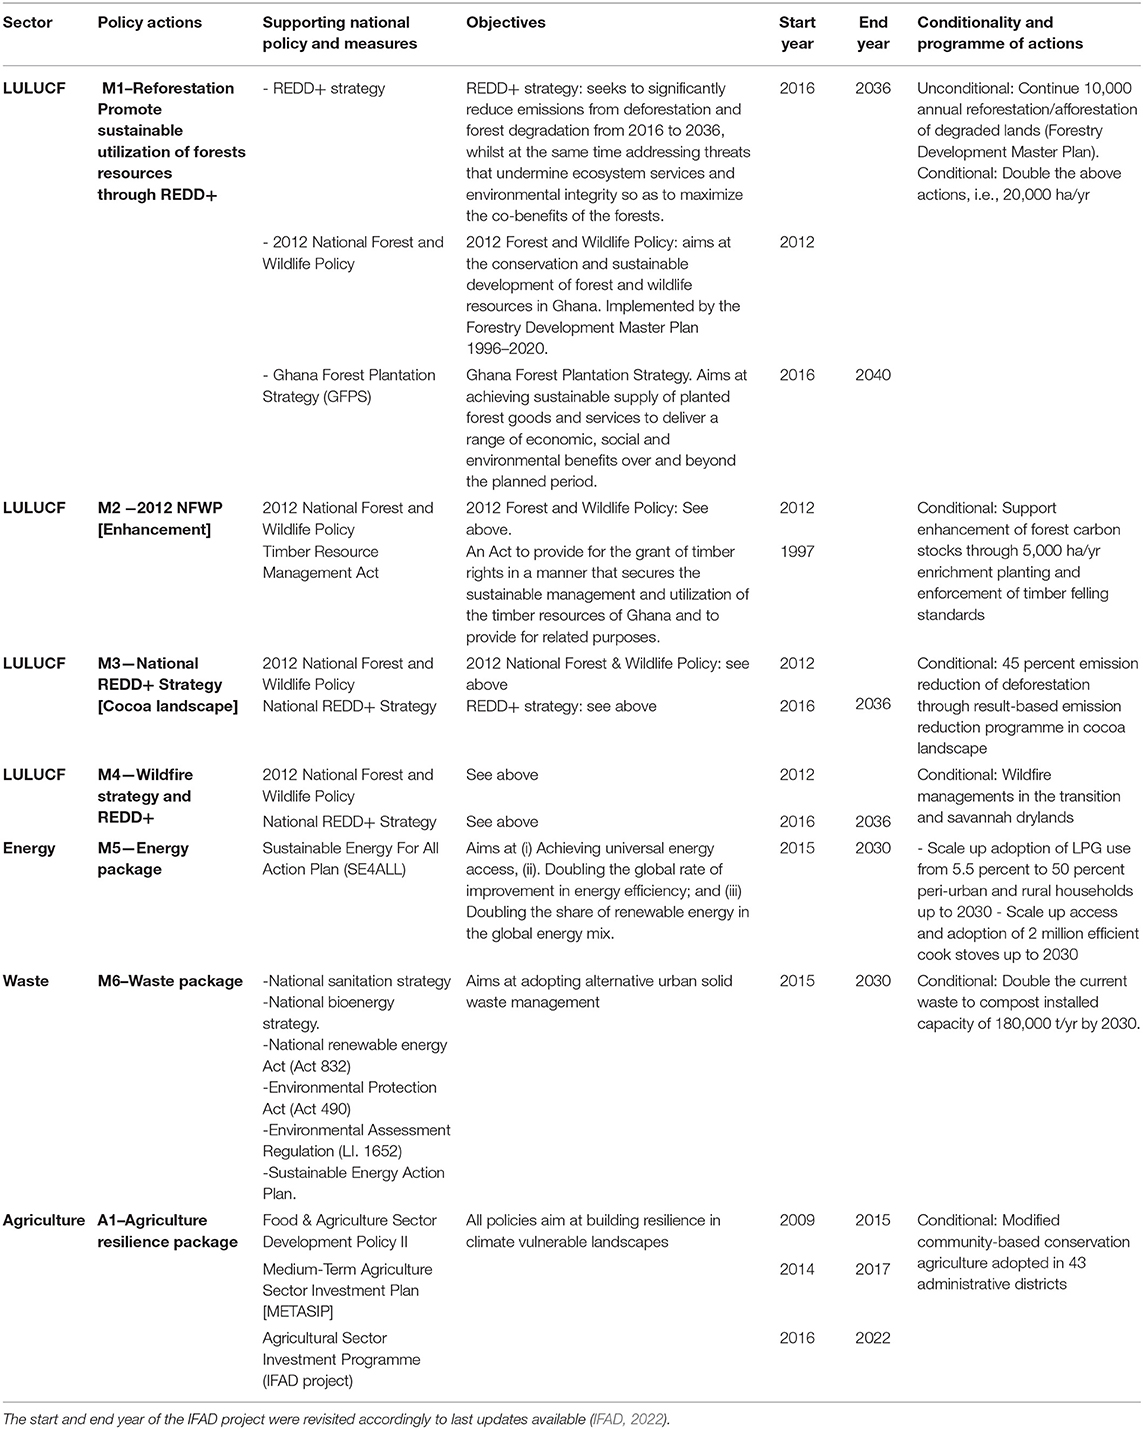
Table 5. Policy and measures reported in the intended nationally determined contribution of Ghana with benefits on climate change mitigation.
Country's Profile
Ghana is situated in West Africa at the Guinea Coast, and is subdivided into 3 distinct global ecological zones: tropical dry forest, tropical moist deciduous forest and tropical rainforest (Figure 4). Ghana's climate is mainly tropical, dry in its northern part and moist in the vast majority of the country. The soil is mainly a low activity clay soil (LAC) and a mix of LAC and high activity clay soils (LAC/HAC) (Figure 5).
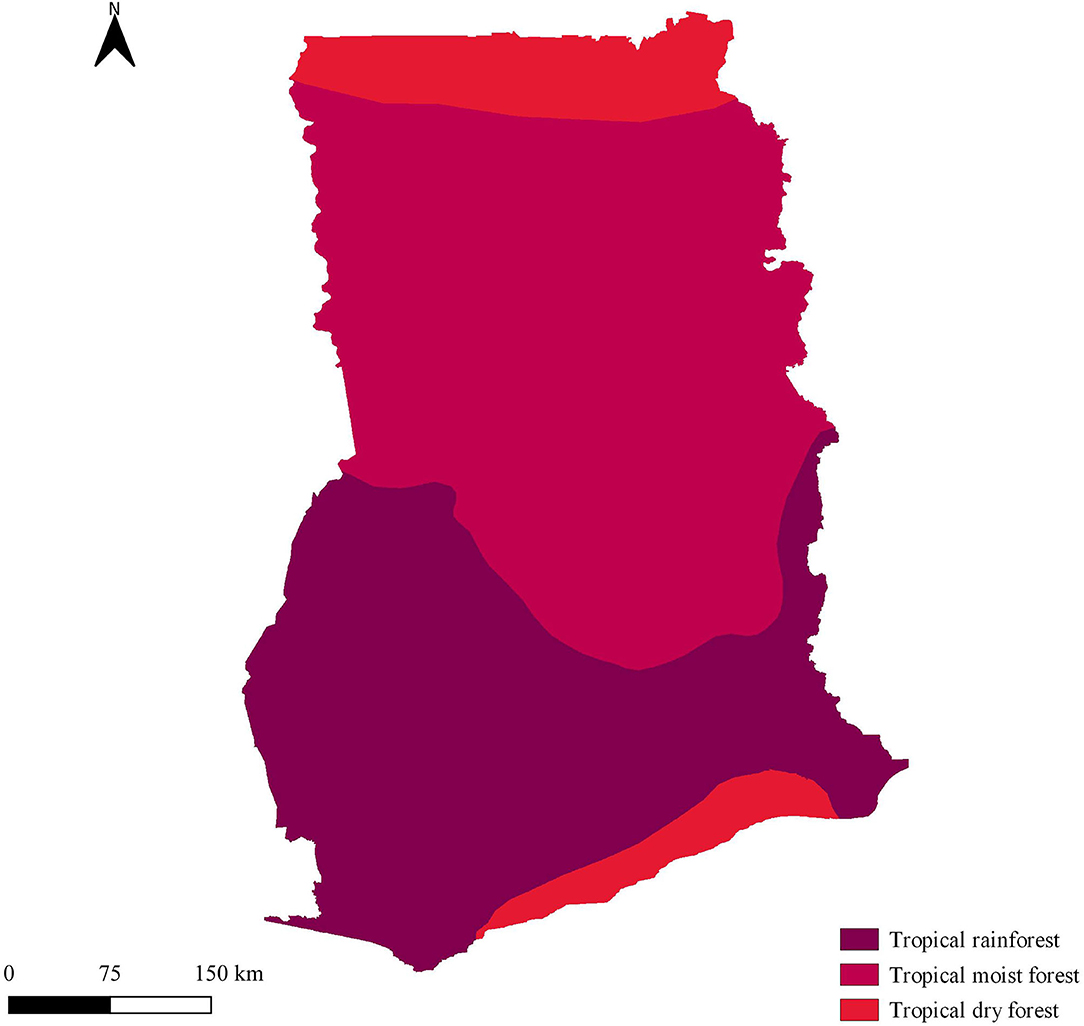
Figure 4. Ecological zones in Ghana.
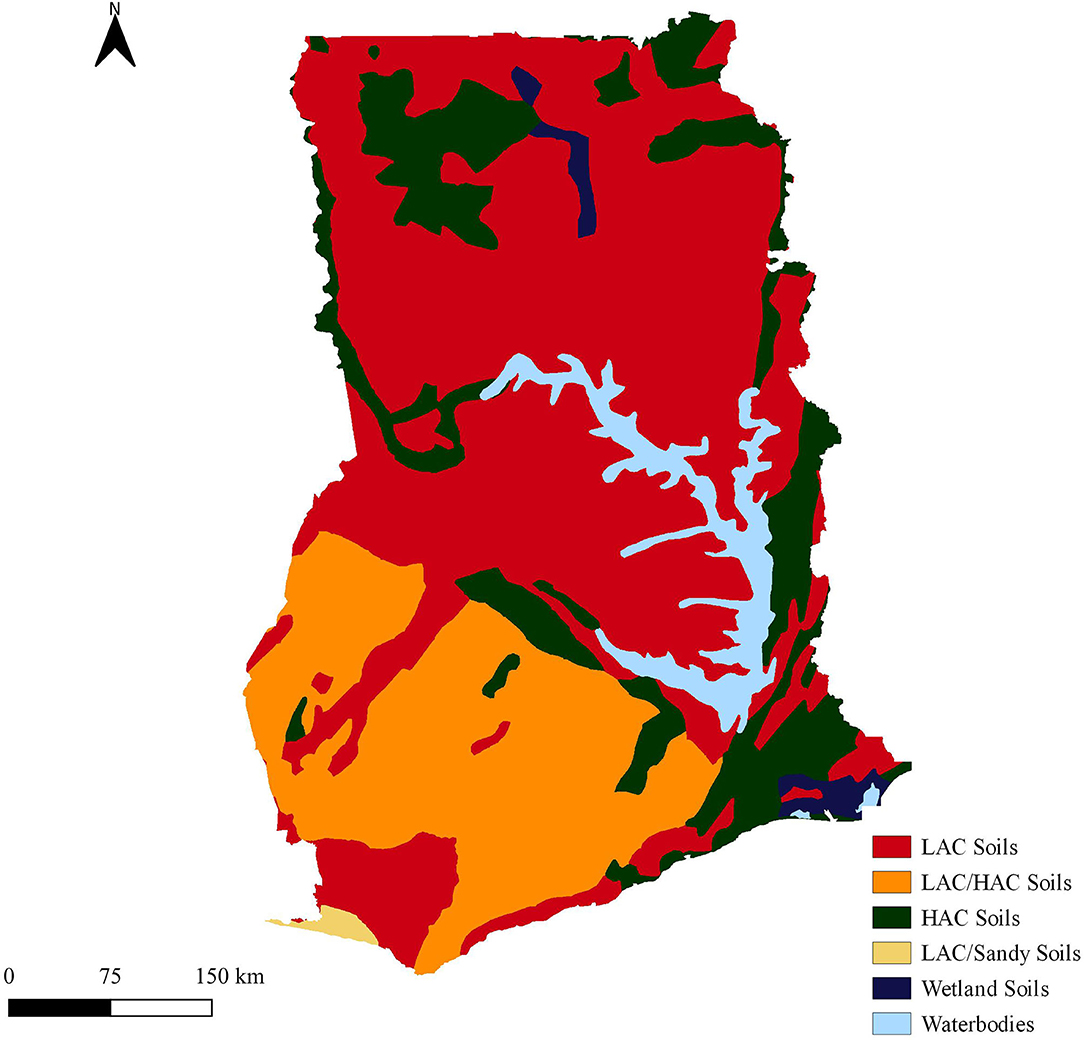
Figure 5. Soil map in Ghana according to the IPCC soil classification.
Climate Change Mitigation Actions
NEXT is configured with the IPCC (2019a) methodologies for Ghana's policy and measures (P&Ms) analysis as it is a recommended source of default emission factors and carbon stock in the Forest reference Level (FREL) (Forestry Commission, 2022a). The GWP are from the 5th AR with climate-carbon feedback, i.e., 34 for CH4 and 298 for N2O. The period of analysis spans from 2010 to 2040. The objectives and active period of P&Ms at the core of the mitigation actions are listed in Table 6. When the period of implementation of the climate action was not specified, the active period of their associated P&M was used instead. Default stocks (tier 1) replaced with national data (tier 2) are presented in Table 7.
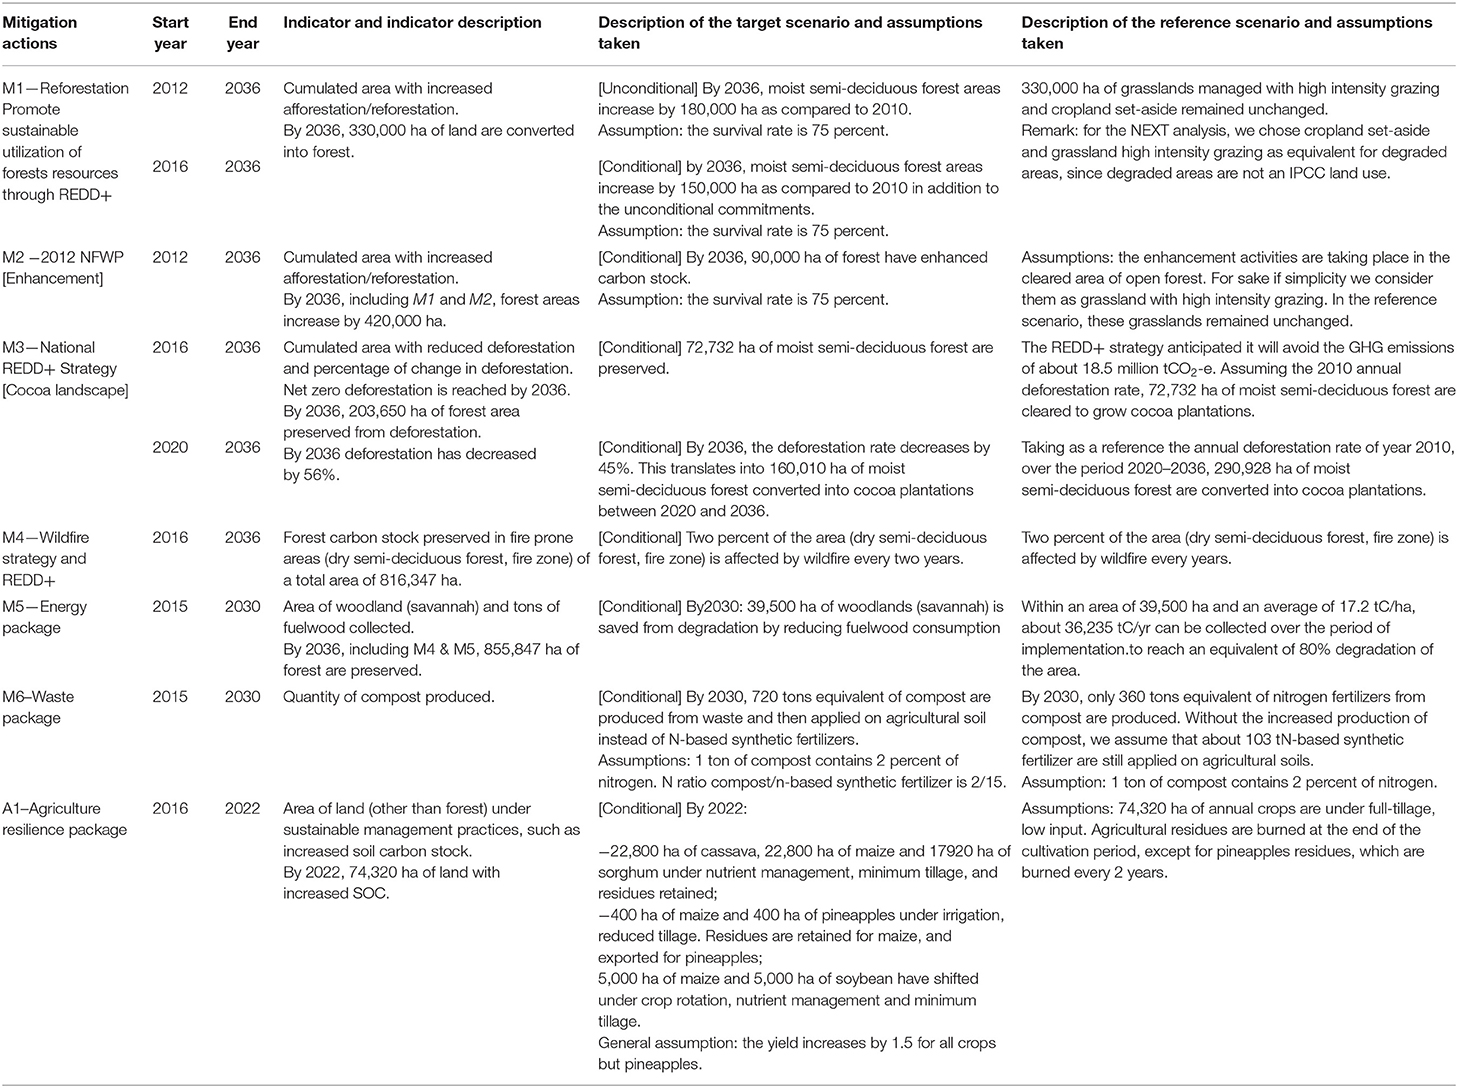
Table 6. Indicators derived from the analyzed policy and measures, description and assumptions taken for the target and reference scenarios.
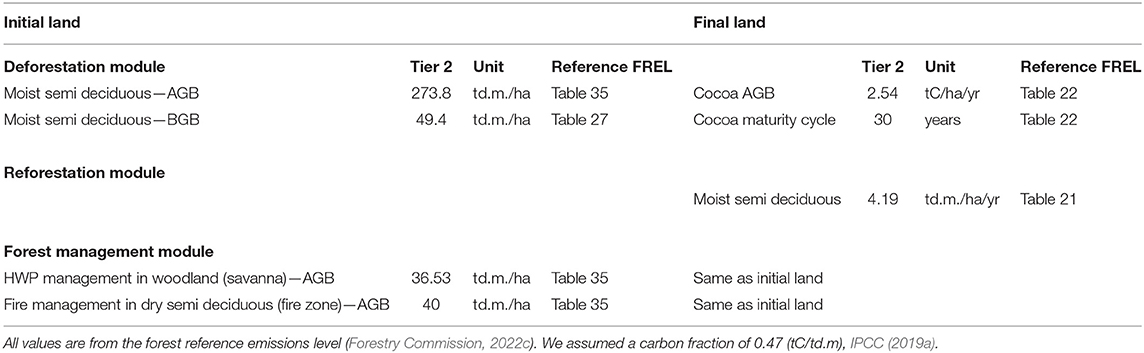
Table 7. National data used for the analysis.
Unconditional Climate Change Mitigation Actions
Afforestation/Reforestation
The unconditional mitigation action is laid out in the 2012 national Forest and Wildlife Policy (NFWP), the Ghana Forest Plantation strategy (GFPS), and the REDD+ strategy which aimed at increasing forest cover among other goals. As part of this, in its iNDC, the Government of Ghana (GoG) committed to continue to reforest/afforest “10,000 ha of degraded lands” annually, as described in the Forestry Development Master Plan (Forestry Commission, 2022b) (see policy action M1 in Table 6). In the analysis, it was assumed that most of the reforestation activities were implemented in the southern part of the country, dominated by a tropical moist climate and LAC soil, with a period of implementation spanning from 2012 to 2036. Two types of initial land were considered, cropland set-aside and grassland managed by high intensity grazing. A survival rate of replanted forest of 75% was used (Forestry Commission, 2022c), which led to the removal of about −35 million tCO2-e by 2040 from the implementation of this action.
Conditional Climate Change Mitigation Actions
With international financial support, the GoG planned to intensify the implementation of climate actions. For instance, the reforestation activities would double (see policy action M1 in Table 6) from 2016 leading to an additional 150,000 ha of forest, or about −25.7 million tCO2-e additional removal by 2040, based on the same assumptions of the aforementioned action. In parallel, the REDD+ strategy aimed at supporting the “enhancement of forest carbon stock through enrichment planting and enforcement of timber felling standards” of “5,000 ha per year” (see policy action M2 in Table 6). In simple terms, this activity can be referred to as reforestation. Therefore the reforestation of 5,000 ha pear year, starting from 2012 until 2036, would lead to an increase of forest areas by 90,000 ha (assuming a survival rate of 75 percent), and a carbon removal about−7 million tCO2-e removal by 2040.
Deforestation
Cocoa production is one of the major drivers of deforestation in the south and south-west of the country. Ghana's REDD+ strategy aimed to reduce GHG emissions from deforestation and forest degradation, and enhance forest carbon stock through the implementation of several strategies including the “emission reductions programme for the cocoa forest mosaic landscape”. As stated in the REDD+ strategy, the emissions reduction (ER) program should be implemented over two periods, from 2016 to 2020 and from 2020 to 2036, see policy action M3 in Table 6. The second phase would depend on the potential buyers of emission reductions. Over the first period, GHG emissions were expected to decrease by about 20.5 million tCO2-e. As input data in NEXT are predominantly in hectares, the GHG emissions target was translated into a quantifiable unit for the NEXT analysis. Using the deforestation rate of 2010, i.e., 18,183 ha, and the national carbon stocks for forest and cocoa plantations (Table 6), 72,372 ha of tropical forest are expected to be preserved from conversion into cocoa plantations which would reduce GHG emissions by 20.5 million tCO2-e in 2040. The same approach was used to estimate the emission reductions from the second period of the cocoa strategy, which was expected to decrease GHG emissions by 45%. We estimated that without the ER program (reference scenario) about 272,745 ha of forest would have been lost, against 150,010 ha if the emissions reduction was fully implemented (target) over the period 2021–2036. This would lead to a decrease of GHG emissions from deforestation by about 52.7 million tCO2-e in 2040.
Forest Management
Two climate actions were planned to preserve forest carbon stocks. The first one, the energy package (2015–2030), aimed at expanding, the adoption of cleaner and more efficient cooking stoves, which would reduce fuelwood consumption and conservation of the forest for other productive uses. 39,500 ha of woodland (savanna) would thus be preserved from degradation, see climate action M5 in Table 6. Using the national carbon stock of savanna, i.e., 36.53 td.m./ha, this mitigation action would help to reduce the GHG emissions by 2.6 million tCO2-e by 2040. The second strategy, the Wildfire and REDD+ strategy (2016–2036), aimed to manage wildfire in the transition and savannah dry lands. The analysis focused on the area occupied by the dry semi-deciduous forest (fire zone), i.e., 816,347 ha (Forestry Commission, 2022c), and assumed that every year wildfire would affect 2% of this area. With implementation of the strategy, see climate action M4 in Table 6, the wildfire would only occur every 2 years in the same area and would help to reduce GHG emissions by about 9 million tCO2-e by 2040.
Nutrient Management
The waste package aimed to double the amount of compost produced through better management of urban solid waste, in order to apply it to agricultural soils in place of synthetic fertilizers. Between 2015 and 2030, the quantity of compost was expected to increase from 90,000 to 180,000 metric tons per year, which translated into respectively 360 and 720 metric tons of nitrogen equivalent if we assume that 1 ton of compost contains about 2% of nitrogen (see climate action M6 in Table 6). 360 metric tons N-based compost should also be equivalent to about 51 metric tons of N-based fertilizer if we assume a 1/7 N-based ratio between the two fertilizers. While this activity is generating GHG emissions (about 30,000 tCO2-e by 2040), the shift from synthetic to organic fertilizers does have some additional benefits that are not quantifiable here, i.e., increase of SOC content, the reduction of GHG emissions from the waste sector and positive impacts on biodiversity. The change in SOC from application of compost was not estimated in the analysis as there are no information on the type of land where it is applied.
Cropland Management
The agriculture resilience package was one of the set of actions under climate change adaptation but with co-benefits for climate change mitigation. Several P&Ms were listed including the agriculture sector investment programme. This programme aimed at building resilience in climate vulnerable areas. GHG emission reductions were estimated from the information available in the project design report (IFAD, 2014) (see climate action A1 in Table 6). Overall, on the targeted area of 74,320 ha, the shift from traditional agriculture (tillage, residues burning) to more sustainable practices, i.e. zero-tillage or reduced tillage, medium to high inputs and residues left on the field, would reduce GHG emissions by about 2 million tCO2-e in 2040.
Overall Results
Cumulated and annual GHG emissions for the reference, target and associated balance are presented in Figure 2. This analysis covered an area of 1,713,827 ha across the country and spanned from 2010 to 2040, with the final year of the last planned activity ending in 2036. Cumulated GHG emissions in the reference scenario reached up to 180 million tCO2-e in 2035 and were strongly dominated by deforestation and forest degradation. The decrease in cumulated GHG emissions came as a result of the carbon removal from the cocoa plantations, as also shown by the annual profile. Cumulated GHG emissions in the target scenario followed the same trend as the reference scenario with a maximum of about 46 million tCO2-e by 2034. The anticipated peak in GHG emissions for the target scenario comes from the implementation of the different reforestation strategies, which then curb the emissions from deforestation. The end of deforestation further accelerates the drop in GHG emissions, with net-zero emissions potentially reached by 2035 via this analysis. By 2040, the GHG emission reduction from the P&Ms as compared to its counterfactual scenario amounts to approximately 150 million tCO2-e.
More interestingly, annual GHG emissions for both scenarios show a decrease of GHG emissions from 2016 to 2036, due to the cocoa plantations, with a drop of the emissions when deforestation ends in 2036. The sinusoidal curve of the target scenario is explained by forest fire (wildfire) management shifting from every year to every second year, as illustrated by the annual forestry profile of CH4, N2O and CO2. In other words, NEXT does not retain the principle of synchronicity for CO2 emissions coming from forest fires (Figure 6). The share of CH4 and N2O emissions in the total GHG emissions remained relatively small, down to two orders of magnitude lower than the CO2 ones. Overall, the contribution of unconditional climate actions to the overall reference scenario was relatively small, while the conditional climate actions contribute to to 34% of the GHG emissions reduction targets by 2025 and 14% by 2030 (Table 4).
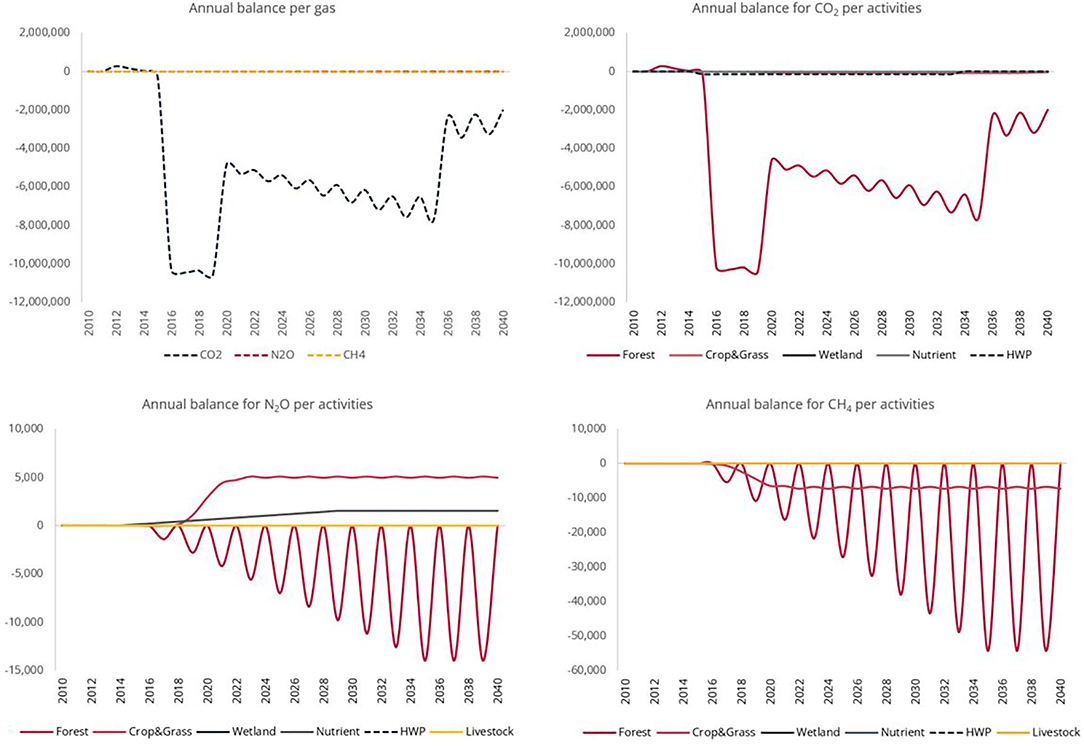
Figure 6. Screenshot of the NEXT dashboard on annual GHG emissions for the balance, per gas, and per gas per activities. Emissions are in tCO2-e.
Discussion
Land use activities (deforestation, land degradation, unsustainable agricultural management practices) are net contributors to GHG emissions. According to the IPCC Special Report on Climate Change and Land (IPCC, 2019b), the AFOLU sector contributes to ~23% of global anthropogenic emissions. These GHG emission shares represent up to one third of global GHG emissions when considering global food systems (Crippa et al., 2021). A growing global population combined with unsustainable practices, increased pressures on land and land use changes and cascading negative effects on the environment such as biodiversity loss, are putting the achievement of the Sustainable Development Goals (SDGs) and the PA objective of reaching net-zero emissions by mid-century in peril. Setting measurable and quantifiable GHG emission reductions targets are the stepping stones toward a sound decarbonisation strategy.
This tool provides a simplified yet comprehensive approach to address several challenges related to climate change mitigation analyses of the AFOLU sector: data availability, the formulation of the mitigation target (GHG target vs. non GHG target), the linkages between the different sectors, and the lack of harmonized methodologies in GHG accounting, in particular the GWP.
Climate change mitigation analyses are particularly challenging in the cropland and livestock sub-sectors, in particular when it comes to the data needed to quantify GHG emissions. For instance, the climate change mitigation potential for croplands holds in the soil carbon sequestration, which is estimated based on the knowledge of soil management practices, such as tillage and inputs, applied on a specific area. This information and the areas in which they are applied are therefore mandatory for the estimates of carbon removal by the soil. Flooded rice systems are even more complex as the only mitigation option is to reduce CH4 emissions. To quantify GHG emission reductions it is necessary to know the water table management practices prior and during cultivation and the organic amendments for flooded rice systems. This can become more complex when there are up to three different rice cultivation over an annual cycle as seen in Asia. This complexity of information might be the reason why these sub-sectors are still more covered in the climate change adaptation component than the mitigation one. In the second set of NDCs, the crop and livestock sub-sectors covered 51 and 36% of the mitigation component and 70 and 55% of the adaptation component respectively (Crumpler et al., 2021).
The other challenge is the weakness of the harmonized approach in the IPCC methodologies and metrics (GWP). In 2018, when drafting the ETF the CMA decided “Each Party shall use the 2006 IPCC, Guidelines, and shall use any subsequent version or refinement of the IPCC guidelines agreed upon by the Conference of the Parties serving as the meeting of the Parties to the Paris Agreement (CMA). Each Party is encouraged to use the 2013 Supplement to the 2006 IPCC Guidelines for National Greenhouse Gas Inventories: Wetlands.” and “Each Party shall use the 100-year time-horizon global warming potential (GWP) values from the IPCC Fifth Assessment Report, or 100-year time-horizon GWP values from a subsequent IPCC assessment report as agreed upon by the CMA, to report aggregate emissions and removals of GHGs, expressed in CO2 eq” (UNFCCC, 2022e). NEXT encourages the adoption of above recommendations to countries who haven't yet adopted the IPCC recommended methodologies.
Urgent and profound changes in our food systems need to take place to prevent temperatures rising and to adapt, mitigate and build resilience to climate change, limit damage to ecosystems, avoid displacement of human population and conflicts (Webb et al., 2020; FAO et al., 2021). Managing emissions in the food sector offers opportunities to break silos and focus on the nexus of agriculture, industry, waste and energy, bridging all actors, farmers, end-consumers, societies, private banks, governments and investors from all sectors. Numerous standards have been developed to support the private sector in the annual assessment and reporting of their GHG emissions reductions, from scope 1 to scope 3 emissions, such as the ISO 14064 family of standards (ISO, 2022) or the GHG protocol (GHG Protocol, 2022). Yet, to the best of our knowledge, such standards are not available to support Parties in the same exercises with their climate P&Ms. NEXT addresses these gaps by providing annual time series analyses of the climate change mitigation potential of implemented and planned P&M of the AFOLU sector over a 30-years horizon.
This work presents the preliminary analysis of a set of climate mitigation actions submitted in an iNDC. Results showed the suitability and flexibility of NEXT in analyzing national P&Ms, implemented during different years and in different agro-ecological zones. In addition to the annual GHG emissions for the reference, target and balance, NEXT also provides a dashboard with a wide range of indicators for Parties and financial institutions to report on targets for specific years. These include the percentage of change of forest cover, percentage of change of deforestation, cumulated area with increased afforestation, cumulated areas with restored forest and cumulated areas with increase mineral soil organic carbon. Annual results in NEXT are further disaggregated by carbon pools (biomass, soil) and categories (flooded land, enteric fermentation, manure management among others) which provide a comprehensive understanding of sources and sinks of GHG associated to the AFOLU sector.
NEXT is an integral part of the NDC toolbox developed at FAO, which also includes the NDC tracking tool and the Adaptation, Biodiversity and Carbon Mapping (ABC-Map) Tool. The NDC tracking tool supports countries to track the implementation of NDCs, by comparing planned vs. P&Ms to the ones that are implemented mitigation actions to support for all sectors and comparing achieved emissions reduction from mitigation action against sectorial and/or national baseline and the NDC target scenarios. The tool also provides templates tailored to the set of information categories necessary for tracking the implementation and achieving NDCs according to the MPGs. The Adaptation, Biodiversity and Carbon Mapping (ABC-Map) tool is a new geospatial app based on Google Earth Engine (GEE) developed by FAO that holistically assesses the environmental impact of national policies and plans (NDC, National Adaptation Plan, etc.), and investments in the AFOLU sector. ABC-Map provides users with several indicators for baseline and project scenarios on climate change adaptation (including climate and geophysical profile), biodiversity (including mean species abundance, key biodiversity and protected areas, and natural capital) and climate change mitigation (including total carbon stock and social value of carbon). This new application thereby aligns with the objectives of the three Rio Conventions, the UNFCCC, the Convention on Biological Diversity (CBD) and the United Nations Convention to Combat Desertification (UNCCD).
Conclusion
At a time when Parties have been invited to revisit and enhance their 2nd NDC in order we can collectively manage to reduce the GHG emissions reduction gap, and at a time when only 50 out of 197 Parties submitted their LT-LEDS (UNFCCC, 2022f), the need to take stock, measure and plan strategies to reduce national and global GHG emissions by the 2050's horizon is paramount. NEXT provides annual GHG results that directly respond to the provisions of the transparency framework and its MPGs, and supports the AFOLU P&Ms tracking of an NDC as required by the MPGs. NEXT can also be applied to support policies, programmes and investments in the AFOLU sector, as it provides development agencies and IFIs with a wide set of indicators including the economic mitigation benefits associated with the annual social value of carbon. This indicator allows policy makers and financial institutions interested in accounting for externalities to determine whether the costs and benefits of a proposed policy to curb climate change are justified. Thus, NEXT enables a comprehensive environmental and economic overview of climate actions in achieving a mitigation target, it informs and helps interpret a single NDC achievement as well as collective progress.
Data Availability Statement
The original contributions presented in the study are included in the article/supplementary material, further inquiries can be directed to the corresponding author.
Author Contributions
LSS developed the Nationally Determined Contribution Expert Tool and led the manuscript writing under the supervision of MB. All authors contributed equally to the manuscript writing and approved the submitted version.
Funding
LSS, PA, VU, DD, and MB were funded by the Agence Francaise de Développement (AFD) and the Bundesministerium für Ernährung und Landwirtschaft (Project GCP/GLO/998/GER).
Conflict of Interest
The authors declare that the research was conducted in the absence of any commercial or financial relationships that could be construed as a potential conflict of interest.
Publisher's Note
All claims expressed in this article are solely those of the authors and do not necessarily represent those of their affiliated organizations, or those of the publisher, the editors and the reviewers. Any product that may be evaluated in this article, or claim that may be made by its manufacturer, is not guaranteed or endorsed by the publisher.
Acknowledgments
Authors would like to thank Claude Torre for his relentless enthusiasm, his suggestions for areas of improvement in the development of the NDC toolbox. Authors thank colleagues who provided comments in the early stages of NEXT's development, in particular Paolo Prosperi, Juliana Cristina Lopes, and Anatoli Poultouchidou. Authors also thank Fiona Bottigliero for the English revision of the manuscript.
References
Audebert, P., Tullis, J., Ogle, S., Bernoux, M., and Schiettecatte, L. S. (2021a). The IPCC Climate Zone Map - Raster. 2019 Refinement to the 2006 IPCC Guidelines for National Greenhouse Gas Inventories. IPCC. Available online at: https://www.ipcc-nggip.iges.or.jp/faq/faq.html (accessed February 18, 2022).
Audebert, P., Tullis, J., Ogle, S., Bernoux, M., and Schiettecatte, L. S. (2021b). The IPCC Climate Zone Map - Vector. 2019 Refinement to the 2006 IPCC Guidelines for National Greenhouse Gas Inventories. IPCC. Available online at: https://www.ipcc-nggip.iges.or.jp/faq/faq.html (accessed February 18, 2022).
Batjes, N. H (2010). IPCC default soil classes derived from the Harmonized World Soil Data base (Ver. 1.1). Wageningen: Report 2009/02b, Carbon Benefits Projects (CBP) and ISRIC – World Soil Information. (with dataset).
Buto, O., Galbiati, G. M., Alekseeva, N., and Bernoux, M. (2021a). Climate Finance in the Agriculture and Land Use Sector - Global and Regional Trends Between 2000 and 2018. Rome: FAO.
Buto, O., Galbiati, G. M., Alekseeva, N., and Bernoux, M. (2021b). Climate Finance in the Agriculture and Land Use Sector Between 2000 and 2019 – Special Update. Rome: FAO.
Cardinael, R., Umulisa, V., Toudert, A., Olivier, A., Bockel, L., and Bernoux, M. (2018). Revisiting IPCC Tier 1 coefficients for soil organic and biomass carbon storage in agroforestry systems. Environ. Res. Lett. 13, 124020. doi: 10.1088/1748-9326/aaeb5f
Colomb, V., Touchemoulin, O., Bockel, L., Chotte, J.-L., Martin, S., Tinlot, M., et al. (2013). Selection of appropriate calculators for landscape-scale greenhouse gas assessment for agriculture and forestry. Environ. Res. Lett. 8. doi: 10.1088/1748-9326/8/1/015029
Crippa, M., Solazzo, E., Guizzardi, D., Monforti-Ferrario, F., Tubiello, F. N., and Leip, A. (2021). Food systems are responsible for a third of global anthropogenic GHG emissions. Nature Food. 2, 198–209. doi: 10.1038/s43016-021-00225-9
Crumpler, K., Abi Khalil, R. A., Tanganelli, E., Rai, N., Roffredi, L., Meybeck, A., et al (2021). 2021 (interim) Global Update Report: Agriculture, Forestry and Fisheries in the Nationally Determined Contributions. Rome: FAO. Available online at: https://www.fao.org/3/cb7442en/cb7442en.pdf (accessed February 28, 2022).
Denef, K. K., Paustian, S., Archibeque, S., and Biggar Pape, D. (2012). Report of Greenhouse Gas Accounting Tools for Agriculture and Forestry Sectors. Interim report to USDA under Contract No. GS-23F-8182H. Available online at: https://www.virtualfarm.psu.edu/assets/uploads/content/Denef_et_al_2012_GHG_Accounting_Tools_v1.pdf (accessed February 28, 2022).
FAO (2012). Global Ecological Zones for FAO Forest Reporting: 2010 Update. Rome, United Nations: Forest Resources Assessment Working Paper 179.
FAO (2021). FAO STAT Crop and Livestock Products. License: CC BY-NC-SA 3.0 IGO. Available online at: https://www.fao.org/faostat/en/#data (accessed March 3, 2021).
FAO (2022). FAOLEX database, Ghana national level, Ghana REDD+ strategy (2016-2035). Available online at: https://www.fao.org/faolex/results/details/en/c/LEX-FAOC178876/ (accessed February 18, 2022).
FAO IFAD, UNICEF, WFP, and WHO. (2021). The State of Food Security and Nutrition in the World 2021. Rome, United Nations: Transforming food systems for food security, improved nutrition and affordable healthy diets for all.
Forestry Commission (2022a). Ghana's national forest reference level, 2001-2015. Available online at: https://redd.unfccc.int/files/ghana_national_reference__level_01.01_2017_for_unfccc-yaw_kwakye.pdf (accessed Januray 26, 2022).
Forestry Commission (2022b). Ghana REDD+ strategy. Available online at: https://www.oldwebsite.fcghana.org/userfiles/files/REDD%2B/Ghana%20REDD%2B%20Strategy.pdf (accessed January 26, 2022).
Forestry Commission (2022c). Ghana Forest Plantation Strategy, 2016-2040. Available online at: https://www.oldwebsite.fcghana.org/userfiles/files/Plantation%20Annual%20Report/Ghana%20Forest%20Plantation%20Strategy_24_01_16%20(2).pdf (accessed January 26, 2022).
GHG Protocol (2022). GHG Protocol. Available online at: www.ghgprotocol.org (accessed January 26, 2022).
IFAD (2014). Ghana Agricultural Sector Investment Programme (GASIP), Design Report. Available online at: https://www.ifad.org/documents/38711624/40089492/Design+Report+May+2014.pdf/1ea3b9ce-6576-4c1d-b6a0-6fbaa071ab9a?t=1611224761000 (accessed January 26, 2022).
IFAD (2022). Ghana Agricultural Sector Investment Programme. Available online at: https://www.ifad.org/en/web/operations/-/project/1100001678 (accessed January 26, 2022).
IPCC (2006). “2006 IPCC Guidelines for National Greenhouse Gas Inventories,” in Agriculture, Forestry and Other Land Use, Vol. 4. Eggleston, H. S., Buendia, L., Miwa, K., Ngara, T., and Tanabe, K. (eds). Japan: GES, Prepared by the National Greenhouse Gas Inventories Programme.
IPCC (2013). 2013 Supplement to the 2006 IPCC Guidelines for National Greenhouse Gas Inventories: Wetlands. Hiraishi, T., Krug, T., Tanabe, K., Srivastava, N., Baasansuren, J., Fukuda, M., and Troxler, T.G. (eds). Switzerland: IPCC.
IPCC (2018). Global Warming of 1.5°C. An IPCC Special Report on the Impacts of Global Warming of 1.5°C Above Pre-industrial Levels and Related Global Greenhouse GAS EMission Pathways, in the Context of Strengthening the Global Response to the Threat of Climate Change, Sustainable Development, and Efforts to Eradicate Poverty. Masson-Delmotte, V., Zhai, P., Pörtner, H.-O., Roberts, D., Skea, J., Shukla, P.R., et al. (eds). Switzerland: IPCC.
IPCC (2019a). 2019 Refinement to the 2006 IPCC Guidelines for National Greenhouse Gas Inventories, Vol. 4. Calvo Buendia, E., Tanabe, K., Kranjc, A., Baasansuren, J., Fukuda, M., Ngarize, S., et al. (eds). Switzerland: IPCC.
IPCC (2019b). Summary for Policymakers. In: Climate Change and Land: an IPCC special report on climate change, desertification, land degradation, sustainable land management, food security, and greenhouse gas fluxes in terrestrial ecosystems. Shukla, P.R.,Skea, J, Calvo Buendia, E., Masson-Delmotte, V., Pörtner, H.- O., Roberts, D. C., et al. (eds). Geneva.
IPCC (2021). “Summary for policymakers,” in Climate Change 2021: The Physical Science Basis. Contribution of Working Group I to the Sixth Assessment Report of the Intergovernmental Panel on Climate Change, eds V. Masson-Delmotte, P. Zhai, A. Pirani, S. L. Connors, C. Péan, S. Berger, N. Caud, Y. Chen, L. Goldfarb, M. I. Gomis, M. Huang, K. Leitzell, E. Lonnoy, J. B. R. Matthews, T. K. Maycock, T. Waterfield, O. Yelekçi, R. Yu, and B. Zhou (Cambridge; New York, NY: Cambridge University Press). doi: 10.1017/9781009157896
IPCC (2022). Summary for Policymakers. In: Climate Change 2022: Impacts, Adaptation, and Vulnerability. Pörtner, H.-O., Roberts, D.C., Poloczanska, E.S., Mintenbeck, K., Tignor, M., Alegría, A., et al. (eds). Cambridge: Cambridge University Press.
ISO (2022). ISO/TR 14069:2013, Greenhouse gases, quantification and reporting of greenhouse gas emissions for organizations, guidance for the application of ISO 14064-1. Available online at: https://www.iso.org/standard/43280.html (accessed January 26, 2022).
Milne, E., Neufeldt, H., Smalligan, M., Rosenstock, T., Bernoux, M., Bird, N., et al. (2012). Methods for the Quantification of Emissions at the Landscape Level for Developing Countries in Smallholder Contexts. CCAFS Report No. 9. Copenhagen, Denmark: CGIAR Research Program on Climate Change, Agriculture and Food Security (CCAFS).
Myhre, G., Shindell, D., Bréon, F.-M., Collins, W., Fuglestvedt, J., Huang, J., et al. (2013). Anthropogenic and Natural Radiative Forcing. In: Climate Change 2013: The Physical Science Basis. Contribution of Working Group I to the Fifth Assessment Report of the Intergovernmental Panel on Climate Change. Stocker, T.F., Qin, D., Plattner, G.-K., Tignor, M., Allen, S.K., Boschung, J., et al. (eds). Cambridge & New York: Cambridge University Press.
Schiettecatte, L-S., Audebert, P., Umulisa, V., Dionisio, D., and Bernoux, M. (2022). Technical Guidance to the Nationally Determined Contribution Expert Tool, NEXT. Rome: FAO.
Toudert, A., Braimoh, A., Bernoux, M., St-Louis, M., Abdelmagied, M., Bockel, L., et al (2018). Carbon Accounting Tools for Sustainable Land Management. Washington, DC.: World Bank. Available online at: https://openknowledge.worldbank.org/handle/10986/31062 License: CC BY 3.0 IGO.
UNEP (2021). Emissions Gap Report 2021: The Heat Is On – A World of Climate Promises Not Yet Delivered. Nairobi.
UNFCCC (2021). Nationally Determined Contributions Under the Paris Agreement, Synthesis Report by the Secretariat. Bonn. Available online at: https://unfccc.int/sites/default/files/resource/cma2021_08E.pdf (accessed December 29, 2021).
UNFCCC (2022a). The Paris Agreement. Available online at: https://unfccc.int/sites/default/files/english_paris_agreement.pdf (accessed February 28, 2022).
UNFCCC (2022b). Messages to Parties and Observers, nationally determined contributions synthesis report. Available online at: https://unfccc.int/sites/default/files/resource/message_to_parties_and_observers_on_ndc_numbers.pdf (accessed February 16, 2022).
UNFCCC (2022c). The Glasgow Climate Pact, draft text on 1/CMA.3, version 13/11/2021, 08:00. Available online at: https://unfccc.int/sites/default/files/resource/cma3_auv_2_cover%20decision.pdf (accessed February 15, 2022).
UNFCCC (2022d). Ghana's Intended Nationally Determined Contribution (iNDC) and Accompanying Explanatory Note. Available online at: https://www4.unfccc.int/sites/ndcstaging/PublishedDocuments/Ghana%20First/GH_INDC_2392015.pdf (accessed February 15, 2022).
UNFCCC (2022e). Report of the Conference of the Parties serving as the meeting of the Parties to the Paris Agreement on the third part of its first session, held in Katowice from 2 to 15 December 2018. Available online at: https://unfccc.int/sites/default/files/resource/CMA2018_03a02E.pdf (accessed February 25, 2022).
UNFCCC (2022f). Communication of Long-Term Strategies. Available online at: https://unfccc.int/process/the-paris-agreement/long-term-strategies (accessed February 24, 2022).
Keywords: Paris Agreement, Nationally Determined Contribution (NDC), long-term strategy, GHG accounting, AFOLU, climate change mitigation, Rio Conventions, social value of carbon
Citation: Schiettecatte L-S, Audebert P, Umulisa V, Dionisio D and Bernoux M (2022) The Nationally Determined Contribution Expert Tool (NEXT): A Comprehensive Greenhouse Gas Accounting Tool to Support Annual Environmental Impact Assessment Over a 30-Year Time Series in the Agriculture, Forestry and Other Land Use Sector. Front. Clim. 4:906142. doi: 10.3389/fclim.2022.906142
Received: 28 March 2022; Accepted: 26 May 2022;
Published: 22 June 2022.
Edited by:
Rebecca Louise Rowe, Center for Environmental Health, United StatesReviewed by:
José Luis Vicente-Vicente, Leibniz Center for Agricultural Landscape Research (ZALF), GermanyDilip Khatiwada, Royal Institute of Technology, Sweden
Copyright © 2022 Schiettecatte, Audebert, Umulisa, Dionisio and Bernoux. This is an open-access article distributed under the terms of the Creative Commons Attribution License (CC BY). The use, distribution or reproduction in other forums is permitted, provided the original author(s) and the copyright owner(s) are credited and that the original publication in this journal is cited, in accordance with accepted academic practice. No use, distribution or reproduction is permitted which does not comply with these terms.
*Correspondence: Laure-Sophie Schiettecatte, lauresophie.schiettecatte@fao.org