Assessing the impact of the recent warming in the East China Sea on a torrential rain event in northern Kyushu (Japan) in early July 2017
 Atsuyoshi Manda
 Satoshi Iizuka
 Hisashi Nakamura
 Takafumi Miyasaka
- 1Graduate School of Bioresources, Mie University, Tsu, Japan
- 2Storm, Flood, and Landslide Research Division, National Research Institute for Earth Science and Disaster Resilience, Tsukuba, Japan
- 3Research Center for Advanced Science and Technology, The University of Tokyo, Tokyo, Japan
Sea surface temperature (SST) in the East China Sea (ECS) has undergone a rapid rise in recent decades, but the associated impact on extreme weather remains under debate. Here, using a cloud-permitting model, we assess the impact of the ECS warming observed since the 1980s on a torrential rain event that caused devastating floods and landslides in the Kyushu Island, western Japan, in July 2017. Without the increasing trends of SST and air temperature, the model cannot reproduce the observed extremely high amount of precipitation during the event, i.e., >700 mm/12-h. The SST increase is found more influential in determining the precipitation amount. Without the ocean warming, increases in precipitable water and horizontal moisture transport due to the atmospheric warming would not lead to precipitation increase during this event. The change in the amount of precipitation can be largely explained by the change in the updraft intensity of the convective system. Higher SST suppresses downward surface sensible heat flux and enhances upward latent heat flux along the paths of air parcels flowing into the convective system in this case. This increases the equivalent potential temperature in the lower troposphere, which enhances the convective available potential energy in the lower troposphere, leading to intensification of the convective system and thereby the increase of precipitation. The findings of this case study suggest an important role of the warming ECS in the intensification of torrential rain events around Japan and the necessity of further assessment of the role of the ocean warming in the torrential rains.
Introduction
Sea surface temperature (SST) in the East China Sea (ECS) and along the Kuroshio has increased rapidly since the beginning of the twentieth century (e.g., Wu et al., 2012). Recent numerical and observational studies demonstrated that turbulent heat fluxes over regions of the ECS with high SST, such as along the Kuroshio, destabilize atmospheric stratification and intensify mesoscale convective systems (e.g., Miyama et al., 2012; Kunoki et al., 2015; Sato et al., 2016). Although the importance of assessing the impacts of rising SST on extreme weather has been suggested (Trenberth et al., 2015), the corresponding research effort has been rather limited. East Asia has experienced devastating floods in recent years (e.g., Hirockawa et al., 2020; Choi et al., 2021; Zhou et al., 2021). However, the influence of the ECS warming over recent decades on torrential rain events in East Asia have not been fully explored. This study aims to investigate the impact of the rising SST trend over recent decades on extreme weather, with primary focus on a test case of a torrential rain event that occurred in the Kyushu Island, Japan on July 5, 2017 (Figure 1). In that event, line-shaped quasi-stationary convective systems, as a typical type of precipitation systems that often lead to severe flooding and landslides in Japan (Unuma and Takemi, 2016), caused record-breaking rainfall with 24-h totals of >700 mm in the northern Kyushu Island (Kato et al., 2018; Takemi, 2018; Kawano and Kawamura, 2020; Tsuji et al., 2020). Severe flooding in that rainfall event caused more than 40 casualties and inundated more than 1,500 houses (Hirockawa et al., 2020). Despite its significance and severity, the impact of the warming ECS on that event has not yet been investigated comprehensively.
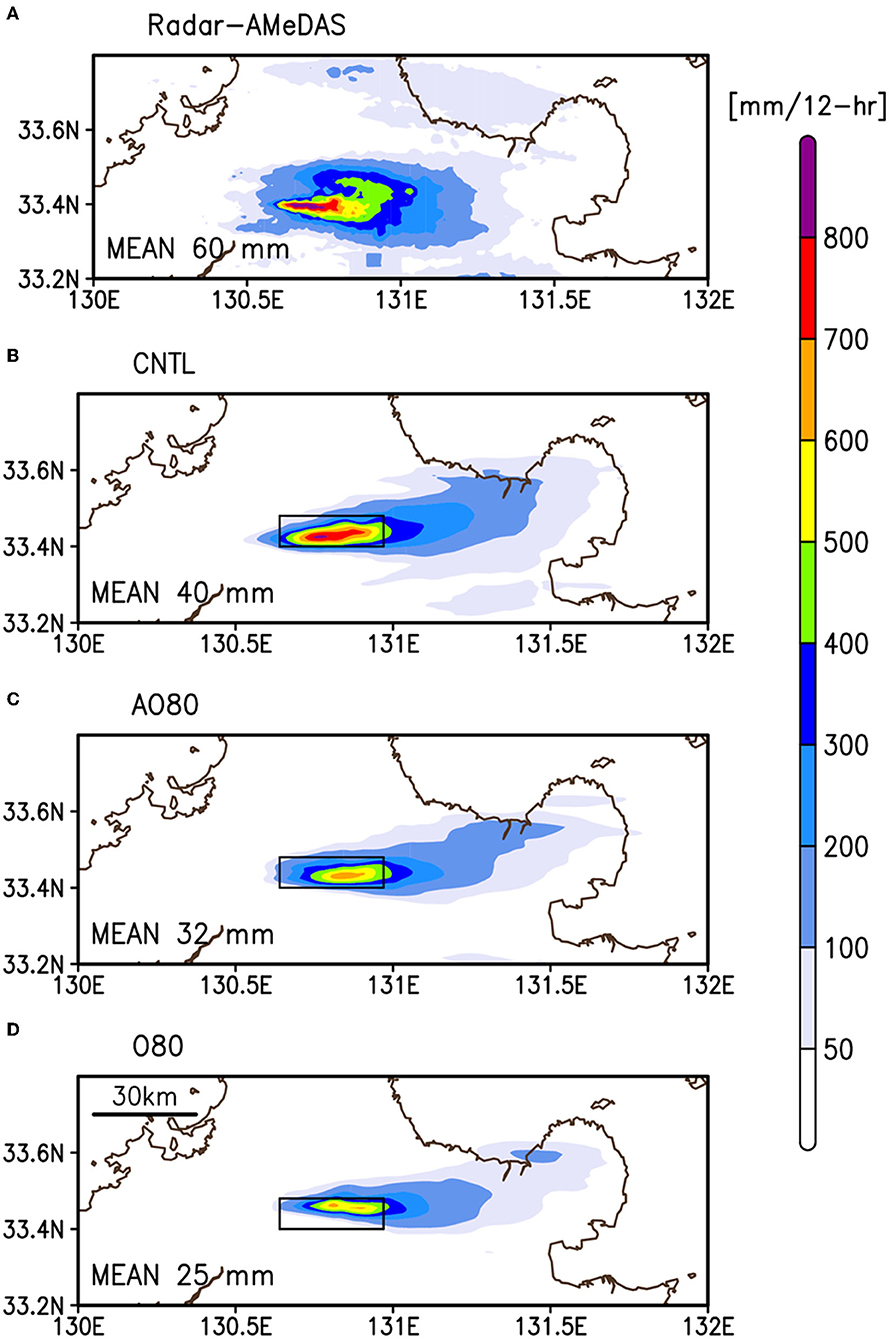
Figure 1. (A) Horizontal distribution of 12-h accumulated precipitation (mm) during 01:00–13:00 UTC on July 5, 2017, using a gridded radar and rain gauge precipitation analysis produced by the Japan Meteorological Agency. (B–D) Same as (A) but for the results of the CNTL, AO80, and O80 experiments, respectively. Rectangles in (B–D) were used for computing the area average of terms in Equation (1). Brown lines depict coastlines.
The primary objective of this study is to elucidate the responses of the mesoscale convective system and precipitation intensity during the rain event to the historical SST rise in the ECS since the 1980s, when satellite measurements of SST became operational. For this purpose, we have adopted the “storyline” approach to regional climate change information (Hazeleger et al., 2015; Shepherd et al., 2018). This approach aims to assess how the severity such as intensity of extreme events has changed due to historical warming, in contrast to another “risk-based” approach to estimate the changes in the probability of occurrence of individual extreme events (Shepherd, 2016).
An additional objective is to separate the contributions from the atmospheric and oceanic warmings. Through statistical data analysis, Fujibe (2015) suggested that the SST in the ECS and the precipitation intensity of extreme weather are correlated, but their high degree of collinearity prevented determination of the respective roles of the atmospheric and oceanic warmings. A long-term increasing trend of SST is not limited to the ECS but more ubiquitous in other ocean basins (Figure 2A). Moreover, state-of-the-art climate models indicate that SST in the global ocean will increase more rapidly than before under several Shared Socioeconomic Pathways (e.g., Kwiatkowski et al., 2020), which would increase the risk of occurrence of devastating torrential rain events (e.g., Manda et al., 2014). The findings of this case study may thus contribute to improving the assessment of future changes in extreme weather globally.
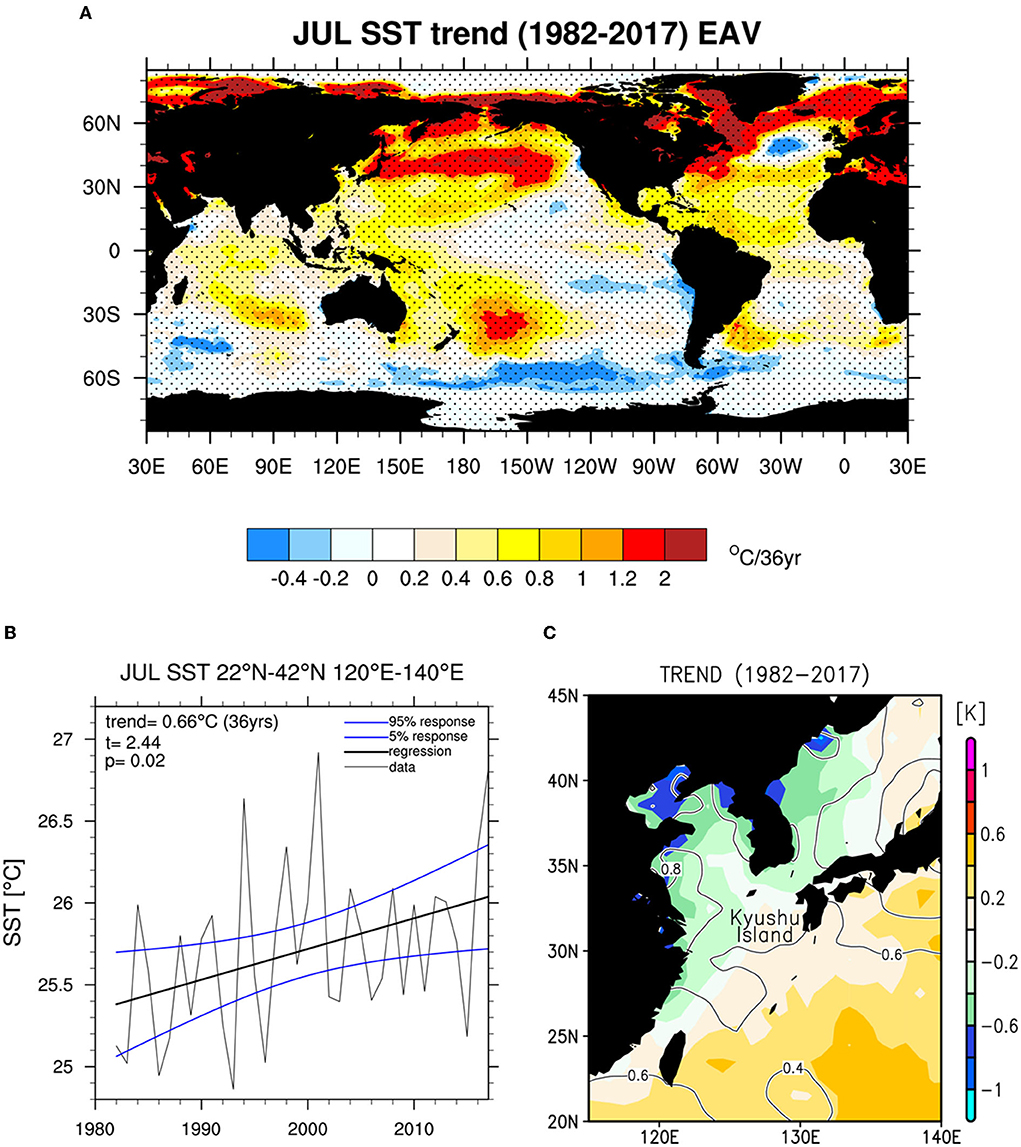
Figure 2. (A) Linear trend of monthly mean sea surface temperature (SST) in July during 1980–2017. Stippling indicates trends that are statistically significant at the 10% significance level. (B) Monthly–mean July SST averaged over (22°-42°N, 120°-140°E) (thin gray line), linear trend (thick gray line), and 95% confidence interval (blue lines). (C) Linear trends of (color) difference between monthly means of sea surface and surface air temperatures and (contour) monthly mean sea surface temperature in July during 1982–2017.
Event overview
The literature provides many detailed accounts of the rain event of July 5, 2017 (Kato et al., 2018; Takemi, 2018; Kawano and Kawamura, 2020; Nayak and Takemi, 2020; Tsuji et al., 2020); therefore, only a brief overview is presented here. Figure 3A shows the horizontal distribution of equivalent potential temperature (EPT) and horizontal winds in the lower troposphere, superimposed on the sea-level pressure, derived from the U.S. National Center for Environmental Prediction (NCEP) final analysis (FNL) averaged from 12:00 UTC July 4 to 12:00 UTC July 5, 2017. During the event, the southerly winds were dominant in the lower troposphere over the East China Sea. They transported warm and humid air, characterized by high EPT, from the tropics toward a zone of large EPT gradient located north of 34°N at around 130°E, which corresponds approximately to the Baiu frontal zone (e.g., Sampe and Xie, 2010).
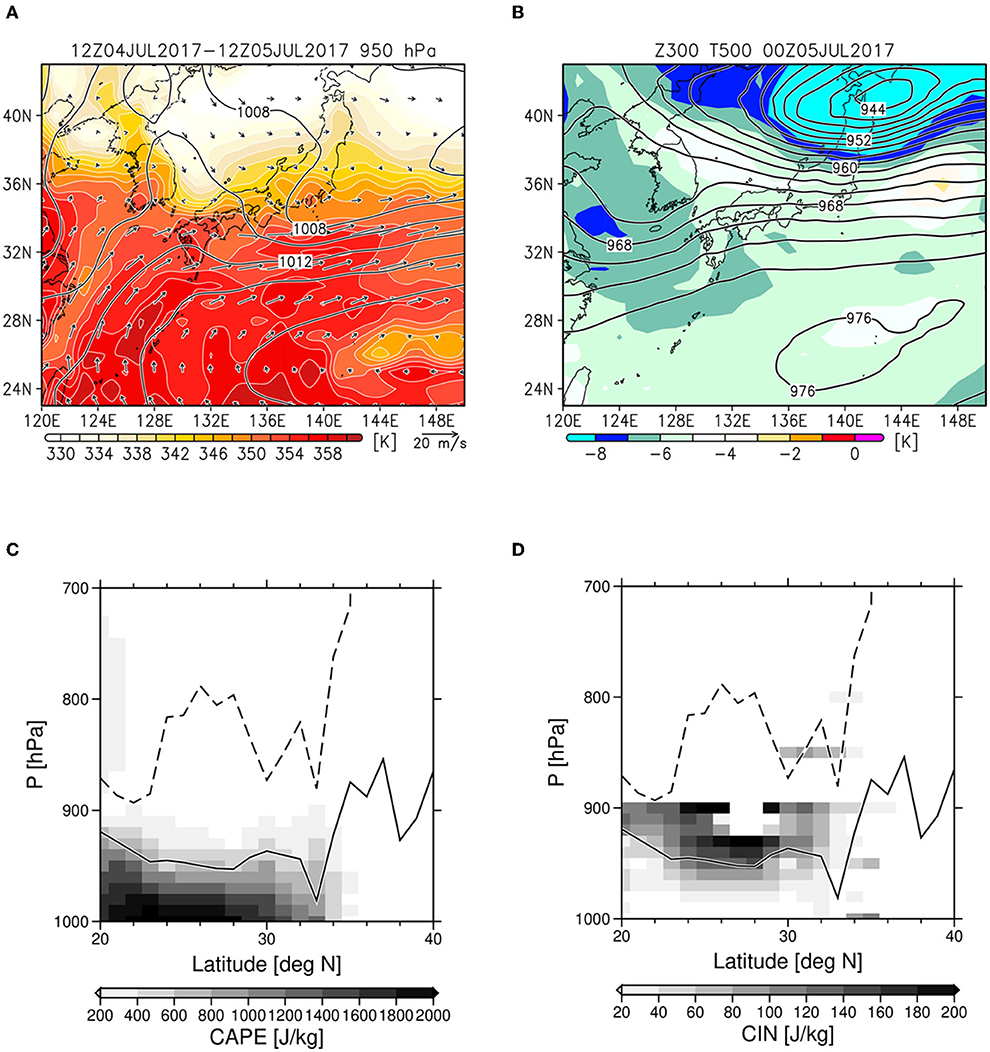
Figure 3. Maps of (A) sea level pressure (contours), equivalent potential temperature (colors), and horizontal wind velocity (arrows) at the 950-hPa level averaged during 12:00 UTC on July 4 to 12:00 UTC on July 5, 2017, and (B) geopotential height at the 300-hPa level in decameters (contours) and air temperature at the 500-hPa level (colors), derived from the NCEP FNL analysis. Latitude–pressure diagrams of (C) convective available potential energy (CAPE) and (D) convective inhibition (CIN) along 130°E. Solid and dashed lines indicate the lifting condensation level (LCL) and the level of free convection (LFC), respectively.
The EPT exceeded 356 K in the lowest part of the troposphere around the fringe of the Western Pacific Subtropical High (Figure 3A). This warm and humid airflow established a conditionally unstable environment to the south of the Baiu frontal zone, with high convective available potential energy (CAPE) and low convective inhibition (CIN) in the lower troposphere south of 34°N (Figures 3C,D). Both the lifting condensation level (LCL) and the level of free convection (LFC) were low around the Kyushu Island (~33°N), i.e., the LCL was well below 900 hPa, and the LFC was approximately at 850 hPa. Just before the beginning of the rain event, the Kyushu Island was situated downstream of an upper-tropospheric shortwave trough, where ascending motion was induced dynamically, with a cold air mass in the mid-troposphere (Figure 3B). This configuration provides one of the typical environmental conditions required for a high likelihood of deep moist convection over the Kyushu Island during the warm season.
Confluence of the airstreams from the south and north of the convective system (Kawano and Kawamura, 2020), possibly attributable in part to land–sea breeze (Ito et al., 2021), has been proposed to explain the stagnancy of the system that contributed to the observed high accumulated precipitation in the northern part of the Kyushu Island. Although insufficient representation of fine-scale topographic features in the northern Kyushu Island could cause an underestimation of the simulated precipitation (Takemi, 2018), a numerical simulation using an idealized setup with flat topography has shown that the inclusion of the realistic topography is not necessarily essential for reasonable reproduction of the observed precipitation amount and its horizontal distribution (Kawano and Kawamura, 2020).
Methods
Numerical model
The Weather Research and Forecasting model version 3.7.1 (Skamarock et al., 2008) was utilized for the numerical simulations conducted in this study. Triply nested domains with 30 vertical levels up to the 50-hPa level were employed for the simulations (Figure 4A). To resolve the convective systems explicitly during the event, the horizontal grid interval was set as high as 1 km within the model's innermost domain (D03). The grid intervals of the outer (D01) and intermediate (D02) domains were set to 9 and 3 km, respectively.
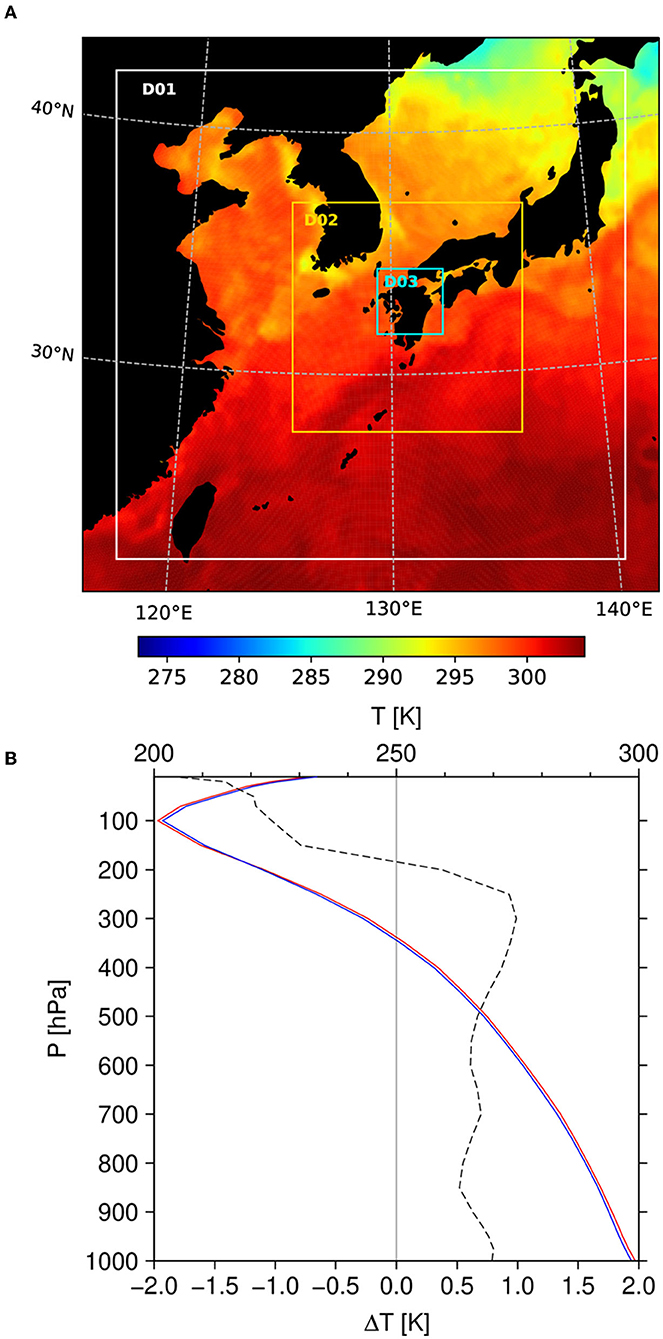
Figure 4. (A) Map showing SST (K) on July 5, 2017. Rectangles labeled D01, D02, and D03 indicate the domains of the triply nested numerical model used in this study. (B) Vertical profiles of monthly mean air temperature in July (upper axis) averaged over 22°-42°N, 120°-140°E in 1982 (blue line) and 2017 (red line), and their difference (dashed line, lower axis). Interannual variation has been removed by linear regression.
The model configuration including the list of subgrid-scale parameterization schemes used in the simulations are described in Table 1. No convective parameterization scheme was used in the innermost domain (D03) to represent convective clouds. This study follows the previous studies that examined the same rain event (Kawano and Kawamura, 2020; Nayak and Takemi, 2020) for the choice of the cumulus scheme in the outer and intermediate domains and the nesting method. We have confirmed that the model could not reproduce the amount of precipitation reasonably during the event without the cumulus schemes in these domains. The cumulus scheme in these domains is therefore needed to reproduce the convective system that caused the event. The use of the one-way nesting leads to a slight underestimation of the simulated amount of precipitation.
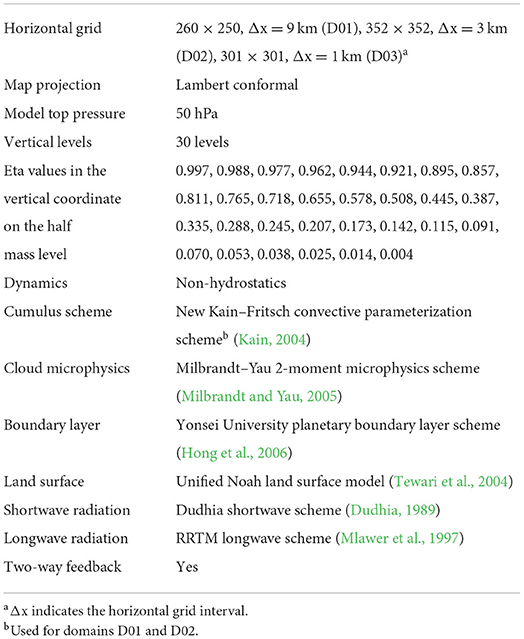
Table 1. Summary of the model configuration.
Experimental design
The control experiment (CNTL) was conducted to reproduce the event. In addition to the NCEP FNL atmospheric reanalysis data, the Global High-Resolution Sea Surface Temperature (GHRSST) Level 4 analysis (Naval Oceanographic Office, 2008) was utilized for the model's initial and lower boundary conditions, respectively (Figure 4A).
To examine the response of the mesoscale convective system to the recent warming of the ECS, this study configured two sensitivity experiments: AO80 and O80. In AO80, changes since the 1980s in both local SST and the domain-averaged vertical air–temperature profile (Figures 2A, 4B) were subtracted from the SST and atmospheric conditions observed during the main event, respectively. This experimental setup generally follows a typical methodology of the storyline approach (Hazeleger et al., 2015; Shepherd et al., 2018). In O80, only the local SST change was subtracted from the SST in CNTL, and air temperature in the initial and boundary conditions was the same as that in CNTL. The aim of conducting the two sensitivity experiments was to isolate the impact of the ocean warming.
Figure 4B shows the spatial mean of the long-term trend of air temperature around Japan (22°-42°N, 120°-140°E) in July averaged over the five atmospheric datasets, including the U.S. National Centers for Environmental Prediction/National Center for Atmospheric Research reanalysis 1 (NCEP1; Kalnay et al., 1996) and the U.S. National Centers for Environmental Prediction/Department of Energy Atmospheric Model Intercomparison Project reanalysis 2 (NCEP2; Kanamitsu et al., 2002), the European Centre for Medium-Range Weather Forecasts interim reanalysis data (ERA–Interim; Dee et al., 2011) and fifth-generation atmospheric reanalysis data, obtained from the European Centre for Medium-Range Weather Forecasts (ERA5; Hersbach et al., 2020), and Japanese 55-year Reanalysis (JRA55; Kobayashi et al., 2015). The vertical profile of the air temperature trend is nearly constant from the surface to the 250-hPa level. Above this level, the trend rapidly declines to become negative in the stratosphere, consistent with the well-known long-term temperature trend due to global warming. The same relative humidity distribution as used in CNTL was assigned as the initial and boundary conditions for AO80, because studies of global atmospheric moisture have found little long-term change in relative humidity concomitantly with the recent warming trend (Dai, 2006; Held and Soden, 2006; Willett et al., 2008).
A recent modeling study by Iizuka and Nakamura (2019) suggested that uncertainties in the various SST datasets could affect the amount of simulated precipitation. To reduce such uncertainty, the long-term trend averaged over the five SST datasets was utilized for the model's lower boundary condition, i.e., the Centennial Observation-Based Estimates of SST and marine meteorological variables (COBE; Ishii et al., 2005), Hadley Centre Sea Ice and Sea Surface Temperature dataset (HadISST; Rayner et al., 2003), the Extended Reconstructed Sea Surface Temperature version 4 (ERSST; Huang et al., 2014; Liu et al., 2014), Merged Satellite and In situ Data Global Daily Sea Surface Temperature (MGDSST; Sakurai et al., 2005), and Optimum Interpolation Sea Surface Temperature (OISST; Reynolds et al., 2007). Monthly-mean SST in July averaged over the adjacent maritime regions around the Japanese archipelago (22°-42°N, 120°-140°E) exhibits a long-term warming trend of 1.83 × 10⁻² K/year, corresponding to a rise of 0.66 K during 1982–2017 (Figure 2B). As evident in Figure 2C, the SST warming trend is greater than the trend of surface air temperature over most of the East China Sea (ECS) and the western North Pacific south of Japan, which indicates the SST warming is not forced locally by the atmospheric warming. Sasaki and Umeda (2021) indicates that the ECS warming during the last century was caused by the enhancement of horizontal oceanic heat transport, which was driven by the local atmospheric forcing over the continental shelf and the strengthening of the Kuroshio in the ECS (Wu et al., 2012). The latter is related to the intensification of the North Pacific Subtropical High, which may be attributable to the change in the sulfate aerosols and the greenhouse gases in the atmosphere (Toda and Watanabe, 2020).
After 6 hours of spin-up in domains D01 and D02 from 12:00 UTC on July 3, 2017, the simulations in D03 were initialized at 18:00 UTC on July 3, 2017, ~30 h before the occurrence of the rain event. Another set of simulations initialized at 12:00 UTC on July 3, 2017 in D03, was also conducted to assess the sensitivity to the initial conditions. The difference in the results between these sets of simulations was found small (figure not shown), and therefore the results described below were rather insensitive to the initial conditions and thus robust, at least between the two sets tested here.
Results
Control experiment
Figure 1B shows the horizontal distribution of the amount of precipitation during 01:00–13:00 UTC on July 5, 2017 (P12) in CNTL. Overall, the model reproduces the horizontal distribution of the observed precipitation (Figure 1A), including the location and intensity of the main precipitation band that caused the substantial amount of precipitation recorded during the event. Partly because a weak precipitation band observed to the north of the main band is missing, the simulated P12 averaged over [33.2°-33.8°N, 130°-132°E] in CNTL (40 mm) is less than observed (60 mm). The observed main precipitation band is meridionally broader than the simulated precipitation band. It could be caused by some local maxima of the observed hourly precipitation, which have not been reproduced by the model used in this study. A vertical cross section of simulated radar reflectivity in CNTL shows consecutive development of convective clouds in the downwind direction (Figure 5D), typical of quasi-stationary convective precipitation bands that cause severe flooding and landslides during the warm season in Japan. Figure 6 shows histograms of the number of 1 × 1 km grids of P12. Unlike in the observations (Figure 6A), CNTL does not simulate a local maximum P12 exceeding 900 mm (Figure 6B). Still, it successfully reproduces such extreme local P12 that exceeds 800 mm. The response of the precipitation during this event to SST changes is discussed in the following subsection.
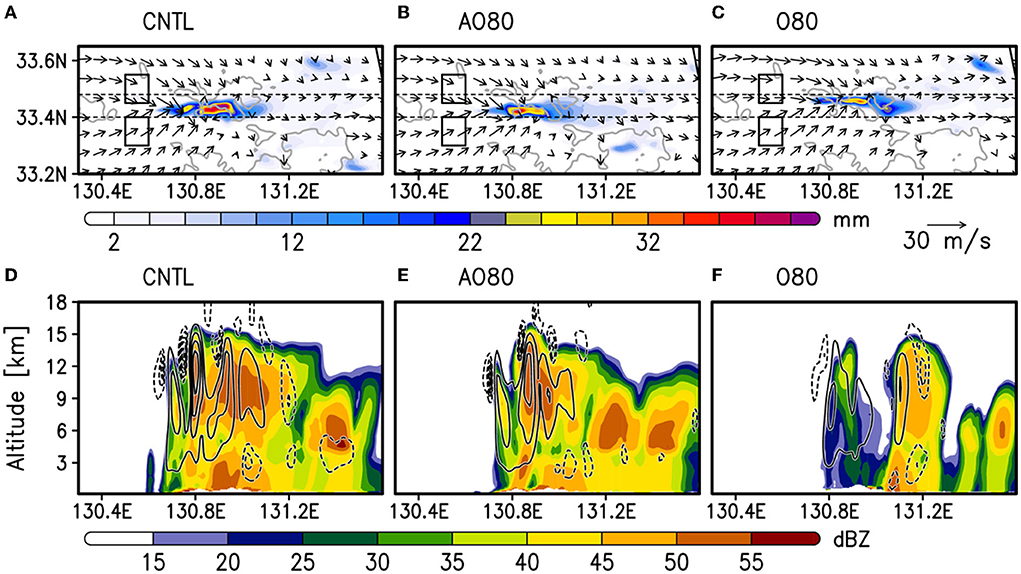
Figure 5. (A–C) Horizontal distributions of 10-min precipitation (colors) and horizontal wind (arrows) at the height of 600 m at 05:50 UTC on July 5, 2017, almost when the 10-min precipitation reached its peak. Rectangles indicate the domains used for computing backward trajectories and time–height variations shown in Figures 10, 12, respectively. Gray contours indicate 500-m topography. (D–F) Cross sections of simulated radar reflectivity in dBZ (colors), and upward (solid lines) and downward (dashed lines) velocities at intervals of 5 and 1 m/s, respectively. All quantities displayed in (D–F) are meridional averages over 33.4°-33.5°N.
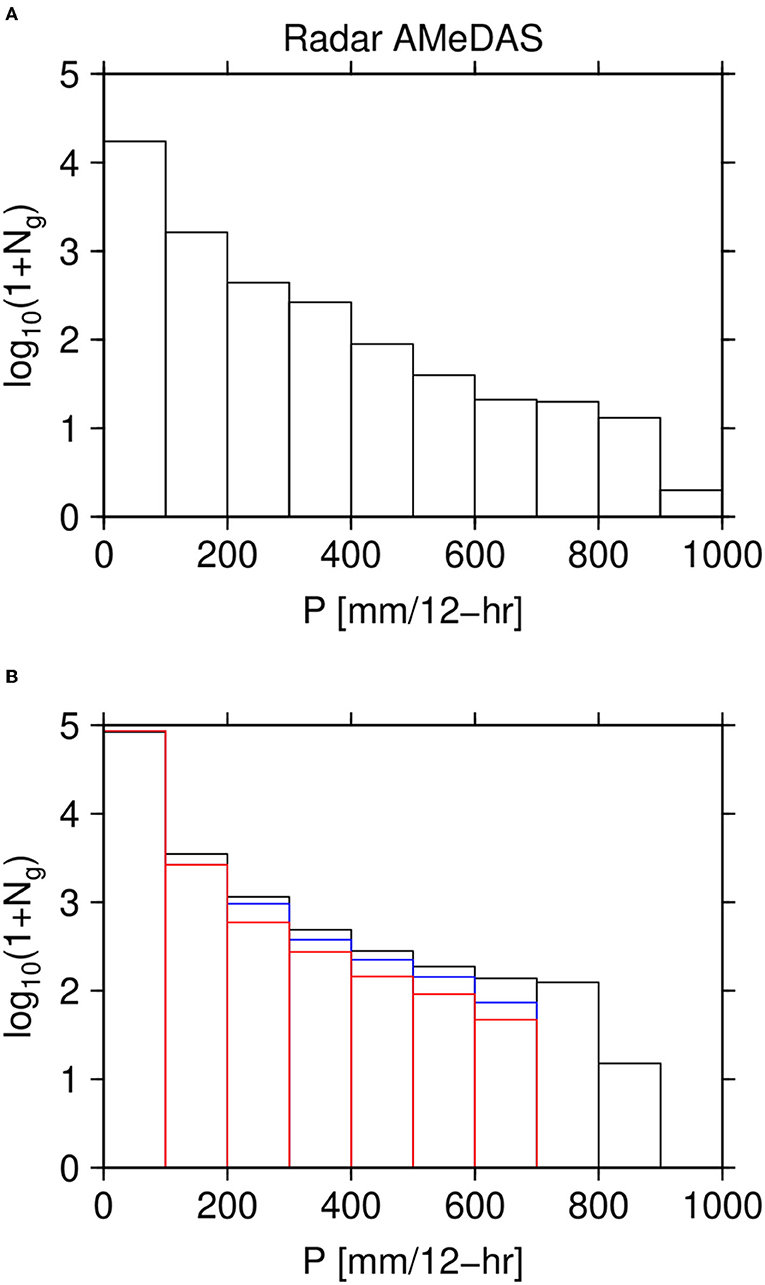
Figure 6. Histograms showing the number of 1 × 1 km grids (Ng) of 12-h precipitation during 01:00–13:00 UTC on July 5, 2017, in (A) radar and rain gauge analysis and (B) numerical experiments conducted in this study. Black, blue, and red columns in (B) indicate CNTL, AO80, and O80, respectively.
Sensitivity experiments
P12 in CNTL shows an obvious increase in precipitation relative to AO80, with a fractional increase of about 20% within the main precipitation band (Figure 1). It exceeds the value expected from the Clausius–Clapeyron (CC) relationship (~6%/K at 20°C) and is at least qualitatively consistent with estimates indicated previously in a data analysis study (Utsumi et al., 2011). Recent numerical modeling studies of torrential rain events have also shown such large changes in the amount of precipitation (Meredith et al., 2015; Volosciuk et al., 2016). The simulated radar reflectivity and updraft velocity in CNTL indicate that the convective systems simulated are stronger and apparently more organized than those simulated in AO80 and O80 (Figure 5). The histograms in Figure 6B indicate that both AO80 and O80 fail to simulate extreme local P12 exceeding 700 mm, consistent with the substantial weakening of the convective systems for the lack of the warming trends. Furthermore, the frequency of local P12 exceeding 100 mm in O80 is less than in any other simulations. These results highlight the particular importance of the SST warming in the extreme precipitation observed during this event.
The fractional change in precipitation intensity, δP/P, can be approximately scaled using the dry static energy (DSE) budget (e.g., Muller et al., 2011):
where the brackets and subscript C indicate the vertical integral from the surface to 20 km in altitude and values in CNTL, respectively, δ is the difference in CNTL from another experiment, P the precipitation amount, z the vertical coordinate directed upward, w vertical velocity, and qsat the saturation water vapor mixing ratio. The first and second terms on the RHS of Equation (1) correspond to the changes due to the differences in w and the vertical gradient of qsat, referred to as the dynamic and thermodynamic terms, respectively (e.g., Muller et al., 2011; Fildier et al., 2017). Note that the denominator in Equation (1) is negative in the spatial and/or temporal mean sense in the convective system. The residual term (RES) includes several processes that are neglected on the RHS of Equation (1), e.g., change in precipitation efficiency, effect of horizontal advection, and covariance of differences in w and vertical gradient of qsat. Figure 7 shows the fractional contributions to P12 from the individual terms of Equation (1) in the rectangular domain indicated in Figure 1, where P12 in CNTL exceeds 500 mm and its changes from AO80 and O80 are largest. The dynamic term can explain the majority of the fractional change in P12 both in AO80 and in O80 from CNTL, and the thermodynamic term plays only a secondary role. This evaluation indicates that the more vigorous upward motion contributes to the increase in the precipitation amount in CNTL. This result is consistent with the recent observational study on the torrential rains in mid-latitudes (Lenderink et al., 2017), but in contrast to the results of some numerical simulations of convective systems over the tropical oceans where the thermodynamic term dominates over the dynamic term (e.g., Muller et al., 2011; Fildier et al., 2017). Unlike previous simulation studies for the tropical maritime regions, the reduction in lower-tropospheric upward velocity from CNTL is relatively small and its negative contribution to the dynamic term does not dominate (Figure 8).
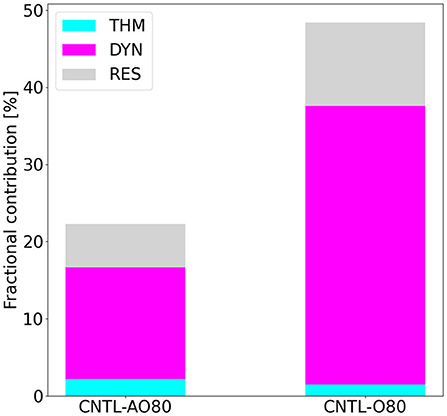
Figure 7. Fractional contribution to the changes in 12-h precipitation averaged over the rectangular domain shown in Figure 1, evaluated using the dry static energy budget equation. Cyan, magenta, and gray colors indicate thermodynamic, dynamic, and residual terms, respectively.
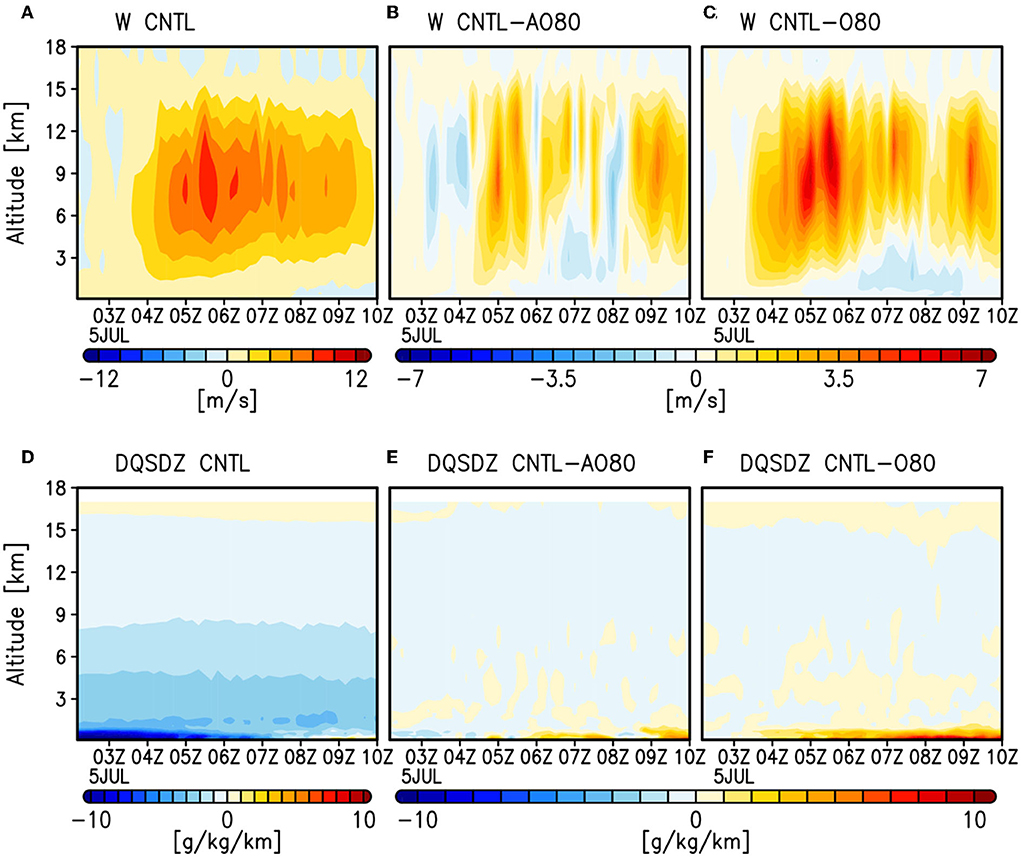
Figure 8. Time–height diagrams of (A–C) vertical velocity and (D,E) vertical gradient of saturated water vapor mixing ratio, averaged over the rectangular domain shown in Figure 1. (A,D) CNTL, (B,E) differences between CNTL and AO80, and (C,F) differences between CNTL and O80.
Figure 9 shows the moisture budget averaged within the area around the convective system, which is based on the following equation of vertically integrated moisture flux convergence:
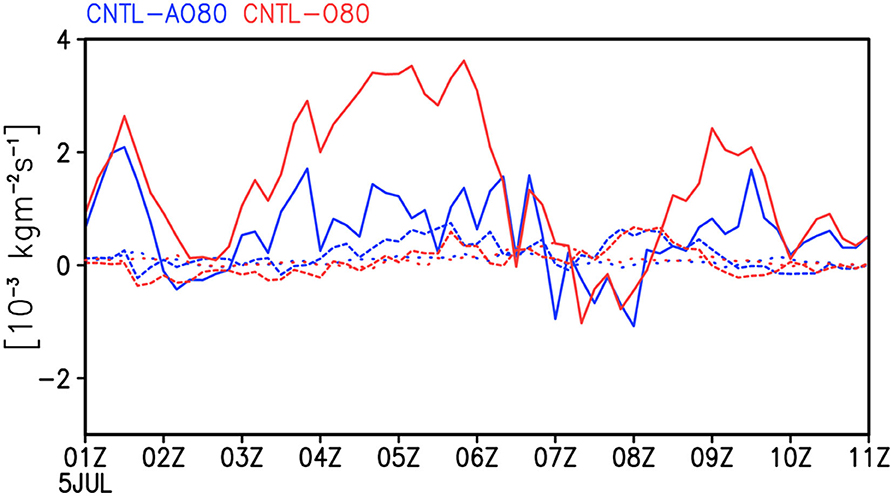
Figure 9. Vertically integrated moisture flux convergence averaged over the area surrounding the convective system (33.3°-33.6°N, 130.4°-131.5°E) as the differences of CNTL—AO80 (blue lines) and CNTL—O80 (red lines). Solid, dashed, and dotted lines indicate dynamic, thermodynamic, and residual terms, respectively.
where q represents water vapor mixing ratio and v horizontal wind velocity. Similar to Equation (1), the first, second, and third terms on the RHS of this equation are referred to as the dynamic, thermodynamic and residual terms, respectively. As in the DSE budget discussed above, the dynamic term in Equation (2) dominates in the inter-experiment differences in moisture convergence during the period when the precipitation intensity maximized (i.e., 03:00–07:00 UTC on July 5, 2017). This result suggests feedback between the intensification of the updraft (hence horizontal mass convergence) and increase in water vapor that fuels this convective updraft. The reduction in the moisture convergence in O80 is much larger than in AO80, indicating that SST change plays an essential role in the feedback.
Figure 10 shows the backward trajectories of air parcels originating around the centroids of the rectangular domains shown in Figure 5. The wind field in the domain D02 was used in this analysis. The trajectories using the D03 wind field are very similar to those shown in Figure 10, at least within the domain D03 (not shown). Figure 10 suggests that the near-surface air flowing into the convective system came from the west–southwest of northern Kyushu. It has been confirmed that no substantial changes are found in the air parcel trajectories if the initiation time is shifted slightly, owing to the almost steady low-level southwesterly winds around the edge of the Western Pacific Subtropical High (Figure 3A). Time–latitude diagrams of precipitable water along the meridian just to the west of the Kyushu Island (129.3°E) show that the fractional increase of precipitable water in O80 relative to that in AO80 is ~7% (Figure 11A), reflecting the recent atmospheric warming. Likewise, the eastward component of the vertically integrated moisture transport increases by the same order (~6%; Figure 11B). The precipitable water and vertically integrated moisture transport in O80 are larger than those in AO80 since the air temperature and relative humidity in the initial and lateral boundary conditions in O80 are set to the same values as those in CNTL. However, such increases in precipitable water and integrated moisture transport in O80 relative to AO80 contributed to neither the intensification of the convective system (Figure 5) nor the increase in the amount of precipitation (Figure 1). These results corroborate the findings in the DSE and water vapor budget analyses, i.e., intensification of the convective system and increase in the precipitation amount in CNTL is attributable primarily to more vigorous updraft and mass convergence.
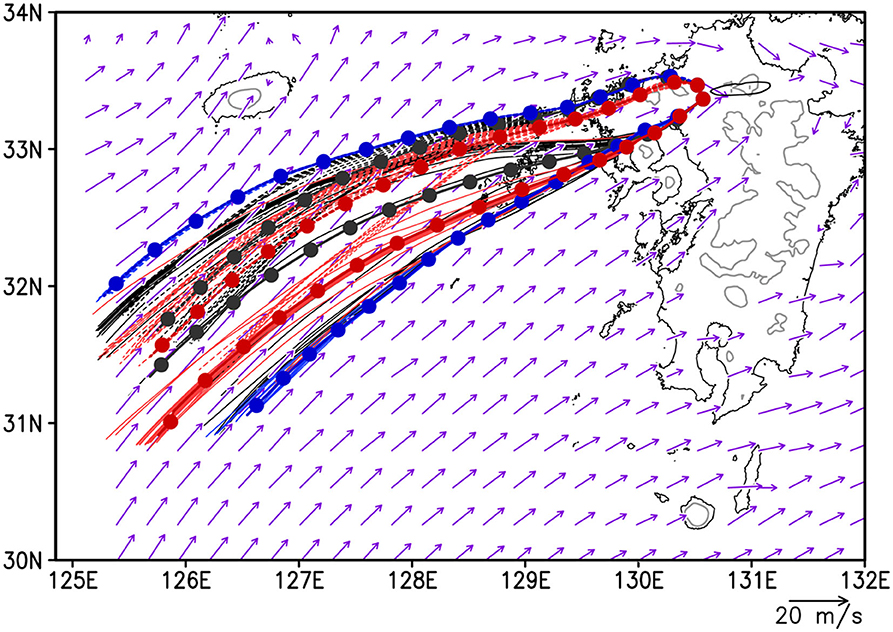
Figure 10. Backward trajectories of air parcels that originated from the 1 × 1 km grids located to the southwest [33.35°N, 130.55°E] (solid lines) and northwest [33.45°N, 130.5 °E] (dashed lines) of the western tip of the convective system in CNTL (black), AO80 (blue), and O80 (red). In each of the experiments 25 air parcels placed initially at 0.2-km intervals at a height of 300 m in each of the grids were released at 05:00 UTC on July 5, 2017. Circles and thick lines indicate the mean locations of the 25 parcels at 1-h intervals and the mean paths, respectively. Arrows indicate horizontal winds at 0.3-km height at 05:00 UTC on July 5, 2017. Black contour indicates the amount of precipitation of 250 mm/12-h during 01:00–13:00 UTC on July 5, 2017. Gray contours indicate 500-m topography.
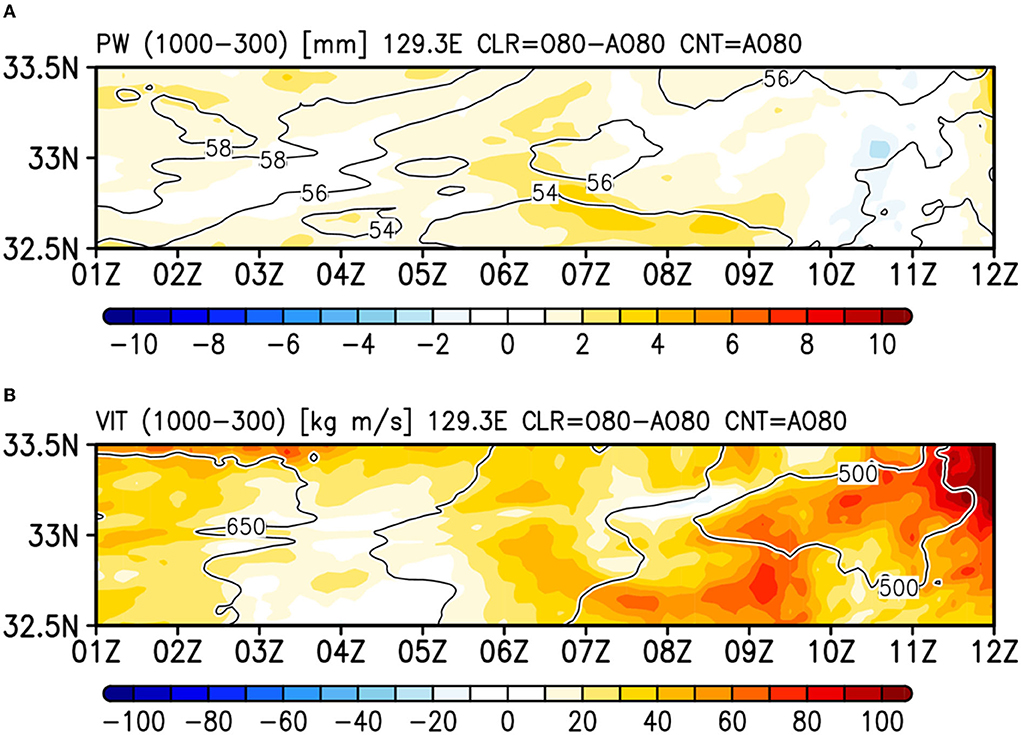
Figure 11. Time–latitude diagrams of (A) precipitable water and (B) eastward component of the water vapor flux integrated vertically from 1,000 to 300 hPa along the meridian to the west of Kyushu Island (130.3°E). Contours and colors indicate AO80 and the differences between O80 and AO80, respectively.
Time–height variations of the CAPE and LFC in the area to the southwest of the western tip of the main precipitation band (indicated by the southernmost rectangles in Figure 5) are shown in Figures 12A–F. The CAPE in CNTL exceeds 1.4 kJ kg−1 in the lowest 500 m. The CAPE in CNTL is larger than that in AO80 and O80. The corresponding variations in the northern domain shown in Figure 5 are found similar (figure not shown). The increase in CAPE in CNTL relative to AO80 and O80 is not limited to the near-surface layer but extends above the top of the boundary layer. Such upward extension of the enhanced CAPE has been shown to increase the amount of precipitation by changing the degree of organization and intensification of convective systems (Takemi, 2014), to which SST warming can contribute positively, as shown in this study. The LFC in CNTL is of the order of 500 m in the boundary layer. The difference in the LFC in the boundary layer among CNTL, AO80, and O80 is very small, and therefore it probably played only a minor role in the changes in the convective system. The vertical profiles of EPT and saturated equivalent potential temperature (SEPT) indicate that the increases in CAPE in CNTL relative to AO80 and O80 are mainly due to the increased EPT in the lower troposphere (Figures 12G–I). The decrease in SEPT in the mid-troposphere generally acts to increase CAPE. However, reduction in mid-tropospheric SEPT in AO80 does not lead to larger increase in CAPE, in comparison in O80 (Figures 12B,C). These results indicate that the SST change plays a fundamental role in the increase of CAPE and hence in the amount of precipitation in CNTL.
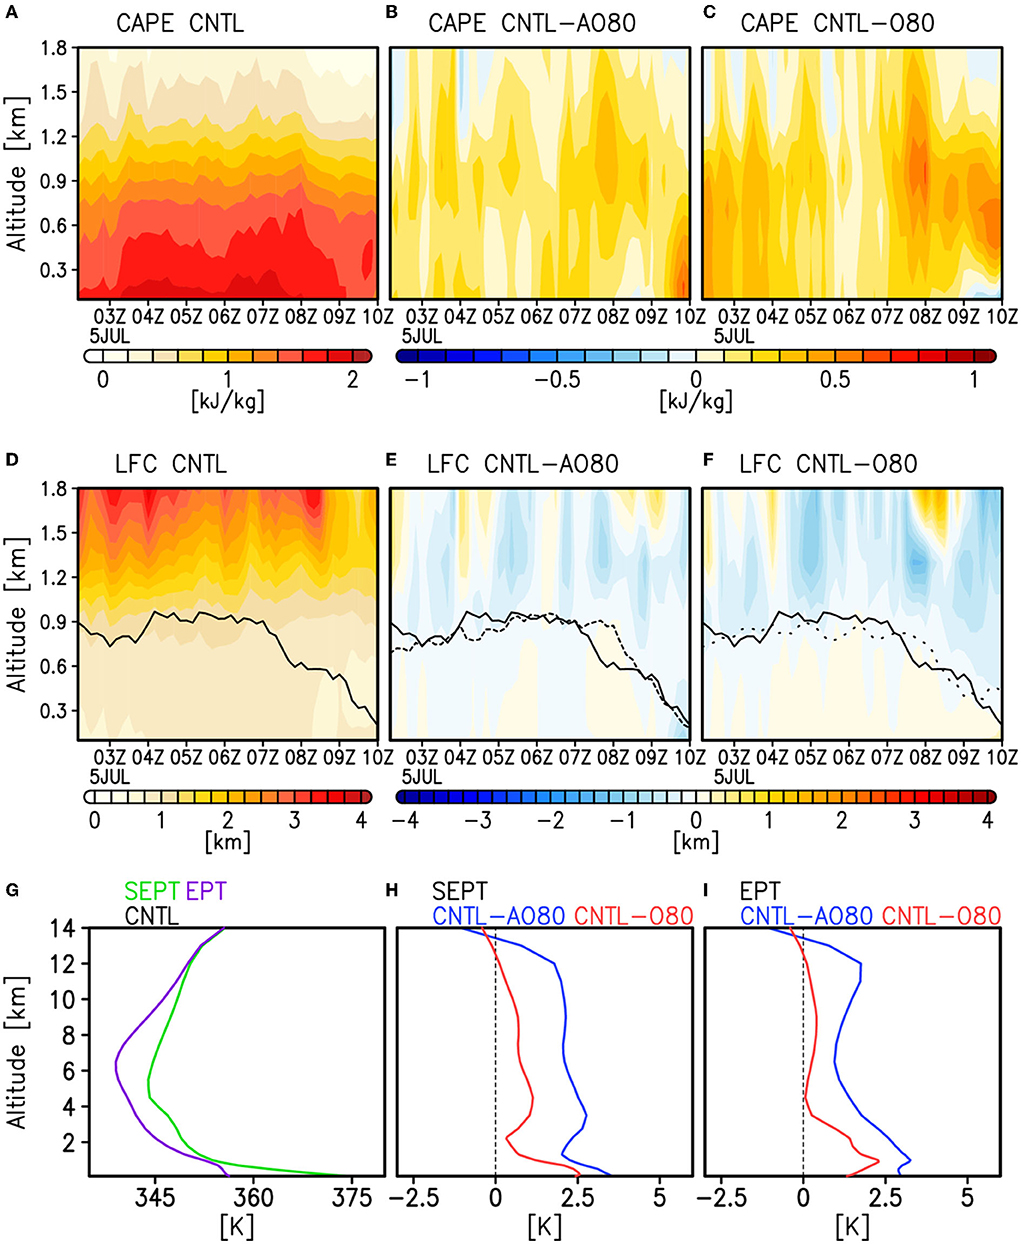
Figure 12. Time–height diagrams of (A–C) convective available potential energy (CAPE) and (D–F) level of free convection (LFC) averaged over the southern rectangle shown in Figure 5. (A,D) CNTL, (B,E) difference between CNTL and AO80, and (C,F) difference between CNTL and O80. Solid, dashed and dotted lines in (D–F) indicate the planetary boundary layer height in CNTL, AO80, and O80, respectively. Vertical profiles of (G) equivalent potential temperature (EPT) and saturated equivalent potential temperature (SEPT) in CNTL, and differences in (H) SEPT and (I) EPT between CNTL and AO80 and between CNTL and O80, averaged spatially over the southern rectangle shown in Figure 5 and averaged temporally over 02:00–10:00 UTC on July 5, 2017.
The changes in EPT in the lower troposphere described above must be related to the changes in surface heat fluxes (Figure 13). The magnitude of the latent heat flux (LHF) in CNTL during the day prior to the event is much larger than that of sensible heat flux (SHF), owing to the non-linear dependence of saturated water vapor pressure over the sea surface on the SST. The LHF in CNTL has increased on the order of 20 W m−2 (10 W m−2) compared with AO80 (O80) over the northern ECS. On the other hand, the SHF in CNTL has slightly increased from O80, but little changed from AO80. Figure 14 depicts modifications of the thermodynamic profiles of the air flowing into the convective system along the backward trajectories. In CNTL, SHF is downward during most of the period of tracking the parcels, while LHF is upward. Consequently, the near-surface potential temperature (water vapor mixing ratio) in CNTL gradually decreases (increases) as the air flows toward the Kyushu Island. The higher SST in CNTL reduces the downward surface SHF and thereby increases the near-surface potential temperature relative to AO80 and O80 as the air parcels approach the Kyushu Island. Simultaneously, the increased upward LHF in CNTL enhances the increase of near-surface water vapor mixing ratio. These processes contribute to the increase in lower-tropospheric EPT and hence to the intensification of the convective system in CNTL than in AO80 and O80. It might seem curious that the changes in potential temperature and water vapor mixing ratio in O80 relative to CNTL extend well above the boundary layer. This could be attributable to the earlier passage of Tropical Storm Nanmadol across the East China Sea (Supplementary Figure S1). A recent study highlighted the possible role of preceding weather disturbances in the preconditioning of the environment for torrential rain (e.g., Moteki, 2019). The topic is beyond the scope of this study, but it should be examined in future.
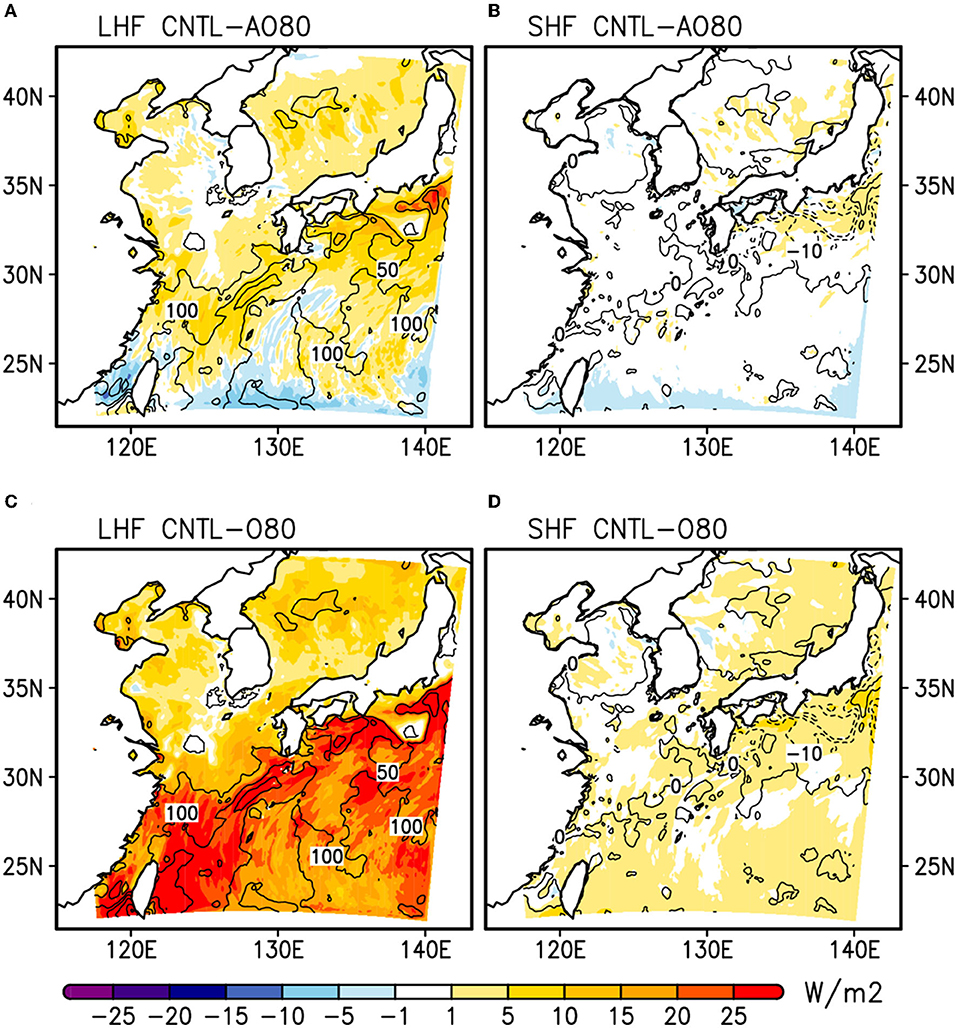
Figure 13. Horizontal distributions of the surface (A,C) latent and (B,D) sensible heat fluxes averaged from 00:00 UTC July 4 to 00:00 UTC July 5, 2017. Contours show the values in CNTL and colors indicate differences (A,B) between CNTL and AO80 and (C,D) between CNTL and O80.
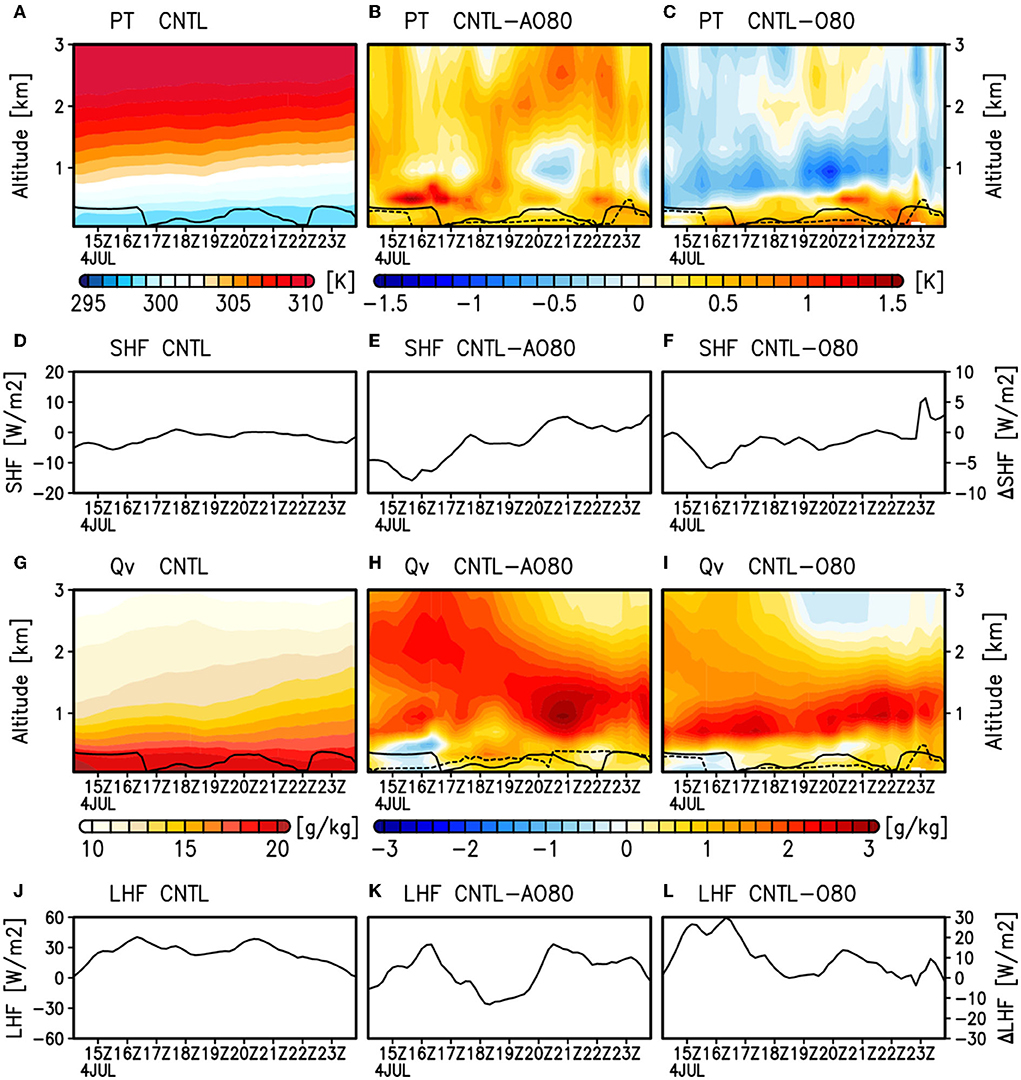
Figure 14. Time–height diagrams of (A–C) potential temperature and (G–I) water vapor mixing ratio, and time series of (D–F) surface sensible heat flux and (J–L) surface latent heat flux along the mean paths of the backward trajectories shown as thick solid lines in Figure 10. (A,D,G,J) CNTL, (B,E,H,K) difference between CNTL and AO80, and (C,F,I,L) difference between CNTL and O80. Solid and dotted lines in (A–C) and (G–I) indicate the planetary boundary layer height in (solid line) CNTL [dashed line in (B,H)] AO80, and [dashed line in (C,I)] O80.
Summary and discussion
Torrential rain events tend to occur more frequently in Japan (Fujibe, 2015) as well as in many other parts of the world (Meredith et al., 2015). Attributing such events to on-going global warming is not straightforward owing to large internal atmospheric variability in mid-latitudes (Hazeleger et al., 2015; Shepherd et al., 2018). Employing the storyline approach by focusing on known changes in SST (Trenberth et al., 2015), this study has assessed the impact of the ECS warming on a torrential rain event that occurred in the western part of Japan in 2017. Despite the dominant source of the warm–humid air responsible for such torrential rain events is in the Tropics and the sensible and latent heat fluxes over the extratropical oceans tend to be reduced in the warm season, this study has demonstrated that atmospheric warming and moistening over the ECS contributed positively to the extreme precipitation during the target event. Especially, we have shown that the SST rise observed in the last few decades played an essential role in enhancing the conditionally unstable conditions in the lower troposphere. We have also shown that the increase in precipitation was attributable primarily to enhanced updrafts, whereas the increased water vapor could not contribute positively without the SST rise.
As in previous modeling studies (Kato et al., 2018; Takemi, 2018; Kawano and Kawamura, 2020), the amount of precipitation was underestimated in this study. Uncertainties in the surface heat fluxes and hence the lower-tropospheric thermodynamic structure over the ECS could be one of the factors for this underestimation. Recent efforts to produce ocean surface flux data with higher accuracy (Tomita et al., 2019) and to provide ship-based monitoring of the moisture field over the ocean using the global navigation satellite system (Shoji et al., 2017; Ikuta et al., 2021) will provide indispensable information for improving numerical simulations.
The fractional change in the amount of precipitation produced in the experiments conducted in this study exceeds the CC scaling. Such super-CC scaling has been reported in recent studies (Lenderink et al., 2017; Hatsuzuka et al., 2021), but it remains debatable (e.g., Fildier et al., 2017). Recent studies indicate that the increase in the near-surface moistening causes the substantial increase in the amount of the precipitation of the mid-latitude torrential rains, consistent with the present study (Lenderink et al., 2017; Schumacher and Peters, 2017). This study demonstrated that the recent ECS warming contributed significantly to such near-surface moistening that lead to the intensification of the precipitation during the event. Although the analyses in this study indicate that the majority of the precipitation change is attributable to the enhanced updrafts and moisture convergence, it could be affected by other factors included in the residual term in Equation (1) and gray portion in the bar chart in Figure 7 (e.g., precipitation efficiency; Narsey et al., 2019). Further investigation on the mechanisms of the changes in precipitation intensity is reserved for future work.
It should be emphasized that the present study examined the impact of ocean warming on one specific rain event and therefore further assessment is needed to reach a more general conclusion on the oceanic impact on torrential rains. Convective systems that cause torrential rain events exhibit a spectrum of characteristics under various environmental synoptic conditions (Hamada et al., 2015). Synoptic-scale dynamical forcing is found to play a more important role in the July 2018 heavy rainfall event in comparison with the 2017 event (Tsuji et al., 2020; Yokoyama et al., 2020). A recent study highlighted the importance of continuous upgliding inflow of warm and humid air in the mid-troposphere in heavy rain events during the warm season in Japan (Tsuji et al., 2021). Comparative studies under various environmental synoptic conditions will be a fruitful way to achieve deeper understanding of the impact of the warming of the marginal seas on torrential rainfall events and thereby to contribute to more reliable future projections. In addition to case-specific experiments such as those of the present study, multiyear time-slice experiments will also be valuable for providing more reliable estimates of the impact of the long-term trend of SST on precipitation extreme from the statistical perspective (Cubasch et al., 1995).
Data availability statement
The raw data supporting the conclusions of this article will be made available by the authors, without undue reservation.
Author contributions
AM conceived the study and conducted the numerical experiments and data analysis. HN, SI, and TM provided comments and technical support on the experiments and analyses. All authors contributed to the writing of the article and approved the submitted version.
Funding
This work was supported in part by the Japan Society for Promotion of Science through Grants-in-Aid for Scientific Research (Grant Numbers: JP16H01844, JP17H02958, JP19H05697, JP19H05702, JP20H01970, and JP20H00289), by the Collaborative Research Program of the Research Institute for Applied Mechanics, Kyushu University (Grant Number: 2021 S3-3), and by the Environmental Restoration and Conservation Agency of Japan through Environment Research and Technology Development Fund JPMEERF20222002.
Acknowledgments
The authors thank the two reviewers for sound criticism and constructive comments and James Buxton, MSc, from Edanz (https://jp.edanz.com/ac) for editing a draft of this manuscript. Numerical simulations were performed on the supercomputing system of the National Research Institute for Earth Science and Disaster Resilience.
Conflict of interest
The authors declare that the research was conducted in the absence of any commercial or financial relationships that could be construed as a potential conflict of interest.
Publisher's note
All claims expressed in this article are solely those of the authors and do not necessarily represent those of their affiliated organizations, or those of the publisher, the editors and the reviewers. Any product that may be evaluated in this article, or claim that may be made by its manufacturer, is not guaranteed or endorsed by the publisher.
Supplementary material
The Supplementary Material for this article can be found online at: https://www.frontiersin.org/articles/10.3389/fclim.2022.967154/full#supplementary-material
References
Choi, S. K., Ramirez, R. A., and Kwon, T. H. (2021). Preliminary report of a catastrophic landslide that occurred in Gokseong County, South Jeolla Province, South Korea, on August 7, 2020. Landslides 18, 1465–1469. doi: 10.1007/s10346-020-01616-y
Cubasch, U., Waszkewitz, J., Hegerl, G., and Perlwitz, J. (1995). Regional climate changes as simulated in time-slice experiments. Clim. Change 31, 273–304. doi: 10.1007/BF01095150
Dai, A. (2006). Recent climatology, variability, and trends in global surface humidity. J. Clim. 19, 3589–3606. doi: 10.1175/JCLI3816.1
Dee, D. P., Uppala, S. M., Simmons, A. J., Berrisford, P., Poli, P., Kobayashi, S., et al. (2011). The ERA-Interim reanalysis: configuration and performance of the data assimilation system. Q. J. R. Meteorol. Soc. 137, 553–597. doi: 10.1002/qj.828
Dudhia, J. (1989). Numerical study of convection observed during the Winter Monsoon Experiment using a mesoscale two-dimensional model. J. Atmos. Sci. 46, 3077–3107. doi: 10.1175/1520-0469(1989)046<3077:NSOCOD>2.0.CO;2
Fildier, B., Parishani, H., and Collins, W. D. (2017). Simultaneous characterization of mesoscale and convective-scale tropical rainfall extremes and their dynamical and thermodynamic modes of change. J. Adv. Model. Earth Syst. 9, 2103–2119. doi: 10.1002/2017MS001033
Fujibe, F. (2015). Relationship between interannual variations of extreme hourly precipitation and air/sea-surface temperature in Japan. SOLA 11, 5–9. doi: 10.2151/sola.2015-002
Hamada, A., Takayabu, Y., Liu, C., and Zipser, E. J. (2015). Weak linkage between the heaviest rainfall and tallest storms. Nat. Commun. 6, 6213. doi: 10.1038/ncomms7213
Hatsuzuka, D., Sato, T., and Higuchi, Y. (2021). Sharp rises in large-scale, long-duration precipitation extremes with higher temperatures over Japan. NPJ Clim. Atmos. Sci. 4, 29. doi: 10.1038/s41612-021-00184-9
Hazeleger, W., van den Hurk, B., Min, E., van Oldenborgh, G. J., Petersen, A. C., Stainforth, D. A., et al. (2015). Tales of future weather. Nat. Clim. Change 5, 107–113. doi: 10.1038/nclimate2450
Held, I. M., and Soden, B. J. (2006). Robust responses of the hydrological cycle to global warming. J. Clim. 19, 5686–5699. doi: 10.1175/JCLI3990.1
Hersbach, H., Bell, B., Berrisford, P., Hirahara, S., Horányi, A., Muñoz-Sabater, J., et al. (2020). The ERA5 global reanalysis. Q. J. R. Meteorol. Soc. 146, 1999–2049. doi: 10.1002/qj.3803
Hirockawa, Y., Kato, T., Araki, K., and Mashiko, W. (2020). Characteristics of an extreme rainfall event in Kyushu district, southwestern Japan in early July 2020. SOLA 16, 265–270. doi: 10.2151/sola.2020-044
Hong, S.-Y., Noh, Y., and Dudhia, Y. (2006). A new vertical diffusion package with an explicit treatment of entrainment processes. Mon. Wea. Rev. 134, 2318–2341. doi: 10.1175/MWR3199.1
Huang, B., Banzon, V. F., Freeman, E., Lawrimore, J., Liu, W., Peterson, T. C., et al. (2014). Extended reconstructed sea surface temperature version 4 (ERSST.v4): part I. Upgrades and intercomparisons. J. Clim. 28, 911–930. doi: 10.1175/JCLI-D-14-00006.1
Iizuka, S., and Nakamura, H. (2019). Sensitivity of mid-latitude heavy precipitation to SST: a case study in the Sea of Japan area on 9 August 2013. J. Geophys. Res. 124, 4365–4381. doi: 10.1029/2018JD029503
Ikuta, Y., Seko, H., and Shoji, Y. (2021). Assimilation of shipborne precipitable water vapour by Global Navigation Satellite Systems for extreme precipitation events. Q. J. R. Meteorol. Soc. 148, 57–75. doi: 10.1002/qj.4192
Ishii, M., Shouji, A., Sugimoto, S., and Matsumoto, T. (2005). Objective analyses of sea surface temperature and marine meteorological variables for the 20th century using ICOADS and the Kobe Collection. Int. J. Climatol. 25, 865–879. doi: 10.1002/joc.1169
Ito, J., Tsuguchi, H., Hayashi, S., and Niino, H. (2021). Idealized high-resolution simulations of a back-building convective system that causes torrential rain. J. Atmos. Sci. 78, 117–132. doi: 10.1175/JAS-D-19-0150.1
Kain, J. S. (2004). The Kain-Fritsch convective parameterization: an update. J. Appl. Meteor. 43, 170–181. doi: 10.1175/1520-0450(2004)043<0170:TKCPAU>2.0.CO;2
Kalnay, E., Kanamitsu, M., Kistler, R., Collins, W., Deaven, D., Gandin, L., et al. (1996). The NCEP/NCAR 40-year reanalysis project. Bull. Am. Meteorol. Soc. 77, 437–471. doi: 10.1175/1520-0477(1996)077<0437:TNYRP>2.0.CO;2
Kanamitsu, M., Ebisuzaki, W., Woollen, J., Yang, S.-K., Hnilo, J. J., Fiorino, M., et al. (2002). NCEP-DOE AMIP-II reanalysis (R-2). Bull. Am. Meteorol. Soc. 83, 1631–1643. doi: 10.1175/BAMS-83-11-1631
Kato, R., Shimose, K., and Shimizu, S. (2018). Predictability of precipitation caused by linear precipitation systems during the July 2017 Northern Kyushu Heavy Rainfall Event using a cloud-resolving numerical weather prediction model. J. Disaster Res. 13, 846–859. doi: 10.20965/jdr.2018.p0846
Kawano, T., and Kawamura, R. (2020). Genesis and maintenance processes of a quasi-stationary convective band that produced record-breaking precipitation in northern Kyushu, Japan on 5 July 2017. J. Meteorol. Soc. Japan 98, 673–690. doi: 10.2151/jmsj.2020-033
Kobayashi, S., Ota, Y., Harada, Y., Ebita, A., Moriya, M., Onoda, H., et al. (2015). The JRA-55 reanalysis: general specifications and basic characteristics. J. Meteor. Soc. Japan 93, 5–48. doi: 10.2151/jmsj.2015-001
Kunoki, S., Manda, A., Kodama, Y.-M., Iizuka, S., Sato, K., Fathrio, I., et al. (2015). Oceanic influence on the Baiu frontal zone in the East China Sea. J. Geophys. Res. 120, 449–463. doi: 10.1002/2014JD022234
Kwiatkowski, L., Torres, O., Bopp, L., Aumont, O., Chamberlain, M., Christian, J. R., et al. (2020). Twenty-first century ocean warming, acidification, deoxygenation, and upper-ocean nutrient and primary production decline from CMIP6 model projections. Biogeosciences 17, 3439–3470. doi: 10.5194/bg-17-3439-2020
Lenderink, G., Barbero, R., Loriaux, J. M., and Fowler, H. J. (2017). Super-Clausius-Clapeyron scaling of extreme hourly convective precipitation and its relation to large-scale atmospheric conditions. J. Clim. 30, 6037–6052. doi: 10.1175/JCLI-D-16-0808.1
Liu, W., Huang, B., Thorne, P. W., Banzon, V. F., Zhang, H.-M., Freeman, E., et al. (2014). Extended reconstructed sea surface temperature version 4 (ERSST.v4): part II. Parametric and structural uncertainty estimations. J. Clim. 28, 931–951. doi: 10.1175/JCLI-D-14-00007.1
Manda, A., Nakamura, H., Asano, N., Iizuka, S., Miyama, T., Moteki, Q., et al. (2014). Impacts of a warming marginal sea on torrential rainfall organized under the Asian summer monsoon. Sci. Rep. 4, 5741. doi: 10.1038/srep05741
Meredith, E. P., Semenov, V. A., Maraun, D., Park, W., and Chernokulsky, A. V. (2015). Crucial role of Black Sea warming in amplifying the 2012 Krymsk precipitation extreme. Nat. Geosci. 8, 615–619. doi: 10.1038/ngeo2483
Milbrandt, J. A., and Yau, M. K. (2005). A multimoment bulk microphysics parameterization. Part I: analysis of the role of the spectral shape parameter. J. Atmos. Sci. 62, 3051–3064. doi: 10.1175/JAS3534.1
Miyama, T., Nonaka, M., Nakamura, H., and Kuwano-Yoshida, A. (2012). A striking early-summer event of a convective rainband persistent along the warm Kuroshio in the East China Sea. Tellus A 64, 18962. doi: 10.3402/tellusa.v64i0.18962
Mlawer, E. J., Taubman, S. J., Brown, P. D., Iacono, M. J., and Clough, S. A. (1997). Radiative transfer for inhomogeneous atmospheres: RRTM, a validated correlated-k model for the longwave. J. Geophys. Res. 102, 16663–16682. doi: 10.1029/97JD00237
Moteki, Q. (2019). Role of Typhoon Prapiroon (Typhoon No. 7) on the formation process of the Baiu front inducing heavy rain in July 2018 in western Japan. SOLA 15, 37–42. doi: 10.2151/sola.15A-007
Muller, C. J., O'Gorman, P. A., and Back, L. E. (2011). Intensification of precipitation extremes with warming in a cloud-resolving model. J. Clim. 24, 2784–2800. doi: 10.1175/2011JCLI3876.1
Narsey, S., Jakob, C. N., Singh, M. S., Bergemann, M., Louf, V., Protat, A., et al. (2019). Convective precipitation efficiency observed in the tropics. Geophys. Res. Lett. 46, 13574–13583. doi: 10.1029/2019GL085031
Naval Oceanographic Office (2008). K10 Global 10-km Analyzed SST dataset. Ver. 1.0. PO.DAAC. CA, USA.
Nayak, S., and Takemi, T. (2020). Clausius-Clapeyron scaling of extremely heavy precipitations: Case studies of the July 2017 and July 2018 heavy rainfall events over Japan. J. Meteor. Soc. Japan 98, 1147–1162. doi: 10.2151/jmsj.2020-058
Rayner, N. A., Parker, D. E., Horton, E. B., Folland, C. K., Alexander, L. V., Rowell, D. P., et al. (2003). Global analyses of sea surface temperature, sea ice, and night marine air temperature since the late nineteenth century. J. Geophys. Res. 108, 4407. doi: 10.1029/2002JD002670
Reynolds, R. W., Smith, T. M., Liu, C., Chelton, D. B., Casey, K. S., and Schlax, M. G. (2007). Daily high-resolution-blended analyses for sea surface temperature. J. Clim. 20, 5473–5496. doi: 10.1175/2007JCLI1824.1
Sakurai, T., Kurihara, Y., and Kuragano, T. (2005). “Merged satellite and in-situ data global daily SST,” in Proceedings of IEEE International Geoscience and Remote Sensing Symposium (Seoul), 2606–2608.
Sampe, T., and Xie, S. (2010). Large-scale dynamics of the Meiyu-Baiu rainband: environmental forcing by the westerly jet. J. Clim. 23, 113–134. doi: 10.1175/2009JCLI3128.1
Sasaki, Y. N., and Umeda, C. (2021). Rapid warming of sea surface temperature along the Kuroshio and the China coast in the East China Sea during the 20th century. J. Clim. 34, 4803–4815. doi: 10.1175/JCLI-D-20-0421.1
Sato, K., Manda, A., Moteki, Q., Komatsu, K. K., Ogata, K., Nishikawa, H., et al. (2016). Influence of the Kuroshio on mesoscale convective systems in the Baiu Frontal Zone over the East China Sea, Mon. Wea. Rev. 144, 1017–1033. doi: 10.1175/MWR-D-15-0139.1
Schumacher, R. S., and Peters, J. M. (2017). Near-surface thermodynamic sensitivities in simulated extreme-rain-producing mesoscale convective systems. Mon. Wea. Rev. 145, 2177–2200. doi: 10.1175/MWR-D-16-0255.1
Shepherd, T. G. (2016). A common framework for approaches to extreme event attribution. Curr. Clim. Change Rep. 2, 28–38. doi: 10.1007/s40641-016-0033-y
Shepherd, T. G., Boyd, E., Calel, R. A., Chapman, S. C., Dessai, S., Dima-West, I. M., et al. (2018). Storylines: an alternative approach to representing uncertainty in physical aspects of climate change. Clim. Change 151, 555–571. doi: 10.1007/s10584-018-2317-9
Shoji, Y., Sato, K., Yabuki, M., and Tsuda, T. (2017). Comparison of shipborne GNSS-derived precipitable water vapor with radiosonde in the western North Pacific and in the seas adjacent to Japan. Earth Planets Space 69, 153. doi: 10.1186/s40623-017-0740-1
Skamarock, W. C., Klemp, J. B., Dudhia, J., Gill, D. O., Barker, D., Duda, M. G., et al. (2008). A Description of the Advanced Research WRF Version 3, No. NCAR/TN-475+STR. Boulder, CO: University Corporation for Atmospheric Research.
Takemi, T. (2014). Convection and precipitation under various stability and shear conditions: squall lines in tropical versus midlatitude environment. Atmos. Res. 142, 111–123. doi: 10.1016/j.atmosres.2013.07.010
Takemi, T. (2018). Importance of terrain representation in simulating a stationary convective system for the July 2017 Northern Kyushu Heavy Rainfall case. SOLA 14, 153–158. doi: 10.2151/sola.2018-027
Tewari, M., Chen, F., Wang, W., Dudhia, J., LeMone, M. A., Mitchell, K., et al. (2004). “Implementation and verification of the unified NOAH land surface model in the WRF model,” in 20th Conference on Weather Analysis and Forecasting/16th Conference on Numerical Weather Prediction (Seattle, WA), 11–15.
Toda, M., and Watanabe, M. (2020). Mechanisms of enhanced ocean surface warming in the Kuroshio region for 1951-2010. Clim. Dyn. 54, 4129–4145. doi: 10.1007/s00382-020-05221-6
Tomita, H., Hihara, T., Kako, S., Kubota, M., and Kutsuwada, K. (2019). An introduction to J-OFURO3, a third-generation Japanese ocean flux dataset using remote-sensing observations. J. Oceanogr. 75, 171–194. doi: 10.1007/s10872-018-0493-x
Trenberth, K., Fasullo, J., and Shepherd, T. (2015). Attribution of climate extreme events. Nat. Clim. Change 5, 725–730. doi: 10.1038/nclimate2657
Tsuji, H., Takayabu, Y. N., Shibuya, R., Kamahori, H., and Yokoyama, C. (2021). The role of free-tropospheric moisture convergence for summertime heavy rainfall in western Japan. Geophys. Res. Lett. 48, e2021GL095030. doi: 10.1029/2021GL095030
Tsuji, H., Yokoyama, C., and Yakayabu, Y. (2020). Contrasting features of the July 2018 Heavy Rainfall Event and the 2017 Northern Kyushu Rainfall Event in Japan. J. Meteor. Soc. Japan 98, 859–876. doi: 10.2151/jmsj.2020-045
Unuma, T., and Takemi, T. (2016). Characteristics and environmental conditions of quasi-stationary convective clusters during the warm season in Japan. Q. J. R. Meteorol. Soc. 142, 1232–1249. doi: 10.1002/qj.2726
Utsumi, N., Seto, S., Kanae, S., Maeda, E. E., and Oki, T. (2011). Does higher surface temperature intensify extreme precipitation? Geophys. Res. Lett. 38, L16708. doi: 10.1029/2011GL048426
Volosciuk, C., Maraun, D., Semenov, V., Tilinina, N., Gulev, S. K., and Latif, M. (2016). Rising Mediterranean sea surface temperatures amplify extreme summer precipitation in central Europe. Sci. Rep. 6, 32450. doi: 10.1038/srep32450
Willett, K. M., Jones, P. D., Gillett, N. P., and Thorne, P. W. (2008). Recent changes in surface humidity: development of the HadCRUH dataset. J. Clim. 21, 5364–5383. doi: 10.1175/2008JCLI2274.1
Wu, L., Cai, W., Zhang, L., Nakamura, H., Timmermann, A., Joyce, T., et al. (2012). Enhanced warming over the global subtropical western boundary currents. Nat. Clim. Change 2, 161–166. doi: 10.1038/nclimate1353
Yokoyama, C., Tsuji, H., and Takayabu, Y. N. (2020). The effects of an upper-tropospheric trough on the heavy rainfall event in July 2018 over Japan. J. Meteor. Soc. Japan 98, 235–255. doi: 10.2151/jmsj.2020-013
Keywords: sea surface temperature, regional climate, extreme weather, convective system, surface heat fluxes
Citation: Manda A, Iizuka S, Nakamura H and Miyasaka T (2022) Assessing the impact of the recent warming in the East China Sea on a torrential rain event in northern Kyushu (Japan) in early July 2017. Front. Clim. 4:967154. doi: 10.3389/fclim.2022.967154
Received: 12 June 2022; Accepted: 24 August 2022;
Published: 16 September 2022.
Edited by:
Tomomichi Ogata, Japan Agency for Marine-Earth Science and Technology (JAMSTEC), JapanReviewed by:
H. Takahashi, Tokyo Metropolitan University, JapanYoshi Sasaki, Hokkaido University, Japan
Copyright © 2022 Manda, Iizuka, Nakamura and Miyasaka. This is an open-access article distributed under the terms of the Creative Commons Attribution License (CC BY). The use, distribution or reproduction in other forums is permitted, provided the original author(s) and the copyright owner(s) are credited and that the original publication in this journal is cited, in accordance with accepted academic practice. No use, distribution or reproduction is permitted which does not comply with these terms.
*Correspondence: Atsuyoshi Manda, am@bio.mie-u.ac.jp