Data aggregation, ML ready datasets, and an API: leveraging diverse data to create enhanced characterizations of monsoon flood risk
 Dharma Hoy
 Rey L. Granillo III
 Leland Boeman
 Ben McMahan
 Michael A. Crimmins
- 1Arizona Institute for Resilient Environments and Societies, University of Arizona, Tucson, AZ, United States
- 2Department of Environmental Science, University of Arizona, Tucson, AZ, United States
Monsoon precipitation and severe flooding is highly variable and often unpredictable, with a range of flood conditions and impacts across metropolitan regions or a county. County and storm specific watches or warnings issued by the National Weather Service (NWS) alert the public to current flood conditions and risks, but floods are not limited to the area that is under alert and these zones can be relatively coarse depending on the data these warnings are based on. Research done by the Arizona Institute for Resilient Environments and Societies (AIRES) has produced an Application Programming Interface (API) accessible data warehouse of time series precipitation totals across the state of Arizona which consists of higher resolution geographically disperse data that helped create improved characterizations of monsoon precipitation variability. There is an opportunity to leverage these data to address flood risk particularly where advanced Computer Science methodologies and Machine Learning techniques may offer additional spatial and temporal insight into flood events. This can be especially useful during rainfall events where precipitation station reporting frequencies are increased and near real-time totals are accessible via the AIRES API. A Machine-Learning-ready dataset structured to train ML models facilitates an anticipatory approach to predicting/characterizing flood risk. This presents an opportunity for new inputs into management and decision making opportunities, in addition to describing precipitation and flood patterns after an event. In this paper we will be the first to make use of the AIRES API by taking the initial step of the Machine Learning process and assembling the precipitation data into a ML-ready dataset. We then look closer at the dataset assembled and call attention to characteristics of the dataset that can be further explored through machine learning processes. Finally, we will summarize future directions for research and climate services using this dataset and API.
1. Introduction
Monsoon season precipitation is responsible for ~½ of the annual precipitation total for southern Arizona. Unlike the gentler winter rains, monsoon precipitation events are frequently characterized by severe weather and intense precipitation that can vary widely in spatial coverage.
Additionally, these events are often clustered during runs of favorable conditions, when moisture is present and favorable atmospheric circulation persists, resulting in a burst and break phenomenon for monsoon events across the monsoon seasonal window, which runs June 15 to Sept 30 (Carleton, 1986). The intermittent spatial and temporal nature of these storms, in conjunction with the intensity of storms that do occur, mean that nuisance flooding is a common occurrence across the monsoon season, and severe flooding is a persistent if not regular hazard. Flood risk is amplified in municipal areas where dry washes and paved roadways serve as the stormwater conveyance system, with many locales lacking underground storm water systems (Tousi et al., 2021).
National Weather Service storm alerts and flash flood watches and warnings alert residents of affected regions to first the conditions that might lead to flood events, and then, as flood events unfold, the presence of actual flood conditions. The coverage of warnings can be coarse and spatially broad, meaning that affected regions fall within the threat area, but so do many other residents who might not even see precipitation falling, much less flood events. This is not a critique of the NWS, as hazard messaging for such a complex and variable phenomenon as the monsoon is no small task, and outlines how innovations in data management and flood risk prediction might provide more granular information on flood risk. Previous work aggregating monsoon data from various observational networks (McMahan et al., 2021) helped generate a dataset that could improve our characterization of monsoon variability, but there is opportunity to leverage this dataset to address flood risk as well, particularly where advanced (ML) techniques may offer some additional spatial and temporal insight into flood events. This anticipatory approach moves beyond previous description of precipitation variability after an event and extends from emergent trends in the sciences to focus on AI/ML ready datasets (see McKinstry et al., 2021) that can help researchers better anticipate and predict hazardous conditions. It also highlights the power and utility of open data frameworks (see Arribas-Bel et al., 2021) as these analysis-or AI/ML-ready datasets are used for specific circumstances but made available through open-source frameworks and APIs.
The University of Arizona's (UArizona) Arizona Institute for Resilient Environments and Societies (AIRES) aggregates monsoon data from observational networks and combines them into the UArizona Environment monsoon dataset. The dataset is available through an Application Programming Interface (API) and a visual platform found at monsoon.environment.arizona.edu. This platform provides users access to granular data allowing them to see monsoon precipitation variability (McMahan et al., 2021). This paper demonstrates the potential to leverage this dataset to address flood risk, particularly where advanced Machine Learning (ML) techniques may offer some additional spatial and temporal insight to flood events.
The AIRES API is hosted in a GitHub organization repository found at: https://github.com/uaenvironment/monsoon-api-package. The API data is accessible via a username and key. Information on requesting access as well as repository usage can be found in the repository readme.
Collaboration between natural, social, and computer science perspectives provides the ability to develop more forward-looking climate services and is a cornerstone of both this project and the development of the AIRES API. Computer Science methodologies gave us the tools to aggregate, organize, and apply machine learning concepts to the data. Input from the natural and social science community informed the authors which steps to take to make meaningful contributions to climate technology.
The data in the AIRES API presents the opportunity to apply Machine Learning methods to precipitation data to predict flooding. Machine Learning (ML) according to Arthur Samuel who coined the term is “the field of study that gives computers the ability to learn without explicitly being programed” (Brown, 2021). Machine Learning is especially useful for large sets of data and finding correlations in data points where a clear correlation isn't apparent.
To create a ML ready dataset, we take the AIRES API data and combine it with historical weather and flood data. We then explored the possibility of applying ML techniques which involved writing code in both Python and R. Python and R are commonly used for data science and helped gather, organize, and process our data. The code written in Python makes use of the NumPy, Pandas, requests, JSON, and datetime packages to pull data and organize it in a logical manner. The code written in R makes use of the Tidyverse and its various packages to organize, clean and graphically represent data in addition to the arrow, lubridate, gplots, and reticulate libraries to explore possible ML applications and clean the data. Detailed information on these packages and their usage can be found in comments in appendices containing code and the technology overview in the Appendix.
2. Methods and materials
2.1. Historical weather data
When assembling an ML ready dataset our initial step, as shown in Figure 1 was to consider external data sources to be combined with the AIRES API data that would contribute toward the end goal of conducting flood analysis. The National Oceanic and Atmospheric Administration (NOAA) has an API that provides access to Climate Data Online which is an archive of global historic weather data. We will specifically be gathering daily data for the years 2000–2020 for example purposes, but we encourage the reader to fully explore what is offered in this API to apply to their own analysis. You can use the NOAA API to pull many different types of weather and climate data from various weather stations and datasets throughout the world. This API has multiple databases it provides access to through the acquisition and use of an access token. The access token prohibits the user from passing a specific threshold of daily requests (National Climate Data Center et al., no date).
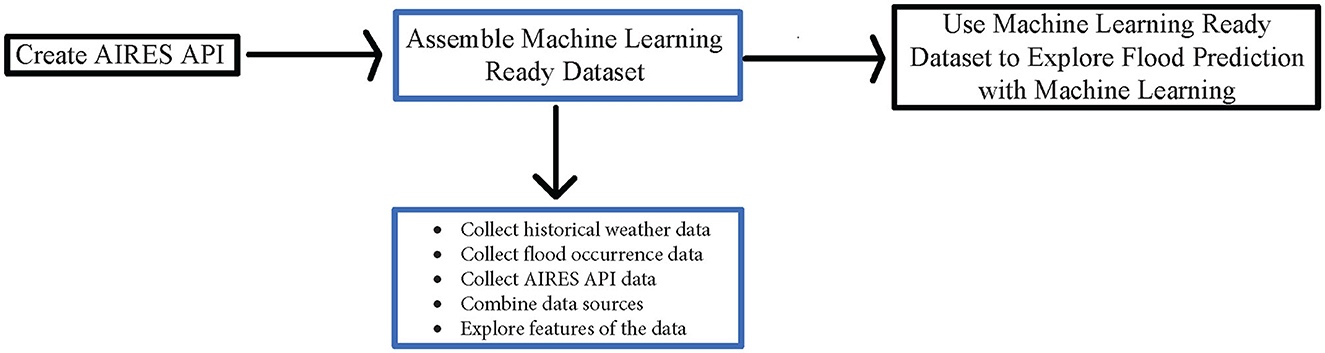
Figure 1. Flowchart created to show the outline of the steps taken in this manuscript. This manuscript walks through the assembling of a machine learning ready dataset.
The NOAA API has various endpoints and query parameters to use depending on the specifics of the data desired. In our request we specified the parameters: dataset, data type, limit, station ID, start date, and end date. The data we used is from the Global Historical Climatology Network which includes over 40 meteorological elements including historical weather data (Menne et al., 2012). To show the process involved in collecting data from the NOAA API and aggregating it with the AIRES API data the data types from this dataset that we decided to include are daily high temperature, average daily wind speed, and direction of fastest 2-min wind each day. We encourage the reader to choose which variables they would prefer to include in their personal analysis, taking into consideration which variables provided in the NOAA API are likely related to flood prediction. For the limit value, we chose to set the limit of responses to the maximum 1,000. The station ID is which weather station the API should collect the readings from. Because our research is focused on flooding in Pima County, we chose to select the Tucson International Airport weather station. We then set the start and end date to collect data for the years 2000 to 2020 and made the requests 1 year at a time.
The script written to make the requests from the NOAA API and organize the data returned, is shown in Appendix A and written in Python using the Pandas, NumPy, JSON, Requests, and Datetime packages. To determine the most fitting way in which to write this script and access the data we consulted the documentation of the API and an example of its use (Kharkar, 2019). This script contains a function that makes the requests and returns a date and values lists from the request, then creates a Pandas data frame from the lists returned and writes the data frame to a CSV. For each of the weather variables to collect data for, the script runs this function inputting the weather variable's datatype ID and makes an API request for each year in the range 2000–2020 and returns those two lists. One list that contains all the days within the date range the variable was measured, and another that contains the measurement of the variable on that day. Then it creates a CSV of the two lists returned where the dates are the first column, and the measurements are the second. These CSVs were stored to combine with other data later.
2.2. Flood events
After retrieving the weather data, the next step in the process was to pin down a list of flood events in Pima County during the timeframe in which the weather data was summarized. NOAA supports a Storm Events Database that was accessed to obtain this information. This database contains data entered by the National Weather Service (NWS) that shows the different types of storms and extreme weather events that have occurred (National Climate Data Center, 1996). The select state or area option was used to download a CSV of floods and flash floods that occurred in Pima County throughout the years 2000–2020. The CSV comes with a generous amount of data regarding the storm events. However, our desired resulting data frame only contained the days that there was a flood, and where in Pima County the flood occurred.
To get the data into a desirable format we cleaned the data using R and functions from the tidyverse which is shown in Appendix B. Initially, we selected the columns containing the data we needed. Then we reformatted the column depicting the date that the flood began to align with the same datetime format of the historical weather data previously gathered. Next, this clean dataset was written to a CSV to later combine with weather and the AIRES API data. One thing to consider about the Storm Events Database data and the steps taken to clean it is that the location of the floods is not narrowly defined. For example, a flood anywhere in Tucson is defined as happening in Tucson.
For further analysis it may be helpful to use the other information present in the NOAA Storm Events Database, including the more in-depth flood event description located in the episode and event narrative columns of the downloaded CSV, to divide larger areas like Tucson into smaller sections where the flooding happened. Another opportunity for future research presents itself in the availability of the storm-based warning polygons from the weather service. Whether or not this data can be aggregated with the AIRES API data, and analysis comparing this data to the stream flow data, which is already included in the AIRES API, and the NOAA Storm Events Database are questions we intend to explore answers to in the next step of this process.
2.3. AIRES API
After retrieving the historical weather and flood occurrence data we pulled precipitation data from the AIRES API. The AIRES API contains access to all the ground-based precipitation sensor readings found within Pima County, Maricopa County, Mohave County, Rainlog, MesoWest, and the data from the Pima County Flood Control gages (see McMahan et al., 2021). For our first example of its use, we collected the daily rainfall totals for all the sensors from the years 2000–2020 (see script, App C.). The county data contains some extreme rainfall values due to incorrect reporting's and some simple outlier detection tactics have been employed (values exceeding daily threshold of 133 mm), but in the future we will be looking at more sophisticated ML outlier detection approaches (Crimmins et al., 2021). The function written takes a start and end year as inputs, converts them to datetimes where start date is January 1st of the start year given, and end date is December 31st the last year given. This function call returns a data frame of all the daily rainfall totals in Pima County within that given time period. The script is written in Python and uses the Pandas, NumPy, and Datetime packages.
The API has multiple functions that allow access to the data, most of which have parameters for the start and end date of the request, both of which are inclusive so data is returned on the start and end date. It was determined that the best way to keep the run time low while keeping the code organized and understandable was to request 1 year's worth of sensor readings at a time. To conduct this in a way that fulfills the parameters for the functions of the API we established a time delta value of 1 year and defined the variable next date as a year from the start date. We then ran a while loop that requests data from the API for each year using the start and next date parameters in the API function within the range the user specified, created a pandas data frame for each year's worth of data, and appended this data frame to a list of data frames, iterating the start and next date values using the specified delta value until the start date equals the given end date.
Next, the function concatenates all the yearly data frames, checks for duplicate sensor readings, and creates a list of all the unique sensor names. For each sensor, the function creates a pandas data frame of readings, makes the datetime column of type datetime, sorts the data frame by datetime, finds the rainfall amounts by calculating the difference in rainfall between each sensor reading, then sums the rainfall amounts for each day. Then the function adds each sensor's data frame to a list of sensor data frames which it then concatenates and returns as the final data frame. This data frame was also written to a CSV.
2.4. Combining data sources
After all our data was collected the next step was to combine the CSVs into a single data frame that could easily be used in ML models. This data frame was stored as a feather file, a binary format which takes up less space and may be imported into data frames in various programming languages. This data was combined in an R script shown in Appendix D primarily using tidyverse functions. We assured that both the beginning of the flood location and sensor name were categorical variables, by converting these columns into factors. Then we combined the CSVs one at a time with Dplyr pipes using the full join function and matching the rows on the date column in each CSV. It is important to note that not all the CSVs have an entry for every day. After the data frame was created, it was written to a feather file and stored.
2.5. Focusing on 2020 data
After creating this large data frame, care was taken to specifically focus on the data from 2020, and use all the sensor readings instead of finding rainfall totals, to call attention to the granularity of the dataset. This code is written in an R Markdown file using the reticulate library so the sensor data from the AIRES API, which is put into a Pandas data frame after being gathered, can be immediately cleaned using tidyverse functions (see script, App. E). This script requests sensor readings from Pima County for the year 2020, then imports the flood occurrence data from the NOAA Storm Events Database and filters the flood events so only floods in the year 2020 are included. Next, the datetimes of the two data sources are converted so they are in the same format, the location where the flood began and the sensor name are converted to be factors, and the flood occurrence data is combined with the sensor readings and written into a feather file.
3. Results and discussion; exploring opportunities for machine learning analysis
After assembling two machine learning ready datasets using the AIRES API and NOAA data, we started to consider what features of the data can be used for Machine Learning analysis and what should be added to the AIRES API to expand upon the already present features. This is the very beginning of the Machine Learning process and is meant to show the reader the potential use of the dataset and demonstrate opportunities for future research.
3.1. Daily rainfall totals
The first set of data we emphasize here is the flood occurrence data and the daily total rainfall in each sensor calculated using the individual sensor readings. Before considering applying a Machine Learning algorithm, time was taken to visualize this data to determine what type of model to start with. We created various, but somewhat crude graphs throughout this process shown in Figures 2, 3. Figure 2A shows the total amount of rain at each sensor for each day in 2020 that there was a flood. Figure 2B shows the total amount of rain at each sensor for each day since 2010 that there was flooding in Tucson. Figure 3 shows the distribution of sensor reading values for every day in August 2020 where the color of the distribution differentiates between days that it flooded and days that it didn't flood in Pima County.

Figure 2. Graphs created to observe sensor readings on days that it flooded. (A) shows the sensor readings on days is flooded in 2020. (B) shows the sensor readings on days it flooded in Tucson from 2010 to 2020. Note that the sensors are ordered numerically.
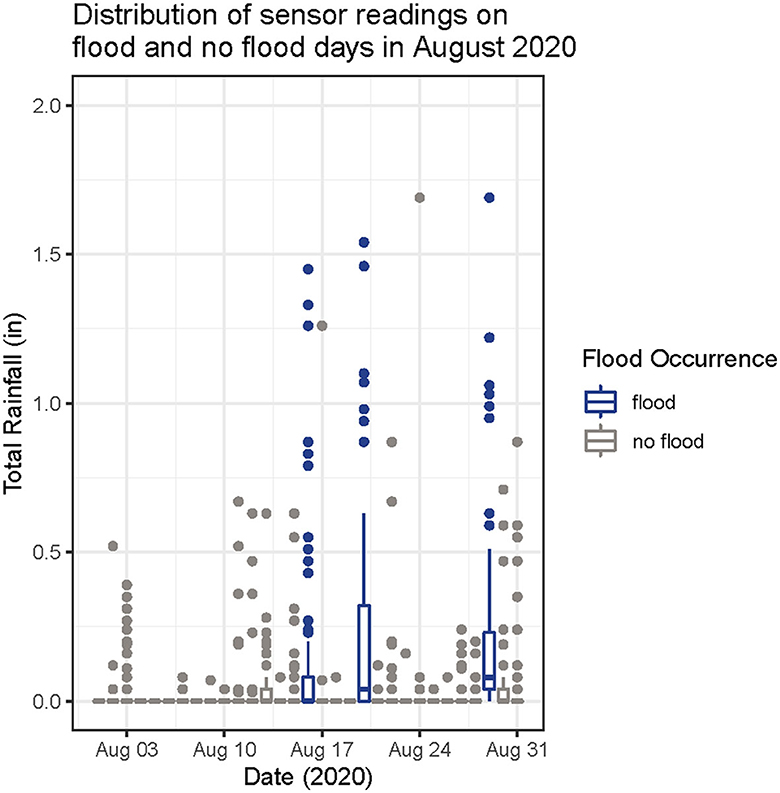
Figure 3. Graph created to show the distribution of total rainfall values on days that it flooded and didn't flood in August 2020. A boxplot is made for each day in August 2020 where the color is corresponding to whether or not it flooded that day and the data used to make the box plot is the total amount of rainfall recorded by each sensor.
Visualizing the data in this manner brought us to consider whether there was a pooled relationship between all of the daily precipitation values in the network and flood/no flood days. This consideration emerged from looking at Figure 2 and noticing peaks that were present on multiple flood days. It was observed that some sensors usually had high readings on flood days in Tucson and wanted to analyze this relationship further. When looking at Figure 3 it was observed that the days it flooded in August 2020 tended to have a distribution with a wider spread of total rainfall values than the distributions on the days it didn't flood. This wider spread of total rainfall values is showing us that on days there are floods, there are isolated heavy rainfall events. Looking at the data in this way showed that there may be a pattern that a machine learning algorithm could determine. To take a closer look at the isolated heavy rainfall events, determine which sensors they take place at, and over what periods of time, we should dig deeper and look at the fine scale resolution of subdaily rainfall data.
3.2. Weather data
Next, the use of the weather variables was shown. Three plots were generated, one for average daily wind speed (Panel A), one for direction of fastest 2-min wind each day (Panel B), and one for daily high temperature (Panel C) that showed the date vs. the weather value where the color of the points depends on whether or not it flooded that day (see Figure 4). This data is from the sensor at the Tucson International Airport. These values are daily values and it is hard to see an explicit pattern differentiating the flood from no flood days.
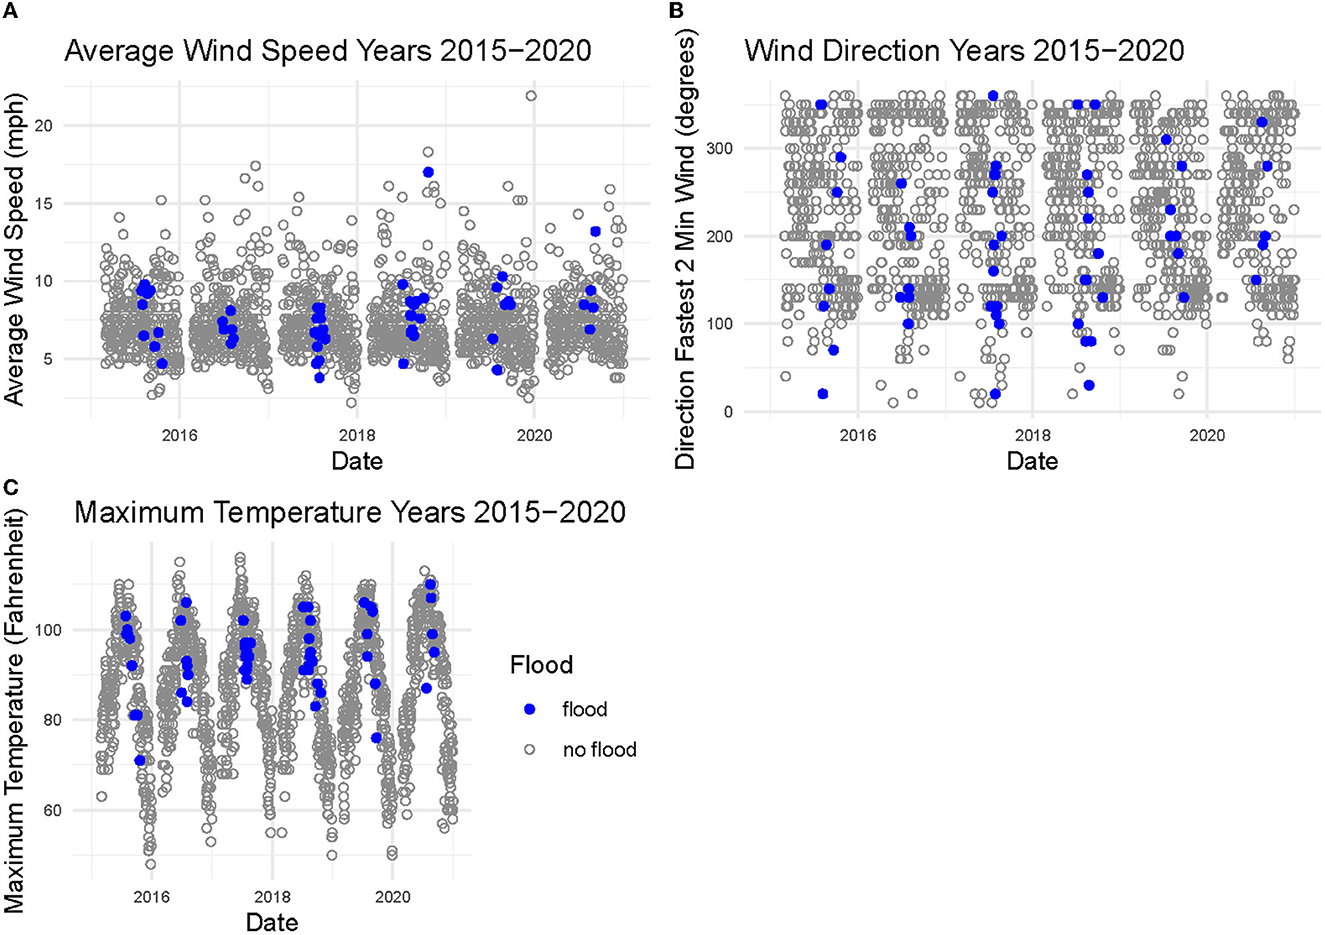
Figure 4. Graphs created to observe wind speed, wind direction, and maximum temperature in the years 2015–2020 from the sensor at the Tucson International Airport. (A) shows the average wind speed, (B) shows the direction of the fastest 2-min wind, and (C) shows the daily high temperature. The points that are gray are observations on days when there wasn't a flood in Pima County and points that are purple are on days when there was a flood.
This led to the consideration as to whether weather variables would possibly be useful in flood prediction. The NOAA API, as stated previously, has quite a few different weather variables that can be accessed quite easily, but by accessing this data through a separate source than the precipitation data, the user is forced to complete various steps requiring a certain level of coding abilities to clean and combine the data into a machine learning ready format. This brought us to consider if it would be useful to add access to granular observations of other variables beyond precipitation through the AIRES API. This would make the experience of looking at both precipitation values and other weather variables for flood prediction more user friendly and straightforward. It would also allow the user to determine how important different weather variables are in flood prediction possibly employing a random forest algorithm or something similar to conduct this analysis (Schonlau and Zou, 2020).
3.3. Subdaily precipitation observations
The final example of the use of the AIRES API data included in this manuscript uses individual sensor readings throughout 2020, instead of daily totals. The first thing we did was select the sensor readings for a day with known flooding at the Marana Airport which is located 26 miles northwest of the Tucson Airport. For each sensor we initially subtracted the first reading value for the day so all the readings started at zero in order to better see the change in rainfall throughout the day compared between each sensor. Next, the readings were graphed as a function of time to see how the precipitation readings changed throughout the day. Figure 5 shows this graph for a few of the sensors.
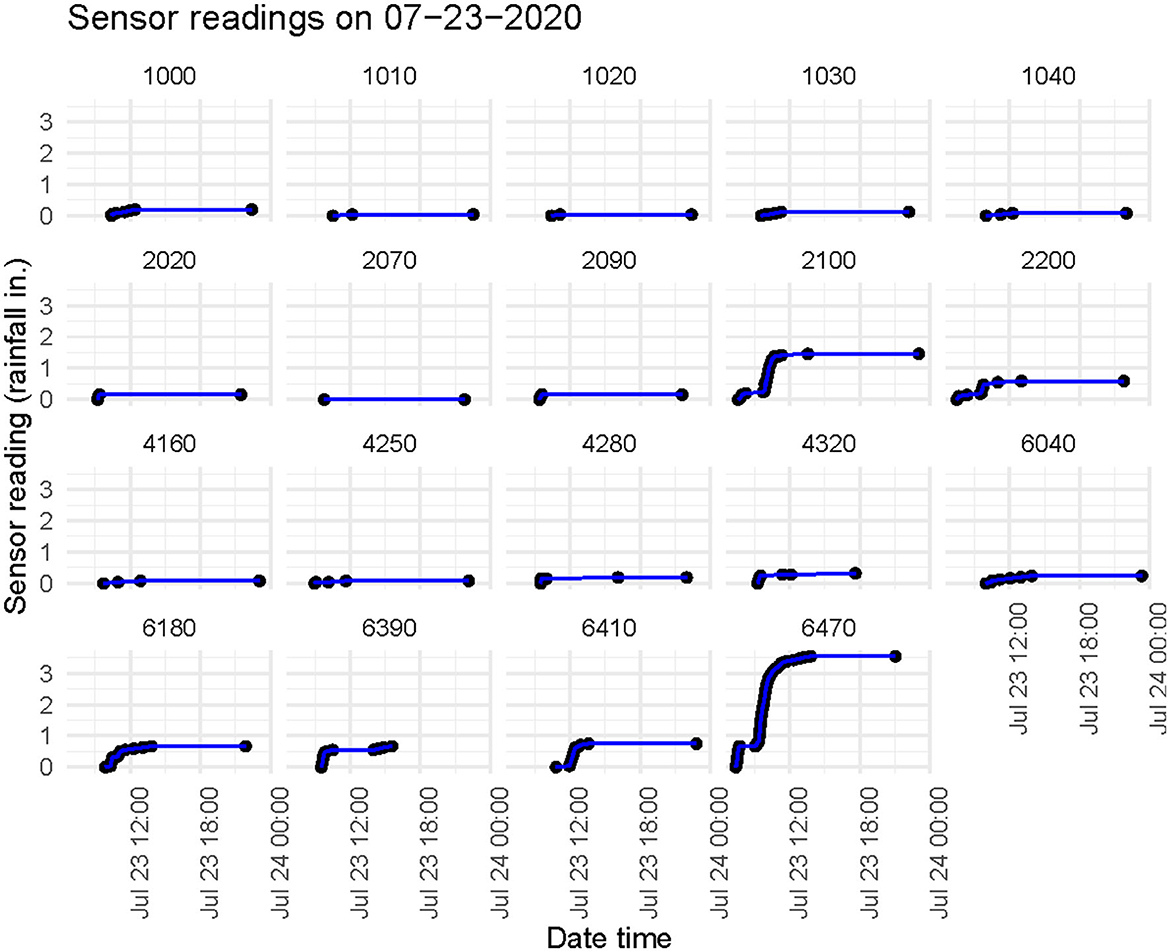
Figure 5. Sensor readings showing the rainfall in inches for a handful of sensors on July 23rd, 2020. This day was chosen because there was a flood at the Tucson Marana Airport. The change in rainfall throughout the day at each sensor can be seen here.
Looking at Figure 5, it is easy to see that on a day where there was flooding at the Marana Airport there were some sensors that experienced almost no rainfall, and some that experienced a somewhat substantial amount of rainfall throughout the day. The rate of rainfall is also different at each sensor. This is where subdaily data comes in handy. Unlike the daily rainfall totals shown previously, this gives us a much better look at what is happening throughout the day of a flood which makes this data much more suitable for Machine Learning analysis. For future research we want to use a ML model see if there is a pattern present that relates which sensors experience large amounts of rainfall, how quickly that rainfall happens, and where flooding takes place to see if this data can help predict flooding. We also intend to continually improve the functionality of the AIRES API to make sure that this data is clean and easily accessible to whoever wishes to conduct their own analysis.
4. Conclusions and opportunities for future research
The types of insights that emanate from the intersection of data aggregation and computing technology to address complex weather and climate questions are shown in the work completed within this paper. By combining the AIRES API data with various other data sources and organizing this data into a ML ready dataset we are calling upon typical data science processes to prepare to address flood risk. The progress made in the completion of this paper allows for the flood prediction process to start with the exploration of ML analyses that would work on the dataset, as opposed to starting with the challenging work of determining which data and the format in which the data should be assembled. This work is novel in the sense that it is using traditional data science techniques to put complex environmental data, whose original purpose is not necessarily to be used for research, in a research ready format. Because this data set includes sub daily precipitation events, this in turn provides the opportunity to develop additional spatial and temporal insights into flood events.
The expansion of the AIRES API and continual improvement of the quality of the dataset would work to address challenges we came across in the study. The quality of the dataset could be improved by making flood occurrence data accessible directly through the AIRES API, a better handling of extreme values including automated outlier and anomaly detection, and the addition of other weather variables to the dataset. Future work involving the API will include improvements to better attend to the users' experience such as implementing a process through which users can easily request a username and token. Through these improvements, we can further explore the benefits of subdaily precipitation data.
The intersection of data aggregation and computing technology to address complex weather and climate questions also presents an opportunity for new inputs into decision making applications, especially related to emergency management or risk management. The work completed here contributes to data driven decision making in the event of a flood emergency by increasing the ease of access to relevant data. Parallel to any novel analyses, however, are the data management, cloud computing, and data distribution backbones that facilitate wider use of these data via web visualization platforms, and increasingly, via API access. This shift to open data frameworks and the wide distribution of data via API expands the outcomes of research computing approaches to weather and climate data—which emphasizes the development new datasets (read: AI/ML ready) that bring together diverse observational and/or modeling datasets and organize them for use in applied research on weather and climate impacts.
By expanding on the existing AIRES API, we hope to encourage collaborative relationships that can highlight opportunities to engage in multi-disciplinary research using these open data frameworks that extend from the pilot analyses described in this paper, or that use the datasets developed in preparation for these analyses. This reflects some nascent movement toward publishing scientific datasets for use by other researchers and portends toward movement toward developing data processing steps as more and more research teams shift toward incorporating ML/AI based techniques into research proposals and academic publications.
Data availability statement
Publicly available datasets were analyzed in this study. This data can be found at: monsoon.environment.arizona.edu; https://www.ncei.noaa.gov/products/land-based-station/global-historical-climatology-network-daily; https://www.ncdc.noaa.gov/stormevents/.
Author contributions
DH led data aggregation and machine learning preparation. RG and LB reviewed and optimized code and fine-tuned AIRES API functionality. BM outlined goals for the project and directed progress toward meaningful field contributions. DH, RG, LB, BM, and MC contributed to the final manuscript. All authors contributed to the article and approved the submitted version.
Funding
All of the funding for this project was provided by the Arizona Institute for Resilient Environments and Societies (AIRES).
Acknowledgments
Special thanks to the Arizona Institute for Resilient Environments and Societies (AIRES). Additional thanks to careful and thoughtful comments provided by peer reviewers.
Conflict of interest
The authors declare that the research was conducted in the absence of any commercial or financial relationships that could be construed as a potential conflict of interest.
Publisher's note
All claims expressed in this article are solely those of the authors and do not necessarily represent those of their affiliated organizations, or those of the publisher, the editors and the reviewers. Any product that may be evaluated in this article, or claim that may be made by its manufacturer, is not guaranteed or endorsed by the publisher.
Supplementary material
The Supplementary Material for this article can be found online at: https://www.frontiersin.org/articles/10.3389/fclim.2023.1107363/full#supplementary-material
References
Arribas-Bel, D., Green, M., Rowe, F., and Singleton, A. (2021). Open data products—a framework for creating valuable analysis ready data. J. Geograph. Syst. 23, 497–514. doi: 10.1007/s10109-021-00363-5
Brown, S. (2021). Machine Learning, Explained. Available online at: https://mitsloan.mit.edu/ideas-made-to-matter/machine-learning-explained (accessed October 10, 2022).
Carleton, A. M. (1986). Synoptic-dynamic character of “bursts” and “breaks” in the southwest U.S. summer precipitation singularity. J. Climate 6, 605–623. doi: 10.1002/joc.3370060604
Crimmins, M. A., McMahan, B., Holmgren, W. F., and Woodard, G. (2021). Tracking precipitation patterns across a western U.S. metropolitan area using volunteer observers: RainLog.Org. Int. J. Climatol. 41, 4201–4214. doi: 10.1002/joc.7067
Kharkar, R. (2019). Getting Weather Data in 3 Easy Steps. Available online at: https://towardsdatascience.com/getting-weather-data-in-3-easy-steps-8dc10cc5c859 (accessed August 4, 2022).
McKinstry, A., Boydell, O., Le, Q., Preet, I., Hanafin, J., Fernandez, M., et al. (2021). AI-Ready Training Datasets for Earth Observation: Enabling FAIR data principles for EO training data. EGU General Assembly 21, EGU21–12384. doi: 10.5194/egusphere-egu21-12384
McMahan, B., Granillo, R., Delgado, B., Herrera, M., and Crimmins, M. (2021). Curating and visualizing dense networks of monsoon precipitation data: integrating computer science into forward looking climate services development. Front. Climate 3, 602573. doi: 10.3389/fclim.2021.602573
Menne, M. J., Durre, I., Vose, R. S., Gleason, B. E., and Houston, T. G. (2012). An overview of the global historical climatology network-daily database. J. Atmos. Oceanic Technol. 29, 897–910. doi: 10.1175/JTECH-D-11-00103.1
National Climate Data Center NESDIS NOAA, U.S. Department of Commerce. (1996). Data From: NCDC Storm Events Dataset. National Centers for Environmental Information. Available online at: https://www.ncdc.noaa.gov/stormevents/
National Climate Data Center NESDIS NOAA, U.S. Department of Commerce (no date). Climate Data Online: Web Services Documentation. Available online at: https://www.ncdc.noaa.gov/cdo-web/webservices/v2#gettingStarted (accessed August 4, 2022).
Schonlau, M., and Zou, R. (2020). The random forest algorithm for statistical learning. Stata J. 20, 3–29. doi: 10.1177/1536867X20909688
Keywords: data aggregation, flood, API, machine learning, precipitation, data science, monsoon
Citation: Hoy D, Granillo RL III, Boeman L, McMahan B and Crimmins MA (2023) Data aggregation, ML ready datasets, and an API: leveraging diverse data to create enhanced characterizations of monsoon flood risk. Front. Clim. 5:1107363. doi: 10.3389/fclim.2023.1107363
Received: 24 November 2022; Accepted: 28 June 2023;
Published: 13 July 2023.
Edited by:
Daniel McEvoy, Desert Research Institute (DRI), United StatesReviewed by:
Udit Bhatia, Indian Institute of Technology Gandhinagar, IndiaDonghoon Lee, University of California, Santa Barbara, United States
Copyright © 2023 Hoy, Granillo, Boeman, McMahan and Crimmins. This is an open-access article distributed under the terms of the Creative Commons Attribution License (CC BY). The use, distribution or reproduction in other forums is permitted, provided the original author(s) and the copyright owner(s) are credited and that the original publication in this journal is cited, in accordance with accepted academic practice. No use, distribution or reproduction is permitted which does not comply with these terms.
*Correspondence: Dharma Hoy, dharmahoy@arizona.edu