Distortion of sectoral roles in climate change threatens climate goals
 Naomi Cohen-Shields
 Tianyi Sun
 Steven P. Hamburg
 Ilissa B. Ocko
- Environmental Defense Fund, New York, NY, United States
The longstanding method for reporting greenhouse gas emissions—carbon dioxide equivalence (CO2e)—systematically underestimates methane-dominated economic sectors' contributions to warming in the coming decades. This is because it only calculates the warming impact of a pulse of emissions over a 100-year period. For short-lived climate forcers that mostly influence the climate for a decade or two, like methane, this method masks their near-term potency. Assessing the impacts of future greenhouse gas emissions using a simple climate model reveals that midcentury warming contributions of sectors dominated by methane—agriculture, fossil fuel production and distribution, and waste—are two times higher than estimated using CO2e. The CO2e method underemphasizes the importance of reducing emissions from these sectors, and risks misaligning emissions targets with desired temperature outcomes. It is essential to supplement CO2e-derived insights with approaches that convey climate impacts of ongoing emissions over multiple timescales, and to never rely exclusively on CO2e.
Introduction
Quantification of sectoral contributions to future warming is critical for guiding climate change mitigation priorities. However, the current method for evaluating the contributions of economic sectors to temperature increases is distorting their relative magnitudes. This distortion is most salient in the coming decades but persists for over a century. Given that sectoral emissions include a variety of greenhouse gases, aggregating their impacts without a climate model requires a metric for intercomparison. Sectoral contributions are almost always quantified using current annual greenhouse gas (GHG) emissions in carbon dioxide equivalence (CO2e) which employs global warming potentials with a 100-year time horizon (GWP100). A long-term calculation from 1 year's emissions overlooks the near-term potency of short-lived climate forcers such as methane. This is problematic because several sectors are dominated by methane emissions and therefore their impacts (and thus sectoral share) in the near-term would be greater. While the time dependency of the calculation is therefore critical to the statistic, it is continually left out of reporting. The result is a simplified statistic (sectoral share) devoid of its more nuanced meaning (sectoral share over a particular period). In other words, it doesn't mean what people think it means.
Employing a climate model can more accurately convey the relative roles of economic sectors by considering impacts of multiple climate forcers with varying radiative potencies and atmospheric lifetimes over all timescales and accounting for ongoing emissions. In this perspective, we use a reduced-complexity climate model to show that GWP100/CO2e vastly undervalues methane-dominated sectors' contributions to mid-century warming for both “no further climate action” and “strong mitigation” scenarios. Further, we discuss the policy implications of the resulting distortion and offer recommendations to improve accuracy.
A more accurate representation of sectoral contributions
As our indicator of “true” temperature impacts from future sectoral greenhouse gas emissions, we use a reduced-complexity climate model (MAGICCv6) (Meinshausen et al., 2011). Though models are not without uncertainties (see Supplementary material for how uncertainties influence our analysis), they are more accurate than simplified metrics because they consider interacting chemistry and physics along with climate feedbacks and treat changing climate forcer emissions and resulting atmospheric concentrations with more sophistication.
We consider two global GHG emissions scenarios: a “no further climate action” reference pathway and a “strong mitigation” pathway designed to limit global mean temperature increase to 1.5°C (Keramidas et al., 2018) (Supplementary Figure S1). We use these two scenarios to investigate both the breakdown of global sectors' contributions to absolute warming, as well as their contributions to avoided warming from potential emissions reductions. The reason for this is to determine how standard metrics can influence the perception of sectors in not just contributing to the climate change problem, but in contributing to climate change solutions as well. For example, it is important that we not only understand the full extent in which different sectors cause warming, but also the full extent in which their mitigation can avoid warming. We evaluate the impacts of future emissions from 2021 to 2100 for the three major GHGs: carbon dioxide (CO2), methane (CH4), and nitrous oxide (N2O); we do not evaluate changes in hydrofluorocarbons (HFCs) because their current contributions to warming are relatively small and are already covered under a global phaseout agreement (The Kigali Amendment, 2016). Though sectoral emissions also include other warming and cooling climate forcers, as analyzed in Unger et al. (2010), we limit our focus to the main GHGs included in net-zero targets.
We categorize emissions into nine global economic sectors, three dominated by methane—agriculture; fossil fuel production & distribution (FFPD); and waste—and six dominated by CO2–power generation; industry; transport; buildings; land-use, land-use change, and forests (LULUCF); and Other CO2 (e.g., energy losses, transfers, etc.). For all sectors, the dominant gas accounts for more than two-thirds of emissions as weighted by GWP100 and a GWP with a shorter time horizon of 20 years (GWP20) (Supplementary Figure S3). We evaluate the global mean temperature responses to sectoral emissions through midcentury to convey near-term warming on policy-relevant timescales, as well as through the end of century to convey long-term warming and relevance for temperature targets.
For the “no further climate action” scenario, the climate model suggests that around half (53%) of additional warming in 2050 due to future GHG emissions, and slightly less than half (44%) in 2100, will be attributed to the three methane-dominated sectors (Figure 1). Methane sectors' contributions are substantial because methane is a potent gas with emissions expected to increase throughout most of the century in the absence of further action (Ocko et al., 2021). In fact, our analysis suggests that around 60% of warming over the next decade from future GHG emissions will come from methane-dominated sectors. Increases in methane emissions will continue to reinforce its near-term potency, even as the warming share of methane-dominated sectors decreases over time due to the accumulation of CO2 in the atmosphere from the CO2-dominated sectors.
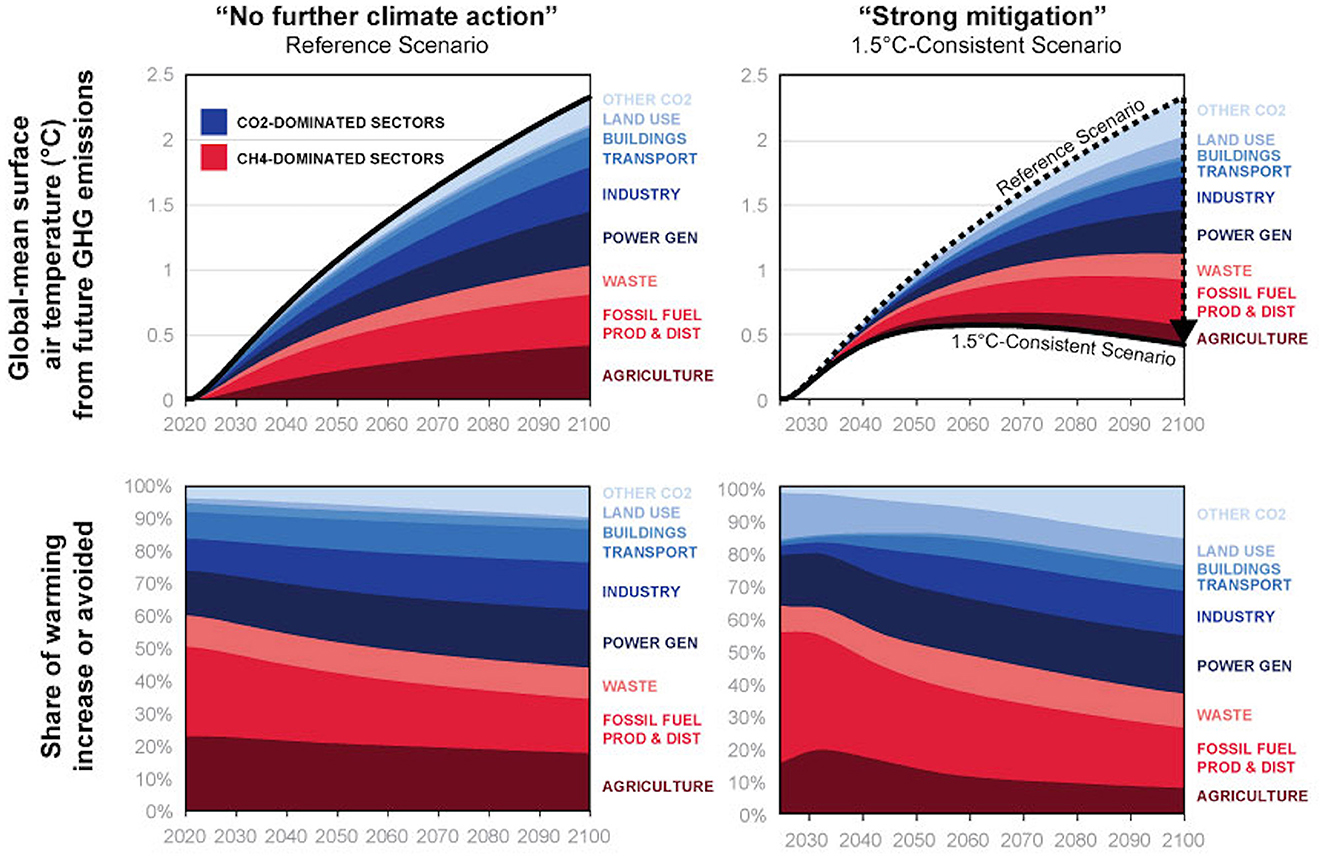
Figure 1. Global temperature contributions of continuous 2021–2100 emissions of CO2, CH4, and N2O using a simple climate model. Left panels show warming under one possible reference scenario that includes all climate and energy policies implemented as of 2017, and right panels show avoided warming under a scenario that limits global warming to 1.5°C. Both scenarios are taken from Keramidas et al. (2018). CO2-dominated sectors are in shades of blue, methane-dominated sectors are in shades of red. “Land use” refers to “land use, land-use change, and forestry.” “Other CO2” includes emissions from losses of the energy transformation industry (excluding power and heat generation).
The methane-dominated fossil fuel production and distribution (FFPD) and agriculture sectors, along with the CO2-dominated power generation sector are the three largest contributors—amounting to 59% of warming in 2050 with no further climate action. This broadly aligns with previous findings that the highest contributing sectors in the near-term are energy sectors (including FFPD and power generation) and agriculture (Lund et al., 2020).
For the “strong mitigation” scenario consistent with a 1.5°C target, emissions reductions from methane-dominated sectors could contribute half (52%) of the total avoided warming by 2050 (avoided warming relative to absolute warming in the “no further climate action” scenario; note that this is different than the absolute warming analyzed under the reference scenario and thus not directly comparable), and at least a third (36%) of avoided warming in 2100 (Figure 1). While the modeled mitigation scenario in this paper is just one of many potential pathways to achieve 1.5°C, it illustrates the substantial impact that methane mitigation efforts can have on reducing near-term, as well as longer-term, warming.
Misleading metrics and a distorted climate problem
The metric almost always chosen to convert GHGs into their CO2e is GWP: a measure of the relative potency (in terms of cumulative radiative forcing) of 1 year's (pulse) non-CO2 emissions as compared to a pulse of CO2 emissions over a specified time horizon. While the time horizon is an arbitrary choice, 100 years has become the standard. GWP100 is used in Nationally Determined Contributions (NDCs), corporate climate targets (Net Zero), state and company level emissions reporting (Greenhouse Gas Protocol)1, and widely used emissions inventories such as WRI's Climate Watch platform, EPA's annual greenhouse gas inventory, and the European Commission's annual JRC GECO report.
Decades of literature have illustrated the shortcomings of GWP100 (Lynch et al., 2021) and a prominent issue is that it does not convey the near-term impacts of short-lived gases (Balcombe et al., 2018). This is significant because, of the two GHGs responsible for most of current warming—CO2 and methane—CO2 can last for centuries in the atmosphere whereas methane is a potent but short-lived gas that on average remains in the atmosphere for around a decade (IPCC, 2021). When GWP100 is used to convert methane emissions into CO2e, the result is a skewed perception of methane's impact because the metric relies on averaging the warming impact of a pulse of methane over multiple decades when the pulse has substantially decayed and is not considerably influencing the atmosphere. A continuing flow of methane will maintain a corresponding elevated atmospheric concentration, and warming impact; but again, this is not well reflected via GWP100.
Our analysis illustrates the inadequacy of relying solely on GWP100. While the climate model makes it clear that methane-dominated sectors could account for around half of (1) warming from future GHG emissions in the absence of climate action and (2) avoided warming from a strong mitigation scenario, using the standard GWP100/CO2e approach leads to vastly different results.
For example, cumulative CO2e using GWP100 practically halves the role of methane-dominated sectors over the 2021–2050 period relative to the model results (53% model; 28% metric; Figure 2). While GWP100 performs better in the long-term, as the period from 2021 to 2100 more closely matches a 100-year time horizon, the results in 2100 over this time period are still distorted, with the methane-dominated sectors' role cut by around a third when using the metric relative to the model (44% model; 30% metric).
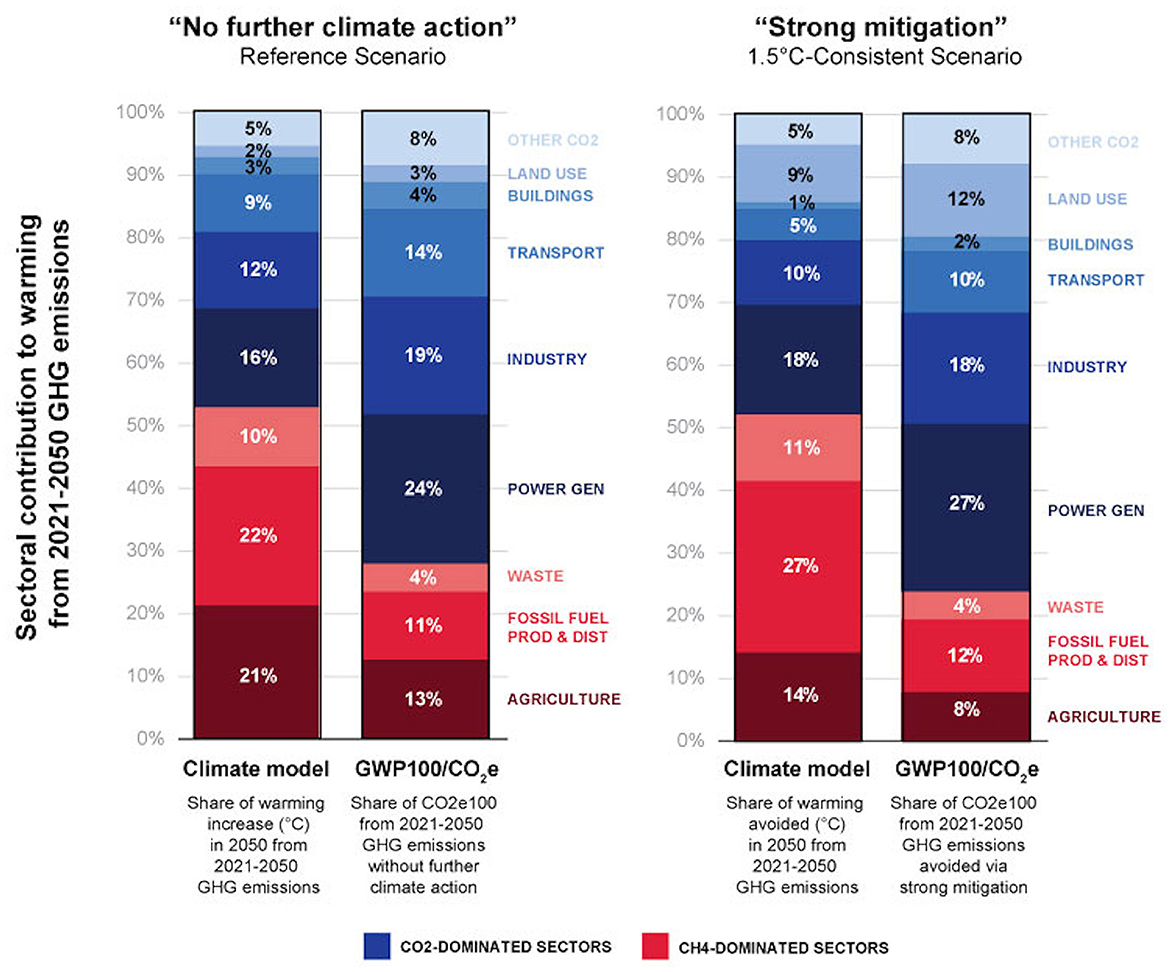
Figure 2. Comparison between a climate model and GWP100 of sectoral warming and avoided warming contributions in 2050 from continuous 2021–2050 emissions of CO2, CH4, and N2O. Left panel shows one possible reference scenario that includes all climate and energy policies implemented as of 2017, and right panel shows avoided warming (relative to the reference scenario) under a scenario that limits global warming to 1.5°C. Both scenarios are taken from JRC GECO (2018). CO2-dominated sectors are in shades of blue, methane-dominated sectors are in shades of red. “Land use” refers to “land use, land-use change, and forestry.” “Other CO2” includes emissions from losses of the energy transformation industry (excluding power and heat generation).
Similarly, GWP100 obscures the importance of emissions reductions from methane-dominated sectors—cutting their avoided warming potential almost in half in 2050 (52% model; 24% metric) and by almost a third in 2100 (36% model; 22% metric). This yields a misrepresentation of the relative potentials of economic sectors to mitigate additional warming (Figure 2).
While alternative metrics for comparing GHGs with different lifetimes have been proposed (e.g., Ocko et al., 2017), there is no single simplified metric that can capture impacts over all timescales. Nevertheless, we test the accuracy of two other popular climate metrics: GWP20 and GWP* [a metric that evaluates the relative climate impact of a change in the emission rate of a short-lived climate pollutant compared to a pulse of CO2 (Cain et al., 2019)]. In 2050, both GWP20 and GWP* can provide sectoral shares that are consistent with the climate model (Supplementary Figure S4). In 2100, neither metric replicates the climate model as closely; GWP20 slightly overvalues the contributions of methane-dominated sectors and GWP* slightly overvalues the contributions of CO2-dominated sectors (Supplementary Figure S4). However, both can perform better than GWP100 out to 2100. We also note that the specific distortion of methane's contributions assessed via cumulative GWP is highly dependent on the methane emissions pathway under consideration in addition to the chosen time horizon.
Climate decision making must adopt new standard practices
Given how GWP100-based CO2e calculations distort the roles of economic sectors in contributing to future warming, relying solely on GWP100 can lead to suboptimal policies and priorities by misleading climate actors from the top levels of government (e.g., U.S. NDC)2 to grassroots organizations. This is because the importance of methane emissions in several sectors is systematically underestimated by GWP100.
The prominent role of methane in climate change and its mitigation has been increasingly recognized (UNEP, 2021), culminating in the recent Global Methane Pledge. However, GWP100/CO2e in isolation continues to be pervasive in climate policy, advocacy, and education. Yet there are examples of acknowledgment of the metric issue by stakeholders (such as work by the Irish Climate Change Advisory Council to establish multi-gas GHG budgets, as well as the State of New York publishing their emissions inventory using GWP20). Given that prioritizing sectoral mitigation efforts is often necessary under cost and political constraints, the current sectoral share distortion imposed by GWP100/CO2e risks mis-prioritizing sectors for emissions reductions, undervaluing the benefits of methane-sector mitigation—especially in the near-term—and potentially overlooking important abatement measures. This can have implications for the temperature outcomes of climate policies. For example, if CO2-dominated sectors are regularly prioritized for mitigation, the realized temperature benefits in the near-term will be lower than anticipated because the remaining warming impact from methane-dominated sectors will be underestimated.
The bottom line is that GWP100 should never be singularly relied upon for emissions assessments. Fortunately, myriad alternative or supplemental metric strategies have been proposed. These include dual-reporting of emissions using two metrics to capture both the near- and long- term climate impacts, (Ocko et al., 2017) separately indicating contributions of short- and long-lived pollutants to a total CO2e target, (Allen et al., 2022) or defining metric time horizons according to global temperature goals (Abernethy and Jackson, 2022). While there is no “one-size-fits-all” metric for climate decision making (IPCC, 2021), this should not be a reason to always defer to the status quo. We urge the climate policy community to recognize the necessity for additional metrics or methods that can adequately convey the impacts of GHG emissions in both the near- and long-term. Furthermore, we recommend that:
1. All emissions accounting start by breaking down emissions by gas in units of mass. This is an essential practice for ensuring that the most appropriate evaluating method and time horizon can be used by making the underlying information available. Too often emissions are presented—whether for a company, a sector, or an entire country—only as a combined CO2e. Without the breakdown by gas, it is impossible to convert the emissions to any other metric or input accurately into a model. The UNFCCC is a prime example of requiring emissions inventories to be broken down by gas, and we strongly recommend this practice be widely adopted.
a. We also recommend that this method of emissions accounting by gas be extended to emissions projections and commitments, such as those included in countries' NDC targets.
2. Data tools, inventories, and reports allow users to see GHG emissions according to different metrics, side by side. This means reconfiguring the way we present sectoral emissions data to better account for varying sectoral contributions to warming over time. This would introduce a user-oriented decision-making process regarding which metric is most appropriate for the application at hand.
3. Emissions totals and percentage contributions that combine multiple greenhouse gases using a specific time-horizon in the aggregation should never be reported without explicitly stating the time-horizon of the climate metric used to calculate them. This would bring the time-dependency of the information to the forefront.
These new standard practices must become embedded across the climate science and policy communities if we want to secure the best chance at reducing emissions and mitigating the worst of climate change over all timescales.
Data availability statement
The original contributions presented in the study are included in the article/Supplementary material, further inquiries can be directed to the corresponding author.
Author contributions
IBO designed the study. NC-S carried out the experiments with help from TS. NC-S analyzed the results. IBO and NC-S prepared the visuals. All authors wrote the article. All authors contributed to the article and approved the submitted version.
Funding
NC-S was funded by the High Meadows Foundation.
Conflict of interest
The authors declare that the research was conducted in the absence of any commercial or financial relationships that could be construed as a potential conflict of interest.
Publisher's note
All claims expressed in this article are solely those of the authors and do not necessarily represent those of their affiliated organizations, or those of the publisher, the editors and the reviewers. Any product that may be evaluated in this article, or claim that may be made by its manufacturer, is not guaranteed or endorsed by the publisher.
Supplementary material
The Supplementary Material for this article can be found online at: https://www.frontiersin.org/articles/10.3389/fclim.2023.1163557/full#supplementary-material
Table 1. Data Appendix; emissions data and GWP calculations.
Data Sheet 1. Model Parameters; used to run MAGICCv6 in this study.
Data Sheet 2. Supplementary Material; including supplemental figures, experiment descriptions, and tabular data.
Footnotes
References
Abernethy, S., and Jackson, R. B. (2022). Global temperature goals should determine the time horizons for greenhouse gas emissions metrics. Environ. Res. Lett. 17, 2. doi: 10.1088/1748-9326/ac4940
Allen, M. R., Peters, G. P., Shine, K. P., Azar, C., Balcombe, P., Boucher, O., et al. (2022). Indicate separate contributions of long-lived and short-lived greenhouse gases in emissions targets. Npj Clim. Atmos. Sci. 5, 5. doi: 10.1038/s41612-021-00226-2
Balcombe, P., Speirs, J. F., Brandon, N. P., and Hawkes, A. D. (2018). Methane emissions: choosing the right climate metric and time horizon. Environ. Sci. Process. Impacts 20, 1323–1339. doi: 10.1039/C8EM00414E
Cain, M., Lynch, J., Allen, M. R., Fuglestvedt, J. S., Frame, D. J., and Macey, A. H. (2019). Improved calculation of warming-equivalent emissions for short-lived climate pollutants. Npj Clim. Atmos. Sci. 2, 29. doi: 10.1038/s41612-019-0086-4
IPCC (2021). Climate Change 2021: The Physical Science Basis. Contribution of Working Group I to the Sixth Assessment Report of the Intergovernmental Panel on Climate Change. Cambridge University Press. doi: 10.1017/9781009157896
Keramidas, K., Tchung-Ming, S., Diaz Vazquez, A., Weitzel, M., Vandyck, T., Desprãs, J., et al. (2018). Global Energy and Climate Outlook 2018: Sectoral Mitigation Options Towards a Low-Emissions Economy. Publications Office of the European Union. doi: 10.2760/67475
Lund, M. T., Aamaas, B., Stjern, C. W., Klimont, Z., Berntsen, T. K., and Samset, B. H. (2020). A continued role of short-lived climate forcers under the shared socioeconomic pathways. Earth Syst. Dyn. 11, 977–993. doi: 10.5194/esd-11-977-2020
Lynch, J., Cain, M., Frame, D., and Pierrehumbert, R. (2021). Agriculture's contribution to climate change and role in mitigation is distinct from predominantly fossil CO2-emitting sectors. Front. Sustain. Food Syst. 4, 518039. doi: 10.3389/fsufs.2020.518039
Meinshausen, M., Raper, S. C. B., and Wigley, T. M. L. (2011). Emulating coupled atmosphere-ocean and carbon cycle models with a simpler model, MAGICC6 – Part 1: model description and calibration. Atmos. Chem. Phys. 11, 1417–1456. doi: 10.5194/acp-11-1417-2011
Ocko, I., Hamburg, S. P., Jacob, D. J., Keith, D. W., Keohane, N. O., Oppenheimer, M., et al. (2017). Unmask temporal trade-offs in climate policy debates. Science 356, 492–493. doi: 10.1126/science.aaj2350
Ocko, I. B., Sun, T., Shindell, D., Oppenheimer, M., Hristov, A. N., Pacala, S. W., et al. (2021). Acting rapidly to deploy readily available methane mitigation measures by sector can immediately slow global warming. Environ. Res. Lett. 16, 054042. doi: 10.1088/1748-9326/abf9c8
The Kigali Amendment (2016). The Amendment to the Montreal Protocol Agreed by the Twenty-Eighth Meeting of the Parties. Available online at: https://ozone.unep.org/treaties/montreal-protocol/amendments/kigali-amendment-2016-amendment-montreal-protocol-agreed
UNEP (2021). Global Methane Assessment: Benefits and Costs of Mitigating Methane Emissions. Nairobi: United Nations Environment Programme (UNEP) and Climate and Clean Air Coalition.
Keywords: climate change, climate metrics, greenhouse gas emissions, climate modeling, methane, climate goals, climate policy, economic sectors
Citation: Cohen-Shields N, Sun T, Hamburg SP and Ocko IB (2023) Distortion of sectoral roles in climate change threatens climate goals. Front. Clim. 5:1163557. doi: 10.3389/fclim.2023.1163557
Received: 10 February 2023; Accepted: 02 May 2023;
Published: 19 May 2023.
Edited by:
Fai Fung, Met Office, United KingdomReviewed by:
Barry McMullin, Dublin City University, IrelandCopyright © 2023 Cohen-Shields, Sun, Hamburg and Ocko. This is an open-access article distributed under the terms of the Creative Commons Attribution License (CC BY). The use, distribution or reproduction in other forums is permitted, provided the original author(s) and the copyright owner(s) are credited and that the original publication in this journal is cited, in accordance with accepted academic practice. No use, distribution or reproduction is permitted which does not comply with these terms.
*Correspondence: Ilissa B. Ocko, iocko@edf.org