Harnessing climate services to support community resilience planning: lessons learned from a community-engaged approach to assessing NOAA’s National Water Model
 Kristin B. Raub
 Joshua Laufer2
  Stephen E. Flynn
 Shemilore Daniels
 Trissha Sivalingam
- 1Consortium of Universities for the Advancement of Hydrologic Science, Inc., Arlington, MA, United States
- 2Global Resilience Institute, Northeastern University, Boston, MA, United States
Introduction: Inland and coastal flooding and other water-based natural disasters are projected to increase in severity, frequency, and intensity as global temperatures rise, placing a growing number of US communities at risk. Governments at the local, state, and federal levels have been embracing resilience planning to better predict, mitigate, and adapt to such shocks and hazards. A growing number of climate services have been developed to aid communities engaged in these efforts to access, interpret, and make decisions with climate-related data and information. An important tool for potentially supporting this planning is the National Water Model (NWM), created by the National Oceanic and Atmospheric Administration’s (NOAA) National Water Center (NWC). The NWM is a river and streamflow model that can forecast conditions for the continental United States.
Methods: However, community end-users were not being effectively engaged in ways that result in widespread tool use and adoption. From 2021 to 2023, seven geographically diverse US communities agreed to participate in a study to understand how the NWM might be applied in resilience planning. Interviews and collaborative sessions were conducted with NWC/NOAA staff and community resilience stakeholders in Burlington, VT; Cincinnati, OH; Portland, OR; Charlotte, NC; Boulder, CO; Minneapolis; MN; and Houston, TX
Results and Discussion: Results provide an improved understanding of potential applications of the National Water Model and have identified actions to overcome the barriers to its use among municipal and regional resilience planners. This research yielded a set of recommendations, co-developed between the seven communities and NWC/ NOAA staff, for how these barriers could be overcome to facilitate wider use of the NWM and its data and visualization services in resilience planning. This study highlights the NWM’s applicability at shorter timescales in resilience planning and points to a more general need for climate services to accommodate near-, medium-, and longterm time frames. The study also found many community stakeholders who use water science and information in resilience planning have diverse disciplinarily backgrounds. Importantly, the majority were not trained hydrologists or water scientists, pointing to the critical need for climate service developers, including the NWC, to embrace co-development efforts that involve a wider range of end-users, including community resilience planners.
1 Introduction
Climate change is causing an increase in the frequency and severity of flood events and other water related hazards. Flooding is the costliest disaster type in the United States (Cigler, 2017) and flood risk, especially in urban (Hemmati et al., 2020) and inland communities (Tate et al., 2021), is only increasing. Hurricanes and coastal storms only serve to compound flood risk, such as the unprecedented levels of flooding that occurred with Hurricane Harvey near Houston, Texas in 2017 (Regier et al., 2022). Many communities have begun to integrate resilience principles into their policies and interventions to better prepare for future disasters and challenges exacerbated by climate change. Although the definitions of the term “resilience” are varied, its use relative to people and their environment describes a system’s ability to recover from a crisis by engaging in processes of both resistance and adaptation (Mayer, 2019). Resilience planning generally aims to achieve two goals: (1) ensuring that communities have access to critical services and needs following a disaster, and (2) mitigating the probability of communities suffering impacts from future disasters that could compound on each other over time (Environmental Finance Center at Sacramento State, 2020). In addition, building resilience can also help address social inequities, long-term disturbances, and inadequate environmental management (Saikia et al., 2022). Developing an effective resilience plan requires a bottom-up, iterative, and dynamic process engaging a diverse set of stakeholders (Alibašić, 2022). Additionally, it requires incorporating a diversity of sources of information to include numerous forms of climate data that makes it a complex and resource intensive process (Woodruff et al., 2022). Communities would clearly benefit from having access to science-based information and practical tools that can assist them in integrating resilience into their urban planning, environmental management, and climate adaptation efforts.
A growing number of tools and resources are being developed to facilitate the translation of climate science data and information for practical applications that can assist communities with resilience planning (Hewitt et al., 2020; Jacobs and Street, 2020). These climate services provide information and products with a scientific foundation with the intent to improve the public’s awareness and comprehension of how environmental conditions can affect their choices and behavior (Onwuemele, 2014; Hewitt et al., 2020). These include providing information on historical weather patterns, anticipated future climatic conditions, temperature and precipitation scenarios, sea-level changes, and their potential effects on various industries, including agriculture, infrastructure, health, and other fields (Onwuemele, 2014). Climate services can help at-risk communities more effectively manage climate variability, save lives, and preserve livelihoods. To harness this potential more needs to be done to improve utilization and highlight the value-added of climate services and other climate risk management tools for policy makers and communities at risk (Onwuemele, 2014; Vaughan et al., 2016; Hewitt et al., 2020; Lioubimtseva and da Cunha, 2023).
The National Water Model (NWM), which is overseen by the National Oceanic and Atmospheric Administration’s (NOAA) National Water Center (NWC), is an important example of a climate service that can help communities to confront their flood-related hazards. The National Water Model is a mathematical modeling framework of water and weather cycles that tracks and predicts changes in precipitation, snowmelt, near-surface soil moisture, streamflow, and evapotranspiration across the continental US (National Weather Service, NOAA 2016). The model provides a depiction of water patterns based on historical forecast data ranging from 3 h to 30 days, and takes into account variables such as changing elevations, soil types and layers, vegetation types, and more; the model also provides data services, map visualizations, and four levels of guidance (analysis and assimilation, short range forecast, medium range, and long-range forecasts; National Weather Service, NOAA, 2016). The NWM complements NOAA’s coverage on water patterns from 3,600 river forecast points, and in the continental United States configuration provides stream outflow results for 2.7 million river reaches. This model provides greater coverage in underserved locations that may not have traditional forecasts that can provide insight on changes in river levels and patterns of flow. The NWM complements existing water and weather tracking tools and provides hydrological guidance at scales of 1 km and 250 m grids (Office of Water Prediction, n.d.). The NWM is continuing to go through a series of planned updates with NWM v.3.0 having just launched in 2023 and “the continued success of the NWM ultimately depends on the continual improvement of model accuracy and capabilities” (Cosgrove et al., 2024, p. 22).
While there is clearly practical value associated with predicting when and where water will be, climate services such as the NWM are generally underutilized (Onwuemele, 2014; Vaughan et al., 2016; Raub and Cotti-Rausch, 2019; Hewitt et al., 2020; Lioubimtseva and da Cunha, 2023). Even when climate services are used, communities frequently apply them incorrectly or in ways that are not as intended by their developers (Raub and Cotti-Rausch, 2019). To improve the efficacy of climate services, some developers have embraced the need to move toward a bottom-up approach that directly involves developers and end-users in co-developing resources (Meadow et al., 2015; Daniels et al., 2020; Jacobs and Street, 2020).
From 2021 to 23, the authors leveraged community-engaged methods in seven geographically diverse U.S. communities to understand how the NWM might be applied in resilience planning: Houston and Galveston area, TX; Portland, OR; Boulder, CO; Minneapolis, MN; Charlotte, NC; Cincinnati, OH; and Burlington, VT. The studies incorporated a bottom-up/co-development approach with the twin objectives of identifying the applicability of the NWM in community resilience planning and developing insights that can be generalized to other climate services being developed for use in the resilience-related planning context. Results from this study have yielded important insights and recommendations around four groupings on both the potential and barriers of using tools such as the NWM in community resilience planning: (1) potential use cases of the NWM, or other similar climate services, in community resilience-related planning, (2) how to raise awareness of the NWM, (3) how to improve its accessibility to diverse community stakeholders, and (4) what features and capabilities community end-users are looking for in the NWM and other climate services to better assist their resilience planning. These recommendations have the potential to more widely inform efforts to provide climate services that advance resilience planning.
2 Methods
The study’s methods for engaging the communities were designed to develop a user-perspective of how the NWM could be integrated into community resilience planning. This understanding could then inform the National Water Center on how it could take steps to facilitate wider use of the NWM. The methodology involved the research team undertaking a series of four activities: (1) conducting online interviews with community resilience stakeholders and NOAA/NWC staff, (2) organizing and facilitating collaborative sessions held with each individual community, (3) completing an analysis of the data collected, and (4) inviting each study participant to react to their community’s summary results as a form of data validation. Each of these activities is described in the sections below.
The seven communities (Houston, TX; Burlington, VT; Cincinnati, OH; Portland, OR; Charlotte, NC; Boulder, CO; and Minneapolis, MN) engaged in this study were selected against the following criteria: (1) they have engaged in resilience, adaptation, or climate planning (and have a strong capacity for planning); (2) each community is geographically diverse across the United States and has experienced a water-related hazard within the past 5 years; and (3) the project team was able to identify existing partnerships and ties to these communities which would facilitate stronger community engagement. The geographic, topographic, water governance, and water hazard diversity of the seven communities was intentionally aimed to better represent the range of potential end-users for the NWM in their unique contexts.
2.1 Interviews
Data was collected primarily through interviewing stakeholders from the selected communities. Target participants were initially identified from a search of public facing websites in roles such as city planners, floodplain managers, academics, engineers, and GIS specialists from local government, non-profits, local universities, and the private sector. A snowball recruitment technique was employed during each interview to identify additional community participants who could provide useful perspectives on the value of the NWM in resilience-related planning efforts. In addition, interviews were conducted with NOAA/NWC staff to provide tool developers’ perspectives on use applications of the NWM.
All interviews were conducted remotely via Zoom between February 2022 through June 2023. The interviews sought to investigate the interviewees experience with resilience planning, including what resilience planning looks like in each community, the information sources and needs that the community have for dealing with water-related vulnerabilities, the interviewees’ experience with hydrologic modeling and the NWM, and ideas for how the NWM could be used in community resilience-related planning and how the NWC could facilitate this use. The interview protocols are provided in Appendices E, F.
Once the community interviews were completed, a collaborative session for each community was held remotely via Zoom. The objective of each collaborative session was to engage community resilience-stakeholders and NOAA/NWC staff in a process of co-learning. The participants worked together on generating recommendations for how the NWM could be used in community resilience planning and how the NWC could facilitate this use.
Each session began with an educational component to share the summary interview results from that community and to provide general information on the NWM. Depending on the number of participants, the community stakeholders and NOAA/NWC staff were then either separated into breakout rooms or hosted as a single group. Members of the research team facilitated a discussion between the stakeholders and NOAA/NWC staff to generate a set of actionable recommendations. If the session utilized breakout rooms, each group reported their recommendations back to the broader group and time was allowed for further deliberation and agreement. A copy of the collaborative session agenda can be found in Appendix G.
The data from the collaborative sessions were combined with the data from each community’s interviews for further analysis. A diagram of the interview process in the context of the broader methodology is provided in Figure 1.
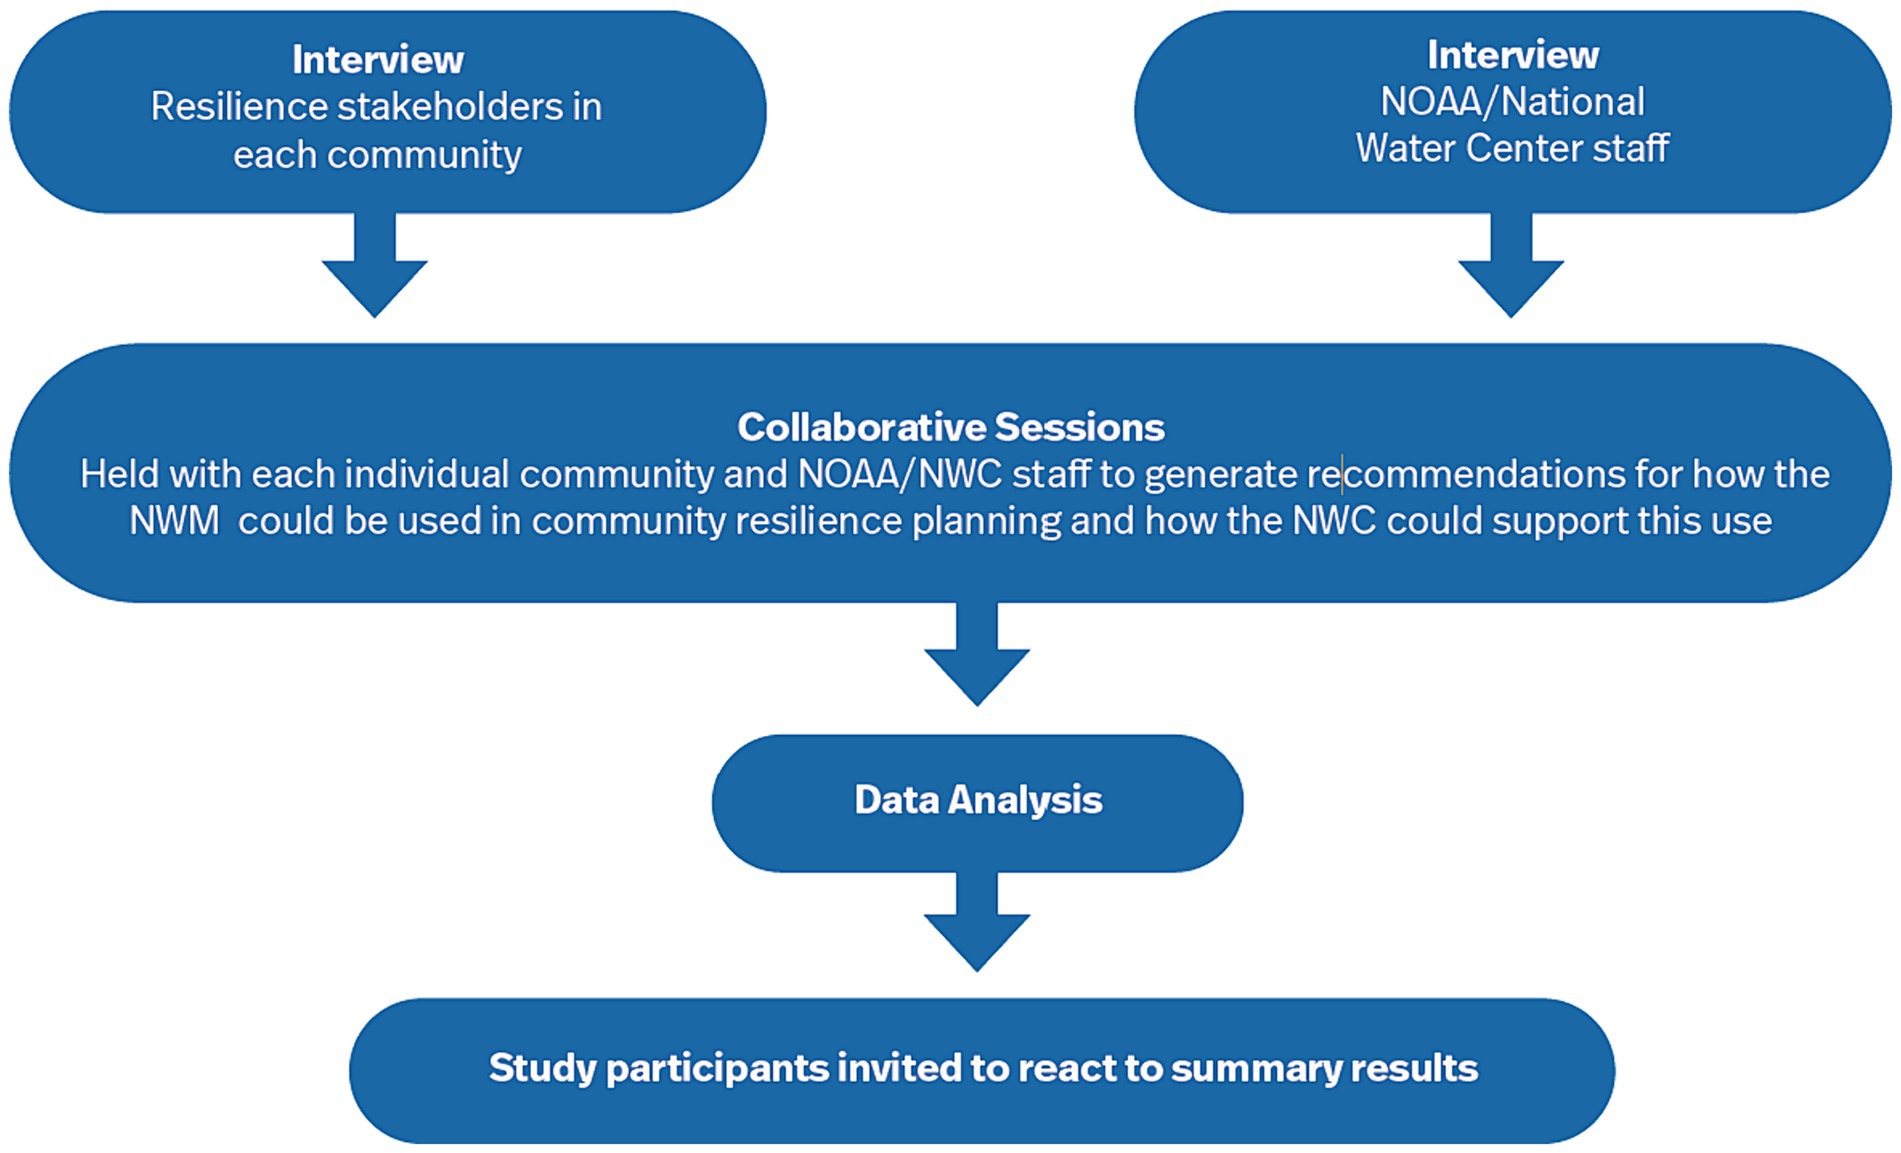
Figure 1. Diagram of the methodology employed in this study. Two sets of interviews were conducted with resilience-related stakeholders in each community and NOAA/NWC staff to understand their baseline perspectives. Then each group was invited to co-develop recommendations in a collaborative session. The interview data and collaborative session outcomes were analyzed and a summary of the results were provided to each stakeholder so that they could react to the results.
2.2 Data analysis
The interview and collaborative session data were analyzed in two ways: (1) a qualitative content analysis to identify and quantify key themes, and (2) a purely qualitative thematic analysis to identify recommendations for how the NWM could be used in community resilience-related planning and how the NWC could facilitate this use.
2.2.1 Qualitative content analysis of key themes
A codebook was developed to analyze the data for quantifiable themes on community characteristics, characteristics of resilience planning in communities, areas of expertise of those engaged in resilience planning, and their information uses, information needs, and the decision points related to choosing between information sources. Each interview was analyzed for these themes and then the number of interviewees who identified each theme was quantified. A copy of the codebook used for the qualitative content analysis can be found in Appendix A.
2.2.2 Thematic analysis to identify and analyze recommendations
A second codebook was designed to qualitatively capture the diversity of ideas that the participants had for how the NWM could be used in community resilience planning and how the NWC could facilitate this use and then organize them into key themes. This was accomplished by undertaking a thematic analysis to identify the diversity of ideas that occurred across all the participating communities. A three-step process was developed to support this analysis.
First, each interview was analyzed for articulations of challenges, questions, needs, or ideas related to the use of water-related data, hazards, or planning that the end-users identified. These included questions the interviewees had about the NWM, information gaps and associated data needs for supporting successful water-related planning or management, and insights on how the NWM could be used in resilience planning or how the NWC could facilitate this use.
Second, once the challenges, questions, needs, and ideas had been identified, the data underwent a thematic analysis to identify appropriate themes and sub-themes. The two main themes were recommendations directed toward the community (i.e., the main action to implement the recommendation would be initiated by the community) and recommendations directed toward the NWC (i.e., the main action to implement the recommendation would be initiated by the NWC). The main sub-themes were hypothetical uses of the NWM by communities, awareness of the NWM, accessibility of the NWM, and requested capabilities for the NWM.
Third, once the thematic analysis was complete, the raw coded interview data was rephrased by the research team to form a recommendation or articulated need, while preserving the original intent of the interviewee. For example:
“… have more accessible communication-update website, make it more user-friendly. Make connection on how to use this data. It feels very inaccessible. Not sure how I would use this.”
Was rephrased to:
“The NWC should update the website to make communications about the NWM more accessible and user friendly. The interviewee reported that it ‘feels very inaccessible’ and is unsure how they would use it.”
Additionally, the rephrasing process combined similar coded material into a single recommendation while preserving the nuance of each. A codebook that provides more details on the method of analysis can be found in Appendix B.
2.3 Data validation
Following each community’s collaborative session, each participant received an aggregate, community-level summary of their community-specific results and then were asked to provide feedback within two-weeks. Any corrections or additional feedback received was incorporated. After the two weeks had passed and the feedback had been taken into account, the results from the study were considered “validated.”
3 Results
In addition to response rate, the following sections detail the interview and collaborative session results in five areas: (1) commonalities and differences of community characteristics, (2) water-related community hazards, (3) what resilience planning looks like across communities, (4) community information uses and needs, and (5) the recommendations for how the NWM could be used in community resilience planning and how the NWC could facilitate this use.
3.1 Response rate
There were 95 interviewees across a total of seven communities with an overall response rate of 28%. Burlington (20 interviewees), Cincinnati (11 interviewees), Portland (16 interviewees), Boulder (16 interviewees), and Minneapolis (14 interviewees) were each consistent with an approximately 30% response rate (28, 32, 30, 33, 37%, respectively), whereas Houston had a response rate of 48% (12 interviewees) and Charlotte (6 interviewees) only had a response rate of 9%. Due to Charlotte’s low response rate, results for this community will be presented in the following sections, but strong conclusions cannot be drawn. The NOAA/NWC interviewees had an overall response rate of 56% (14 interviewees).
3.2 Community characteristics
The intentionally geographically and topographically diverse selection of communities yielded unique water landscapes and challenges in each, but also provided some generalizable issues and aspects associated with water governance.
Burlington: Burlington has a predominantly flat topography at the edge of the Champlain Valley, which historically has caused difficulties in trying to control stormwater run-off. As the largest city in a small state, there is a strong link between local (municipalities), regional (regional planning commissions), and state level planning; therefore, the “Burlington” case study was expanded to include regional-and state-level efforts. Interviewees reported urban and inundation flooding concerns in the Burlington area, but the rest of the state had more concerns with fluvial erosion and the movement of river corridors. The catastrophic flooding associated with Hurricane Irene in 2011 led the state to require the integration of flood resilience as a requirement in many planning efforts. The state has the Flood Ready Vermont website, the River Corridors program, and the Emergency Relief and Assistance Fund (ERAF) as examples of the forward-thinking efforts underway.
Cincinnati: Cincinnati sits at the confluence of the Licking, Little Miami, Great Miami, and Ohio Rivers, with the latter serving as the boundary between Ohio and Kentucky. The city is surrounded by hills ranging between 400 and 600 feet above the Ohio River. Water governance in the Cincinnati area necessitates interstate and regional collaboration given the path of Ohio River and proximity of the city to the Kentucky border. The community faces urban-related flooding challenges (stormwater, Combined Sewer Overflows, riverine flooding, mud/landslides, protecting critical dams, levees, and flood pump stations that prevent regional flooding). It has also had to deal with a series of storms and tornadoes in 2017 which animated investments in resilience planning within the city and state. There has been a focus on mitigating infrastructure and property damage, as well as maintaining high water quality.
Portland: The Columbia and Willamette Rivers are the twolargest rivers in the greater Portland region. The 1996 Willamette River flood was the largest recent flood event (the flood of record for the Federal Emergency Management Agency [FEMA]), but the area has not had a large flood event for around 30 years. While the City of Portland has engaged in multi-jurisdictional planning efforts, it has ample municipal-level planning capacity allowing it to operate largely independently from the broader county. The State of Oregon is unique in that it has state-level planning requirements outlined in the Oregon Statewide Land Use Planning Goals and it has a strong ethic of networked programs. Portland falls within the Multnomah County Drainage District, which is a special district that works to reduce flood risk through managing the levee system, responding to emergencies, and managing drainage (drainage in the area is controlled by levees). While interviewees reported flooding, flash flooding, and landslides as some of their top water-related climate concerns, they also emphasized that flood-mitigation planning does not occur at the county level and that some counties are often not involved in planning.
Charlotte: The City of Charlotte is located a few miles east of the Catawba River, and is proximate to several manmade lakes: Lake Norman, Lake Wylie, and Mountain Island Lake. The city resides within the Piedmont plateau, with the Appalachian Mountains located west of the Piedmont plateau and the Coastal Plain to its east. The Piedmont plateau is hilly and encompasses the most populous and urbanized cities in the state, one of which is Charlotte. For Charlotte, as well as North Carolina as a whole, flooding is a frequent and impactful hazard that tops the hazard list. For example, Eastern North Carolina encountered catastrophic flooding in 2016 and 2018 with Hurricanes Matthew and Florence. The eastern third of the state is low-lying with watersheds draining to the coast, while the western third of the state is mountainous, resulting in distinct but dangerous flooding challenges associated with complex riverine systems. Drought is also a concern, but it is secondary to flooding.
Boulder: Boulder is located in a wide valley basin, bounded by the Great Plains to the east and Rocky Mountains to the west, with the Boulder Creek supplying the primary flow of water. Boulder’s top hazard is flooding (especially, flash flooding and risk from channel migration and sediment erosion hazards). Drought and wildfires are also a concern with the December 2021 Marshall fire in Boulder County, the most destructive in Colorado history. Furthermore, the 2013 Floods were the “flood of record” which triggered FEMA and Community Development Block Grant (CDBG) funding in response to damages to homes and infrastructure. Colorado has several flood-and resilience-centric offices and programs. These include the Fluvial Hazard Zone Program, which helps “communities better identify, map, and plan for the flood hazards associated with erosion, sediment deposition, and other dynamic river processes” (Colorado Water Conservation Board, no date), and the Colorado Resiliency Office, which is housed within the Department of Local Affairs and was formed in a recovery aspect following the 2013 floods. Wildfire Ready Watersheds is a program developed by the Colorado Water Conservation Board which provides guidance for how to identify high risk priority areas after wildfires and their impacts to watersheds.
Minneapolis: Minneapolis and St. Paul are at the headwaters of three major watersheds, with water flowing away from the area to other states further down the Mississippi. There are two major waterways - the Mississippi River and the Minnesota River, which meet in the county. The Minneapolis area also has some unique geographic vulnerabilities (karst topography), which complicates water related hazards. For example, there are sandstone caves under downtown Minneapolis which can serve as unexpected conduits for stormwater, drinking water, and wastewater flow. These caves can enlarge quickly in response to long-term or acute volumes of flow and fail structurally, resulting in costly and hazardous sinkholes. The top threat for the state is flooding; i.e., stormwater flooding, basement flooding. The Minnehaha Creek Watershed District passes through Minneapolis and experiences flash flooding, with a record flood in 2014. In Minneapolis, there is a higher chance of flash flood warning due to the higher amount of impervious surface versus more rural counties. There is also concern about dam safety, as many dams are aging and coming under stress during heavy rain events. Minnesota has a climate change cabinet and subcabinet that reports to the Governor. There is also a resilient communities subgroup.
Houston: Houston, and its surrounding Galveston area, have very flat topography, which exacerbate the flooding challenges they experience. Almost all interviewees cited flooding as the top hazard of concern, along with extreme precipitation events, drought, and water quantity concerns. Hurricane Harvey in 2017 is considered the storm of record for the area, which resulted in catastrophic flooding and localized rainfall totals over 50 inches (US Department of Commerce, N, n.d.). It is the largest city in the Southern region of the U.S.; the flat, highly urban environment featuring extensive impervious surfaces results in water traveling quickly, horizontally, and with less capacity to infiltrate into deeper soil layers. The governance structures addressing water and flooding include municipal, county, special districts, and regional scales resulting in some entities either lacking authority or creating conflict over who does. Examples of planning efforts include the Resilient Houston plan, the Houston-Galveston Area Council’s Our Great Region 2040 plan, and hazard mitigation plans at city, county, and state levels.
NOAA/NWC Staff: While not a community in the sense of the seven described above, the NOAA/NWC staff interviewed for this study also represented geographic diversity and heterogeneity within their roles. Interviewees were based out of offices in Ohio, Massachusetts, New York, South Carolina, Alabama, Maryland, Tennessee, and Texas. NOAA offices included the National Weather Service, River Forecast Centers, Office of Water Prediction, National Water Center, Office for Coastal Management, and Weather Forecast Office’s. Of the 14 NOAA/NWC staff interviewed for this study, half reported being familiar (having experience) with resilience planning (50%), four were aware of resilience planning but did not have experience themselves (29%), and three reported no experience with resilience planning (21%).
3.3 Water-related community hazards
Across these communities, there were seven directly water-related hazards that were identified as water-related challenges: flooding (91% of interviewees), water quality (42%), water quantity (19%), drought (29%), erosion (29%), landslides (14%), and tsunamis (4%). In addition, there were two indirect water-related hazards: earthquakes (8%), and wildfires (13%). Interviewees identified changes to debris flow following a wildfire or damage to flood control infrastructure following an earthquake as relevant to discussions of water hazards. Examples of regional differences include a heightened wildfire concern in Boulder (50% of interviewees), and earthquake concern (44%) and tsunami (25%) concern in Portland. A summary of the hazards identified in each community can be found in Tables 1, 2.
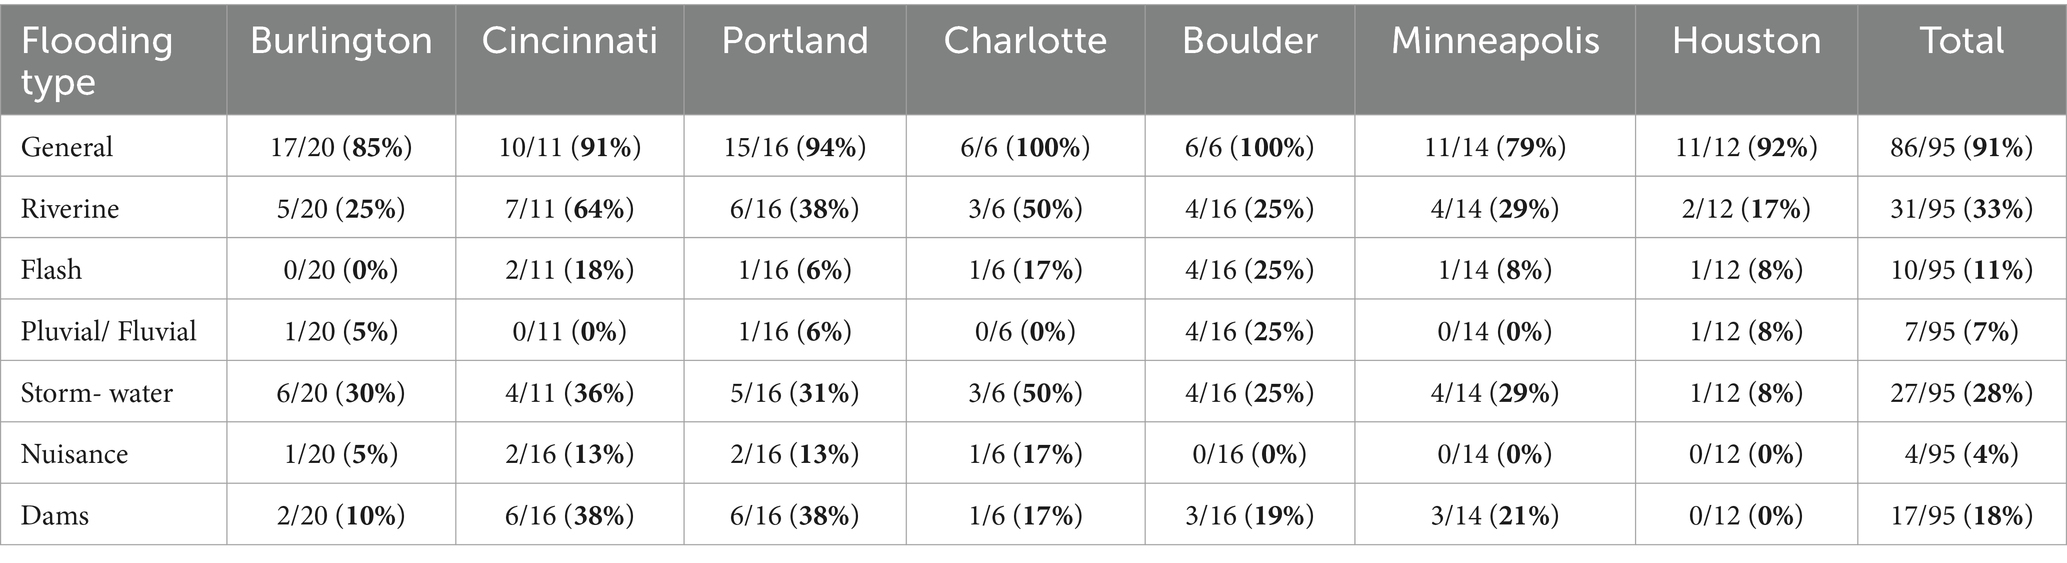
Table 1. A summary of the specific flooding concerns raised by the seven communities.
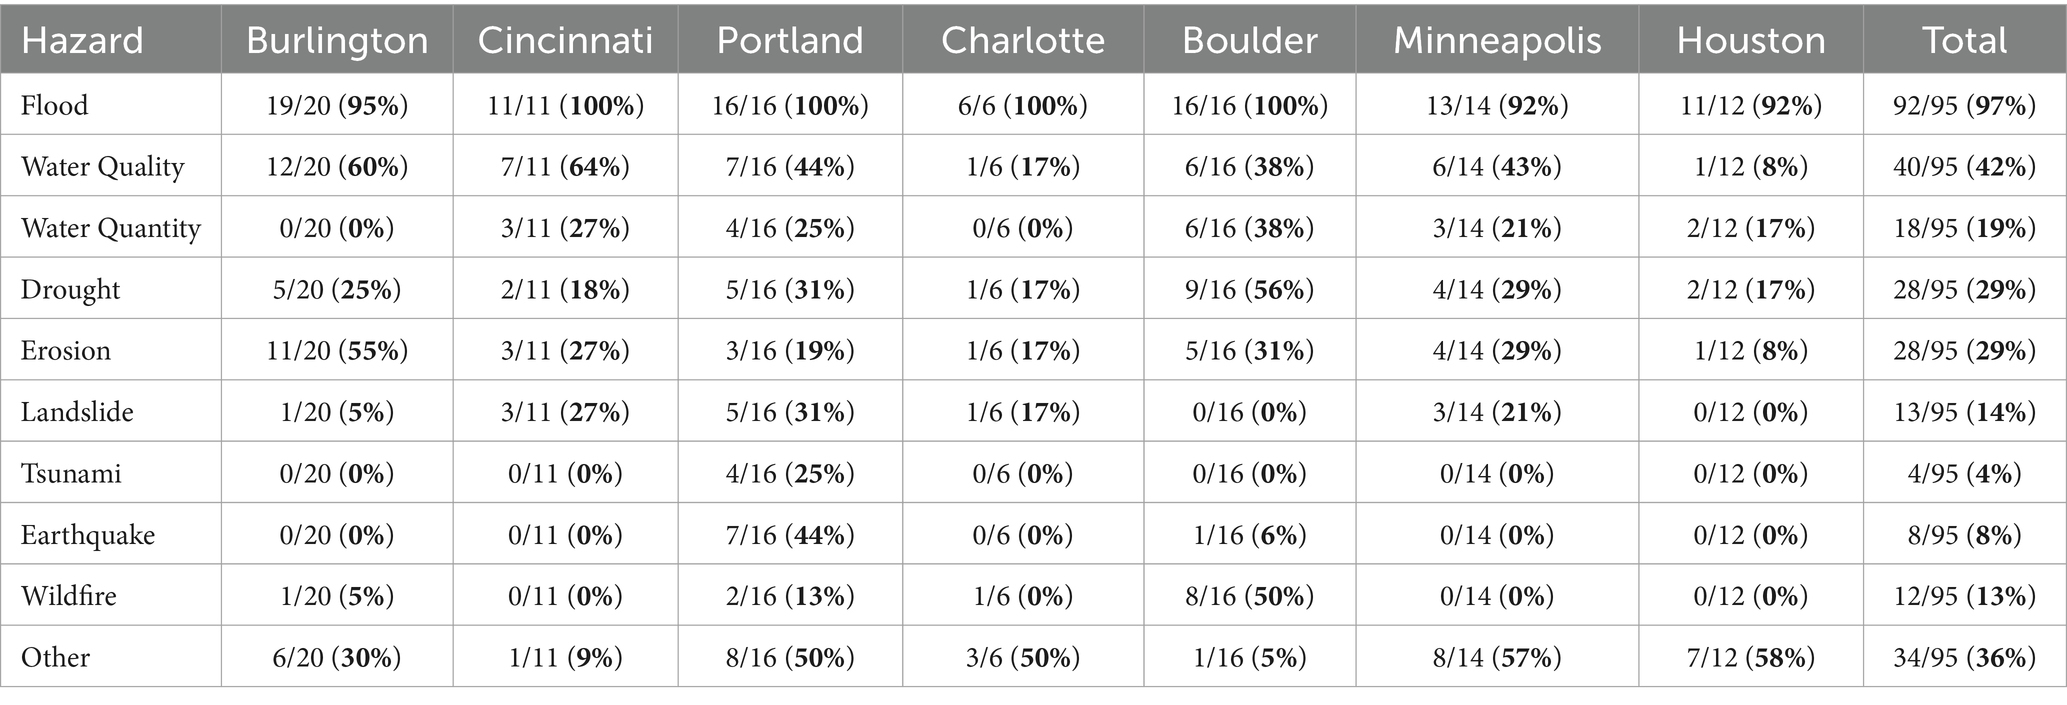
Table 2. A summary of the most common water-related hazards discussed in the context of resilience and planning.
3.4 What does resilience planning look like in communities?
3.4.1 Resilience planning
When interviewees were asked about their experiences with resilience planning, most pointed out that resilience was incorporated as a part of multiple planning efforts as opposed to preparing a dedicated resilience plan. Hazard Mitigation Plans (state, county, and local level) were highlighted across all communities. Examples of other plans include the 2020 Colorado Resiliency Framework, The 2020 North Carolina Climate Risk Assessment and Resilience Plan, City of Boulder Drought Plan, Hennepin County Climate Action Plan, and the 2018 Green Cincinnati Plan. A comprehensive list of the plans discussed in the context of resilience planning can be found in Appendix C.
When describing the resilience planning process, interviewees highlighted several prominent factors. Most commonly, interviewees shared that they engage in planning to identify and define projects or actions that can be taken to achieve their future goals. Their planning is also about prioritizing projects and pursuing funding opportunities (74% prioritization, 60% funding). For instance, an approved hazard mitigation plan is prepared in part to be eligible for FEMA funding. Other plans are prepared to make the community more competitive for funding opportunities when they arise by being able to document that a proposed project will be in support of an established plan.
Other factors affecting the efficacy of resilience planning are staff capacity (31%), adherence to federal regulations (51%), the presence or absence of political will or non-federal regulations (86%), community acceptance (74%), and cost (commonly, cost/benefit analysis; 72%). Interviewees commonly shared that their own staff capacity was a limiting factor in their ability to write new plans, update existing plans, or to implement projects. Additionally, as many plans are written as a condition of eligibility for federal funding, federal regulations were cited as a common factor that guided many of the decisions involved in resilience planning. Some interviewees identified an unwillingness by their elected officials and community members to accept climate change as a real barrier to planning. Finally, concerns raised about the likely near-term costs associated with recommended actions made it difficult to implement resilience plans.
3.4.2 Resilience planners
The snowball recruitment technique allowed the interviewees to play a role in determining who was included in the resilience planning landscape. As such, this revealed a considerable diversity of individuals involved in resilience planning. Those self-identified in the resilience-related planning landscape included hazard mitigation planners, floodplain managers, emergency managers, consultants who were hired to assist with or write plans for communities, academics, water utility professionals, water quality experts, dam operators, hydrologists, and conservation districts. Some interviewees were the primary plan writers, such as state hazard mitigation officers, while others were involved in a supporting role such as academics from local universities. Additional interviewees were consultants from local nonprofits and private sector firms. Those involved in resilience planning had diverse experience with hydrologic models and the NWM. Across the selected communities, only 32% of the interviewees reported having experience running or working with hydrologic models themselves, where the majority either reported no experience (23%) or only experience working with model output but not running/working with hydrologic models themselves (45%). More specifically, most of the interviewees (60%) had never heard of the NWM prior to engaging with this study. Only 6% (6 individuals) of the interviewees reported prior experience with the NWM and 34% of the interviewees reported having heard of the NWM before, but they had not used it.
3.5 Reported information used, needed, and factors influencing data and information choices
To better understand the decision-making landscape of resilience planning, we also investigated the information uses and needs of the interviewees.
3.5.1 Tools and information currently used
To better understand how the NWM could be applied in the context of community resilience planning, this study explored the landscape of information that the resilience stakeholders currently used. The information used to make decisions about water-related vulnerabilities in community resilience planning can be grouped into two categories: federal data sources and local data sources. Federal information sources included information from the United States Geological Survey (USGS; e.g., stream gages), NOAA (e.g., National Weather Service, River Forecast Centers, Atlas 14 or 15), USACE [United States Army Corps of Engineers; e.g., Hydrologic Engineering Center’s River Analysis System (HEC-RAS)], FEMA (e.g., Flood Insurance Rate Maps (FIRM), Hazus), and Environmental Protection Agency [EPA; e.g., Storm Water Management Model (SWMM)]. Local information sources were more diverse and unique to each community. Examples include tools from the Mile High Flood District (CO), information from the CO Water Availability Task Force, the Minnesota Natural Resource Atlas’: Karst Feature Inventory Points and Inventory of Landslides –Historic Landslide Points, The State of North Carolina’s Division of Environmental Quality monitoring data, Hydrology and Hydraulics (H&H) models developed by contractors, the Flood Ready Vermont website, and Vermont River Corridors program. For a comprehensive list of data sources used in resilience planning, see Appendix D.
3.5.2 Information needs
In addition to current information uses, this study explored the information or data gaps that community resilience stakeholders were currently experiencing that hindered their planning efforts and resilience work. The top five water-related vulnerability information needs reported by the communities were: (1) better water-related modeling (42% of interviewees), (2) better information on climate change/future conditions (40%), (3) information/resources to better conduct education and outreach (41%), (4) better flood prediction information (31%), and (5) better mapping (specifically, flood-related mapping, 29%). For example, in Cincinnati calls for improved water-related modeling included better understanding interactions occurring between groundwater and surface water at levees and dams. With regards to the need for a better understanding of future conditions and climate change, Portland interviewees expressed interest in how the future would affect the monitoring and planning of water supplies given that they have a rain-dependent water supply which elevates the importance of understanding what summer flows will be. Snowpack is an important part of their supply and as the climate warms, they assume that the size of the snowpack will reduce, so they want to know how this will impact aquifer recharge.
Pertaining to education and outreach, several Portland interviewees noted that they feel the data they have access to is clear and sufficient for planning, but they struggle with how to communicate that information or to educate the general public about potential risks, e.g., “what is the best way to talk to people about risk without them shutting down?” For improved flood prediction capabilities, one Charlotte interviewee wanted a better means of providing North Carolinians with more advanced flood warnings, particularly for flash flooding from intense storms that spin up quickly during the spring and summer months. Finally in Minneapolis, a need for improved mapping was exemplified by their description of certain areas, notably rural areas, that are unmapped or lack data. Interviewees warned that insufficient resources in rural counties and portions of the state meant that there were areas that cannot always be mapped and limits their ability to gather GIS data to develop flood maps. They reported that while FEMA has mapped or has been contracted to map much of the state, there are still many communities in Minnesota that are less populous or for reasons unknown have not been included in existing FEMA maps.
A detailed summary of resilience-related data and information needs identified by communities can be found in Table 3.
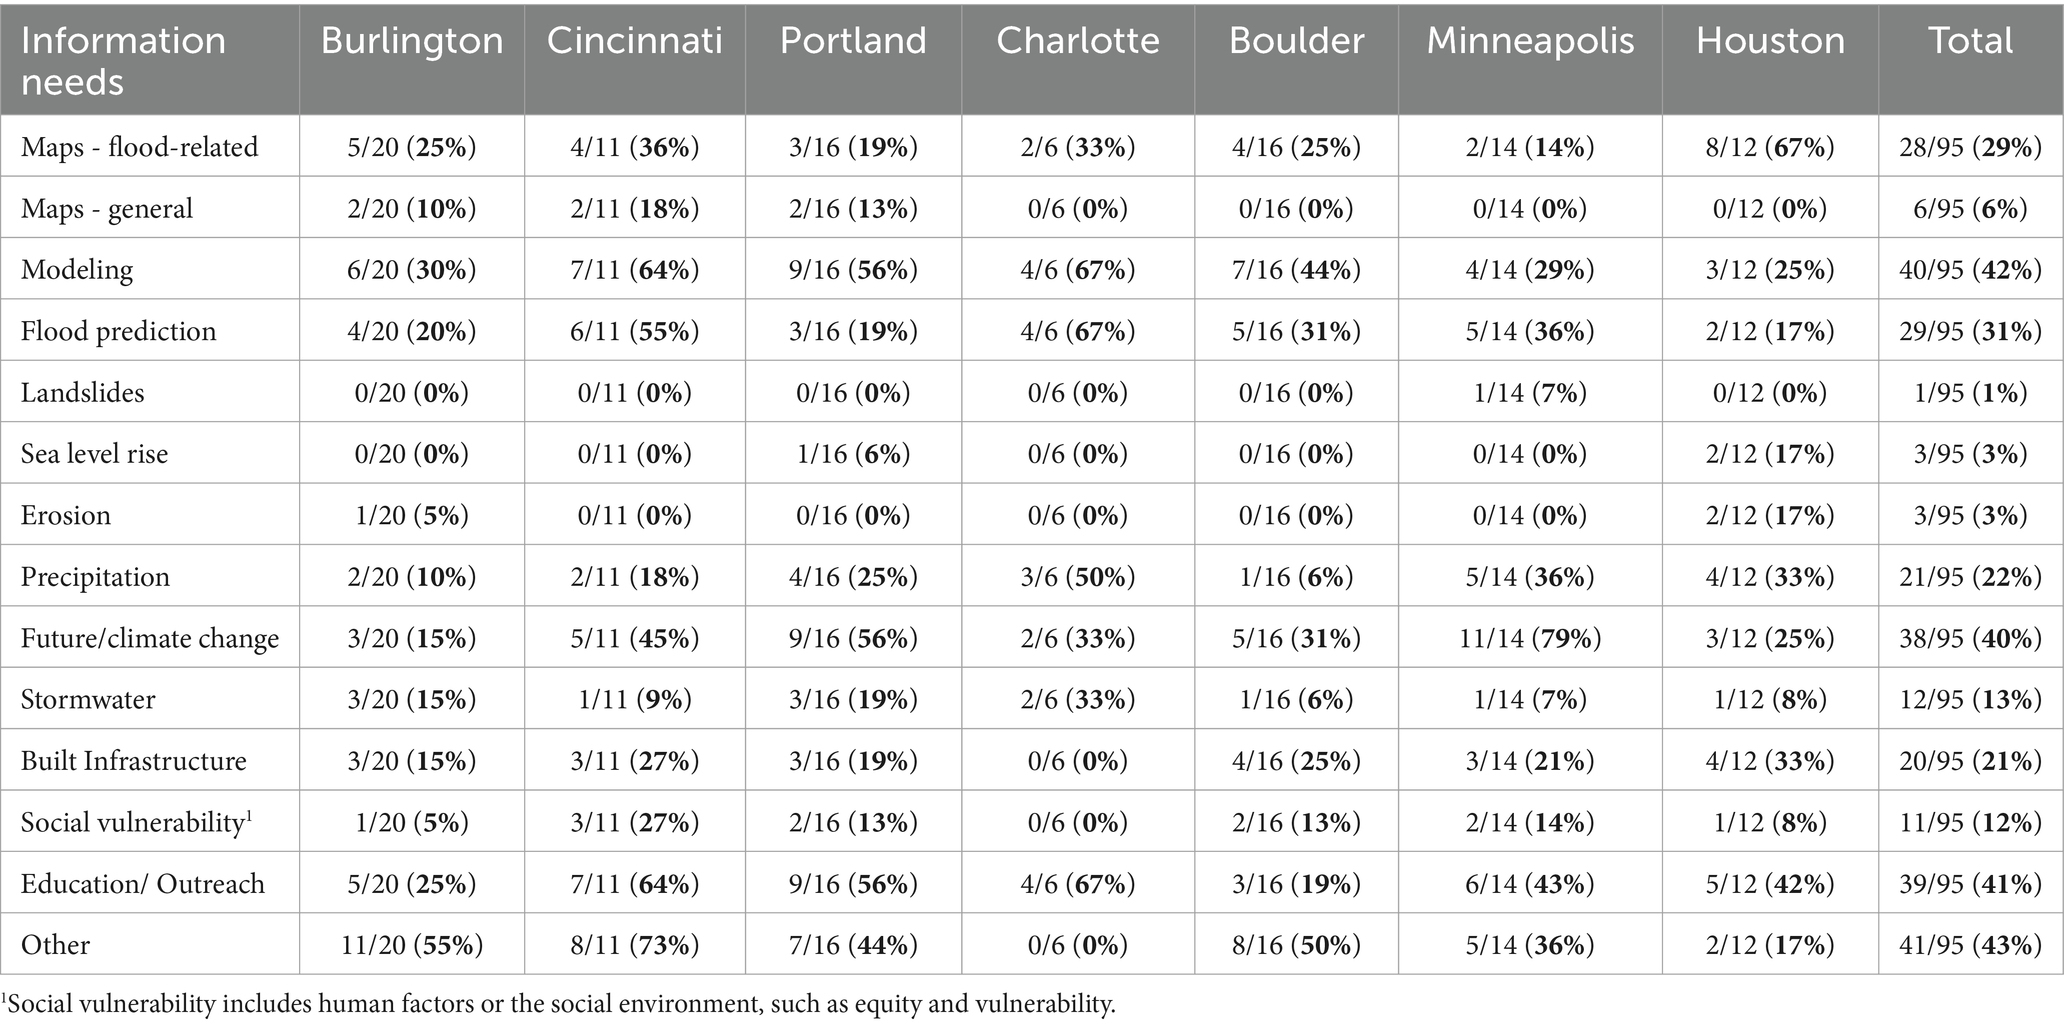
Table 3. A summary of the most common data/information needs in community resilience-related planning.
3.5.3 Choosing among information sources and tools
In general, several interviewees noted that if they were given a choice between having access to a local water model and the NWM, they would prefer the local model. The preference for a local water model stemmed from a perception of higher local accuracy and trust with the model. Interviewees assumed that a local model would be “based on local data and a better reflection of the environment,” more accurate, and better calibrated to a local framework. In terms of trust, if the model was developed by a locally-known and trusted source, one interviewee said that they would stick to the local model. One interviewee explained that their community had drawn on direct community input in adopting their model and therefore speculated it might make their community less receptive to trying to secure the buy-in for using another model.
Despite a preference for a local water model, several interviewees noted potential benefits to using the NWM. First, even though local models are often inherently trusted, one interviewee said that they would look at what animated the development of the NWM and who the developer was as a basis for trusting it as an authoritative source for flooding information. Second, as one interviewee pointed out, while local scale data is generally preferred, “local datasets can go long periods without updates or modifications and are often supplemented with national data.” Therefore, the NWM would be beneficial as it is constantly updated. Finally, the NWM is beneficial in that its use is free for communities and can fill in some data needs where currently none exist; interviewees noted that many local models are expensive and are therefore inaccessible to many communities who have limited resources.
3.6 Community and NOAA/NWC recommendations
The community resilience stakeholders and NOAA/NWC staff generated recommendations for resilience planning applications for the NWM as well as opportunities for the NWC to support its utilization by communities. These recommendations were coded using the recommendation codebook in Appendix B and are described in greater detail in the following subsections.
The following sections outline two sets of recommendations. First, there are recommendations directed toward the community stakeholders that detail hypothetical use cases for leveraging the NWM in their resilience-related decision making. Second, there are recommendations directed toward NOAA/NWC staff that detail ways in which they could increase awareness of the NWM, ways to increase the accessibility of the NWM, and incorporate requested capabilities in future iterations of the NWM.
3.6.1 Recommendations for communities
The recommendations for how the communities can integrate the NWM into their resilience-related planning efforts were primarily in the category of hypothetical use cases. Hypothetical use cases refer to ideas for how the NWM could be used in the context of resilience-related planning, which included applications to emergency management, large basin/regional planning, scenario planning, as a first pass to determine areas for future analysis, providing information where none would otherwise exist, looking at historical data to inform the future, as another data point, and as a convening tool. Three additional categories included ideas for how data could be shared between the NWM and communities (2/7 communities and NOAA/NWC identified this category); there were three examples of existing use cases of the NWM (two by communities, one by NOAA/NWC), and the NOAA/NWM stakeholders had a recommendation for how communities should connect with the NWC (via regional offices, such as Weather Forecast Offices). Descriptions of the potential use cases and examples of community applications are detailed in Table 4.
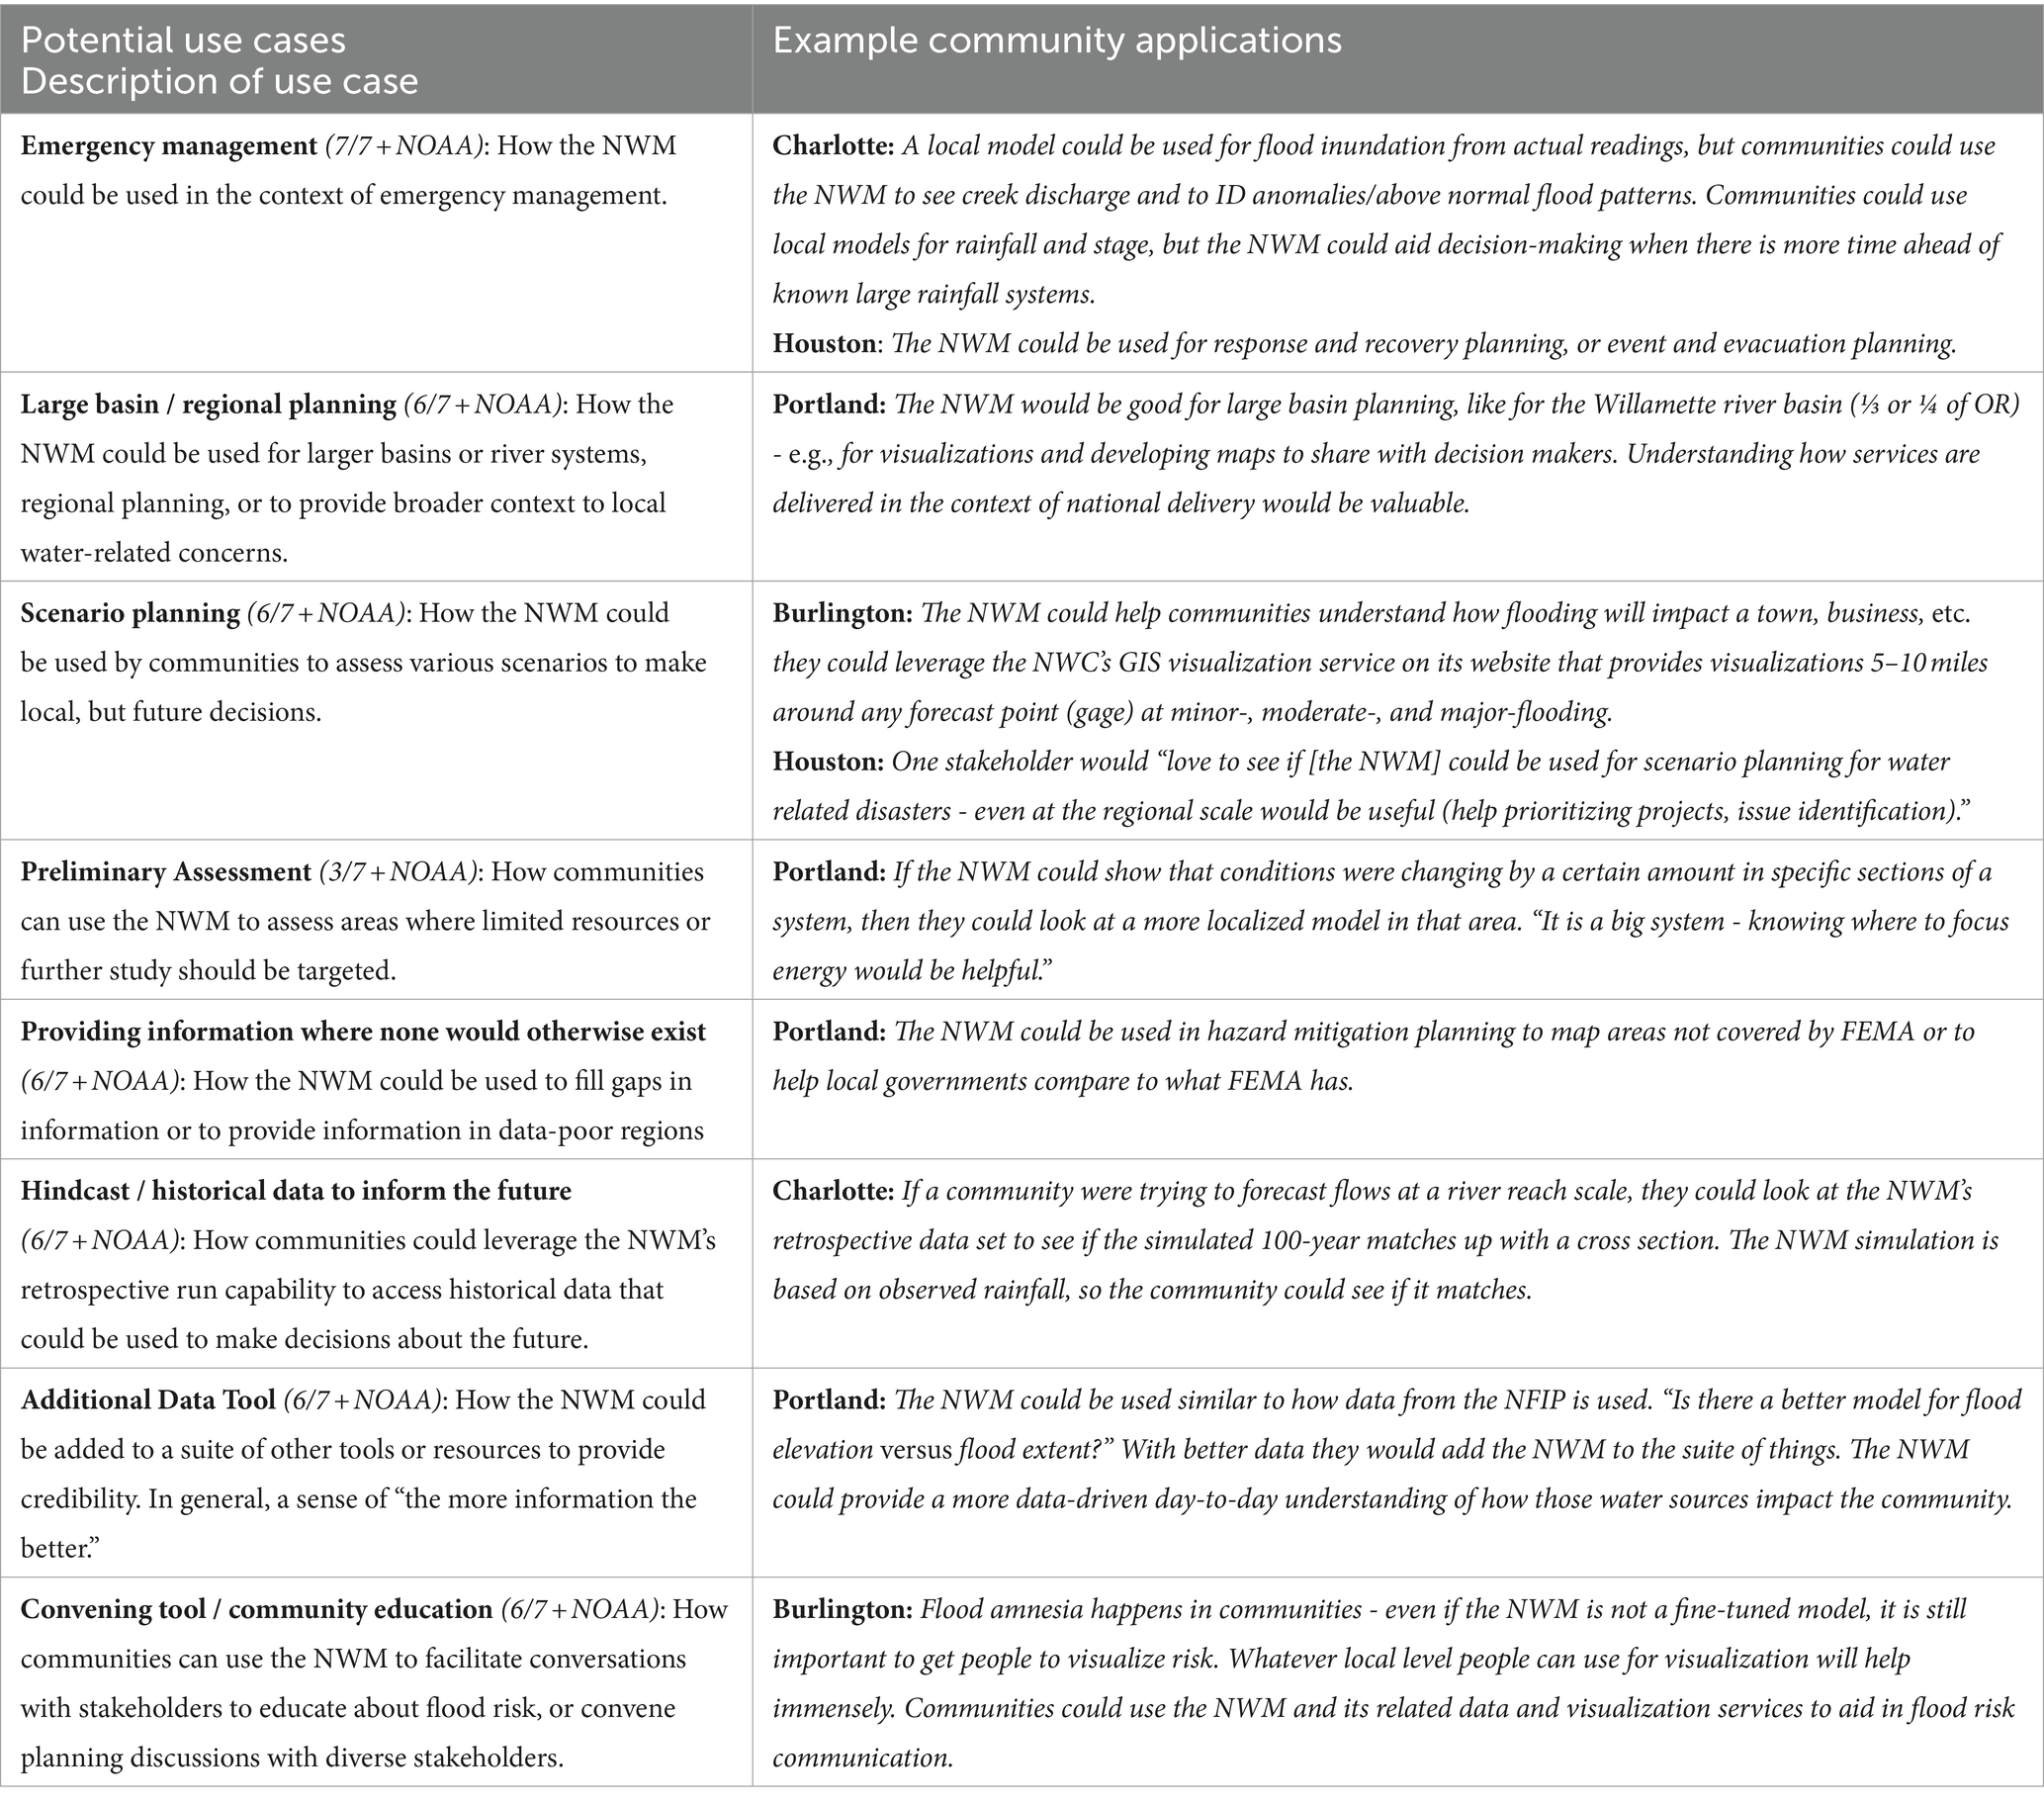
Table 4. Key potential use cases, integrating NWM into resilience planning and supporting quotations for the recommendations for how the communities can integrate the NWM into their resilience-related planning efforts.
There was consistency between the recommendations that the communities had for how they could use the NWM in their resilience-related planning efforts, and the ideas generated by NOAA/NWC staff; i.e., every hypothetical use case category identified by the communities was also identified by NOAA/NWC staff. Commonalities across recommendations include using the NWM for larger regional and interjurisdictional analyses, as well as supplementing local data sources or providing data for planning when local options did not exist.
3.6.2 Recommendations for NWC support
The recommendations for how the NWC could better facilitate the use of the NWM in community resilience-related planning fell into three broad areas: awareness, accessibility, and requested capabilities. Since over 60% of the community stakeholders had never heard of the NWM, they had many suggestions for how they would like to learn more about the NWM. The accessibility area of support includes recommendations for how the NWC can facilitate use of the NWM by resilience-related stakeholders who have a diversity of areas of expertise. The requested capability area of support includes recommendations for additional features that the interviewees would like the NWM to have. Descriptions of the areas for NWC support, recommended actions, and example community applications are detailed below in Tables 5.1–5.3.
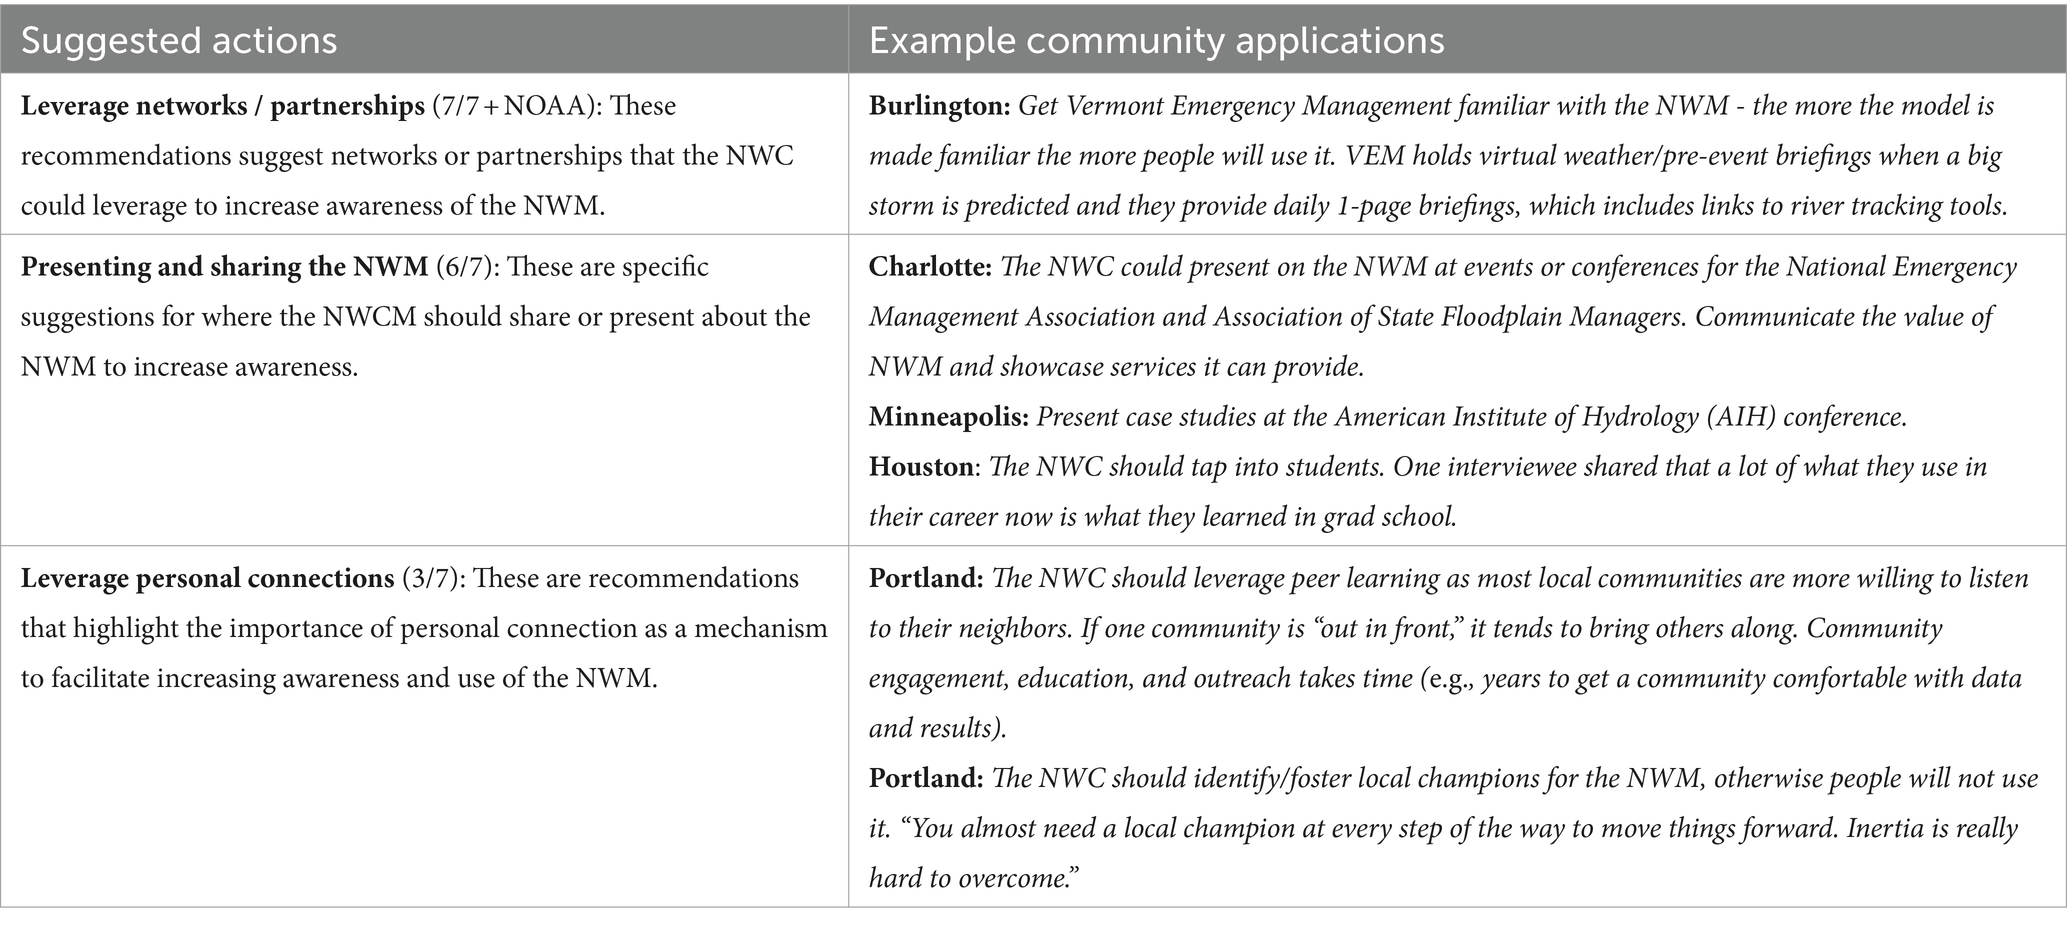
Table 5.1. Building awareness: recommendations related to the lack of awareness of the NWM and suggestions for how best to increase awareness of the NWM.
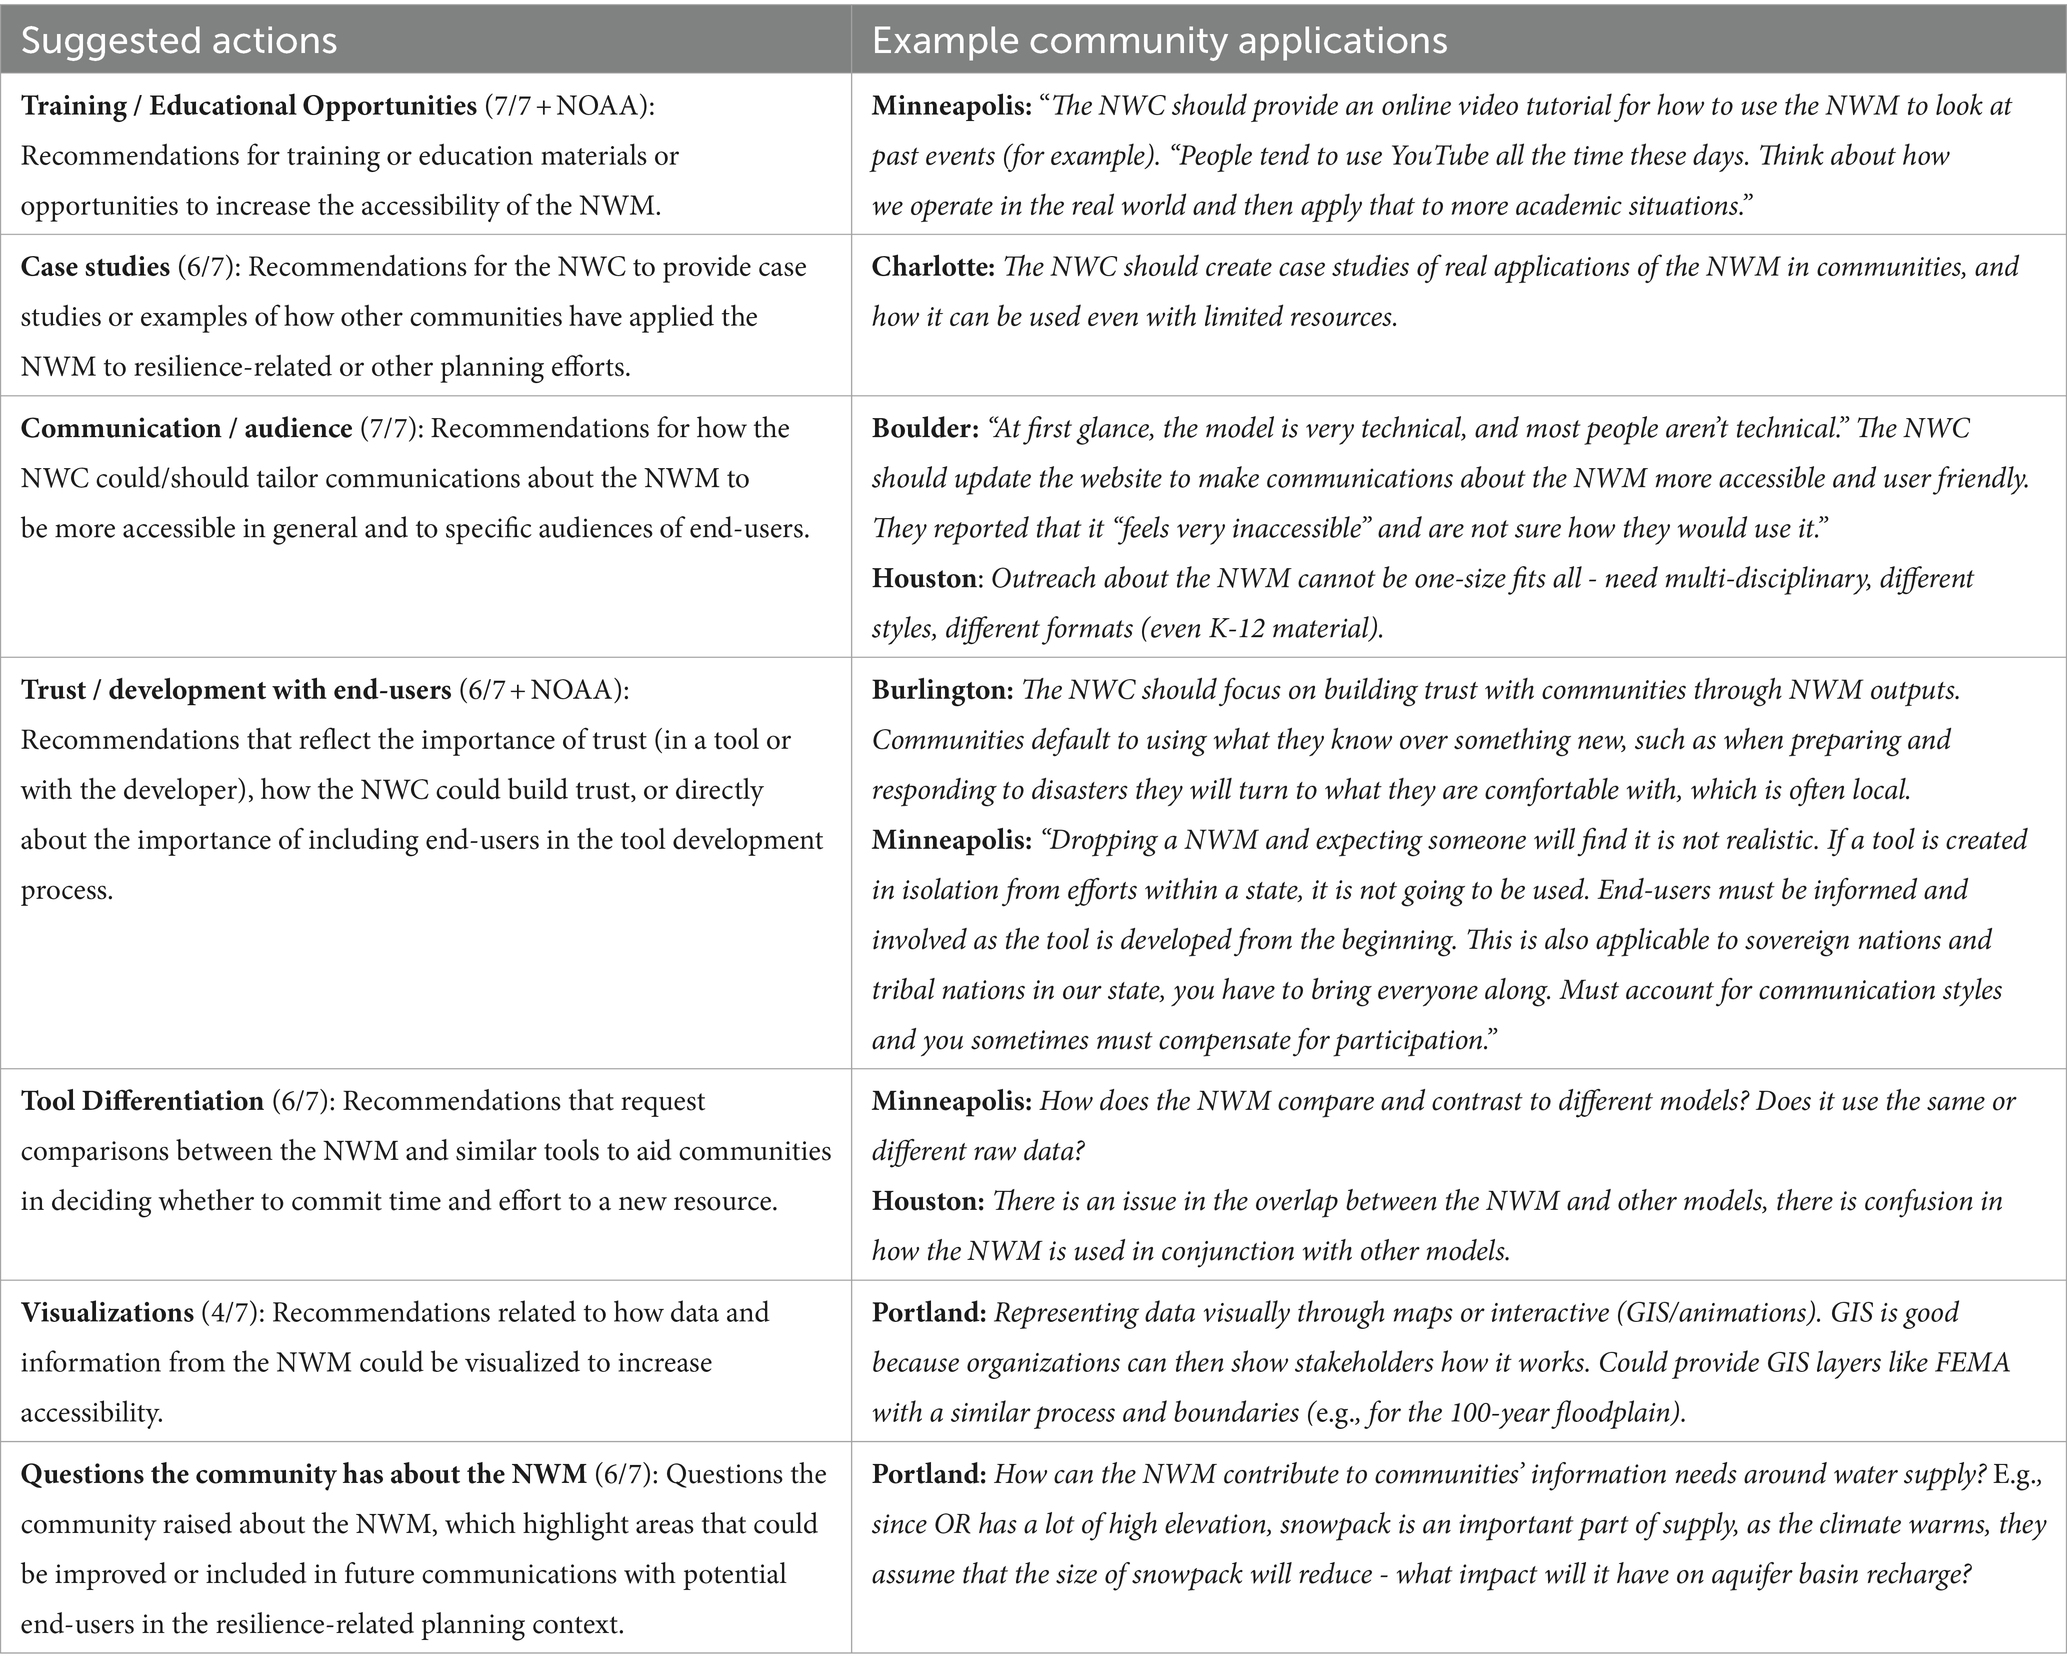
Table 5.2. Enhancing accessibility: recommendations related to the ability of communities to access and interpret the NWM and its related data and information products and services including suggestions for how to improve access to diverse stakeholders.

Table 5.3. Requested capabilities: these are recommendations about features or capabilities that the interviewees would like to see but that currently are not part of the NWM.
As detailed in Table 5.1, building awareness came down to communication strategies for the NWM that integrated directly within existing networks, identifying trusted connections or local champions, and taking advantage of conferences or venues for advertising the models’ capabilities that community stakeholders frequent.
Recommendations for the NWC to enhance the NWM’s accessibility largely centered around opportunities to educate and develop a rapport with end-users of the model, including the development of case studies, tailoring communications to specific audiences, and visualization of services to ease use among other actions. See Table 5.2 for additional detail.
Communities often requested the addition of novel features to the NWM. Examples of these included forecasting and modeling past 30 days, creating archives of data and model run results, as well as addressing water quality and water supply modeling needs. Recommendations common to two or more communities are further delineated in Table 5.3.
While quite a few recommendations to the NWC came from multiple communities, some interviewees from Burlington, Cincinnati, and Charlotte requested new capabilities that were unique to their respective cases.
3.7 Burlington
a. Municipality-specific page and alerts: In collaboration with local universities with GIS capability, the NWC or NWS could develop municipality-specific live pages that summarize forecast conditions across that municipality. In partnership with the private sector, the NWC could provide the ability for communities to sign up for alerts for specific areas on a map (alerts for high flow exceedance, etc.). This could be embedded on the local government websites so community members could see what is going on with Burlington rivers today. This could help with education and outreach.
b. Holistic elements on watersheds: The NWM should account for holistic elements in watersheds that support resilience: For example, the NWM should include gaming-discharges and effects, if it does not account for pluvial flooding, then it would not represent a major innovation over FEMA tools. The NWM and its outputs should be useful in the context of understanding challenges. For example, the NWM should account for impervious surfaces, mitigating loss of pervious surfaces, manage channels to account for their sinuosity and sediment transport such that the channel does not straight-line the water downhill.
c. Watershed scale: The NWC should provide information on river systems on the watershed scale - the more information that could be portrayed on the watershed scale would be critical. Helpful in educating emergency managers and responders.
d. Fluvial erosion: The NWM should incorporate fluvial erosion.
3.8 Charlotte
a. Communication: Science communication was a challenge. They need an understanding of models and results that can reflect the accuracy of models to decision makers. How do they communicate it?
3.9 Cincinnati
a. Landslides: The NWC could provide guidance on how the model could help anticipate where landslides might occur in topography. E.g., through proxy data (soil moisture, etc.), such as from the NWM retrospective run data.
b. Dams/Levees: Communities would like more information on the interaction between groundwater and surface water at levees and dams. They could also use more 3D groundwater flow modeling and groundwater flow velocity at levees and dams.
The seven communities and NOAA/NWC had distinct recommendations for how the NWM can be used for community resilience planning. While every hypothetical use case category was identified by both the communities and NOAA/NWC staff, only 7 of the 30 suggested actions in the recommendations directed toward the NWC were identified by both the communities and NOAA/NWC staff. Most of the discrepancy was centered around the “requested capabilities” theme, which explored a series of ideas that the community had for additional features that they would like to see the NWM have. In this category, only four of the 20 suggested actions were identified by both the communities and NOAA/NWC staff (technical changes to the NWM, incorporating climate/future change, providing planning guidance and support, and creating an archive of results/data). Additionally, there was a greater number of suggested actions (all isolated within the requested capabilities category) that were only identified by single communities.
4 Discussion
While the results presented above have been specific to investigating the application of the National Water Model to resilience-related planning, the findings hold key lessons that can aid other climate service developers in their effort to provide actionable science for real world applications. These key lessons are: (1) It is important to engage target end-users in the development of climate services to increase awareness and adoption of the tool or service and its efficacy, (2) The accessibility of climate resources can be improved by considering the diverse perspectives of end-users as a part of the tool development process, and (3) Climate services should be developed to support planning for many timescales to include future conditions.
4.1 Importance of community engagement in climate service development
Results from this study highlighted the importance of community engagement in the climate service space in three ways: (1) It can help to increase the awareness of the tool or service, (2) It can help increase the adoption of the tool or service, and (3) It can help improve the tool or service. First, as highlighted by the fact that 60% of stakeholders engaged in this study had never heard of the National Water Model, a focus on awareness is the indispensable first step in tool adoption by end-users. In the case of the NWM, as soon as the stakeholders became aware of its features and capabilities, they were able to provide many ideas for its use and became enthusiastic about its potential application to their work. Second, community engagement aided in tool adoption by developing trust in the resource among community stakeholders. Several of the communities (3 of 7) highlighted the value of personal connection in building trust to facilitate the adoption of a tool by communities, echoing the work of Allen and Mohatt (2014) and Raub and Cotti-Rausch (2019), who also showed the importance of developing trust in a tool or resource as a means to facilitating its adoption by end-users. Building trust is key when there is a heterogeneity among end-users. A tools application also needs to be tailored locally for it to be supportive of employing resilience and mitigation measures:
“Although Mitigation is the responsibility of the whole community, a great deal of mitigation activity occurs at the local level. The assessment of risk and resilience must therefore begin at the community level and serve to inform our state, regional, and national planning,” (Homeland Security, 2011).
If given a choice, the study’s interviews showed that many stakeholders indicated a preference for a locally specific water model as opposed to a National Water Model. This is because they perceived that the NWM would not be able to provide a fine enough resolution or be specific enough to their local needs. However, communities also showed a recognition that they faced similar challenges to other communities. These included concern with flooding, capacity challenges in the planning and resilience space, and the presence of gaps in information about water-related vulnerabilities. Done properly, the community engagement process can help communities understand how a tool developed to address a shared challenge can meet their local needs and help to build trust in a particular resource.
This study showed how community engagement can play an invaluable role in improving a climate service. The communities and NOAA/NWC interviewees all came up with hypothetical use cases within the same categories, showing consistency in their vision for how the NWM could currently be used in community resilience-related planning. The communities helpfully recommended new capabilities for the NWM that the NOAA/NWC stakeholders had not considered.
The importance of community engagement in the development of climate services is not a novel result, rather it is a well supporting finding (Pahl-Wostl et al., 2007; Meadow et al., 2015; Jacobs and Street, 2020; Findlater et al., 2021). As stated by McNie (2012, p. 24), “while basic research will always have a large and important role to play in climate research, science-policy decision makers need to give serious consideration to expanding support for problem-driven research design, implementation, and integration into existing knowledge and policy systems, particularly if the objective is to produce useful climate science for place-based decision support.” It should be noted that there is both an art and science when it comes to undertaking successful community engagement. Specifically, the methodological choices when designing an engagement approach must be tailored to each individual context. However, there are multiple approaches to collaboration and community engagement that have been proven effective, such as: action research, transdisciplinary, rapid process assessment, participatory integrated assessment, and boundary organizations (Meadow et al., 2015).
4.2 Enhancing tool accessibility to increase end-user diversity
The results of this study revealed that there is a wider audience of potential end-users in the resilience planning space than is often understood by the developers of climate tools and models. The broader implication of this revelation is that developers of discipline-specific climate services, such as the NWM, need to invest in getting to know just who is doing climate resilience-related planning in communities. An important way to accomplish this is to employ the snowball recruitment technique that this study used to solicit interviewees. While the study began with the expectation of engaging floodplain managers, emergency managers, or hazard mitigation planners, it ultimately ended up interviewing stakeholders involved in water quality, conservation, and dam operation. While some stakeholders were experienced with hydrology, others were not, yet all worked with water-related hazards or were users of water-related data and information.
If climate service developers want to increase the accessibility of their resources they need to involve more diverse end-users in the development process. Often tool developers design tools for specialists, when, in reality, many potential end-users are anything but (Hewitt et al., 2020). For example, several of the interviewees from this study commented on how “user-unfriendly” they found the material describing the NWM: according to one Portland stakeholder, the “big problem is that it [the NWM and its communications] looks like it was designed for water resources engineers, but the people who would use it are planners, city staff, etc. who use different terms.” Additionally, all seven communities had recommendations for how the NWC could increase the accessibility of the NWM through improvements in communications that account for, or are tailored to, additional audiences. The potential benefits for accounting for the broad areas of expertise of resilience stakeholders are two-fold: (1) an increase in use of the tool as intended, and (2) the tool ends up reaching an even broader group of potential users. Community engagement can facilitate both benefits by exploring potential users and uses of a resource. By designing tools with a comprehensive view of community end-users in mind, the likelihood of fragmentary and contradictory climate service implementation may be reduced, allowing for the resources to be used more efficiently and effectively (Hewitt et al., 2020). Climate tools themselves also gain legitimacy with increased accessibility for user audiences when they are designed in co-production with end-users (Vincent et al., 2018).
4.3 Developing climate service to support multiple timescales and planning for future conditions
A key result from this study was that planning that only takes into account past and current conditions is inadequate for advancing community resilience. Planning should involve adapting to expected future risks. Interviewees expressed a need to anticipate likely future conditions and requested that the National Water Model be enhanced to assist them with this need. The community-based interviewees recognized that planning must be done with longer term horizons that take into account more frequent and intense disruptions along the way (Hewitt et al., 2020). Accordingly, those developing climate services or other tools should be looking to design tools that can provide data on potential future conditions and incorporate visualization services for different time horizons and event probabilities.
One example of a successful approach was the Water Utility Climate Alliance’s (WUCA) effort to aid water utilities in their response to climate change, including how to incorporate a source of information with inherent uncertainty into their operations and decision making (Barsugli et al., 2012). A “chain-of-models” exercise was employed by WUCA to make projected climate changes understandable and usable in decision making by water utilities (Vogel et al., 2016). Using a bottom-up approach, WUCA was able to design the chain-of-models exercise to translate climate projections to water utility operation models, which was a usable scale for this stakeholder groups decision making.
Climate services should also be capable of supporting the multiple timescales associated with resilience planning. While the NWM has only a 30-day forecasting ability, interviewees identified that it can still support future-oriented resilience planning. This is because resilience planning often involves securing funding to implement projects identified within a plan or implementing portions of a plan prior to, during, or following a hazard or other disruptive event. As a result, resilience-related planning ends up encompassing many different timescales, many of which the NWM can currently support. For instance, interviewees suggested that the NWM could be used to assess large river systems to provide information about water-related vulnerabilities in areas where no other information would otherwise exist. This in turn could guide project prioritization for funding applications, or general planning efforts.
In general, the concept of resilience encompassing multiple time scales is supported through academic concepts such as the application of panarchy theory to resilience thinking (Berkes and Ross, 2016). Panarchy theory encompasses the concept of complex adaptive cycles (Gunderson and Holling, 2002), which can help transition resilience as a theory to communities in practice by including the relationship between multiple scales (Berkes and Ross, 2016). Multiple timescales and scales in general are inherent to resilience thinking. This study found that the NWM can be applied at several of the shorter timescales of resilience-related planning and highlighted the need for an array of climate services tools that are able to incorporate longer-range timescales and the interactions between those multiple scales in planning. Tool developers can potentially increase the efficacy of climate services by responding to this need to support all the temporal dimensions of resilience planning. One such method of investigating and incorporating the multiple timescales in resilience-related decision-making is through the use of a decision calendar, which “allows identification of critical time periods (so called “entry points”) and formats to provide climate forecasts and information, as well as to infer climate information that is potentially useful, but not currently used” (Ray and Webb, 2016, p. 29).
5 Areas for further research
The communities engaged in this study were intentionally selected for their capacity to engage in planning. However, many smaller or more rural communities struggle to engage in resilience planning efforts. Accordingly, it is important to investigate the resilience planning landscape of communities that have much more limited planning capacities and how they could interact with climate services such as the NWM. This study focused specifically on the NWM’s application to resilience planning. Future studies could explore how the NWM and other climate services could address the need for communities to understand and adapt to climate change. Given the timing of the study relative to the rollout of the NWM’s Next Generation (NextGen) Framework, new research could also examine applications to directly integrate local data into the NWM thereby providing added flexibility of the NextGen Framework.
A critical avenue for future research is to examine the role of seasonality, uncertainty, and timing of resilience decision making. While this study emphasizes the significance of the NWM in community resilience planning, it does not explicitly address the temporal and seasonal dimensions of resilience decisions or the uncertainties present in the models forecasts. It is well known that all forecasts involve uncertainty and seasonality, which undoubtedly impacts the use of forecasted information in decision making (Hartmann et al., 2002; Dilling and Lemos, 2011). For example, the present version of the NWM, especially before the roll out of the Next Generation Framework, is known to perform better in certain geographies than in others. Therefore, not only is there a temporal aspect to the uncertainty associated with the NWM, but there is also a spatial aspect to the uncertainty. It is crucial to “move past first-order questions regarding if and how stakeholders use climate information, to more sophisticated and contextual second-order questions to assess what is needed for the information to be useable” and this investigation provided the first order context from which the second order questions can now be investigated (Ray and Webb, 2016, p. 28). As this study revealed that the majority of the resilience-related stakeholders had never heard of the NWM prior to engaging in this study and very few of those who had heard of the NWM had any experience in using it, it was necessary to first investigate the broader landscape of this decision-making context.
Acknowledging and addressing these temporal considerations will not only align the model more closely with the needs of end-users but also mitigate the risk of unintended or incorrect applications. While the current study has provided valuable insights into community engagement, accessibility, and planning for multiple timescales, it is imperative to recognize the current limitations related to the NWM. Addressing these limitations in future research endeavors will contribute to a more comprehensive understanding of the model’s capabilities and guide enhancement that will make it more effective in supporting community resilience planning.
Climate services represent an opportunity for hydrology and natural sciences more broadly to inform community resilience and climate planning; collaboration between tool developers and frontline planners will be increasingly essential as environmental conditions, modeling technologies, and their scientific underpinnings rapidly change.
Data availability statement
The datasets presented in this article are not readily available because releasing bulk interview data would allow participants to be re-identified due to details about their professional roles. Requests to access partial datasets or other information from this study should be directed to KR at kraub@cuahsi.org or k.raub@northeastern.edu.
Ethics statement
Both of the studies that contributed to this manuscript involved human subjects and were approved by Northeastern University’s Institutional Review Board (IRB#: 22-09-22 and 21-11-11). The studies were conducted in accordance with the local legislation and institutional requirements. Written informed consent for participation was not required from the participants or the participants’ legal guardians/next of kin because IRB issued “exempt” status to the study protocol.
Author contributions
KR: Writing – review & editing, Writing – original draft, Supervision, Project administration, Methodology, Investigation, Funding acquisition, Formal analysis, Data curation, Conceptualization. JL: Writing – review & editing, Writing – original draft, Methodology, Investigation, Funding acquisition, Formal analysis, Data curation, Conceptualization. SF: Writing – review & editing, Supervision. SD: Writing – review & editing, Writing – original draft, Formal analysis, Data curation. TS: Writing – review & editing, Writing – original draft, Formal analysis, Data curation.
Funding
The author(s) declare that financial support was received for the research, authorship, and/or publication of this article. The authors acknowledge support from NOAA’s Cooperative Institute for Research to Operations in Hydrology (CIROH), grant number NA22NWS4320003, and University Corporation for Atmospheric Research (UCAR) via a COMET University Partner/Outreach Program Partner Project, grant subaward number SUBAWD002966.
Acknowledgments
The authors would like to thank our NOAA/NWC collaborators for their guidance and enthusiasm throughout this project; Jocelyn Burston, David Vallee, Brian Cosgrove, Brenna Sweetman, Cecelia Batterbee, Emily Crisci, Blake Goodwin, and Chris Ellis. The authors would also like to thank the reviewers for their thoughtful critique. In addition, the authors would like to thank Robin White and Ciaran Hedderman for their review and support in the editing of this manuscript, Samiksha Bhatnagar and Latifa Al Khalifa for assistance in data analysis, and Maria Mendez for assistance with the revisions of the manuscript.
Conflict of interest
The authors declare that the research was conducted in the absence of any commercial or financial relationships that could be construed as a potential conflict of interest.
Publisher’s note
All claims expressed in this article are solely those of the authors and do not necessarily represent those of their affiliated organizations, or those of the publisher, the editors and the reviewers. Any product that may be evaluated in this article, or claim that may be made by its manufacturer, is not guaranteed or endorsed by the publisher.
Supplementary material
The Supplementary material for this article can be found online at: https://www.frontiersin.org/articles/10.3389/fclim.2024.1291165/full#supplementary-material
References
Alibašić, H. (2022). Strategic resilience and sustainability planning: Management strategies for sustainable and climate-resilient communities and organizations Second Edition Springer Nature, US.
Allen, J., and Mohatt, G. V. (2014). Introduction to ecological description of a community intervention: building prevention through collaborative field based research. Am. J. Community Psychol. 54, 83–90. doi: 10.1007/s10464-014-9644-4
Barsugli, J. J., Vogel, J. M., Kaatz, L., Smith, J. B., Waage, M., and Anderson, C. J. (2012). Two faces of uncertainty: climate science and water utility planning methods. J. Water Resour. Plan. Manag. 138, 389–395. doi: 10.1061/(ASCE)WR.1943-5452.0000188
Berkes, F., and Ross, H. (2016). Panarchy and community resilience: sustainability science and policy implications. Environ. Sci. Pol. 61, 185–193. doi: 10.1016/j.envsci.2016.04.004
Cigler, B. A. (2017). U.S. floods: the necessity of mitigation. State and Local Government Rev. 49, 127–139. doi: 10.1177/0160323X17731890
Cosgrove, B., Gochis, D., Flowers, T., Dugger, A., Ogden, F., Graziano, T., et al. (2024). NOAA’s National Water Model: advancing operational hydrology through continental-scale modeling. JAWRA J. American Water Resources Association 1752-1688:13184. doi: 10.1111/1752-1688.13184
Daniels, E., Bharwani, S., Gerger Swartling, Å., Vulturius, G., and Brandon, K. (2020). Refocusing the climate services lens: introducing a framework for co-designing “transdisciplinary knowledge integration processes” to build climate resilience. Climate Services 19, 100181–100115. doi: 10.1016/j.cliser.2020.100181
Dilling, L., and Lemos, M. C. (2011). Creating usable science: opportunities and constraints for climate knowledge use and their implications for science policy. Glob. Environ. Chang. 21, 680–689. doi: 10.1016/j.gloenvcha.2010.11.006
Environmental Finance Center at Sacramento State. (2020). Resilience planning: Tools and resources for communities. Available at: https://www.efc.csus.edu/reports/resilience-planning-tools-and-resources-for-communities.pdf
Findlater, K., Webber, S., Kandlikar, M., and Donner, S. (2021). Climate services promise better decisions but mainly focus on better data. Nat. Clim. Chang. 11, 731–737. doi: 10.1038/s41558-021-01125-3
Gunderson, L. H., and Holling, C. S. (2002). Panarchy: understanding transformations in human and natural systems. Island Press. Available at: https://books.google.com/books?hl=en&lr=&id=mBW8BwAAQBAJ&oi=fnd&pg=PR2&dq=gunderson+and+holling+2002&ots=9MtVEqdsSq&sig=Xnu1bX28yGRTOYaIDxJnsqoHjS4#v=onepage&q=gunderson%20and%20holling%202002&f=false
Hartmann, H. C., Pagano, T. C., Sorooshian, S., and Bales, R. (2002). Confidence builders: evaluating seasonal climate forecasts from user perspectives. Bull. Am. Meteorol. Soc. 83, 683–698. doi: 10.1175/1520-0477(2002)083<0683:CBESCF>2.3.CO;2
Hemmati, M., Ellingwood, B. R., and Mahmoud, H. N. (2020). The role of urban growth in resilience of communities under flood risk. Earth’s Future 8:e2019EF001382. doi: 10.1029/2019EF001382
Hewitt, C. D., Allis, E., Mason, S. J., Muth, M., Pulwarty, R., Shumake-Guillemot, J., et al. (2020). Making society climate resilient: international Progress under the global framework for climate services. Bull. Am. Meteorol. Soc. 101, E237–E252. doi: 10.1175/BAMS-D-18-0211.1
Homeland Security. (2011). National Preparedness Goal. Available at: https://www.fema.gov/sites/default/files/2020-06/national_preparedness_goal_2nd_edition.pdf (Accessed March 18, 2024).
Jacobs, K. L., and Street, R. B. (2020). The next generation of climate services. Climate Services 20, 100199–100197. doi: 10.1016/j.cliser.2020.100199
Lioubimtseva, E., and da Cunha, C. (2023). The role of non-climate data in equitable climate adaptation planning: lessons from small French and American cities. Sustain. For. 15:1556. doi: 10.3390/su15021556
Mayer, B. (2019). A review of the literature on community resilience and disaster recovery. Current Environ. Heal. Reports 6, 167–173. doi: 10.1007/s40572-019-00239-3
McNie, E. C. (2012). Delivering climate services: organizational strategies and approaches for producing useful climate-science information. Weather, Climate, and Society 5, 14–26. doi: 10.1175/WCAS-D-11-00034.1
Meadow, A. M., Ferguson, D. B., Guido, Z., Horangic, A., Owen, G., and Wall, T. (2015). Moving toward the deliberate coproduction of climate science knowledge. Weather, Climate, and Society 7, 179–191. doi: 10.1175/WCAS-D-14-00050.1
National Weather Service, NOAA. (2016). National Water Model: Improving NOAA’s water prediction services. Available at: https://water.noaa.gov/documents/wrn-national-water-model.pdf
Office of Water Prediction. (n.d.). The National Water Model. Retrieved April 26, 2023, from https://water.noaa.gov/about/nwm
Onwuemele. (2014). Access and utilization of climate services among vulnerable communities in Nigeria: A case study of Isoko communities in Delta state. Available at: http://icidr.org/jeiadc-vol6no2n3-dec2014/Access%20and%20Utilization%20of%20Climate%20Services%20among%20Vulnerable%20Communities%20in%20Nigeria-A%20Case%20Study%20of%20Isoko%20Communities%20in%20Delta%20State%20.pdf
Pahl-Wostl, C., Sendzimir, J., Jeffrey, P., Aerts, J., Berkamp, G., and Cross, K. (2007). Managing change toward adaptive water management through social learning. Ecol. Soc. 12:art30. doi: 10.5751/ES-02147-120230
Raub, K. B., and Cotti-Rausch, B. E. (2019). Helping communities adapt and plan for coastal hazards: coastal zone management program recommendations for National Tool Developers. Coast. Manag. 47, 253–268. doi: 10.1080/08920753.2019.1596674
Ray, A., and Webb, R. (2016). “Understanding the user context: Decision calendars as frameworks for linking climate to policy, planning and decision-making,” in Climate in context: Science and society partnering for adaptation. Eds. A. Parris, G. M. Garfin, K. Dow, R. Meyer, and S. L. Close. Wiley & Sons. pp. 27–50.
Regier, E., Naughton, J., and McDonald, W. (2022). Transposing flood risk from extreme rainfall events: a case study of hurricane Harvey. J. Flood Risk Manag. 15, 1–14. doi: 10.1111/jfr3.12778
Saikia, P., Beane, G., Garriga, R. G., Avello, P., Ellis, L., Fisher, S., et al. (2022). City water resilience framework: a governance based planning tool to enhance urban water resilience. Sustain. Cities Soc. 77:103497. doi: 10.1016/j.scs.2021.103497
Tate, E., Rahman, M. A., Emrich, C. T., and Sampson, C. C. (2021). Flood exposure and social vulnerability in the United States. Nat. Hazards 106, 435–457. doi: 10.1007/s11069-020-04470-2
US Department of Commerce, N. (n.d.). Hurricane Harvey 2017. NOAA’s National Weather Service. Retrieved September 5, 2023, from https://www.weather.gov/lch/2017harvey-pshhgx
Vaughan, C., Buja, L., Kruczkiewicz, A., and Goddard, L. (2016). Identifying research priorities to advance climate services. Climate Services 4, 65–74. doi: 10.1016/j.cliser.2016.11.004
Vincent, K., Daly, M., Scannell, C., and Leathes, B. (2018). What can climate services learn from theory and practice of co-production? Climate Services 12, 48–58. doi: 10.1016/j.cliser.2018.11.001
Vogel, J., McNie, E., and Behar, D. (2016). Co-producing actionable science for water utilities. Climate Services 2-3, 30–40. doi: 10.1016/j.cliser.2016.06.003
Keywords: National Water Model, resilience planning, climate services, community engagement, water-related hazards
Citation: Raub KB, Laufer J, Flynn SE, Daniels S and Sivalingam T (2024) Harnessing climate services to support community resilience planning: lessons learned from a community-engaged approach to assessing NOAA’s National Water Model. Front. Clim. 6:1291165. doi: 10.3389/fclim.2024.1291165
Edited by:
Solomon H. Gebrechorkos, University of Oxford, United KingdomReviewed by:
Gregg Garfin, University of Arizona, United StatesKuk-Hyun Ahn, Kongju National University, Republic of Korea
Copyright © 2024 Raub, Laufer, Flynn, Daniels and Sivalingam. This is an open-access article distributed under the terms of the Creative Commons Attribution License (CC BY). The use, distribution or reproduction in other forums is permitted, provided the original author(s) and the copyright owner(s) are credited and that the original publication in this journal is cited, in accordance with accepted academic practice. No use, distribution or reproduction is permitted which does not comply with these terms.
*Correspondence: Kristin B. Raub, kraub@cuahsi.org; k.raub@northeastern.edu