Implications of WRF model resolutions on resolving rainfall variability with topography over East Africa
 Anthony M. Mwanthi1,2*
  Joseph N. Mutemi1
  Franklin J. Opijah1
  Francis M. Mutua1 Zachary Atheru2 Guleid Artan2
- 1Department of Earth and Climate Sciences, University of Nairobi, Nairobi, Kenya
- 2IGAD Climate Prediction and Applications Centre, Nairobi, Kenya
There is an increasing need to improve the accuracy of extreme weather forecasts for life-saving applications and in support of various socioeconomic sectors in East Africa, a region with remarkable mesoscale systems due to its complex topography defined by sharp gradients in elevation, inland water bodies, and landuse conversions. This study sought to investigate the impacts of the Weather Research and Forecasting (WRF) model spatial resolution on resolving rainfall variability with topography utilizing nested domains at 12 and 2.4 km resolutions. The model was driven by the National Centers for Environmental Prediction (NCEP)-Global Data Assimilation System (GDAS) Global Forecast System (GFS) final (FNL) reanalysis to simulate the weather patterns over East Africa from 3rd April 2018 to 30th April 2018, which were evaluated against several freely available gridded weather datasets alongside rainfall data from the Kenya Meteorological Department (KMD) stations. The reference datasets and the model outputs revealed that the highlands had more rainfall events and higher maximum daily rainfall intensity compared to the surrounding lowlands, attributed to orographic lifting enhancing convection. Rainfall was inversely proportional to altitude from 500 m to 1,100 m above sea level (ASL) for both coarse and fine resolutions. The convection-permitting setup was superior in three aspects: resolving the inverse altitude-rainfall relationship for altitudes beyond 3000 m ASL, simulating heavy rainfall events over the lowlands, and resolution of the diurnal cycle of low-level wind. Although the coarse resolution setup reasonably simulated rainfall over large mountains, only the convection-permitting configuration could accurately resolve rainfall variability over contrasting topographical features. The study notes that high-resolution modeling systems and topography-sensitive bias correction techniques are critical for improving the quality of operational weather forecasts in East Africa.
1 Introduction
Even though the climate of tropical East Africa is quite diverse (Nicholson, 2017), the livelihoods and socioeconomic activities of most of the population are sustained by seasonal rainfall (Muita et al., 2021). Rainfall is largely bimodal, during March to May (MAM) and October to December (OND) with peaks in April and November, whereby the rainfall seasonality is controlled by the cross-equatorial movement of the Intertropical Convergence Zone (ITCZ) (Camberlin and Okoola, 2003). However, regions in northern and eastern Kenya have short-lived seasons between April to May and November to December (Owiti and Zhu, 2012), while the season between June and August is an active season over the regions in northwestern Uganda to western Kenya attributed to moisture influx from the Congo basin (Ongoma et al., 2018). The physical characteristics, especially topography, are key features that modulate the regional climate at different timescales (Nicholson, 2017). It is critical to ensure that these local processes are well represented in climate models. Over the years, there has been a remarkable improvement in modeling capabilities. For instance, the application of high-resolution climate models on regional and local scales offers the opportunity to resolve contrasting land features that are missed by coarse global climate models (GCMs) (Rummukainen, 2016; Stratton et al., 2018).
East Africa is prone to many disasters that are associated with climate variability in seasonal timescales such as droughts and extreme weather events in the sub-seasonal range (Wainwright et al., 2021). Elevation generally increases from east to west, with lowlands close to the coastal regions and highlands in the central regions of the study area (Figure 1). The spatial distribution of land cover/vegetation gives a hint to the climate, with savannas and grasslands in the eastern and northeastern regions, which are predominantly arid to semi-arid lands, while forests exist in the western regions, which generally experience more rainfall (Dinku et al., 2011). Figure 2 shows Weather Research and Forecasting (WRF) model (Skamarock et al., 2019) land-use based on the Moderate Resolution Imaging Spectroradiometer Land Cover Type-International Geosphere-Biosphere Programme (MODIS-IGBP) classification (Friedl et al., 2010), demonstrating that the dominant land cover is open shrublands at 22.6%, savannas at 20%, grasslands at 17%, and woody savannas forests at 13%, respectively. With increased resolution, some land use features such as urban and built-up areas were prominent at 0.17%, unlike in the coarse resolution. An overview of the description of the different categories in Figure 2 is presented in Table 1.
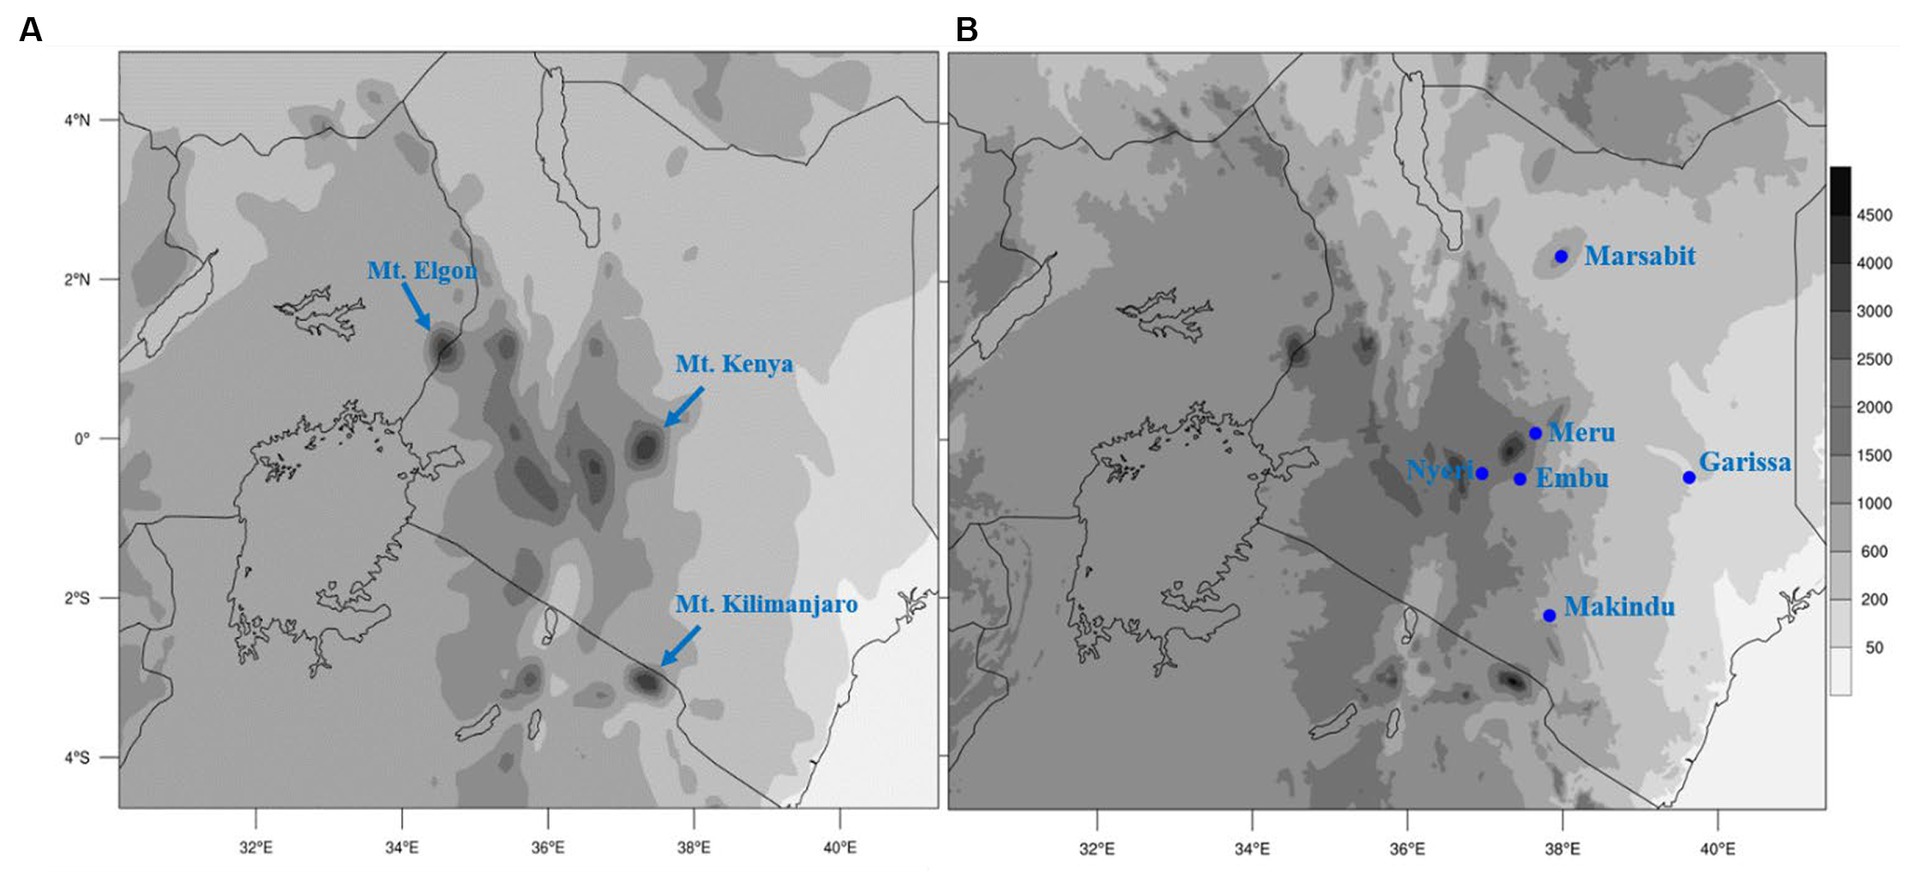
Figure 1. Topography in meters over the study area from the Global Multi-resolution Terrain Elevation Data (GMTED2010), Danielson and Gesch (2011) as represented in the current model domains, D01 (A) and D02 (B). The location of the rainfall stations used in the study is shown in (B), and major mountains are highlighted in (A).
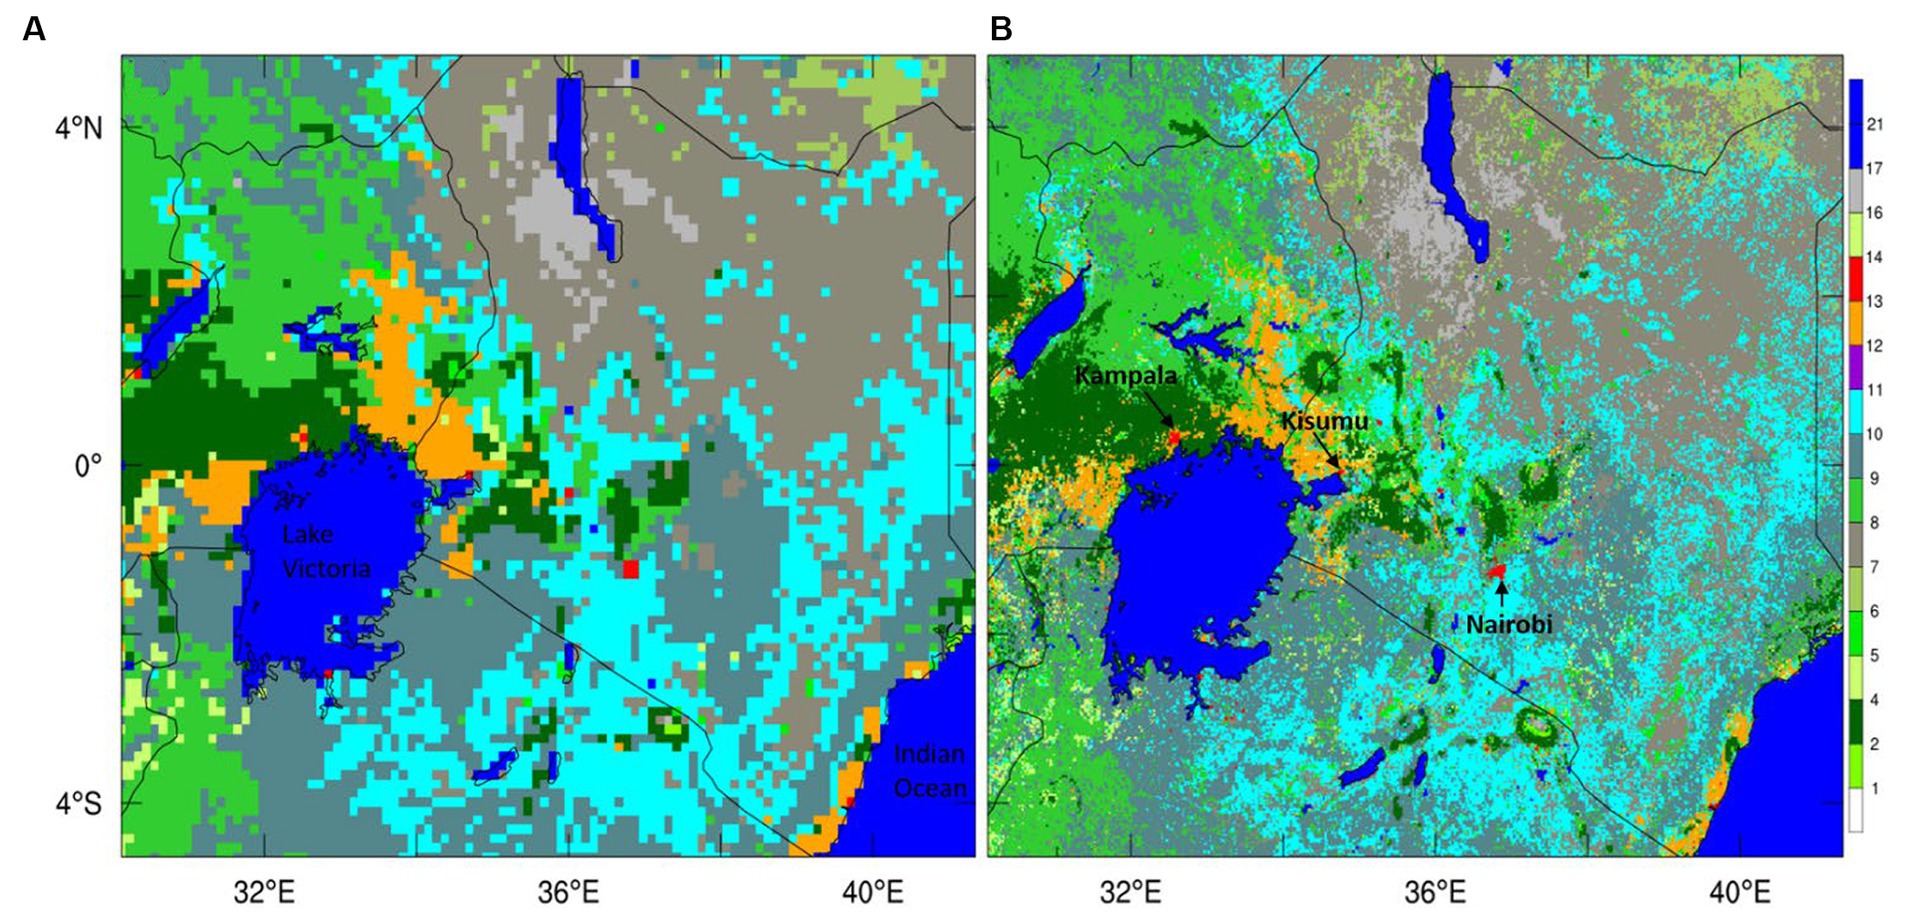
Figure 2. Spatial distribution of landuse from the Moderate Resolution Imaging Spectroradiometer (MODIS)-International Geosphere-Biosphere Programme (IGBP) product, Friedl et al. (2010) as represented in the current model setups for WD01 (A) and WD02 (B). The respective landuse classes are given in Table 1. Some major cities are labeled in (B).
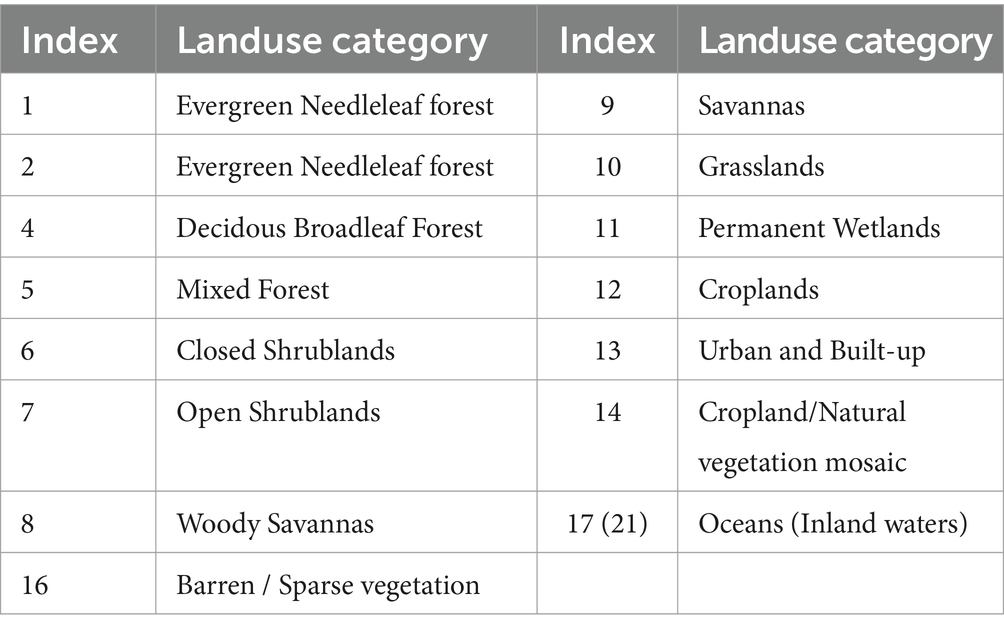
Table 1. MODIS-IGBP land use classification (Friedl et al., 2010) as implemented in the WRF.
Both GCMs and regional climate models (RCMs) suffer from systematic biases which could be attributed to complex topography, weaknesses in parameterization schemes, coarse spatial resolutions, and atmosphere–biosphere process transitions over large water bodies (Allen et al., 2002; Cardell et al., 2019; Ayugi et al., 2020; Choi et al., 2023). East Africa, a region marked with complex topography such as mountains, the Great Rift Valley (GRV), and major inland water bodies, is a case where systematic biases present a challenge in the generation of skilful climate services for operational applications. In this regard, the influence of topography on the local climate should be properly resolved in both regional and limited area models. In regions of complex topography, high-resolution model applications are critical in resolving mesoscale convective systems (MCS) (Li et al., 2016).
Over the mountainous areas, topography-based statistical rainfall predictors over equatorial East Africa underscored that exposure was a major forcing factor over the mean altitude, whereby orography-induced rainfall was dominant in east-facing slopes during April and the short rain seasons (Oettli and Camberlin, 2005). Furthermore, as identified by earlier researchers, mesoscale systems including local circulations in the Lake Victoria Basin (LVB) are responsible for orography-induced rainfall over western-oriented slopes over the highlands in western Kenya (Mukabana and Piekle, 1996). However, results over the highlands noted that elevation was the paramount predictor of rainfall (Basist et al., 1994). Although this initial research relied on statistical methods, dynamical downscaling offers the opportunity to further evaluate both the representation of the static features and simulate their effect on climate processes from local to synoptic scales. For instance, the Turkana Jet (TJ) is a topography-induced southeasterly divergent flow contributing to the exceptional dryness of northern Kenya as compared with other equatorial regions (Kinuthia and Asnani, 1982). Furthermore, the jet prominently contributes to approximately 63% of moisture outflow within Kenya during April (Munday et al., 2022) and has been demonstrated to influence the inter-annual variability of rainfall in East Africa, whereby the region tends to be dry when the jet is strong (King et al., 2021).
Dynamical simulations therefore offer the opportunity to understand the physical mechanisms connecting topography-induced circulations with rainfall. The results based on high-resolution WRF simulations indicate that mountains with steep slopes have much stronger updrafts but less convective activity compared with less steep slopes Göbel et al. (2023). The reduced convective rainfall over the steeper slopes is a result of stronger turbulence entrainment of environmental air, exceeding the advective convergence of moisture. Mountains also play an important role of providing heating sources, triggering gravity waves, sustaining diurnal mountain-valley circulations, and initiating convection through thermal forcing (Colle et al., 2013; Kirshbaum et al., 2018). These processes are key in controlling the local climate. Based on WRF simulations at 4 km spatial resolution over regions of heterogeneous topography in Rwanda, the elevation was demonstrated to influence the prevailing synoptic conditions (Ntwali et al., 2016).
Currently, the respective national institutions in Kenya, Rwanda, and Ethiopia produce dynamically downscaled forecasts at 4 km using the WRF model, with the IGAD Climate Prediction and Applications Centre (ICPAC) generating the regional products over the Greater Horn of Africa (GHA) at 10 km (Gudoshava et al., 2024). There is still a need to improve the current operational setups since they fall within the “gray-zone,” the scales with uncertainties in parameterizing convection (Skamarock et al., 2019). We aim to showcase the potential benefit of utilizing WRF at convection-permitting scales for operational forecasts, with an interest in resolving processes related to topography. Ultimately, the production and uptake of high-resolution, accurate, and regionally relevant weather and climate products over East Africa is critical. However, the availability of computing resources is a key limiting factor to the spatial scale of WRF outputs (Castorrini et al., 2021), and thus, operational centers usually adopt optimum resolutions guided by the computing power at their disposal.
2 Materials and methods
This study utilized various freely available gridded satellite-derived rainfall datasets (RFEs) adjusted with station records. This includes Climate Hazards Group InfraRed Precipitation with Station version 2.0 (CHIRPSv2) (Funk et al., 2015), whose algorithm relies on satellite rainfall estimates based on Cold Cloud Duration (CCD) and calibrated with in-situ records from the Global Telecommunication System (GTS), the African Rainfall Climatology version 2 (ARC2), which is based on Infra-Red CCDs from geostationary satellites and GTS daily in-situ records, (Novella and Thiaw, 2013), Precipitation Estimation from Remotely Sensed Information using Artificial Neural Networks – Climate Data Record (PERSIANN-CDR), (Hsu et al., 1997). and the Tropical Applications of Meteorology using SATelite data and ground-based observations, version 3.0 (TAMSATv3) (Maidment et al., 2017). These datasets are all based on infrared (IR) sensors and have been sufficiently validated (Dinku et al., 2007; Sun et al., 2018; Ageet et al., 2022). However, given the different resolutions, only general agreement among the datasets was considered. In situ rainfall records for three selected synoptic stations in the vicinity of Mt. Kenya (Embu, Meru, and Nyeru) and the other three over the Kenyan lowlands (Makindu, Garissa, and Marsabit) were obtained from the Kenya Meteorological Department (KMD). In addition, hourly wind was sourced from the 5th Generation of European Centre for Medium-Range Weather Forecasts (ECMWF) - Reanalysis (ERA5) (Hersbach et al., 2020).
All datasets were sourced for April from 3rd April 2018 to 30th April 2018. The selection of the case study was guided by a multi-dataset ranking of daily rainfall data for April over the last two decades (2000–2019) that traced the highest rainfall amount to either 13th April or 14th April 2018 (analysis not shown). The prevailing synoptic drivers during this case study, notably the strong Madden–Julian Oscillation (MJO) in phases 2 and 3, and the related predictability of extreme rainfall have been studied extensively (Kilavi et al., 2018; Finney et al., 2020; MacLeod et al., 2021; Wainwright et al., 2021; Kebacho, 2022).
Utilizing the National Centers for Environmental Prediction (NCEP)—Global Data Assimilation System (GDAS) Global Forecast System (GFS) final (FNL) 6 h reanalysis data at 0.25 degree to provide initial and boundary conditions, the WRF model version 4.4.1 (Skamarock et al., 2019), coupled with the Noah Land Surface Model (LSM), (Chen and Dudhia, 2001), was used to simulate the weather evolution from 1st to 30th April, with the first 2 days used for model spin-up (Hanley et al., 2021). The model setup followed a one-way nesting approach, where the parent and child domains were at 12 km and 2.4 km spatial resolutions, respectively, hereinafter referred to as WD01 and WD02. One-way nesting was the most resource-efficient setup since the number of grids in WD02 were much more than in WD01 (Gill et al., 2004; Skamarock et al., 2019). We utilized the New Tedtke Scheme cumulus parameterization scheme (Zhang and Wang, 2017) for WD01 only, with lake physics activated given the presence of multiple inland water bodies as shown in Figure 2, with the rest of the settings shown in Table 2. The choice of WD02 resolution was guided by earlier results indicated that WRF at a 3 km scale accurately simulates rainfall over regions of complex topography (Moya-Álvarez et al., 2019).
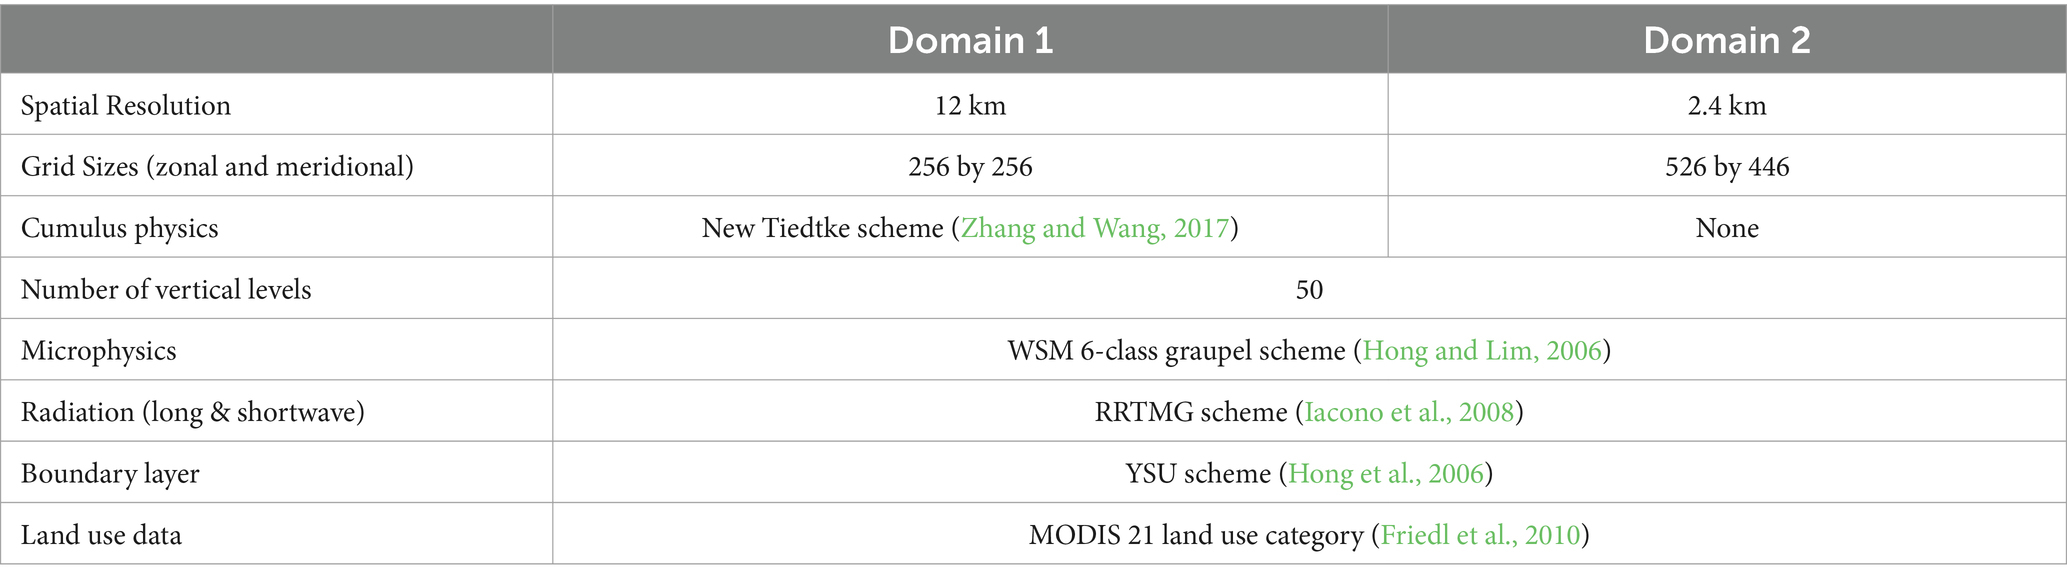
Table 2. Overview of the WRF model configuration applied in this case study.
We investigated both spatial and cross-sectional variability of rainfall with topography over East Africa, with an interest in comparing the performance of the coarse and high-resolution model outputs in simulating both the number and intensity of rainfall events. The KMD threshold for very heavy rainfall, 50 mm in 24 h, was adopted for this study. To depict the rainfall-topography relationship, we adopted the locally weighted scatterplot smoothing (LOESS) technique, (Wanishsakpong and Notodiputro, 2018). Circulation features, especially the diurnal cycle of low-level wind over the LVB, were investigated to gauge the value of convection-permitting models in simulating mesoscale systems.
3 Results
3.1 Temporal rainfall characteristics
In this section, features investigated include the number of dry days, maximum daily rainfall, mean rainfall biases, and circulation patterns. The CHIRPS, WD01, and WD02 daily rainfall variability over the study area are presented in Supplementary Figures S1–S3, respectively. Generally, there is an indication of rainfall intensification during Week 2 and an overall decline during Week 4. Comparing WD01 and WD02, there is an increase in spatial variability, signifying an improved ability to simulate localized rainfall events. Spatially averaged rainfall for CHIRPS, WD02, and WD02 is presented in Figure 3. CHIRPS indicated that the 14th day of April 2018 had the highest rainfall amounts over the study area, consistent with the spatial analysis, as shown in Supplementary Figure S1. However, both model outputs placed this event on 13th April 2018, which is consistent with the respective spatial patterns, as shown in Supplementary Figures S2, S3. Based on the Taylor Diagram as shown in Figure 4, WD02 outperforms WD01 only in terms of the standard deviation but has higher root mean square error (RMSE) and a lower correlation score. Although this implies that rainfall magnitudes are better simulated in WD01, it also presents the drawback of using spatially averaged data to compute model evaluation metrices.
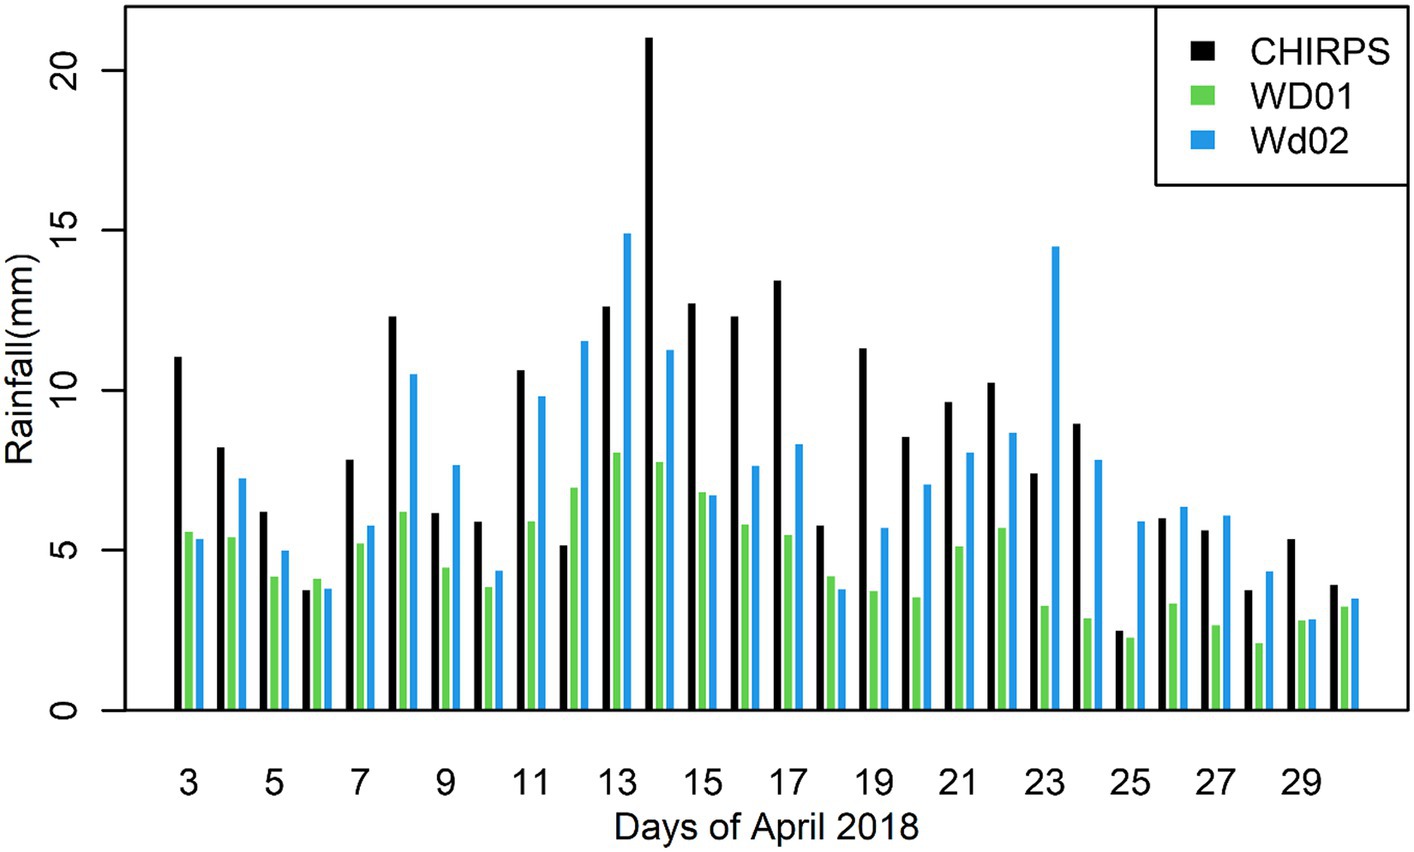
Figure 3. Spatially averaged daily rainfall over the study area based on CHIRPS, WD01, and WD02 from 3rd April 2018 to 30th April 2018.
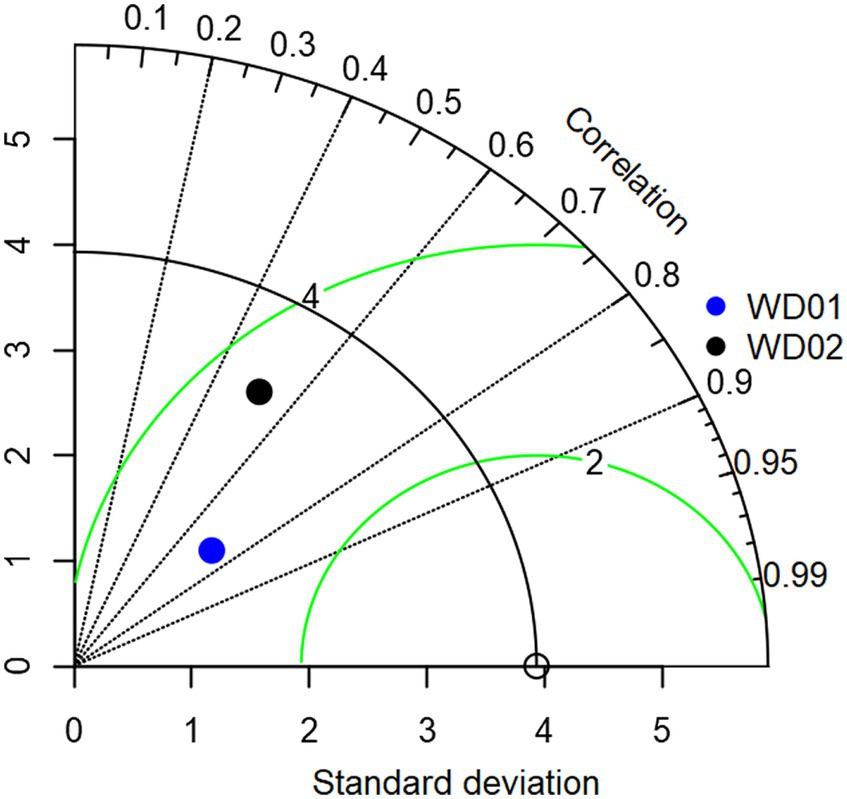
Figure 4. Taylor diagram showing the performance of WD01 and WD02 against CHIRPS.
Furthermore, we sampled the results against selected stations in both lowlands and highlands to assess the performance of the simulations in regions of varied topography. In Marsabit, which is a secluded hill within the Turkana Channel, reaching over 1,000 m above sea level (ASL), WD02 results in tremendous improvement in simulating the evolution of rainfall compared with WD01, as shown in Figure 5A. In Makindu, with elevation slightly less than Marsabit and located in the southeast part of Kenya, WD02 indicates a notable improvement over WD01 in capturing the daily evolution of rainfall over the case study, though with less amounts than the gauge records, as shown in Figure 5B. However, over the eastern lowlands in Garissa, Figure 5C, at approximately 146 m ASL, neither WD01 nor WD02 was able to consistently simulate the magnitudes of rainfall. For the stations within the Mt. Kenya region, both Embu and Nyeri (Figures 5D,E respectively) indicate that WD02 was better than WD01 in simulating the daily evolution of rainfall. The results for Meru station, Figure 5F, which is located northeast of Mt. Kenya, show the best approximation of WD02 to station records. Overall, model results at the convection-permitting scale were better over the highland regions compared with the lowlands, indicating the improvements related to resolving mesoscale systems related with orography.
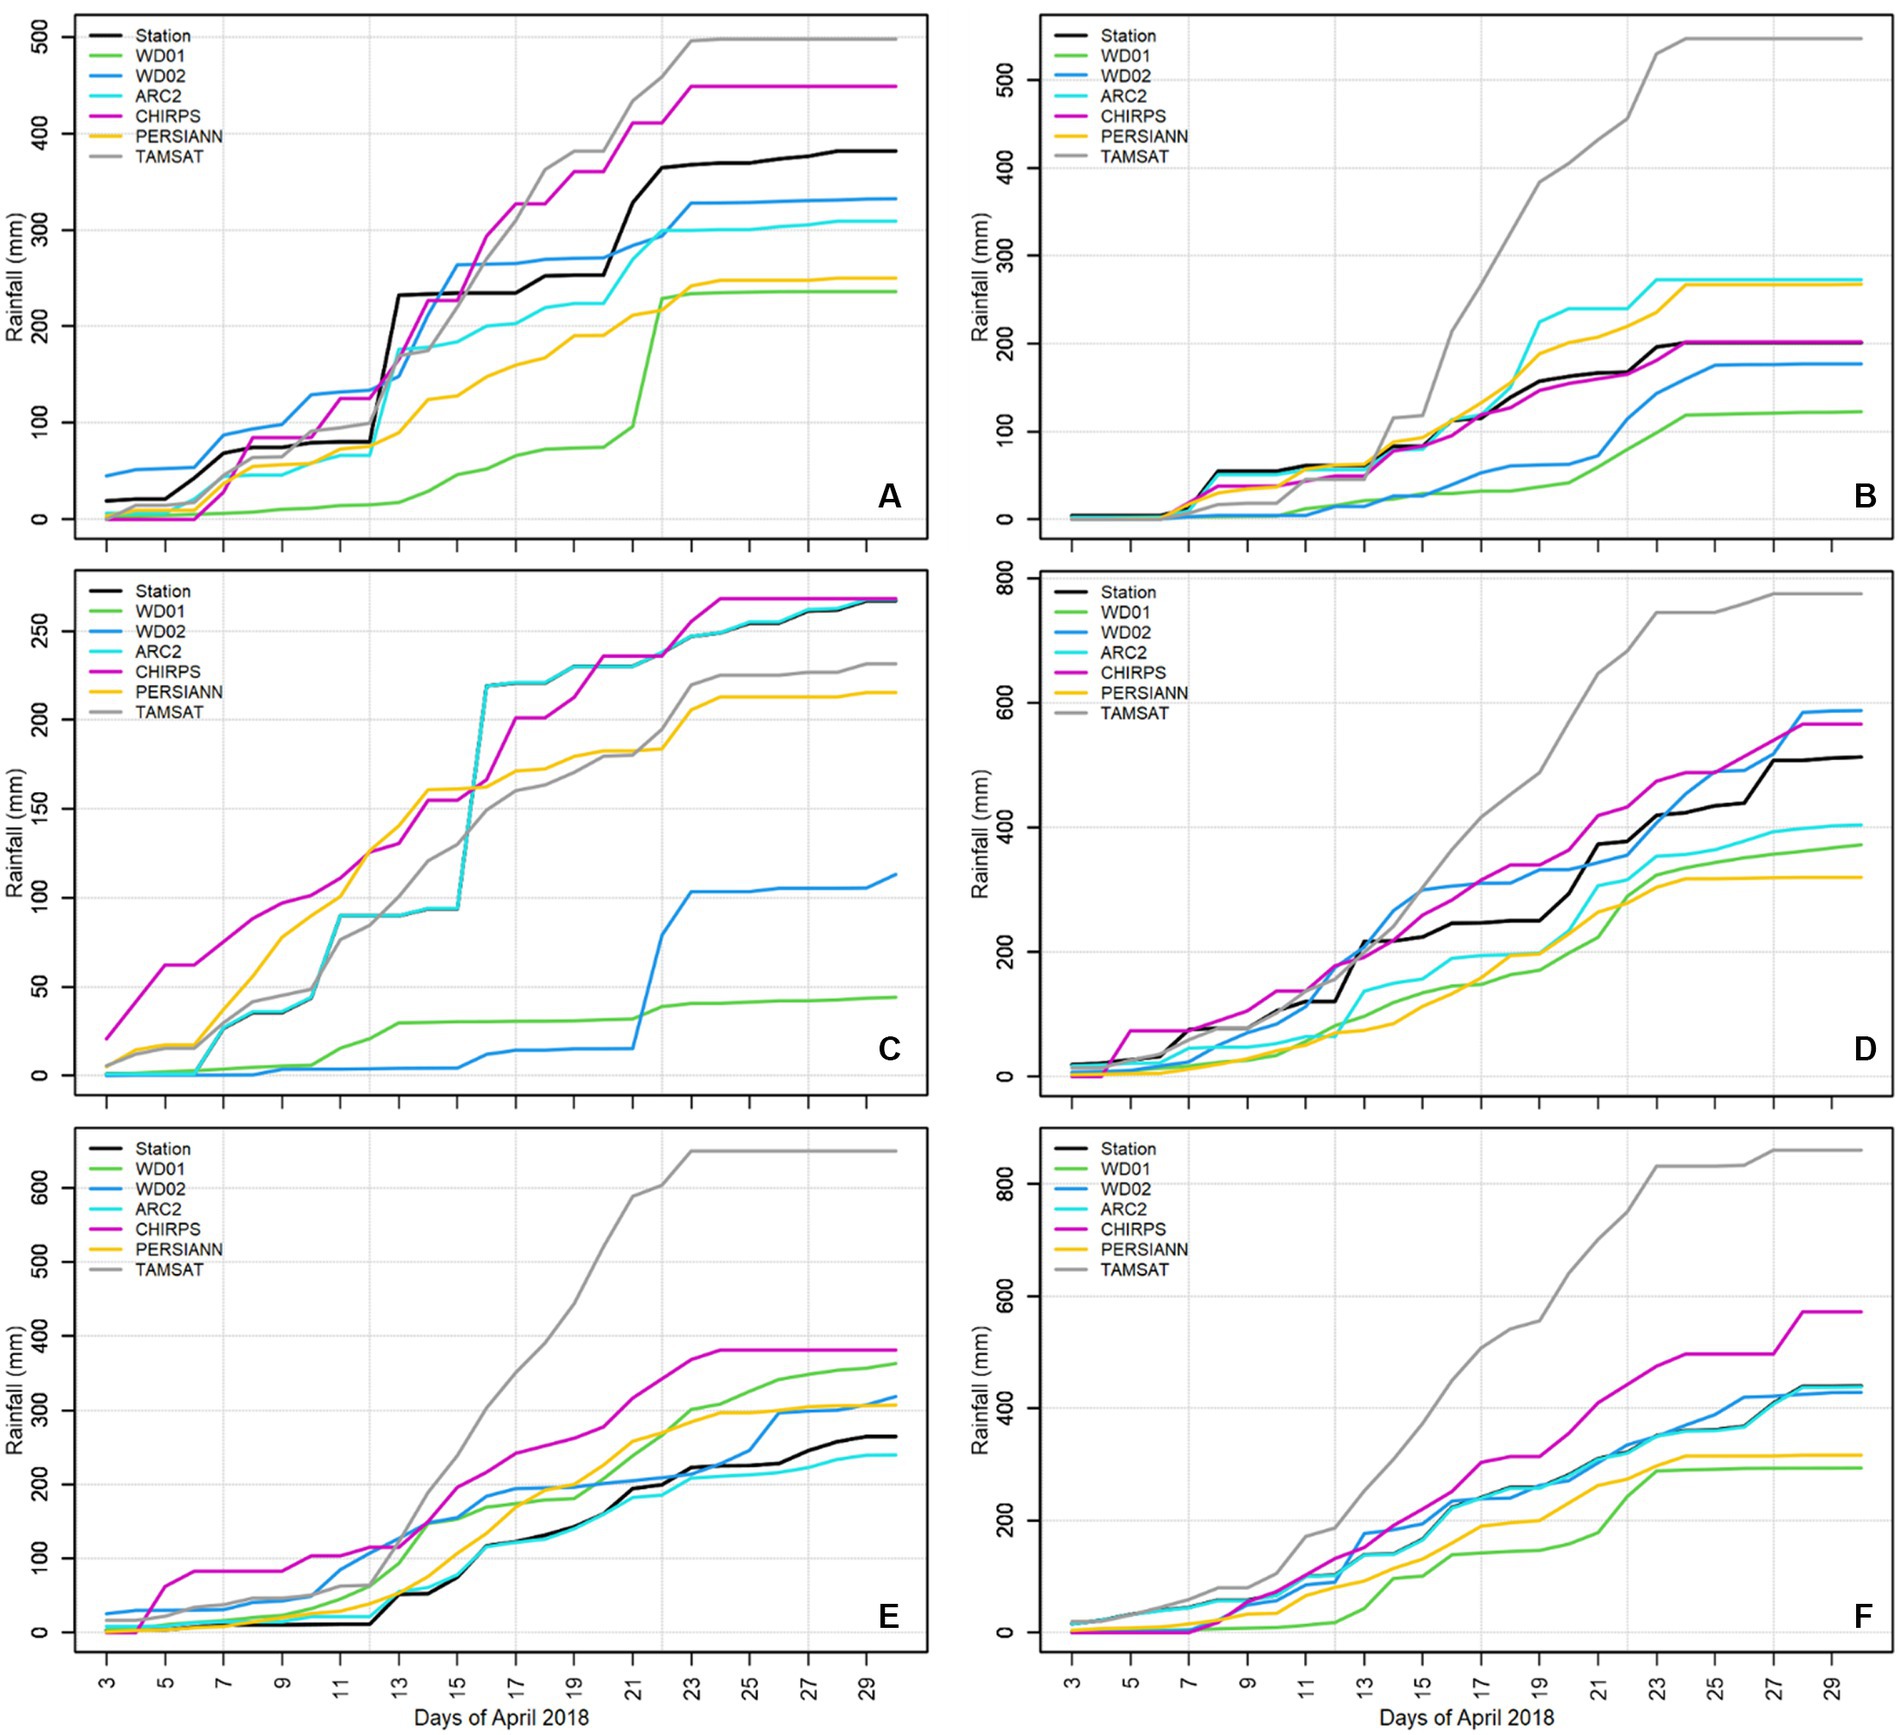
Figure 5. Cumulative plot of station recorded rainfall for selected locations over the Kenyan lowlands, Marsabit (A), Makindu (B), and Garissa (C), and close to Mount Kenya, Embu (D), Nyeri (E), and Meru (F).
The RFEs show huge disparity over Marsabit, while ARC2 is an exact match of the gauge records in Nyeri and Meru, and with a close match for the rest of the stations. TAMSAT, on the other hand, tends to be an outlier with more rainfall for all stations except for Nyeri, unlike in Dinku et al. (2014) where calibrated TAMSAT rainfall closed matched gauge records over Ethiopia. All other RFEs tend to closely approximate rainfall over Garissa, Embu, and Meru. The differences between the RFEs could be attributed to whether the specific synoptic records were used to adjust the satellite retrievals.
Figure 6 presents the spatiotemporal variability of very heavy rainfall over East Africa, as implied by the number of days with rainfall exceeding 50 mm within 24 h for several gridded datasets and WRF outputs. For ARC2, there was extreme rainfall for 2 days over regions within the 600 m ASL in eastern Kenya and northern Uganda, while for CHIRPS, extreme rainfall was occurred only in the highland regions. PERSIANN seemed an outlier, with only less than 4 days over the southern coastal regions of Kenya. On the other hand, TAMSAT maps extreme rainfall, of more than 4 days, in an expansive region west of the 600 m contour and east of the GRV in Kenya. Furthermore, days of heavy rainfall were noted in Marsabit, Moyale region of the Kenya-Ethiopia border, and west of Lake Victoria. On the other hand, the two simulations presented contrasting results, with more than 8 days of extreme rainfall concentrated over the highlands, notably Mt. Elgon, Mt. Kilimanjaro, and Mt. Kenya, for WD01, while WD02 simulates fewer days of extreme rainfall in these ecosystems. Furthermore, WD02 generally captures other extreme rainfall events across the study area, though with the highest frequency over the mountains. This presents a critical advantage in high-resolution forecast production—the ability to detect localized extreme rainfall events.
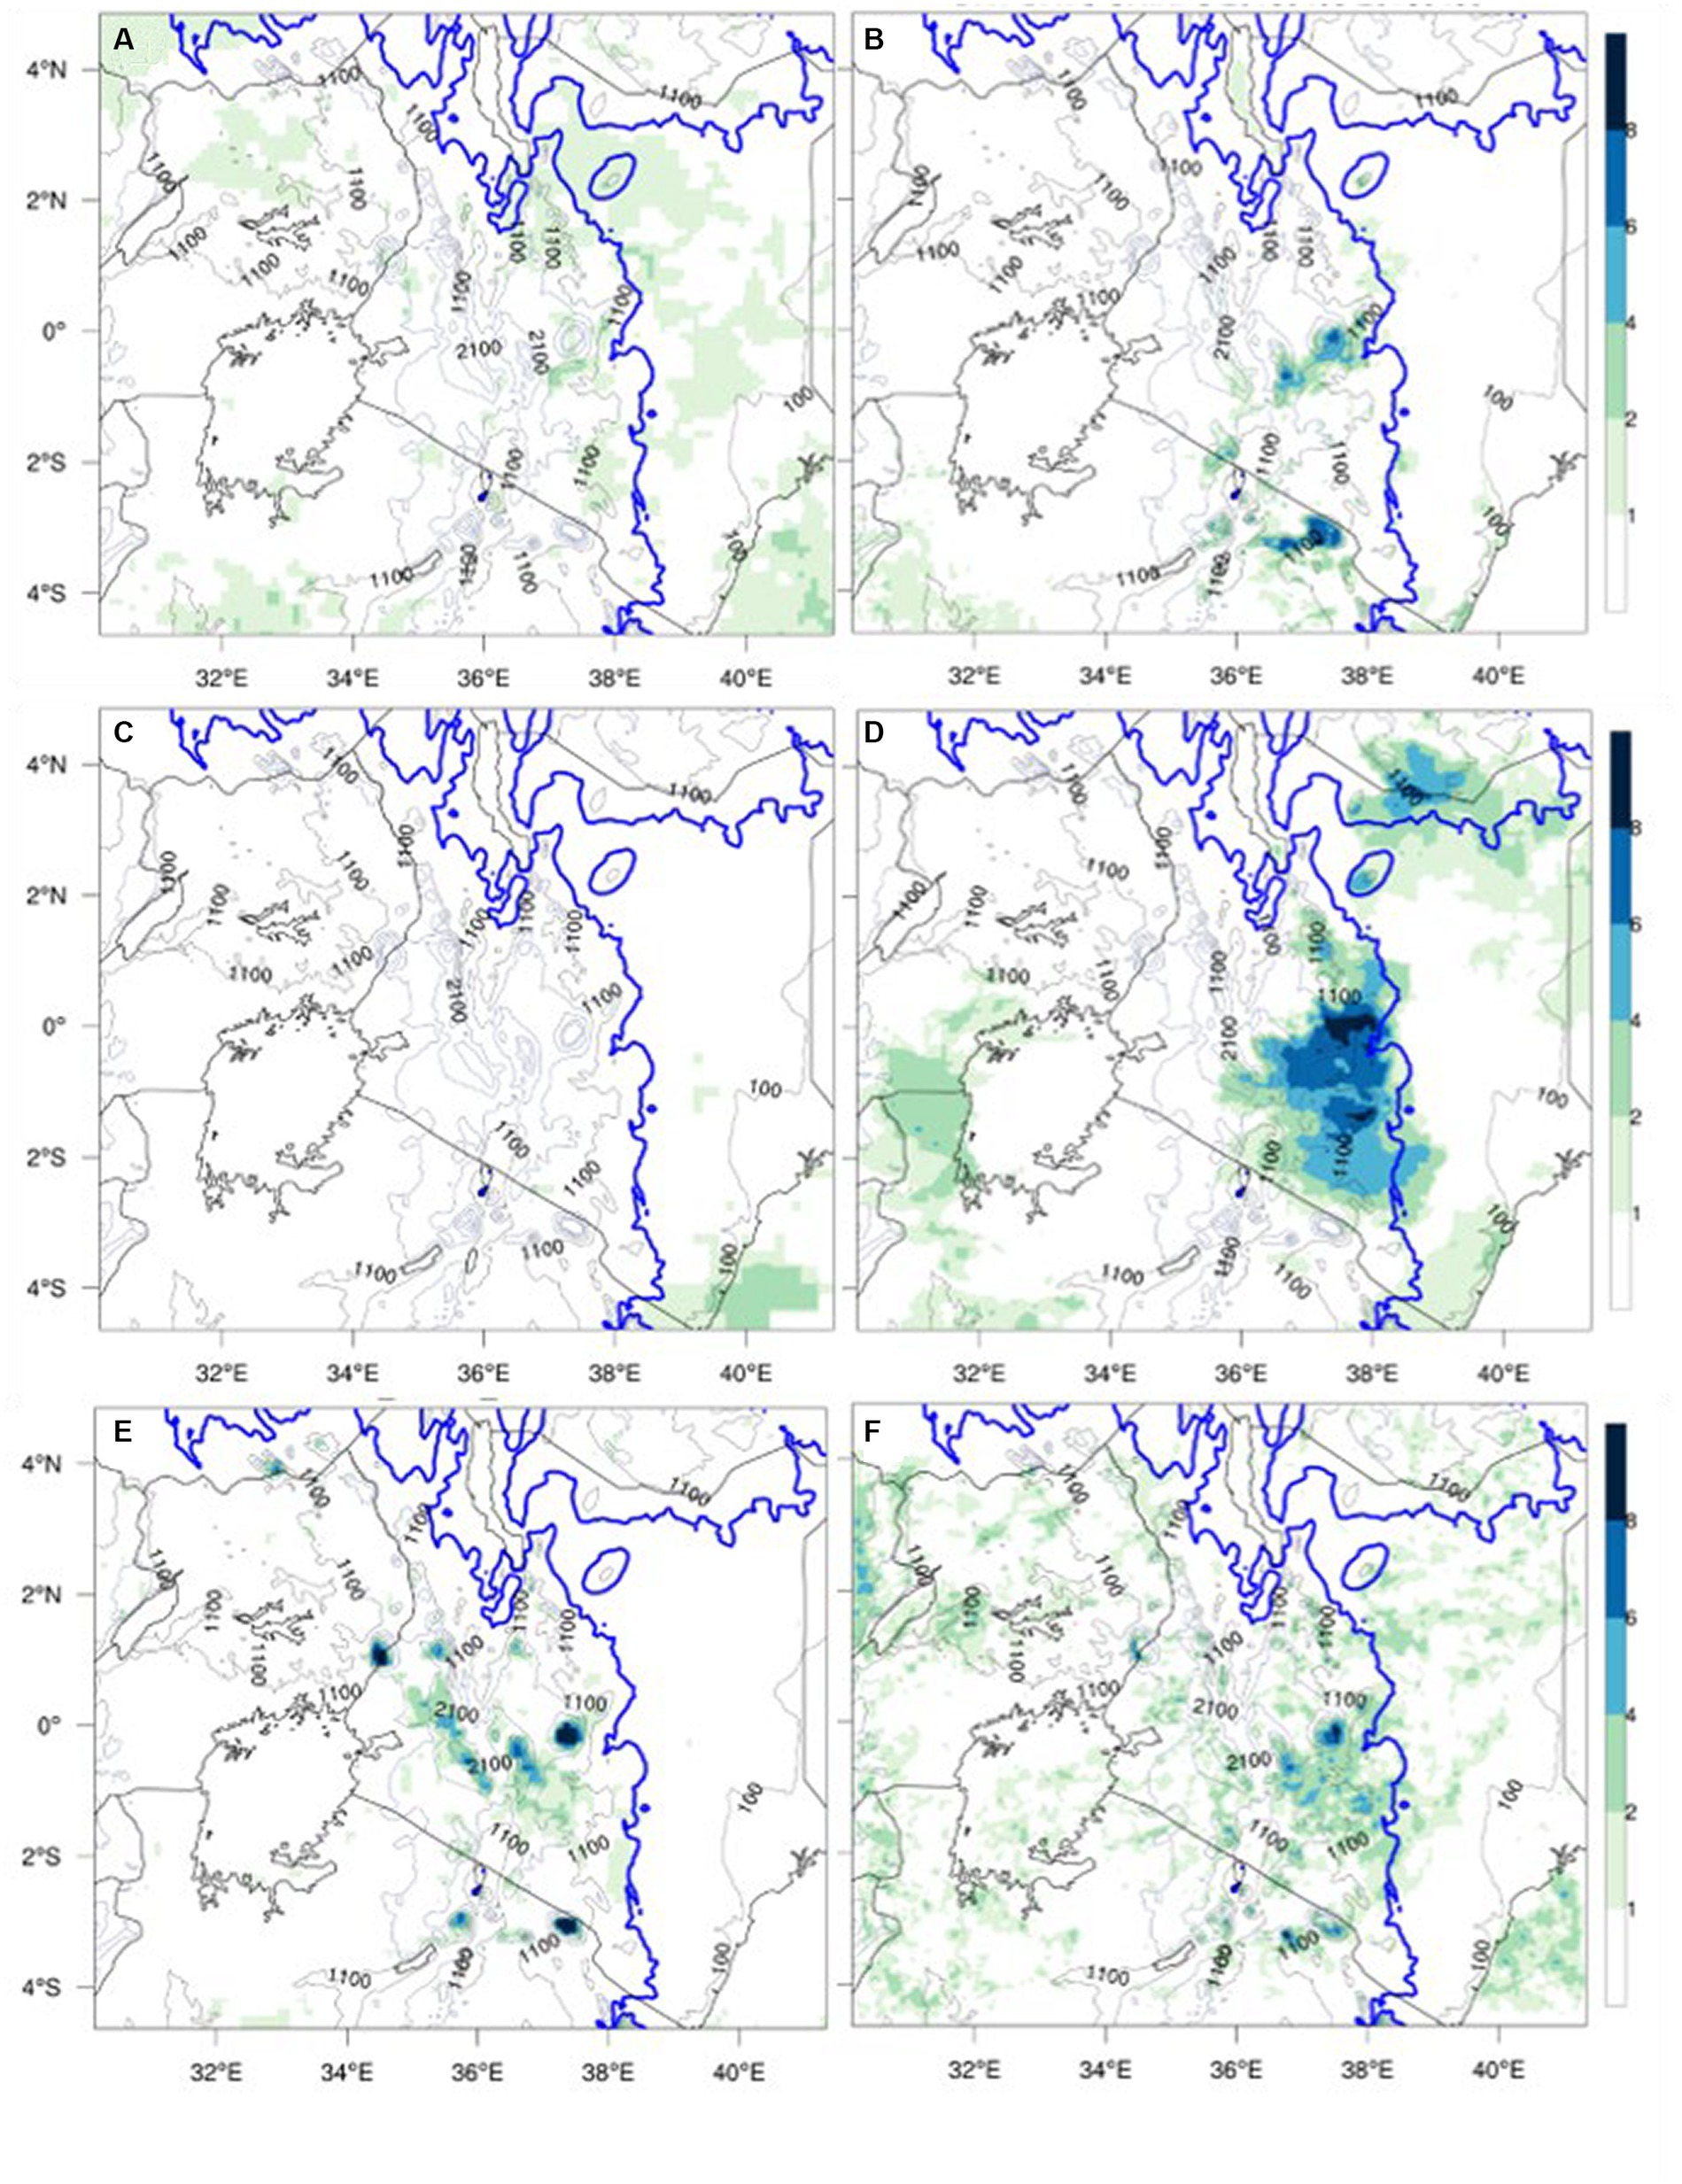
Figure 6. Spatial distribution of the number of days with very heavy rainfall (above 50 mm) from 3rd April 2018 to 30th April 2018 for ARC2 (A), CHIRPS (B), PERSIANN (C), TAMSAT (D), WD01 (E), and WD02 (F) overlaid with elevation contours. The bold blue line indicates the 600 m ASL contour.
The summary in Table 3 shows that Marsabit reported the highest daily maximum rainfall amount of 151 mm, on 13th April 2018, while Nyeri had the least of 42 mm recorded on the 16th April 2018. On the respective days, both WD01 and WD02 did not correctly simulate such rainfall magnitudes. The amounts for Marsabit were 2.4 and 14.5 mm for WD01 and WD02 and 16.3 and 28.9 mm for Nyeri. The simulation of both the number of dry days and the extreme events was fairly good for both model outputs, with no deviation of more than 2 days noted. The spatial variability of the number of dry days during the study period is presented in Figure 7, where ARC2 and CHIRPS portray a good spatial agreement, with the highest number of dry days over the coastal and southeastern regions of Kenya spreading into Tanzania in regions east of 35 °E longitude. This pattern is closely matched by TAMSAT, while PERSIANN presents fewer dry days, especially for regions within the LVB and eastern Uganda. Despite the differences across the reference datasets, the major areas of consensus were notably the Marsabit to Lake Turkana regions and the southern Kenya to northeastern Tanzania cross-border areas.
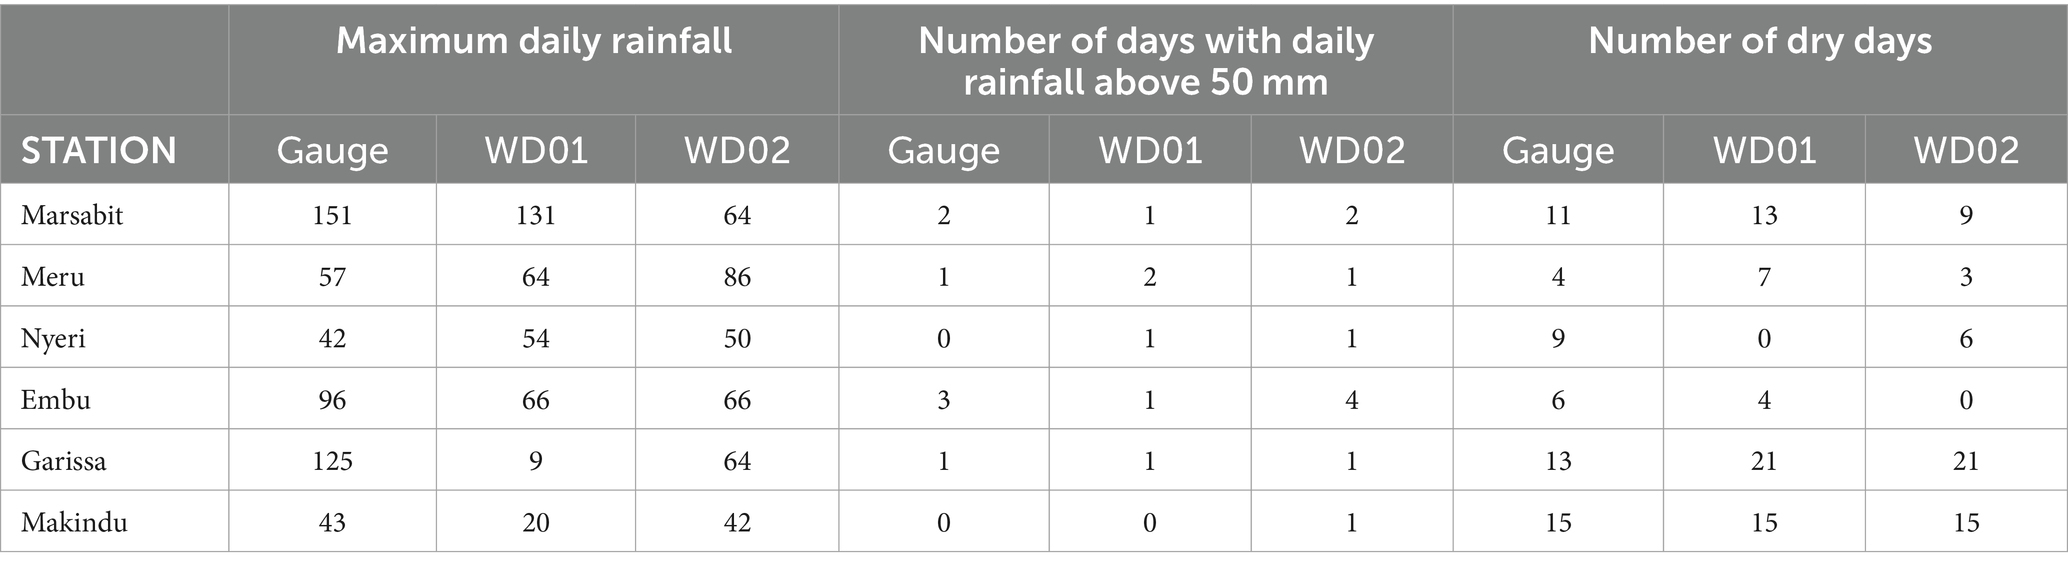
Table 3. Summary of rainfall characteristics for six stations comparing gauge records and model outputs for WD01 and WD02 from 3rd to 30th April 2018.
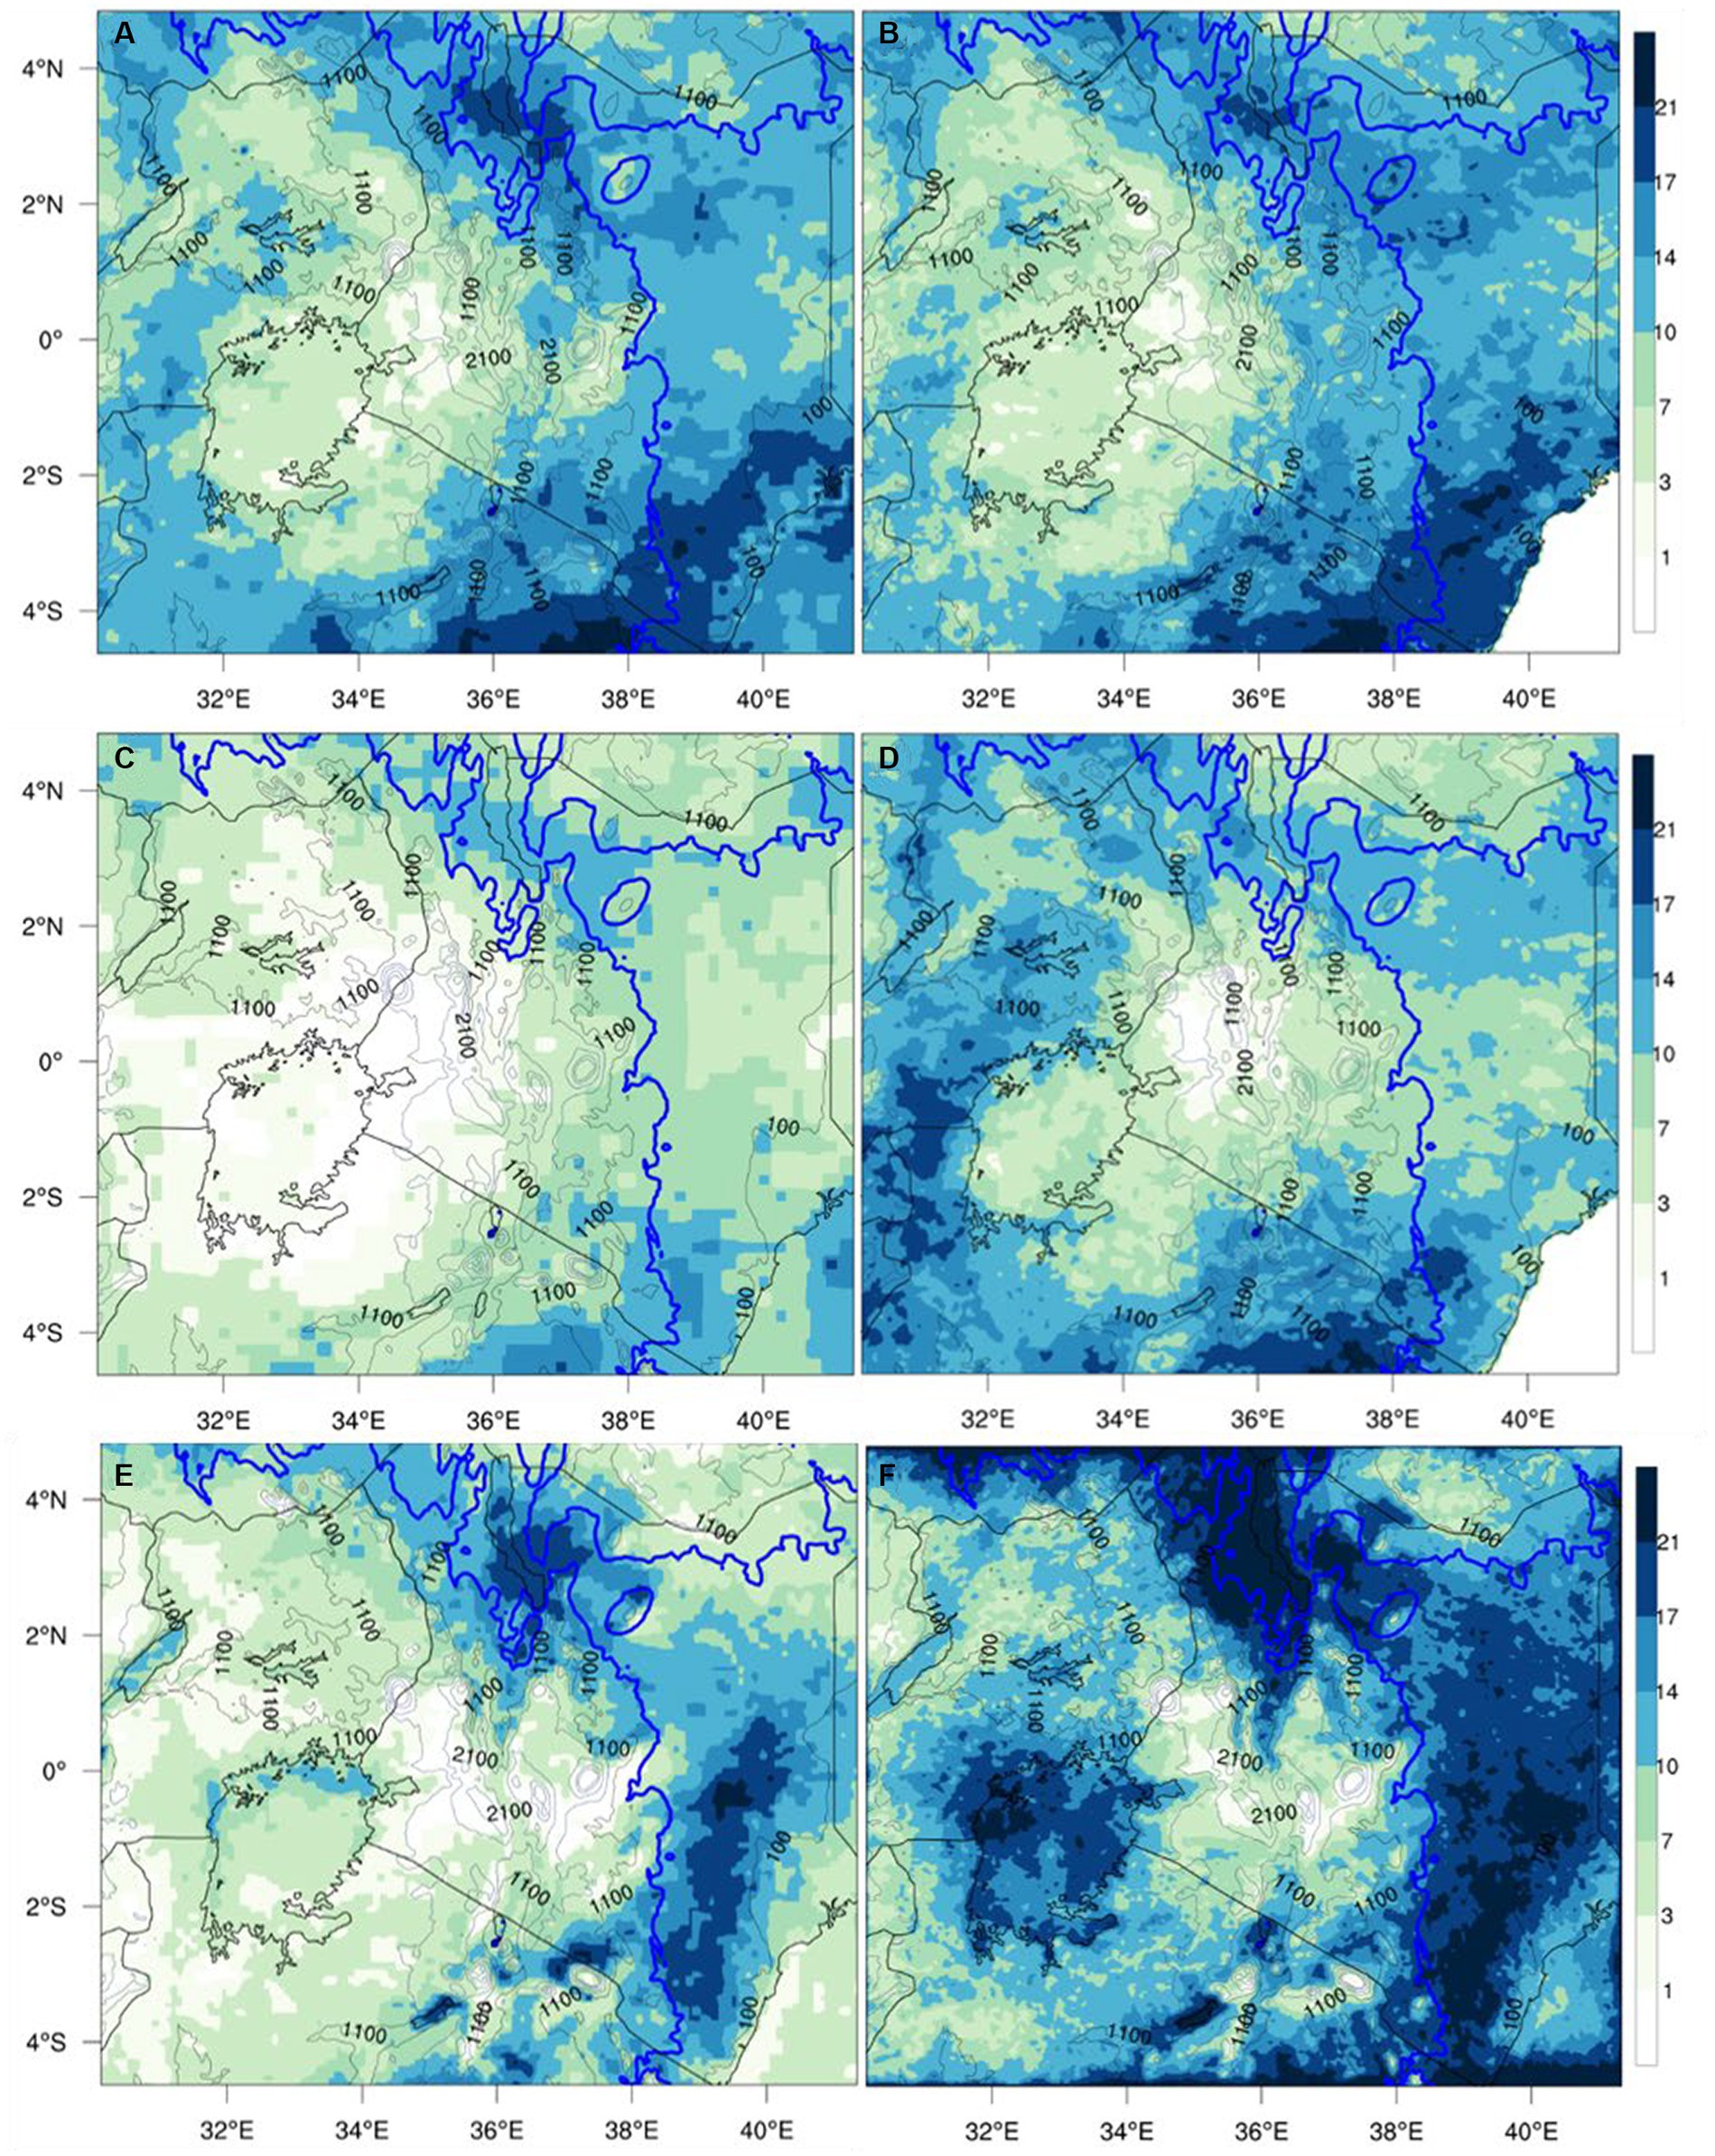
Figure 7. Number of dry days (with less than 1 mm in a day) from 3rd April 2018 to 30th April 2018 over the study area for ARC2 (A), CHIRPS (B), PERSSIAN (C), TAMSAT (D), WD01 (E), and WD02 (F).
WD02 indicates more dry days over Lake Victoria and regions below the 600 m ASL contour, especially over Turkana County in Kenya, compared with WD01. Notably, regions with the highest rainfall events are constrained over the mountainous regions east and west of the GRV in Kenya and Mt. Kilimanjaro in Tanzania. This pattern is not explicitly captured in any of the gridded reference datasets. This highlights that the spatiotemporal variability of rainfall over East Africa is sensitive to local orographic effects, despite the prevailing synoptic features. Furthermore, WD02 indicates that the lowlands of eastern and northern Kenya had more dry days than the highlands. There is a unique spatial signature implying that the 600 m ASL contour marks the spatial discontinuity on the coherence of the number of rainfall days, especially over Kenya. This distinction is not only vivid for WD02, but also WD01, and ARC2, though all datasets affirm this finding over northern Kenya. Differences between the datasets are notable sources of uncertainty.
The spatial patterns of rainfall biases are consistent across the period of study, except for Week 3 over the highlands in central Kenya, where WD01 signals overestimation, while a dry bias is reported for WD02, as presented in Figure 8. Overall, the biases are less pronounced for Week 4, especially in regions with elevations less than 600 m. However, for the same week, WD02 has the highest biases over central Kenya, exceeding an average of 10 mm in a day. This analysis indicates that at coarse resolutions, WRF consistently overestimates rainfall over the highlands. This is further noted in Figure 9, where WD01 consistently shows increase in rainfall with altitude, while for WD01, this relationship tends to break after 2000 m ASL. However, at lower elevations, both simulations indicated rainfall increase with elevation to approximately 500 m ASL, followed by a notable decline to approximately 1,100 m ASL.
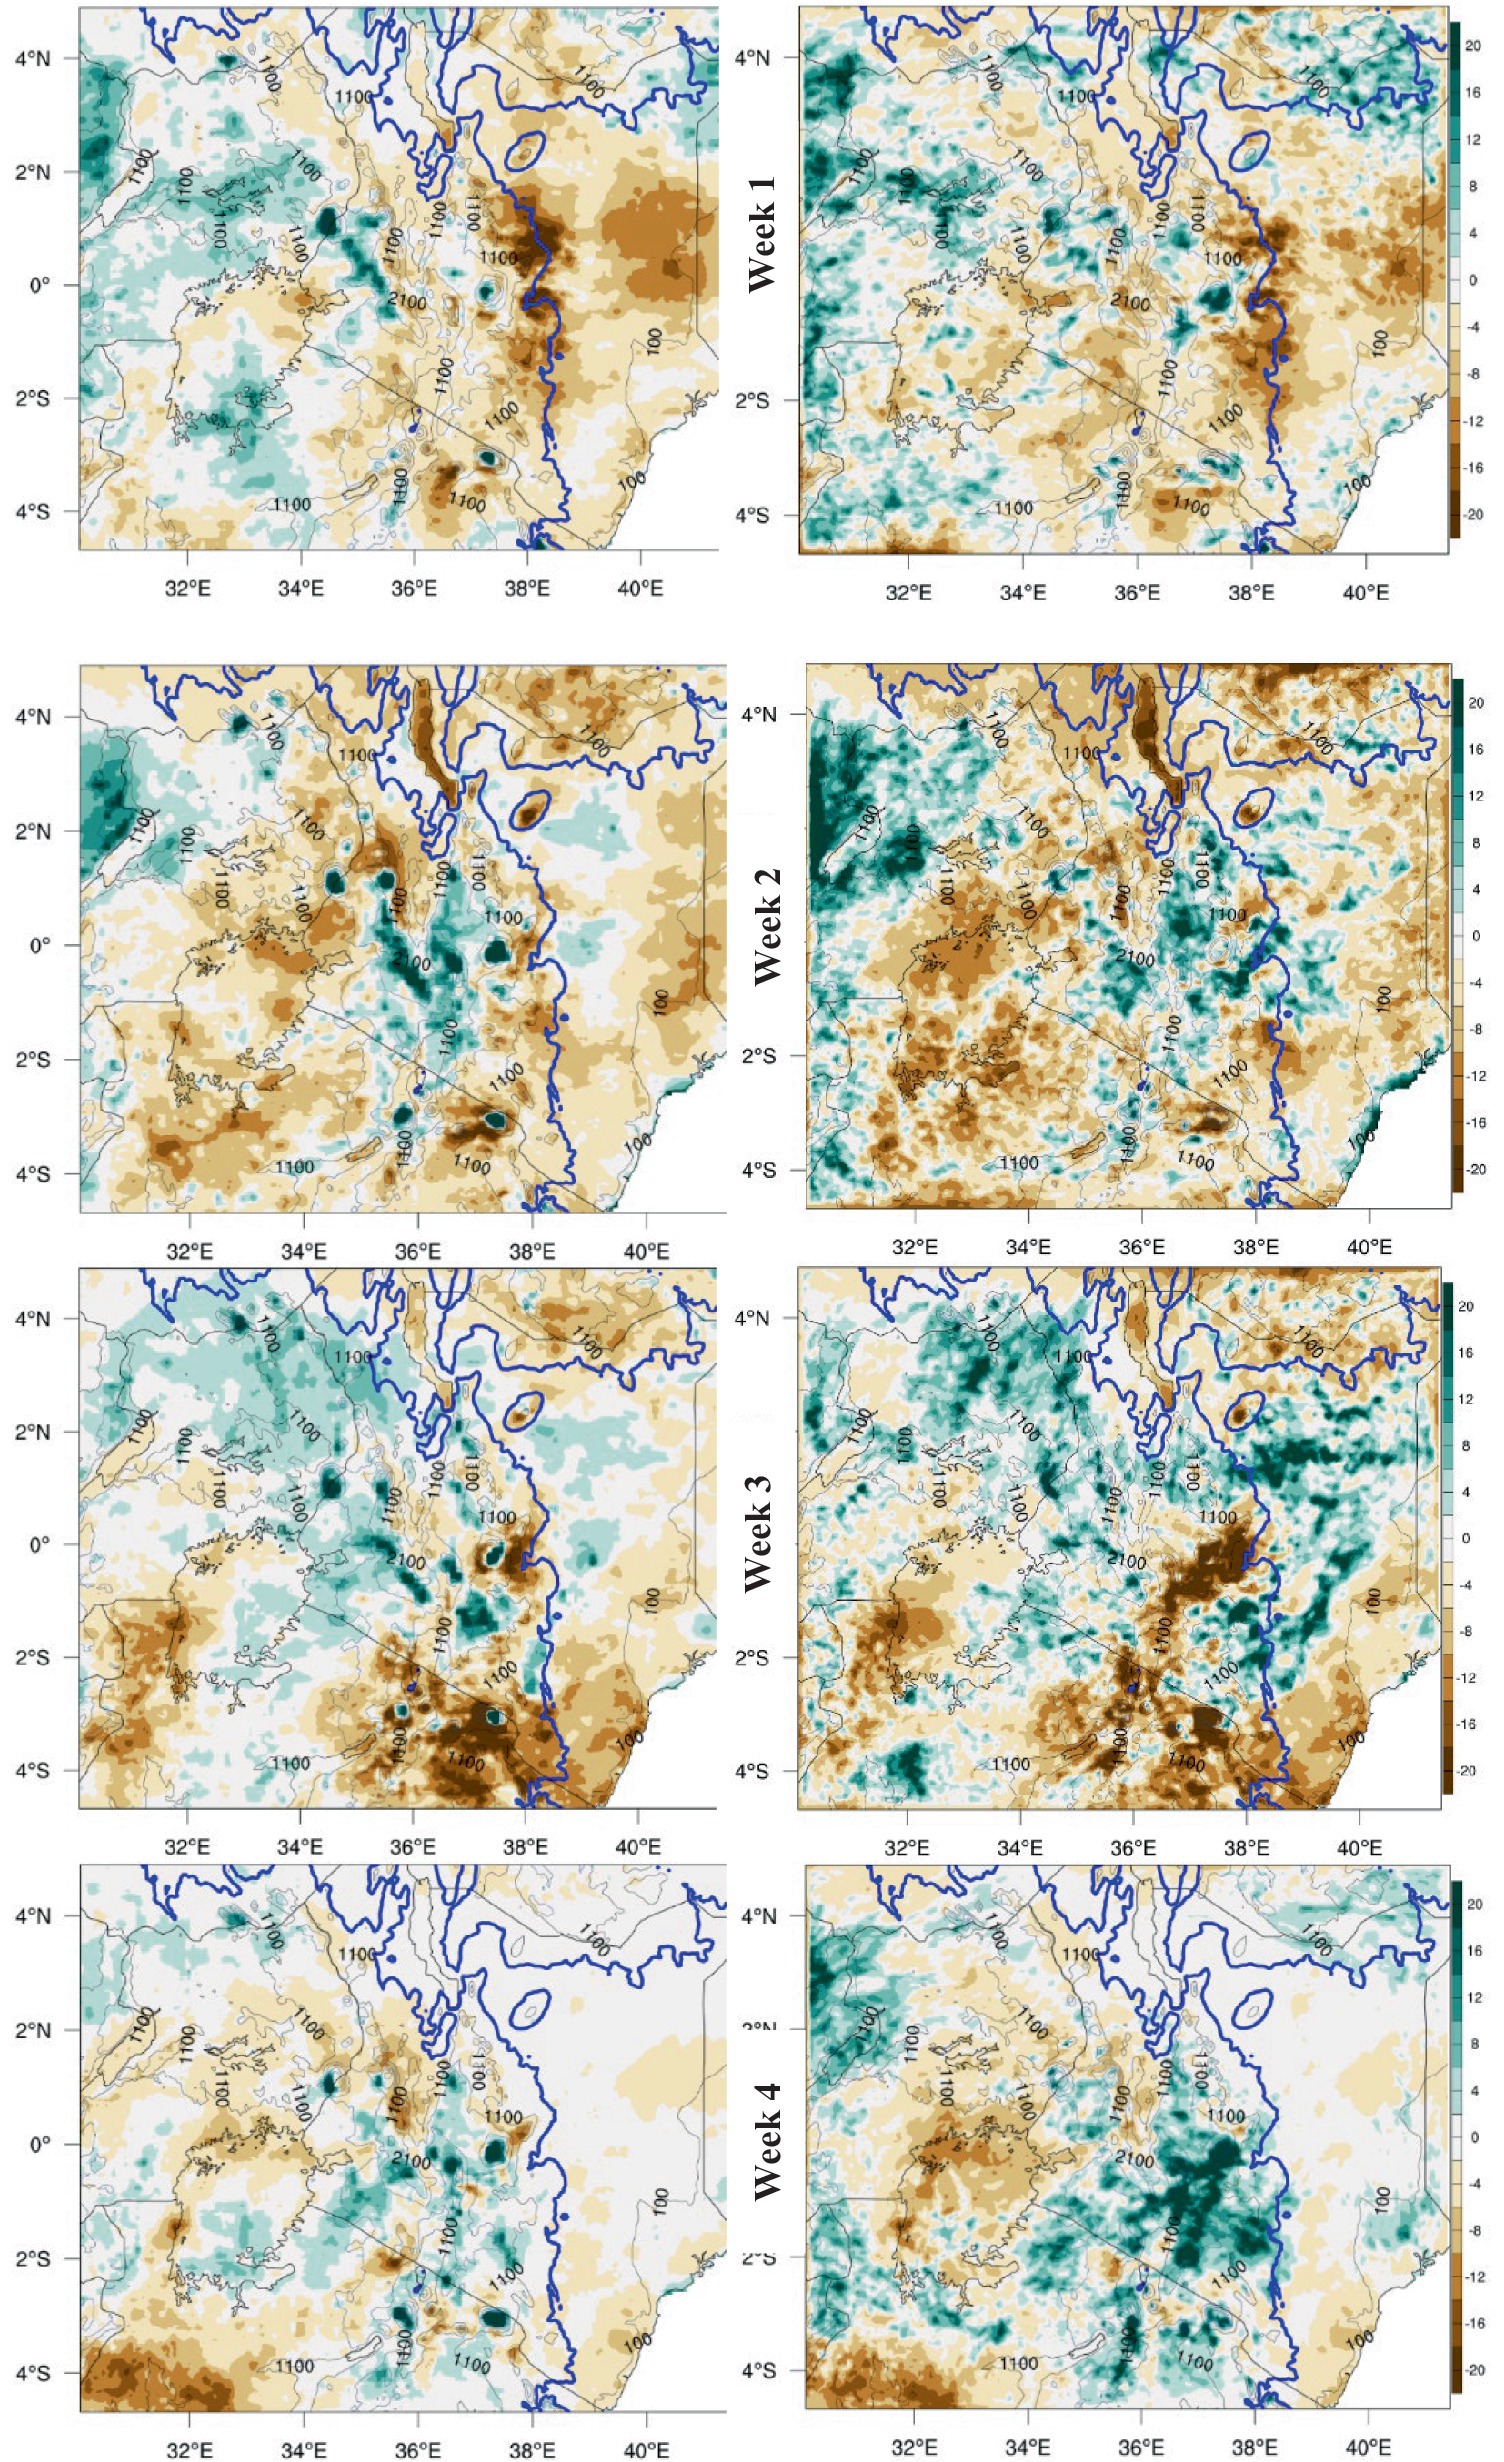
Figure 8. Mean simulated rainfall biases in mm per day for Weeks 1 to 4 over East Africa for WD01 (left) and WD02 (right). The weeks are defined by the period over the dates 3rd to 9th, 10th to 16th, 17th to 23rd, and 24th to 30th for Week 1, Week 2, Week 3, and Week 4, respectively.
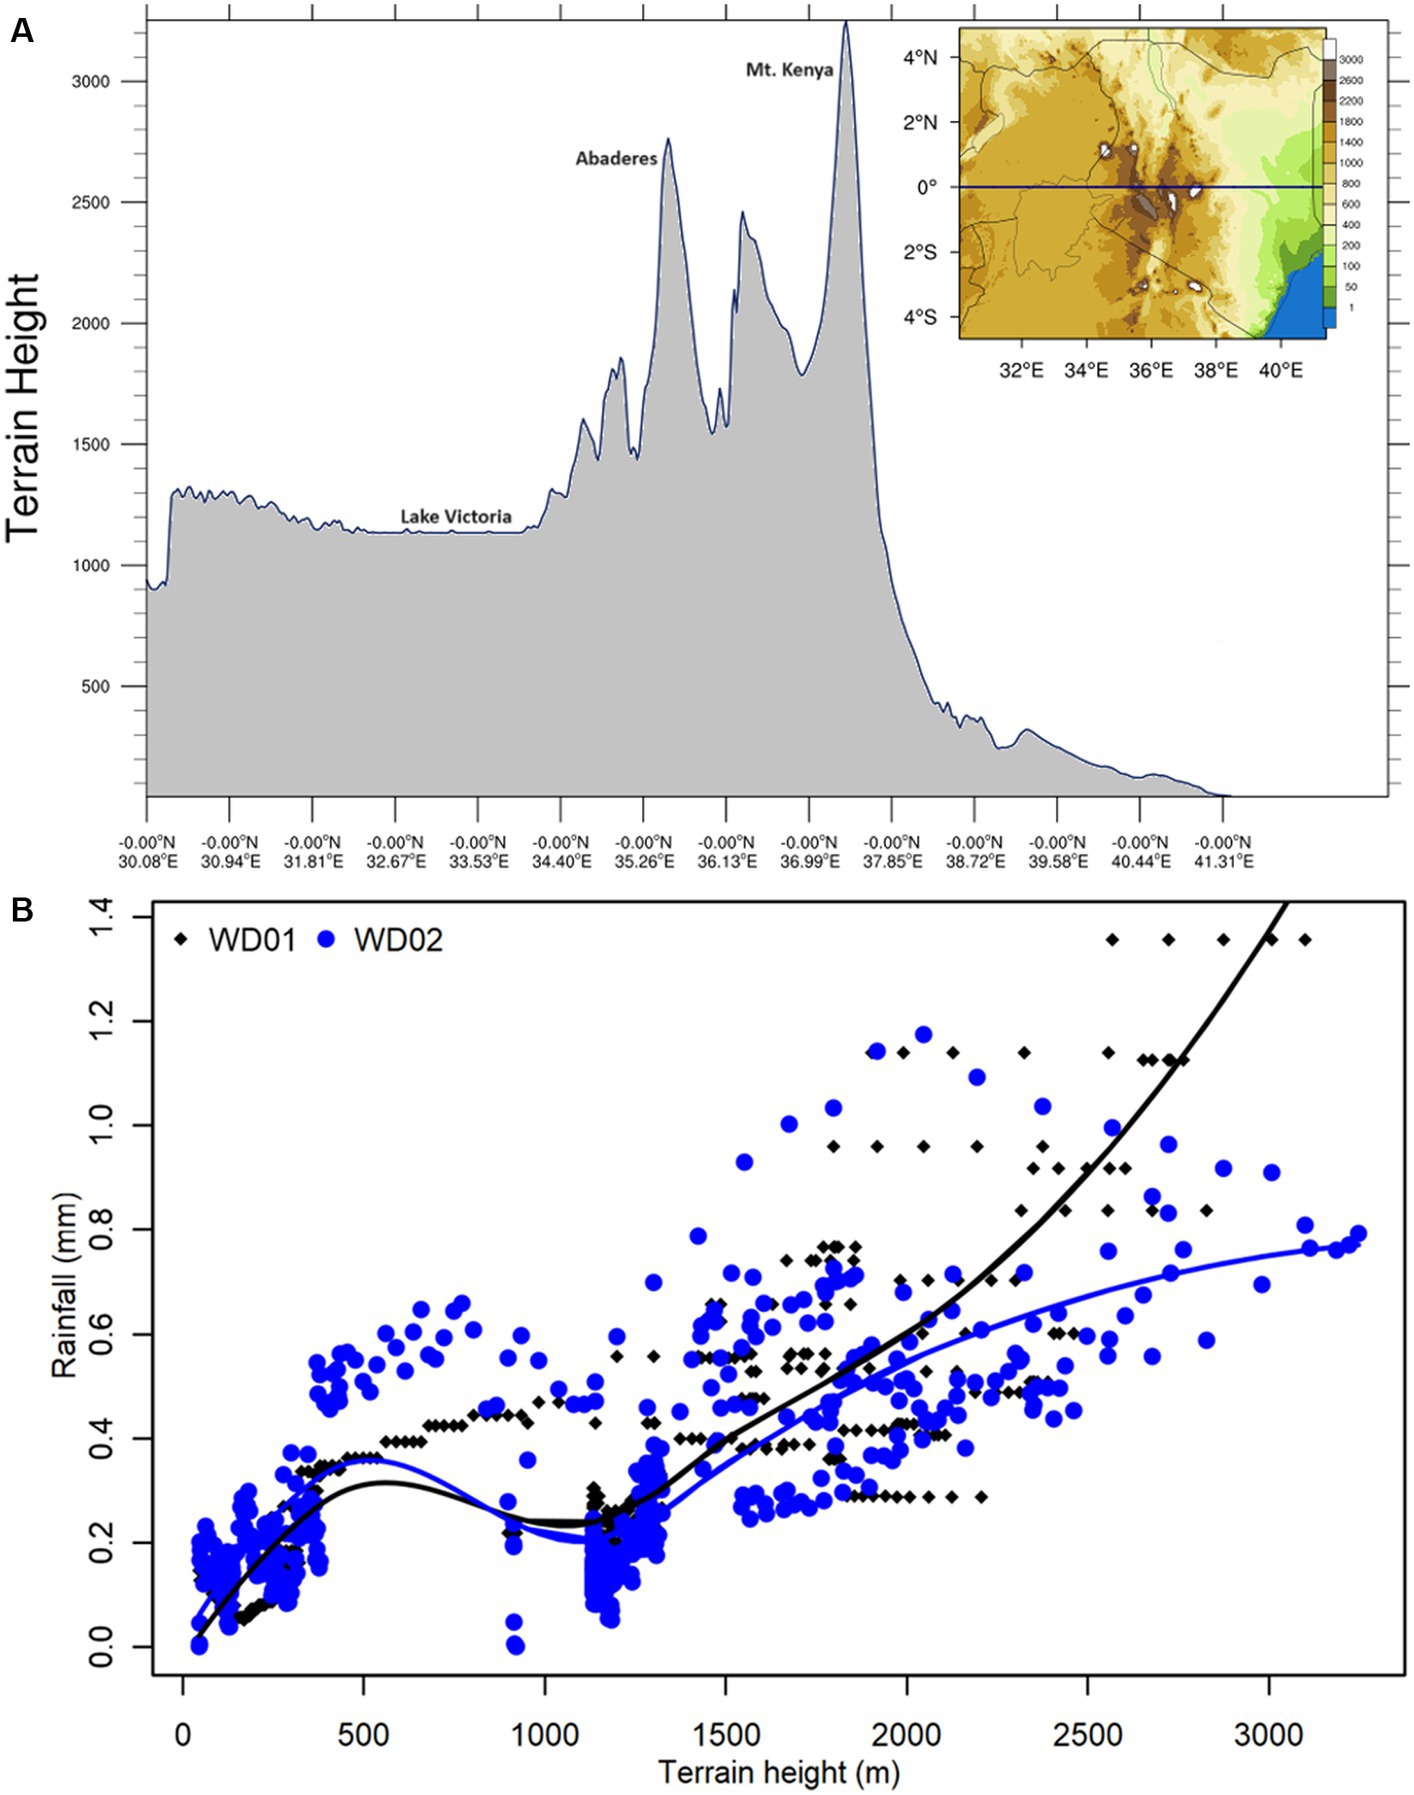
Figure 9. Cross-sectional view of WRF elevation along the equator (A) and scatter plots with LOESS regression lines showing the mean rainfall variability of rainfall for a transect along the equator for both WD01 and WD02 (B).
3.2 Circulation patterns
Figure 10 presents divergent wind for the afternoon hours, 10 to 16 UTC of 17th April 2018 for WD01, WD02, and ERA5, respectively. WD01 indicates a strong divergent flow centered northeast of Lake Victoria, while for both WD02 and ERA5, the magnitude is reduced and centered on the eastern side. This flow results in pronounced convergence on the highlands west of the GRV in Kenya, where intensity is higher for WD01 compared with both ERA5 and WD02. Over southern coastal Kenya, the divergent flow present in WD02 is not captured in both ERA5 and WD01. Given the diurnal cycle of temperature gradients between water bodies and land, we note that the surface circulations presented in WD02 are realistic, compared with both ERA5 and WD01 over both the LVB and coastal Kenya.
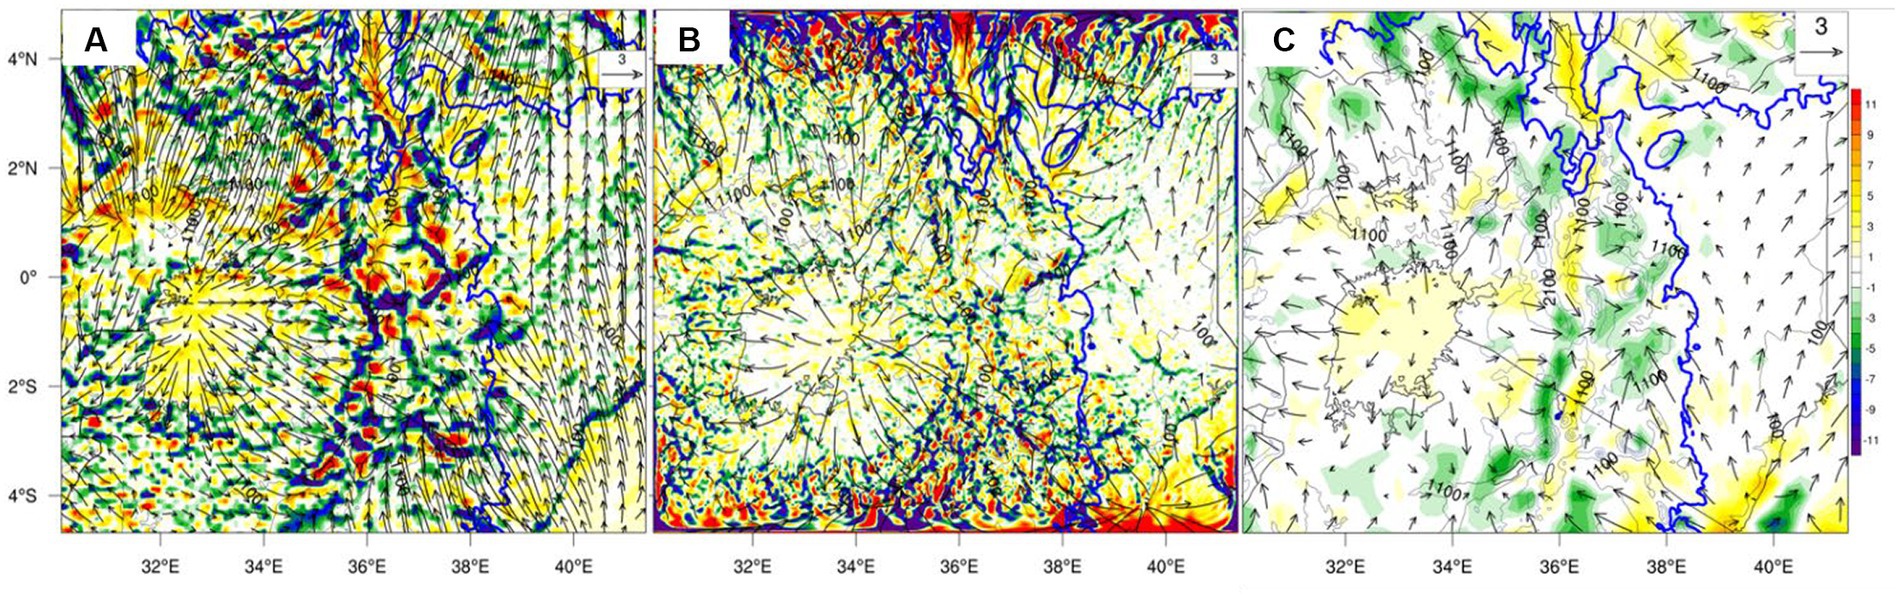
Figure 10. Surface (10 m) divergent wind in m/s (vectors) overlaid with divergence (s−1) scaled by 106 averaged from 11 to 16 UTC for the 17th day of April 2018 for WD01 (A), WDO2 (B) and ERA5 (C). Positive values indicate regions of divergence, while convergence is represented by negative values. The label black contours represent elevation, with the 600 m contour is bolded and shown in blue.
We further present results for the diurnal cycle of the wind profile (with specific interest in the low level, below 800 hPa) for two airport stations located on the shores of Lake Victoria. Figure 11 presents the diurnal cycle of wind profile for both ERA5 and model outputs for Kisumu International Airport where ERA5 indicates calm conditions between 5 and 7 UTC, from the surface to approximately 800 mb, which were preceded by weak westerly winds, and followed by northerly winds up to 10 UTC. Transition to easterlies occurs from 14 UTC. The coarse domain WD01 indicates the presence of easterlies until 2 UTC, followed by transitory calm conditions at 3 UTC, after which westerlies dominate the lower atmosphere until 16 UTC when notable wind shear sets in as the low-level flow turns to easterlies which progressively weaken as the night progress. Unlike ERA5 and WD01, there are no calm conditions in WD02 during the early hours of the day.
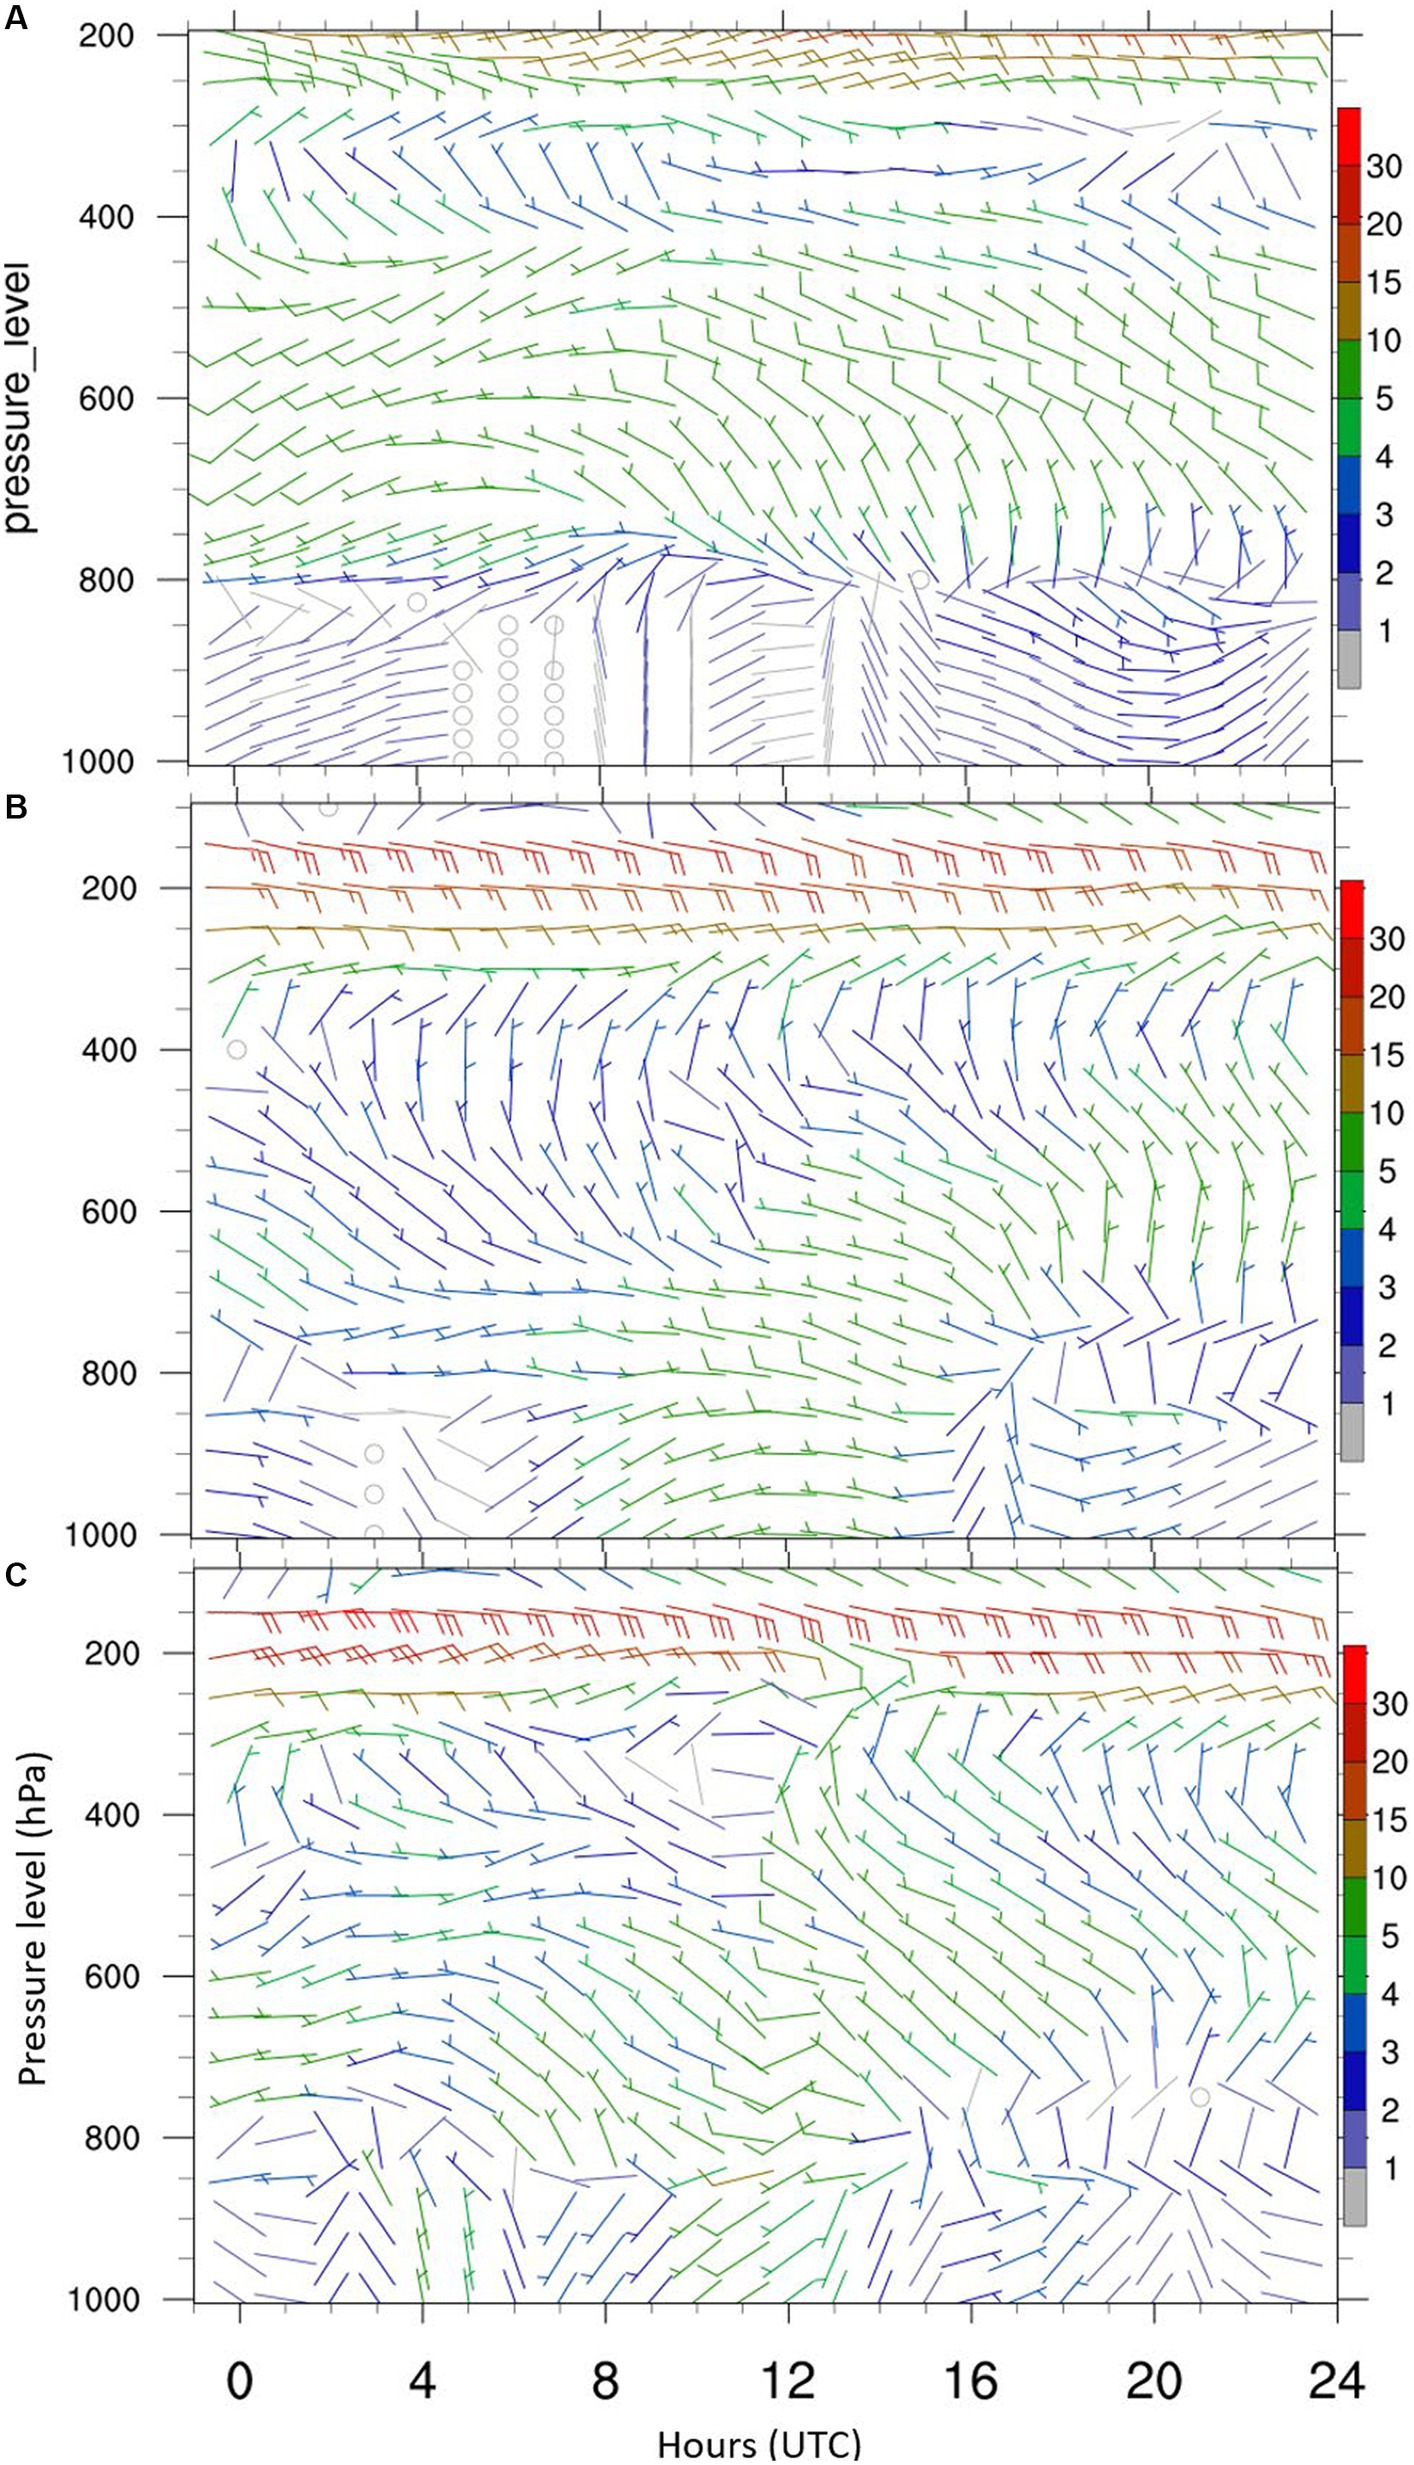
Figure 11. Diurnal cycle of vertical wind profile at Kisumu International Airport for 17th April 2018 for ERA5 (A), WD01 (B), and WD02 (C).
In Entebbe International Airport, Figure 12, ERA5 indicates the presence of north westerlies that progressively weaken until 10 UTC when calm conditions set in, followed by strengthening south easterlies which attain peak wind speeds of 3 to 5 m/s by 21 UTC. On the other hand, WD01 has low-level westerlies with enhanced speeds compared with ERA5, lasting from 00 to 11 UTC, when southerlies set in, followed by calm conditions at 16 UTC and thereafter southwesterlies. Unlike in ERA5, there is no proper reversal of wind directions for WD01. WD02 opens the day with short-lived southwesterlies until 03 UTC, after which northerlies set in lasting until 10 UTC when short-lived easterlies are noted, followed by calm conditions at 13 UTC, unlike WD01 which simulated calm conditions 3 h later. After 15 UTC, south westerlies dominate the lower atmosphere, with pronounced wind shears from 21 UTC.
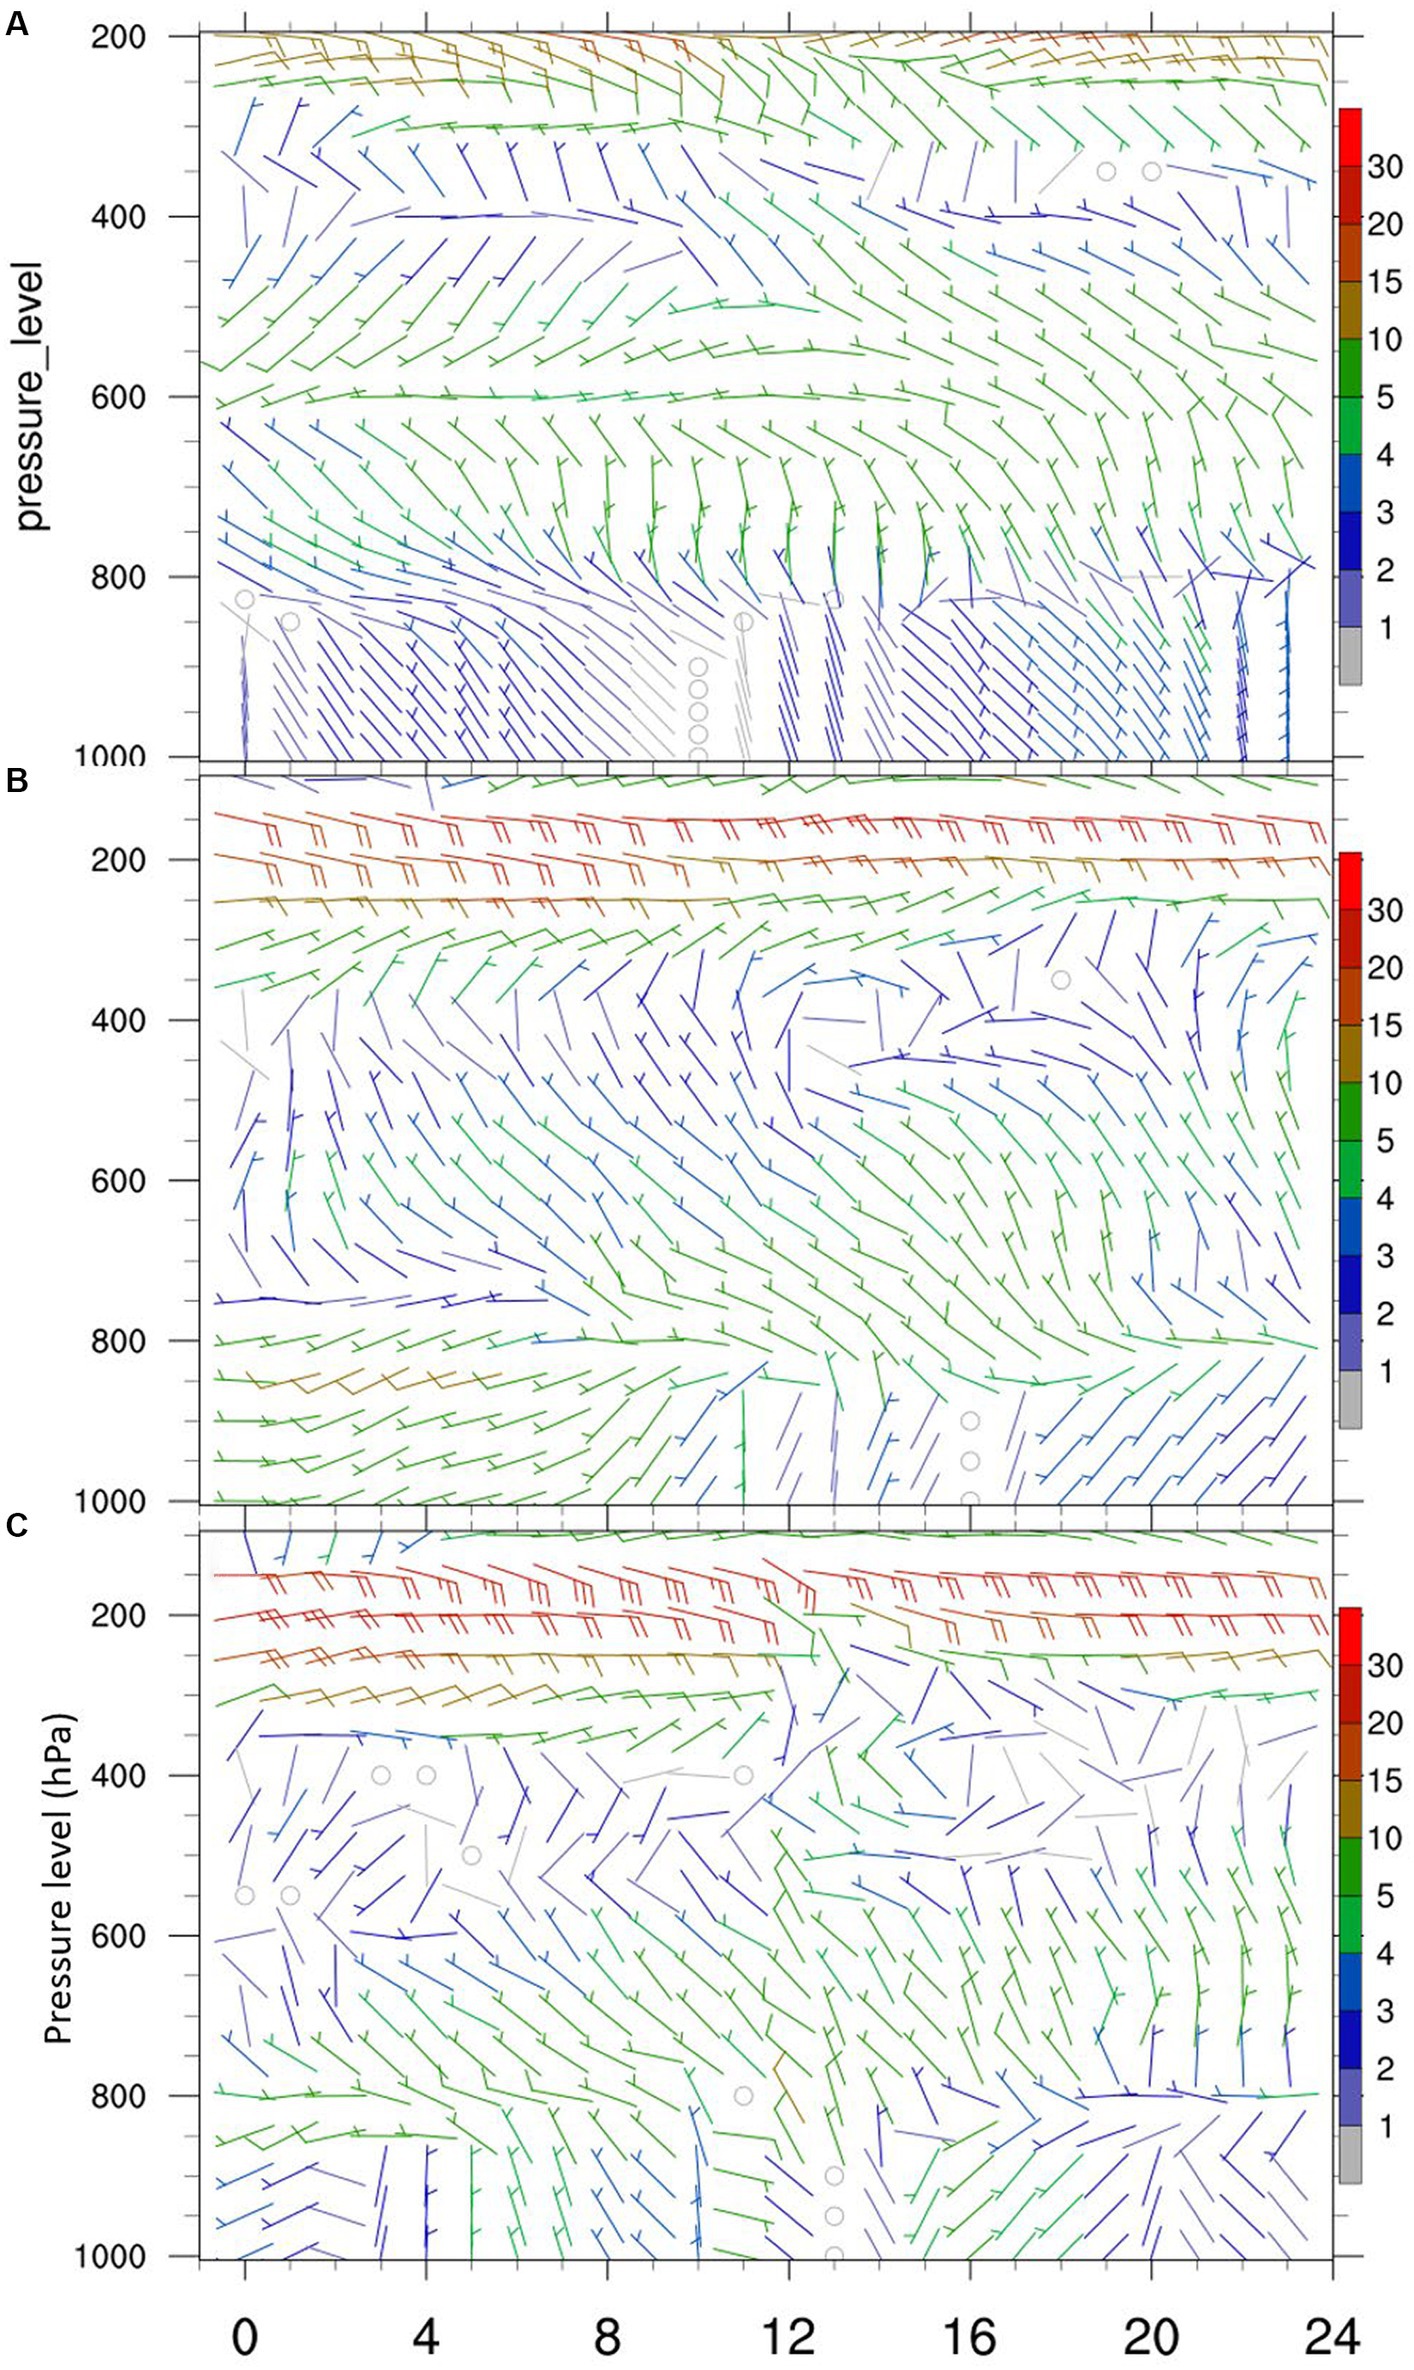
Figure 12. Diurnal cycle of vertical wind profile at Entebbe International Airport for 17th April 2018 for ERA5 (A), WD01 (B), and WD02 (C).
4 Discussion and conclusion
This study indicated important aspects of spatiotemporal variability of weather over East Africa during the case study. All gridded datasets and coarse resolution WRF indicated the prevalence of extreme rainfall events over the highlands, though with striking differences. It is worth noting that all gridded satellite-derived rainfall estimates are based on IR sensors, with additional topography-based calibration. The lack of spatial agreement, like the case of TAMSAT being the only dataset to detect extreme rainfall over the Moyale region, could be attributed to how the various IR sensors capture cold non-rain producing cirrus clouds and underestimation of rainfall from warm shallow convective clouds (Young et al., 2014). Despite relatively high spatial resolutions, 0.05o, 0.1o, 0.0375o, and 0.040o for CHIRPS, ARC2, TAMSAT, and PERSIANN, respectively, most IR-based rainfall records underestimate precipitation in mountainous regions since orography-induced rainfall may not reach the CCD thresholds (Dinku et al., 2011). Satellite rainfall estimates tend to be too heavy over areas where rainfall is light (< 5 mm) while underestimating heavy rainfall amounts (> 20 mm) in both mountainous and lowland areas (Gebremichael et al., 2014). In this regard, there are inherent weaknesses related to satellite-based precipitation estimates, despite the immense utility of providing supplementary information in regions without in-situ observations. It is emphasized that more station data are required to improve the calibration of satellite rainfall estimates. For instance, according to Dinku et al. (2014), local calibration of TAMSAT resulted in major improvements, unlike in the current case, where RFEs comparison with station data indicated poor performance of TAMSAT.
Although a huge disparity between gauge and WRF was noted for the magnitude of extreme rainfall, the number of extreme rainfall events, together with the number of dry days, was well simulated for all sampled stations. This indicates that most biases are related to the magnitudes rather than the variability of the rainfall events for the case study, which is consistent with the study by Nicholson (2017), who reported that the number of rainfall days is highly correlated with the rainfall totals at seasonal timescales. However, this is not true over Lake Victoria, as WD02 had more dry days compared with WD01, which resulted in higher dry biases. In a customization study considering several physics and parameterization options, it was noted that WRF suffered from the underestimation of rainfall over Lake Victoria (Argent et al., 2015), which was evident in the current study especially from Week 2 to Week 4. Lake Victoria is a key region for intense MCS that pose an interminable threat to navigation and fishing industries (Woodhams et al., 2019; Nicholson et al., 2021). Therefore, further study is required to improve the model outputs over this important ecosystem. Over East Africa, pronounced rainfall biases in WRF have been noted when sudden changes in synoptic conditions occurred (Opijah et al., 2014). For the current case study, there was a strong MJO during Week 2, while tropical storm Fakir was active during Weeks 3 and 4. Correspondingly, the biases are more pronounced over these periods, especially over the highlands around 37 °E longitude, indicating that further improvements are necessary.
In the current study, the coarse resolution domain and reference datasets (ARC2, CHIRPS, and TAMSAT) all had consensus depicting less than 10 dry days over the lake, while WD02 had more than 14 dry days. It is also understood that increased resolution does not necessarily result in improved simulation of rainfall over the LVB, since higher resolution domains, being computer-intensive, tend to have limited spatial extent, thus unable to effectively represent the synoptic conditions (Opio et al., 2020). In addition, we suggest that relatively coarse-resolution gridded datasets are not optimum for the verification of model outputs at scales generated in the current study. High-density station records, together with field campaigns (Munday et al., 2022), are critical inputs to facilitate the development of accurate high-resolution forecasting systems. Despite the rainfall biases, the diurnal cycle of low-level wind was best simulated by WD02. We note that the level of detail, hence utility, depends on the resolution of the model, which could have far-reaching consequences for operational forecasts. For instance, over Kisumu, WD01 presents calm conditions at 2 UTC, while WD02 indicates the presence of wind shears, which is a hazard for the aviation sector.
The 600 m elevation is the location where terrain constriction of winds leading to the formation of the Turkana Jet occurs (Kinuthia and Asnani, 1982). In the current results, both coarse and high resolutions support this earlier finding by indicating a consensus that rainfall is inversely proportional to altitude from 500 m to 1,100 m ASL. Despite contributing to significant moisture influx into the mainland from the Indian Ocean, the Turkana Jet is largely divergent, contributing to the notable aridity in eastern and northern Kenya (Indeje et al., 2001; Nicholson, 2016; Munday et al., 2022; Oscar et al., 2022). In contrast, the highlands had more rainfall events and higher maximum daily rainfall intensity compared with the surrounding, possibly due to additional orographic lifting enhancing convection (Kirshbaum et al., 2018). Herein, we note that CHIRPS, TAMSAT, and WD01 did not capture any extreme rainfall event for regions below the 600 m elevation. This shows that the influence of large mountains is reasonably resolved in simulations and datasets in the range of 5 to 12 km grids. WD01 further affirms the presence of the highest number of dry days over eastern and northern Kenya for regions constrained below the 600 m elevation. It therefore implies that only high-resolution models can detect extreme rainfall over the lowlands, as in the current case where WD02 detected approximately 2 days of rainfall above 50 mm. However, for elevations beyond 3,500 m ASL, precipitation is inversely related to altitude (Oettli and Camberlin, 2005), and this pattern could only be resolved by high-resolution models as indicated by WD02.
This study generated a benchmark sub-seasonal case study to showcase the potential added value of the adoption of convection-permitting WRF for operational forecasts over East Africa. Though coarse domains could only detect extreme rainfall events over highlands, our high-resolution setup overcame this bias. In addition, both the sub-seasonal variability of rainfall, though with some bias in magnitudes, was best simulated by the convection-permitting WRF setup, as well as the diurnal cycle of wind at two sampled airport stations. High-resolution WRF also showed the capability of resolving the contrasting profile of rainfall with elevation. Topography-sensitive bias correction techniques (Velasquez et al., 2020) and investment in computing resources, observation networks, and research toward the adoption of convection-permitting models would be beneficial for early warning applications related to extreme rainfall in East Africa.
Data availability statement
The data supporting the conclusions of this article will be made available by the corresponding author upon reasonable request.
Author contributions
AM: Conceptualization, Formal analysis, Methodology, Visualization, Writing – original draft, Writing – review & editing. JM: Conceptualization, Supervision, Writing – review & editing. FO: Conceptualization, Supervision, Writing – review & editing. FM: Conceptualization, Supervision, Writing – review & editing. ZA: Funding acquisition, Writing – review & editing. GA: Funding acquisition, Writing – review & editing.
Funding
The author(s) declare financial support was received for the research, authorship, and/or publication of this article. The research tasks were supported by UK Research and Innovation as part of the Global Challenges Research Fund, grant number NE/P021077/1. The IGAD Climate Prediction and Applications Centre through the Intra-ACP Climate Services and Related Applications (ClimSA) project (grant number ACP/FED/038-833) catered for publishing charges.
Acknowledgments
This study was undertaken as part of the lead author’s PhD research at the Department of Earth and Climate Sciences, University of Nairobi, Kenya. All WRF simulations were conducted using the LENGAU cluster courtesy of the Centre for High-Performance Computing (CHPC) of the National Integrated Cyber Infrastructure System (NICIS), South Africa under the ERTH133 research group. This is greatly appreciated. The authors also acknowledge the Kenya Education Network (KENET) for facilitating access to the CHPC computing resources.
Conflict of interest
The authors declare that the research was conducted in the absence of any commercial or financial relationships that could be construed as a potential conflict of interest.
Publisher’s note
All claims expressed in this article are solely those of the authors and do not necessarily represent those of their affiliated organizations, or those of the publisher, the editors and the reviewers. Any product that may be evaluated in this article, or claim that may be made by its manufacturer, is not guaranteed or endorsed by the publisher.
Supplementary material
The Supplementary material for this article can be found online at: https://www.frontiersin.org/articles/10.3389/fclim.2024.1311088/full#supplementary-material
References
Ageet, S., Fink, A. H., Maranan, M., Diem, J. E., Hartter, J., Ssali, A. L., et al. (2022). Validation of satellite rainfall estimates over equatorial East Africa. J. Hydrometeorol. 23, 129–151. doi: 10.1175/JHM-D-21-0145.1
Allen, M. R., Kettleborough, J. A., and Stainforth, D. A. (2002). “Model error in weather and climate forecasting,” in ECMWF predictability of weather and climate seminar (European Centre for Medium Range Weather Forecasts, 2022). 279–304. Available at: http://www.ecmwf.int/publications/library/do/references/list/209.
Argent, R., Sun, X., Semazzi, F., Xie, L., and Liu, B. (2015). The development of a customization framework for the WRF model over the Lake Victoria basin, Eastern Africa on seasonal timescales. Adv. Meteorol. 2015, 1–15. doi: 10.1155/2015/653473
Ayugi, B., Tan, G., Ruoyun, N., Babaousmail, H., Ojara, M., Wido, H., et al. (2020). Quantile mapping bias correction on rossby Centre regional climate models for precipitation analysis over Kenya, East Africa. Water 12:801. doi: 10.3390/w12030801
Basist, A., Bell, G. D., and Meentemeyer, V. (1994). Statistical relationships between topography and precipitation patterns. J. Clim. 7, 1305–1315. doi: 10.1175/1520-0442(1994)007<1305:SRBTAP>2.0.CO;2
Camberlin, P., and Okoola, R. E. (2003). The onset and cessation of the “long rains” in eastern Africa and their interannual variability. Theor. Appl. Climatol. 75, 43–54. doi: 10.1007/s00704-002-0721-5
Cardell, M. F., Romero, R., Amengual, A., Homar, V., and Ramis, C. (2019). A quantile–quantile adjustment of the EURO-CORDEX projections for temperatures and precipitation. Int. J. Climatol. 39, 2901–2918. doi: 10.1002/joc.5991
Castorrini, A., Gentile, S., Geraldi, E., and Bonfiglioli, A. (2021). Increasing spatial resolution of wind resource prediction using NWP and RANS simulation. J. Wind Eng. Ind. Aerodyn. 210:104499. doi: 10.1016/j.jweia.2020.104499
Chen, F., and Dudhia, J. (2001). Coupling an advanced land surface–hydrology model with the Penn State–NCAR MM5 modeling system. Part I: model implementation and sensitivity. Mon. Weather Rev. 129, 569–585. doi: 10.1175/1520-0493(2001)129<0569:CAALSH>2.0.CO;2
Choi, Y. W., Campbell, D. J., and Eltahir, E. A. (2023). Near-term regional climate change in East Africa. Clim. Dyn. 61, 961–978. doi: 10.1007/s00382-022-06591-9
Colle, B. A., Smith, R. B., and Wesley, D. A. (2013). “Theory, observations, and predictions of orographic precipitation,” in Mountain weather research and forecasting. Springer Atmospheric Sciences. eds. F. Chow, S. De Wekker, and B. Snyder (Dordrecht: Springer).
Danielson, J. J., and Gesch, D. B. (2011). Global multi-resolution terrain elevation data 2010 (GMTED2010) (No. 2011-1073). US Geological Survey.
Dinku, T., Ceccato, P., and Connor, S. J. (2011). Challenges of satellite rainfall estimation over mountainous and arid parts of East Africa. Int. J. Remote Sens. 32, 5965–5979. doi: 10.1080/01431161.2010.499381
Dinku, T., Ceccato, P., Grover-Kopec, E., Lemma, M., Connor, S. J., and Ropelewski, C. F. (2007). Validation of satellite rainfall products over East Africa's complex topography. Int. J. Remote Sens. 28, 1503–1526. doi: 10.1080/01431160600954688
Dinku, T., Hailemariam, K., Maidment, R., Tarnavsky, E., and Connor, S. (2014). Combined use of satellite estimates and rain gauge observations to generate high-quality historical rainfall time series over Ethiopia. Int. J. Climatol. 34, 2489–2504. doi: 10.1002/joc.3855
Finney, D. L., Marsham, J. H., Walker, D. P., Birch, C. E., Woodhams, B. J., Jackson, L. S., et al. (2020). The effect of westerlies on east African rainfall and the associated role of tropical cyclones and the madden–Julian oscillation. Q. J. R. Meteorol. Soc. 146, 647–664. doi: 10.1002/qj.3698
Friedl, M. A., Sulla-Menashe, D., Tan, B., Schneider, A., Ramankutty, N., Sibley, A., et al. (2010). MODIS collection 5 global land cover: algorithm refinements and characterization of new datasets. Remote Sens. Environ. 114, 168–182. doi: 10.1016/j.rse.2009.08.016
Funk, C., Peterson, P., Landsfeld, M., Pedreros, D., Verdin, J., Shukla, S., et al. (2015). The climate hazards infrared precipitation with stations—a new environmental record for monitoring extremes. Sci Data 2, 1–21. doi: 10.1038/sdata.2015.66
Gebremichael, M., Bitew, M. M., Hirpa, F. A., and Tesfay, G. N. (2014). Accuracy of satellite rainfall estimates in the Blue Nile Basin: lowland plain versus highland mountain. Water Resour. Res. 50, 8775–8790. doi: 10.1002/2013WR014500
Gill, D., Michalakes, J., Dudhia, J., Skamarock, W., and Gopalakrishnan, S. G. (2004). “Nesting in WRF 2.0,” in WRF/MM5 joint workshop. Boulder, 22–25.
Göbel, M., Serafin, S., and Rotach, M. W. (2023). Adverse impact of terrain steepness on thermally-driven initiation of orographic convection. EGUsphere 4, 725–745. doi: 10.5194/wcd-4-725-2023
Gudoshava, M., Otieno, G., Koech, E., Misiani, H., Ongoma, J. G., Heinrich-Mertsching, C., et al. (2024). Advances, gaps and way forward in provision of climate services over the greater horn of Africa. Front. Climate 6:1307535. doi: 10.3389/fclim.2024.1307535
Hanley, K. E., Pirret, J. S., Bain, C. L., Hartley, A. J., Lean, H. W., Webster, S., et al. (2021). Assessment of convection-permitting versions of the unified model over the Lake Victoria basin region. Q. J. R. Meteorol. Soc. 147, 1642–1660. doi: 10.1002/qj.3988
Hersbach, H., Bell, B., Berrisford, P., Hirahara, S., Horányi, A., Muñoz-Sabater, J., et al. (2020). The ERA5 global reanalysis. Q. J. R. Meteorol. Soc. 146, 1999–2049. doi: 10.1002/qj.3803
Hong, S. Y., and Lim, J. O. J. (2006). The WRF single-moment 6-class microphysics scheme (WSM6). Asia-Pac. J. Atmos. Sci. 42, 129–151.
Hong, S. Y., Noh, Y., and Dudhia, J. (2006). A new vertical diffusion package with an explicit treatment of entrainment processes. Mon. Weather Rev. 134, 2318–2341. doi: 10.1175/MWR3199.1
Hsu, K. L., Gao, X., Sorooshian, S., and Gupta, H. V. (1997). Precipitation estimation from remotely sensed information using artificial neural networks. J. Appl. Meteorol. Climatol. 36, 1176–1190. doi: 10.1175/1520-0450(1997)036<1176:PEFRSI>2.0.CO;2
Iacono, M. J., Delamere, J. S., Mlawer, E. J., Shephard, M. W., Clough, S. A., and Collins, W. D. (2008). Radiative forcing by long-lived greenhouse gases: calculations with the AER radiative transfer models. J. Geophys. Res. Atmos. 113, 1–8. doi: 10.1029/2008JD009944
Indeje, M., Semazzi, F. H., Xie, L., and Ogallo, L. J. (2001). Mechanistic model simulations of the east African climate using NCAR regional climate model: influence of large-scale orography on the Turkana low-level jet. J. Clim. 14, 2710–2724. doi: 10.1175/1520-0442(2001)014<2710:MMSOTE>2.0.CO;2
Kebacho, L. L. (2022). The role of tropical cyclones Idai and Kenneth in modulating rainfall performance of 2019 long rains over East Africa. Pure Appl. Geophys. 179, 1387–1401. doi: 10.1007/s00024-022-02993-2
Kilavi, M., MacLeod, D., Ambani, M., Robbins, J., Dankers, R., Graham, R., et al. (2018). Extreme rainfall and flooding over Central Kenya including Nairobi city during the long-rains season 2018: causes, predictability, and potential for early warning and actions. Atmos. 9:472. doi: 10.3390/atmos9120472
King, J. A., Engelstaedter, S., Washington, R., and Munday, C. (2021). Variability of the Turkana low-level jet in reanalysis and models: implications for rainfall. J. Geophys. Res. Atmos. 126:e2020JD034154. doi: 10.1029/2020JD034154
Kinuthia, J. H., and Asnani, G. C. (1982). A newly found jet in North Kenya (Turkana Channel). Mon. Weather Rev. 110, 1722–1728. doi: 10.1175/1520-0493(1982)110<1722:ANFJIN>2.0.CO;2
Kirshbaum, D. J., Adler, B., Kalthoff, N., Barthlott, C., and Serafin, S. (2018). Moist orographic convection: physical mechanisms and links to surface-exchange processes. Atmos. 9:80. doi: 10.3390/atmos9030080
Li, Y., Lu, G., Wu, Z., He, H., Shi, J., Ma, Y., et al. (2016). Evaluation of optimized WRF precipitation forecast over a complex topography region during flood season. Atmos. 7:145. doi: 10.3390/atmos7110145
MacLeod, D. A., Dankers, R., Graham, R., Guigma, K., Jenkins, L., Todd, M. C., et al. (2021). Drivers and subseasonal predictability of heavy rainfall in equatorial East Africa and relationship with flood risk. J. Hydrometeorol. 22, 887–903. doi: 10.1175/JHM-D-20-0211.1
Maidment, R., Black, E., and Young, M. (2017). TAMSAT daily rainfall estimates Version 3.0. Reading, UK: University of Reading Dataset.
Moya-Álvarez, A. S., Martínez-Castro, D., Kumar, S., Estevan, R., and Silva, Y. (2019). Response of the WRF model to different resolutions in the rainfall forecast over the complex Peruvian orography. Theor. Appl. Climatol. 137, 2993–3007. doi: 10.1007/s00704-019-02782-3
Muita, R., Gikungu, D., Aura, S., Njogu, A., Ndichu, R., Nyinguro, P., et al. (2021). Assessment of rising water levels of Rift Valley lakes in Kenya: the role of meteorological factors. Environ. Sci. Ecol. Curr. Res. 2, 1–1039. doi: 10.54026/ESECR/1035
Mukabana, J. R., and Piekle, R. A. (1996). Investigating the influence of synoptic-scale monsoonal winds and mesoscale circulations on diurnal weather patterns over Kenya using a mesoscale numerical model. Mon. Weather Rev. 124, 224–244. doi: 10.1175/1520-0493(1996)124<0224:ITIOSS>2.0.CO;2
Munday, C., Engelstaedter, S., Ouma, G., Ogutu, G., Olago, D., Ongech, D., et al. (2022). Observations of the Turkana jet and the east African dry tropics: the RIFTJet field campaign. Bull. Am. Meteorol. Soc. 103, E1828–E1842. doi: 10.1175/BAMS-D-21-0214.1
Nicholson, S. (2016). The Turkana low-level jet: mean climatology and association with regional aridity. Int. J. Climatol. 36, 2598–2614. doi: 10.1002/joc.4515
Nicholson, S. E. (2017). Climate and climatic variability of rainfall over eastern Africa. Rev. Geophys. 55, 590–635. doi: 10.1002/2016RG000544
Nicholson, S. E., Hartman, A. T., and Klotter, D. A. (2021). On the diurnal cycle of rainfall and convection over Lake Victoria and its catchment. Part I: rainfall and mesoscale convective systems. J. Hydrometeorol. 22, 3037–3047. doi: 10.1175/JHM-D-21-0085.1
Novella, N. S., and Thiaw, W. M. (2013). African rainfall climatology version 2 for famine early warning systems. J. Appl. Meteorol. Climatol. 52, 588–606. doi: 10.1175/JAMC-D-11-0238.1
Ntwali, D., Ogwang, B., and Ongoma, V. (2016). The impacts of topography on spatial and temporal rainfall distribution over Rwanda based on WRF model. Atmospheric Climate Sci. 6, 145–157. doi: 10.4236/acs.2016.62013
Oettli, P., and Camberlin, P. (2005). Influence of topography on monthly rainfall distribution over East Africa. Clim. Res. 28, 199–212. doi: 10.3354/cr028199
Ongoma, V., Chen, H., Gao, C., Nyongesa, A. M., and Polong, F. (2018). Future changes in climate extremes over equatorial East Africa based on CMIP5 multimodel ensemble. Nat. Hazards 90, 901–920. doi: 10.1007/s11069-017-3079-9
Opijah, F. J., Mutemi, J. N., and Ogallo, L. A. (2014). Application of the EMS-WRF model in dekadal rainfall prediction over the GHA region. Afr. J. Physic. Sci. 1, 2313–3317.
Opio, R., Sabiiti, G., Nimusiima, A., Mugume, I., and Sansa-Otim, J. (2020). WRF simulations of extreme rainfall over Uganda’s Lake Victoria Basin: sensitivity to parameterization, model resolution and domain size. J. Geosci. Environ. Protect. 8, 18–31. doi: 10.4236/gep.2020.84002
Oscar, L., Nzau, M. J., Ellen, D., Franklin, O., Rachel, J., Richard, W., et al. (2022). Characteristics of the Turkana low-level jet stream and the associated rainfall in CMIP6 models. Clim. Dyn. 11, 1–17. doi: 10.1007/s00382-022-06499-4
Owiti, Z., and Zhu, W. (2012). Spatial distribution of rainfall seasonality over East Africa. J. Geography Regional Plann. 5, 409–421. doi: 10.5897/JGRP12.027
Rummukainen, M. (2016). Added value in regional climate modeling. Wiley Interdiscip. Rev. Clim. Chang. 7, 145–159. doi: 10.1002/wcc.378
Skamarock, W. C., Klemp, J. B., Dudhia, J., Gill, D. O., Liu, Z., Berner, J., et al. (2019). A description of the advanced research WRF model version 4. Boulder, CO, USA: National Center for Atmospheric Research, 1–96.
Stratton, R. A., Senior, C. A., Vosper, S. B., Folwell, S. S., Boutle, I. A., Earnshaw, P. D., et al. (2018). A Pan-African convection-permitting regional climate simulation with the met office unified model: CP4-Africa. J. Clim. 31, 3485–3508. doi: 10.1175/JCLI-D-17-0503.1
Sun, W., Ma, J., Yang, G., and Li, W. (2018). Statistical and hydrological evaluations of multi-satellite precipitation products over Fujiang river basin in humid southeast China. Remote Sens. 10:1898. doi: 10.3390/rs10121898
Velasquez, P., Messmer, M., and Raible, C. C. (2020). A new bias-correction method for precipitation over complex terrain suitable for different climate states: a case study using WRF (version 3.8.1). Geosci. Model Dev. 13, 5007–5027. doi: 10.5194/gmd-13-5007-2020
Wainwright, C. M., Finney, D. L., Kilavi, M., Black, E., and Marsham, J. H. (2021). Extreme rainfall in East Africa, October 2019–January 2020 and context under future climate change. Weather 76, 26–31. doi: 10.1002/wea.3824
Wanishsakpong, W., and Notodiputro, K. A. (2018). Locally weighted scatter-plot smoothing for analysing temperature changes and patterns in a ustralia. Meteorol. Appl. 25, 357–364. doi: 10.1002/met.1702
Woodhams, B. J., Birch, C. E., Marsham, J. H., Lane, T. P., Bain, C. L., and Webster, S. (2019). Identifying key controls on storm formation over the Lake Victoria basin. Mon. Weather Rev. 147, 3365–3390. doi: 10.1175/MWR-D-19-0069.1
Young, M. P., Williams, C. J., Chiu, J. C., Maidment, R. I., and Chen, S. H. (2014). Investigation of discrepancies in satellite rainfall estimates over Ethiopia. J. Hydrometeorol. 15, 2347–2369. doi: 10.1175/JHM-D-13-0111.1
Keywords: topography, mesoscale systems, rainfall, East Africa, WRF
Citation: Mwanthi AM, Mutemi JN, Opijah FJ, Mutua FM, Atheru Z and Artan G (2024) Implications of WRF model resolutions on resolving rainfall variability with topography over East Africa. Front. Clim. 6:1311088. doi: 10.3389/fclim.2024.1311088
Edited by:
Victor Ongoma, Mohammed VI Polytechnic University, MoroccoReviewed by:
Philip Sagero, University of the South Pacific, FijiKenny T. C. Lim Kam Sian, Wuxi University, China
Copyright © 2024 Mwanthi, Mutemi, Opijah, Mutua, Atheru and Artan. This is an open-access article distributed under the terms of the Creative Commons Attribution License (CC BY). The use, distribution or reproduction in other forums is permitted, provided the original author(s) and the copyright owner(s) are credited and that the original publication in this journal is cited, in accordance with accepted academic practice. No use, distribution or reproduction is permitted which does not comply with these terms.
*Correspondence: Anthony M. Mwanthi, mmwanthi@gmail.com