On the quantitative limits for triggering drought anticipatory actions in Mindanao, the Philippines
 Piotr Wolski1*
  Olivier Crespo1
  Mark Tadross1,2
  Fidelity Z. Khumalo1
  Tamika Du-Pont1,3 Damien Riquet4
  Catherine Jones4
- 1Climate System Analysis Group, Environmental and Geographical Science Department, University of Cape Town, Cape Town, South Africa
- 2Climate Change Adaptation, Nature Climate and Energy, Bureau for Policy and Programme Support, United Nations Development Programme, New York, NY, United States
- 3African Climate and Development Initiative, University of Cape Town, Cape Town, South Africa
- 4FAO Regional Office for Asia and the Pacific, Bangkok, Thailand
Anticipatory Action (AA), which involves timely and informed actions ahead of a crisis/impact, is increasingly being used/promoted as a way to mitigate the impacts of extreme climatic hazards, including droughts. Actions are initiated in anticipation of the occurrence of the hazard and its impacts, and depend on the lead time, likelihood of impact, as well as the effectiveness of, and the capacity to undertake such actions. A decision to initiate actions is taken with a support of the so-called trigger model that forecasts likelihood or magnitude of expected impact. To build efficient and credible AA trigger models, quantitative assessments of relationships between observed climate and environmental conditions, weather/seasonal forecasts, and variables expressing current sectoral and societal vulnerability (collectively referred to as indicators) and expected impacts, are required at varied lead times. These quantitative assessments are needed to: (a) avoid over-weighting (placing excessive trust in) non-skillful indicators; (b) avoid using several co-varying and correlated indicators (over-emphasising their collective importance for the decision at hand); and (c) provide objective and defensible evidence for and consequently confidence in the AA trigger model. Motivated by the need to improve the current AA trigger model used for agricultural drought by FAO in Mindanao, a region of the Philippines which experiences periodic drought-related food insecurity, this study evaluates a range of climate and environmental indicators as a basis for developing a quantitative, objective trigger model. The analyses focus on: (i) an evaluation of efficacy of using a climate-only drought hazard index as an expression of impactful drought in the region, and (ii) an evaluation of the predictive utility of a set of indicators and formal statistical models combining these indicators, at various lead times. We show that the predictive utility of each indicator varies by season and lead time, highlight the varying skill of the trigger model and consequently advocate for transparent inclusion of model skill in the trigger mechanism.
1 Introduction
Anticipatory Action (AA), which involves timely and informed actions ahead of a crisis/impact, is increasingly being used/promoted as a way to mitigate the impacts of extreme climatic hazards, including droughts. Actions are initiated in anticipation of the occurrence of the hazard and its impacts, and depend on the lead time, likelihood of impact, as well as the effectiveness of, and the capacity to undertake such actions. The development of effective AA involves several interlinked processes including: (i) the development of and agreement on pre-agreed actions (be it by humanitarian institutions, government structures, or individuals/communities); (ii) the financing of such actions (if needed); and (iii) agreement on a “trigger” which when reached will initiate a set of actions by different actors. A trigger model usually involves a forecast of the likelihood and magnitude of expected impacts using a formalised, quantitative, or semi-quantitative relationship between the expected impact and the observed climate and environmental conditions, weather/seasonal forecasts, as well as variables expressing current sectoral and societal vulnerabilities (collectively referred to as indicators). Actions are initiated when the likelihood of impact, as forecasted by the trigger model, exceeds a predetermined and agreed (trigger) threshold. Importantly, different actions are required at varying timescales leading to an impact, and therefore trigger models and indicators potentially vary with this lead time.
Anticipatory Action methodologies are being developed by a number of organisations (e.g., FAO, Red Cross, WFP, Start Network) with support of research projects and universities. Since the underlying science is relatively new, the concepts and nomenclature differ between organisations and individual implementations. In particular, trigger models vary and span such diverse approaches as machine learning, multivariate regression and qualitative models based on expert judgement.
To build efficient and credible AA trigger models, the quantitative evaluation of indicator-impact relationships are required, considering their dependence on seasonality, lead time, spatial scale of the impact, as well as confidence in the information collectively provided by the indicators, which is dependent on indicator co-variability and uncertainty. These quantitative assessments are needed to optimise, and perhaps more importantly, to articulate the predictive skill of a trigger model, as well as to provide objective and defensible evidence for and consequently confidence in the AA trigger model.
In 2020, an expert judgement-type trigger model was developed by FAO targeting agricultural drought in Mindanao, a region of the Philippines experiencing periodic drought-related food insecurity (FAO, 2020; Riquet, pers. comm., 2023). Motivated by the need to understand the confidence in and improve this model, the objective of this study is to evaluate a range of climate and environmental indicators and forecasts as a basis for developing a quantitative, objective data-informed trigger model. The analyses focus on: (i) an evaluation of the efficacy of using a climate-only drought hazard index as an expression of impactful drought in the region, and (ii) an evaluation of the predictive utility of a set of indicators and formal statistical models combining these indicators, at various lead times and seasons. The results allow for identification of critical challenges in the formulation of a trigger model for agricultural drought in Mindanao, but also highlight general recommendations which need to be considered when developing trigger models in the future.
1.1 Anticipatory action
Given the potential increased frequency and intensity of climate hazards under future climates and the high costs of responding to their impacts ex-post, preparing ahead of a forecasted hazard (ex-ante) to reduce its impact and its associated costs, can be beneficial from both a humanitarian and financial perspective. The latter approach embodies the principle of AA and bridges the gap between knowing when an impact is likely and reacting to an impact (traditional humanitarian response). Through AA and preparedness activities which reduce vulnerability to the hazard, the expected impacts (and hence resulting damages and losses) can be alleviated (IFRC, 2022). While forecasting the magnitude of a hazard/event and its associated impacts is an important part of AA, the value of AA lies in preparing populations, communities and businesses ahead of the hazard event, thereby lessening the impact through protecting or moving populations/assets and/or strengthening their capacity to cope with the event (FAO and WFP, 2023). Such preparations for an anticipated event may involve activities which, even if a hazard does not materialise, increase the resilience of the population and reduce the impact they suffer from future climate hazards.
The development of AA frameworks and approaches involves interconnected components (OCHA, 2023) and the approach often depends on several factors, including: (i) the beneficiary of the actions (and their acceptance); (ii) the people/organisations undertaking the actions (and their agreement on the the most appropriate actions); (iii) the intended purpose of the action (and whether it is likely effective); (iv) the required resources (and whether their use justifies the likely level of reduced impact). For the purpose and focus of this paper, FAO highlights 5 key ingredients of Anticipatory Action (FAO, 2021):
• Crisis timeline—understanding the timing of past occurrences of impact, and actions taken in response;
• Early warning systems—a monitoring system capable of detecting indicator thresholds leading to potential future impact and correspondingly raising an alarm;
• Anticipatory actions—actions tuning and ramping up preparation where needed, to facilitate and optimise impact-reducing preparatory actions;
• Flexible financing—supporting flexibility of anticipatory actions, particularly with climate-driven impacts which know no administrative boundary;
• Evidence—demonstrating—over the long term—the financial and socio-economic benefits and reduced human impacts.
In order to maintain clarity around the analyses reported in this study, we adopt the terminology used in the FAO Technical Standards document (FAO, 2023), distinguishing trigger mechanism (overall framework and process for the initiation of action), trigger model (a formalised relationship between predictor(s) of impact or hazard and the magnitude or likelihood of the expected impact or severity of the hazard), trigger (a score made of one or a set of indicators generated by the trigger model) and trigger threshold (a particular value of the trigger at which action is initiated). The mechanism that links these areas and actions is referred to as an AA Protocol. It serves as a standardised operating procedure for implementing the AA approach in practical terms.
1.2 Drought – in the region and in Philippines
Drought is a natural phenomenon arising due to climate variability, occasionally at any location on Earth, and it can become an impactful, destructive natural hazard when it intersects with socio-economic vulnerabilities. Since the 1900s, over two billion people have been negatively affected by drought and a further two million have died from it worldwide (van Loon, 2015). With increased anthropogenic global warming, drought occurrence and intensity are projected to increase, and impacts are anticipated to be increasingly more severe (Trenberth et al., 2014). Monitoring, forecasting and dissemination of drought is routinely performed up to several months in advance. Increasingly, however, forecasting is extended to include drought impacts rather than just the drought hazard (Sutanto et al., 2019).
Drought in the Southeast Asia is driven by processes linking variation of the monsoon season, and off-season rainfall to phenomena such as ENSO (El Niño Southern Oscillation) and IOD (Indian Ocean Dipole) at the year-to-year time scale, and PDO (Pacific Decadal Oscillation) at the decadal time scale (UNESCAP, 2021). During recent El Niño years—2015/2016, as well as 2018–2020, Southeast Asia experienced the most severe droughts in decades, affecting over 70 percent of its land area. During the peak periods, more than 325 million people faced moderate drought conditions, with over 210 million enduring severe drought conditions (UNESCAP, 2021).
Drought impacts in the Philippines are considerable: the 2009–2010 moderate El Niño event led to drought damages amounting to around USD 240 million, while the drought damages caused by a very strong El Niño event in 2015–2016 nearly reached USD 90 million as of February 2016 (Perez et al., 2016). During the 2019 El Niño related drought, agricultural production reduced by 20% across the Philippines (Perez et al., 2022). Studies of drivers of drought are rare, but Perez et al. (2016) developed a statistical drought forecast model utilising ONI (Oceanic Niño Index) and observed rainfall anomalies, while a number of studies address drought monitoring using using standard SPI and SPEI (Perez et al., 2016, 2022; Salvacion, 2022), and bespoke multi-variate drought indices (Valete et al., 2022).
1.3 Current drought AA trigger mechanism in the Mindanao
The first edition of the FAO Drought AA protocol in the Philippines focussed on Mindanao (FAO, 2020; Riquet, pers. comm., 2023), a drought prone agricultural region in the south with a highly vulnerable population due to high poverty levels, but which is also commonly referred to as the breadbasket of the Philippines. In that protocol, three key monitoring periods were identified, oriented towards the primary rain-fed growing season of the main crop—rice:
• Monitoring period 1: before the beginning of the rainy season (April/May).
• Monitoring period 2: in the middle of the rainy season (July/August).
• Monitoring period 3: at the end of the rainy season (October/November).
A wide set of indicators were used, including ten from hydrometeorological forecasts (rainfall, temperature and El Niño–Southern Oscillation (ENSO)/Indian Ocean Dipole (IOD) from IRI1, PAGASA2, BOM3 and WMO4) and four from seasonal observations of rainfall, soil moisture and vegetation (from PAGASA and GIEWS5). Several of these indicators, whilst from different sources, are the same variable (e.g., 3 month rainfall forecasts from PAGASA, IRI and WMO). In the model, each indicator is given a value between 0 and 3 depending on how far they deviate from normal/average or, in the case of ENSO, whether it is in an alert/declared phase. These values are then weighted by a variable-specific weight (e.g., 3 for rainfall, 1 for air temperature forecast) added and converted to a percentage value (with 100% indicating maximum possible value of the trigger, where all variables indicate a high likelihood of drought), which is used to decide whether to trigger actions associated with continued monitoring (0–32%), assessments (33–50%), or action (>50%).
The model does not allow for regional differences in rainfall and thus seasonal cropping patterns, drought climatologies and associated impacts. Additionally, it uses the same weights during each monitoring period, and therefore does not allow for the potential seasonally changing role of each indicator in predicting drought. Importantly, the Mindanao AA trigger mechanism and triggers are based on monitoring and hydrometeorological forecasts of biophysical variables only, and whilst these remain a useful set of indicators of drought hazard, they do not account for situations where socio-economic vulnerabilities may make populations more susceptible/vulnerable to the impacts of drought. Whilst it is clear that operational implementation of the trigger mechanism should take place within a wider consultative process involving all stakeholders, this work is motivated by the need to ensure the trigger is based on a scientifically defensible combination of indicators, which allows for uncertainties associated with each indicator (due to forecast skill or relationship with the impact) to be known as a basis for setting and testing trigger thresholds and associated actions.
2 Approach and data
2.1 Data
We utilise a number of climate monitoring and forecast datasets, selected for evaluation using criteria of (a) regular availability at lead times relevant to the anticipatory action process, (b) in case of forecasts—availability of historical time series enabling evaluation of forecast skill. These include:
• Climate monitoring data (common overlapping period 1981–2022):
• monthly station data for Mindanao from Global Historical Climatology Network (GHCN),
• monthly gridded rainfall monitoring data products (CHIRPS 2.0 and GPCC v.2020),
• monthly ERA5 reanalysis rainfall and air temperature,
• observed indices of ENSO (Nino 3.4) and IOD.
• Forecast data:
• calibrated probabilistic seasonal rainfall forecast based on an ensemble of dynamical models generated by IRI (available for the period of 2017–2022),
• seasonal rainfall forecast from the ECMWF SEAS5.1 model, distributed through Copernicus Data Store (CDS) (available for the period of 1990–2022),
• seasonal forecast of ENSO from IRI (available for the period of 2002–2022).
• Land surface monitoring data (common overlapping period 1984–2022):
• Dekadal gridded soil moisture data derived from satellite microwave observations, developed at ESA, distributed through CDS, and
• Agricultural Stress Index (ASI) and Vegetation Health Index (VHI), obtained through FAO GIEWS system.
In addition to the above, we utilise two datasets that are proxies for agricultural impacts of drought: event-based loss and damage data for the Philippines covering the period of 2000–2022 and quarterly harvest area and production volume data at region level from Philippine Statistics Authority.6
Anticipatory Action protocols encourage the use of climate information from local meteorological agencies rather than from global sources. Here we were unable to obtain the historical rainfall data and historical seasonal rainfall forecasts in a form allowing evaluation of its skill, and had to therefore rely on generic, global datasets. While this, on the one hand, reduces the potential accuracy of our analyses, on the other hand it allows for their generalisations in other regions.
2.2 Methodology
We focus on seasonal drought, i.e., drought at the time scale of 3 months, identified with local experts as the most relevant from an agricultural perspective; consistent with the timescale of anticipated humanitarian actions; and with forecasts tending to have more skill when averaged over this timescale (as demonstrated by, e.g., Wanders and Wood, 2018) We perform analyses for all seasons, but focus on those that are important from the agricultural productivity point of view. These are identified from regionally-specific agricultural production data. We consider predictors (or indicators) at a lead time of 1 to 9 months before the last month of the 3-month target period.
The analyses include: (i) initial exploration of gridded and station data towards identification of datasets suitable for drought mapping, identification of homogeneous climate regions and evaluation of relative role of rainfall and PET in causing agricultural drought; (ii) an evaluation of the relationship between a climate-only drought hazard index and the impact of drought in the region; (iii) the predictability of the drought hazard index from a variety of indicators; and (iv) evaluation of the predictive utility of a set of formal statistical models combining a range of indicators, at various lead times.
In our analyses, we differentiate the drivers or predictors of the meteorological drought from the variables expressing antecedent conditions, or in other terms precursors of drought’s impact. The latter do not have to have a causative relationship with future drought, but rather, they might increase the susceptibility to droughts, and thus affect the magnitude of drought’s impact. These variables include soil moisture, vegetation health-and agricultural stress-indices, as well as current rainfall anomalies and drought indices. Variables considered as predictors of future drought include current ENSO and IOD indices, as well as seasonal rainfall and ENSO forecasts. These variables are linked to drought through known chain of atmospheric processes and as such have a causal rather than just correlative relationship with drought.
We derive the commonly used drought indices, the SPI (McKee et al., 1993) and SPEI (Vicente-Serrano et al., 2010), and use 1981–2010 as a base period. We consider the values of-1 or less to denote a moderate or stronger drought.
We consider Pearson’s correlation coefficient as indicative of a strength of relationships between variables and as the simplest, intuitively understood index of forecast skill.
3 Results
3.1 Initial analyses
We first conducted a set of climatological analyses to: (i) identify global gridded rainfall datasets that best replicate the main characteristics of the seasonal and interannual rainfall variability recorded by the GHCN station data, (ii) identification of homogeneous rainfall regions in Mindanao, which affect agricultural practices, and (iii) identification of the relative role of rainfall anomalies vs. PET anomalies in causing the agricultural drought.
These analyses, not reported here, are summarised as follows:
• CHIRPS 2.0 adequately captures seasonality and interannual variability of rainfall over the Mindanao region (i.e., it has better correlation with available station data of monthly climatology and annual rainfall totals than other gridded rainfall dataset), and has been chosen for further analyses (whilst this data product assimilates station data, it still has inherent biases);
• Hierarchical clustering of rainfall (standardised mean monthly rainfall in CHIRPS v.2.0 dataset) reveals strong differences in rainfall seasonality between the north-eastern part of the Mindanao and the rest of the island (central and western Mindanao), with less apparent differences in terms of interannual rainfall variability. As illustrated (Figure 1), the rainfall seasonality differences result in differences in planting and harvesting dates, and to some extent in dominant crops, and as a result, we analyse the two regions separately. The two regions coincide with the administrative divisions of the Mindanao region, which facilitates aggregation of agricultural production and drought impact information. We conduct all further analyses on region-average rainfall/temperature and do not account for more detailed spatial subdivisions.
• A comparison of temporal patterns of region-average SPI and SPEI reveal no systematic differences other than the weak (non-statistically significant) increase in intensities of SPEI-indexed drought, suggesting that rainfall anomalies are the dominant driver of drought. This is unsurprising considering that mean annual rainfall exceeds mean annual PET by a factor of 2 to 5. We therefore consider SPI an appropriate index to capture meteorological drought.
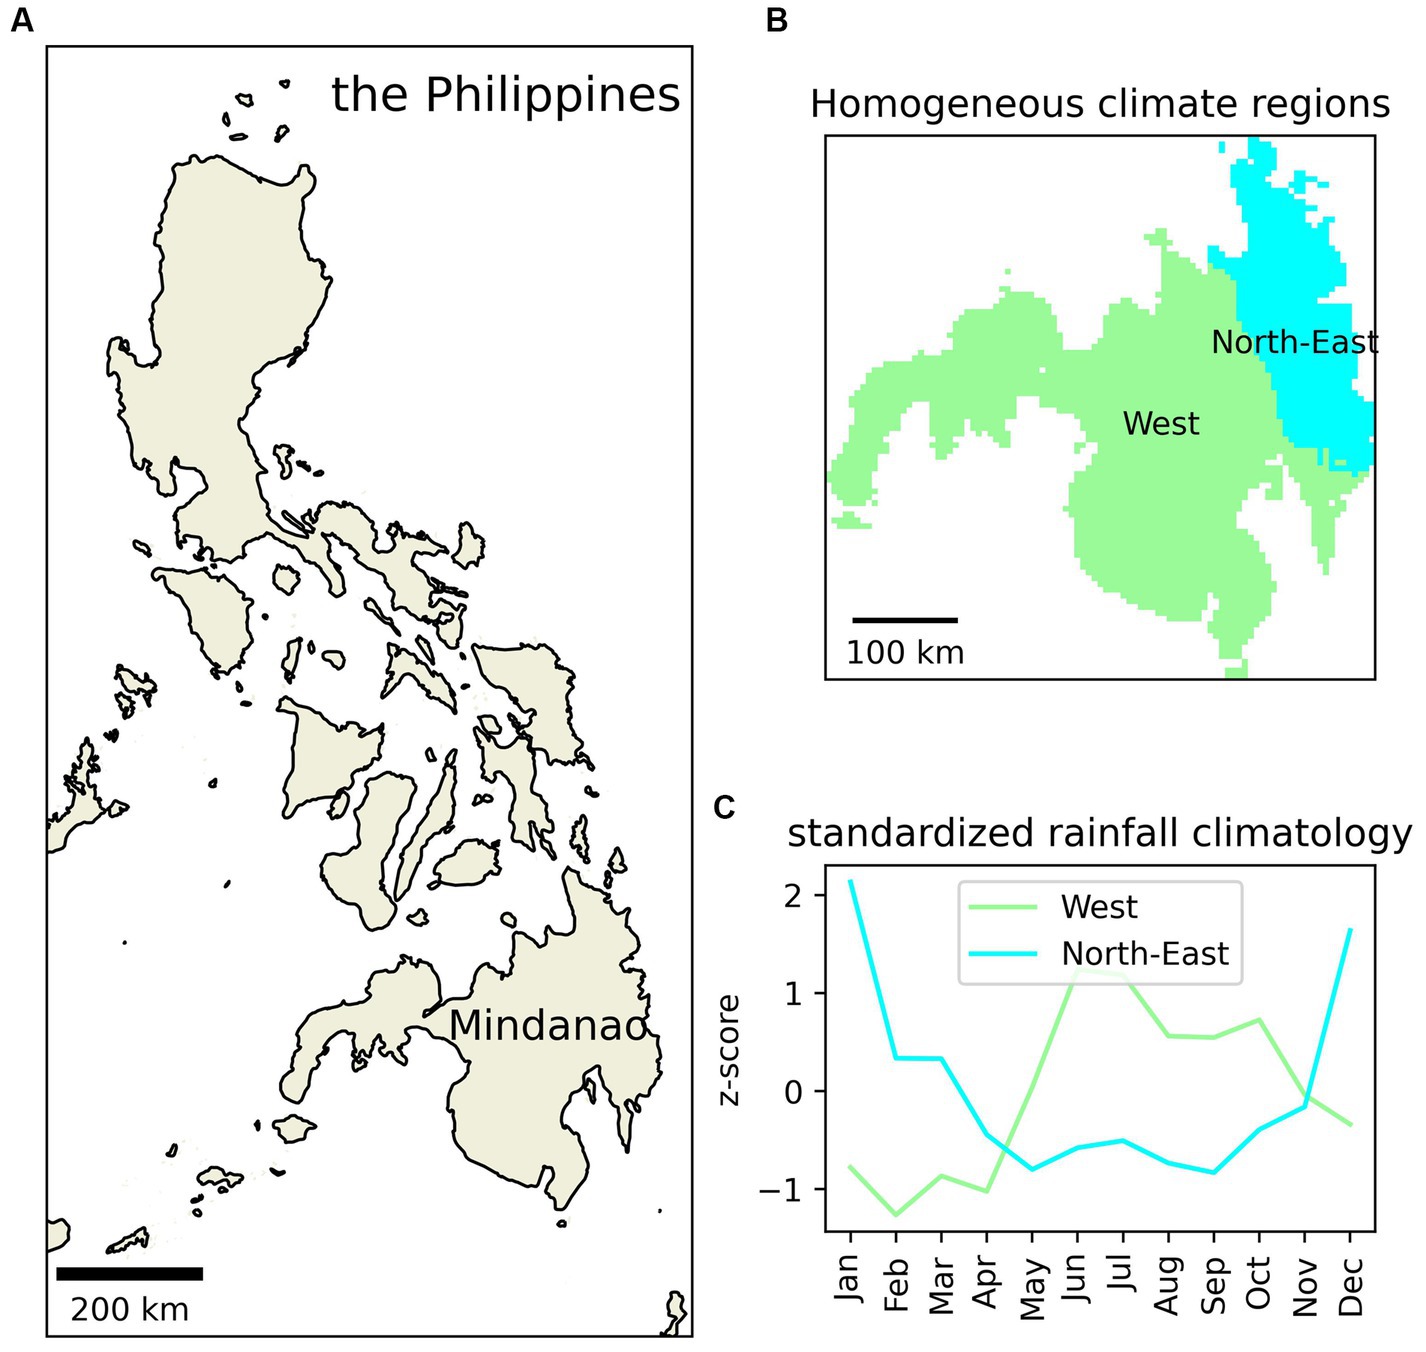
Figure 1. (A) The Mindanao region in the south of the Philippines, (B) the homogeneous rainfall zones in Mindanao, with (C) corresponding seasonal rainfall regimes.
3.2 Drought and agricultural impacts
Given regions with different rainfall seasonality and a variety of crops with different cropping patterns, including a mixture of irrigated and rain-fed crops, the sensitivity to drought varies between crops and cropping practices. Hence, we focus only on rain-fed rice, an important crop for food security, which is likely affected by drought. Figure 2 illustrates differences in cropping between the two regions, with the highest production in the North-East in the AMJ season, and in the West in the JAS-OND seasons. The relationship between the meteorological drought as indexed by SPI3 and rainfed-rice production is not clear, however. The relationship appears to be better at 3–6 month lead time, indicating the role of rainfall anomalies during the earlier growth stages rather than during the harvest period. Significant relationships manifest stronger during the off-season (JAS-OND in the North-East and JFM-AMJ in the West) which reflects the higher sensitivity of rain-fed crops in drier periods, compared to periods receiving sufficient rainfall and consequently less sensitivity to drought. The nature of the rice production-drought link is complex, and relationships also account for a variety of other, non-meteorological factors (e.g., inputs price/availability, manpower). This is apparent in the Figure 2’s panel depicting the relationship between reported drought impacts and the rice production, where the years with drought impact reports do not clearly coincide with the anomalous rice production. The relationships do not improve when either the harvested area, or yield per hectare are analysed instead of the total production (not shown). The poor relationships may, however, reflect uncertainty of the reported impacts data, as self-reporting is affected by numerous external confounding factors, societal pressures, socio-economic setting, access etc. Overall, the results suggest a constrained utility of the available production data for the development of trigger models targeting drought impact rather than the drought hazard.
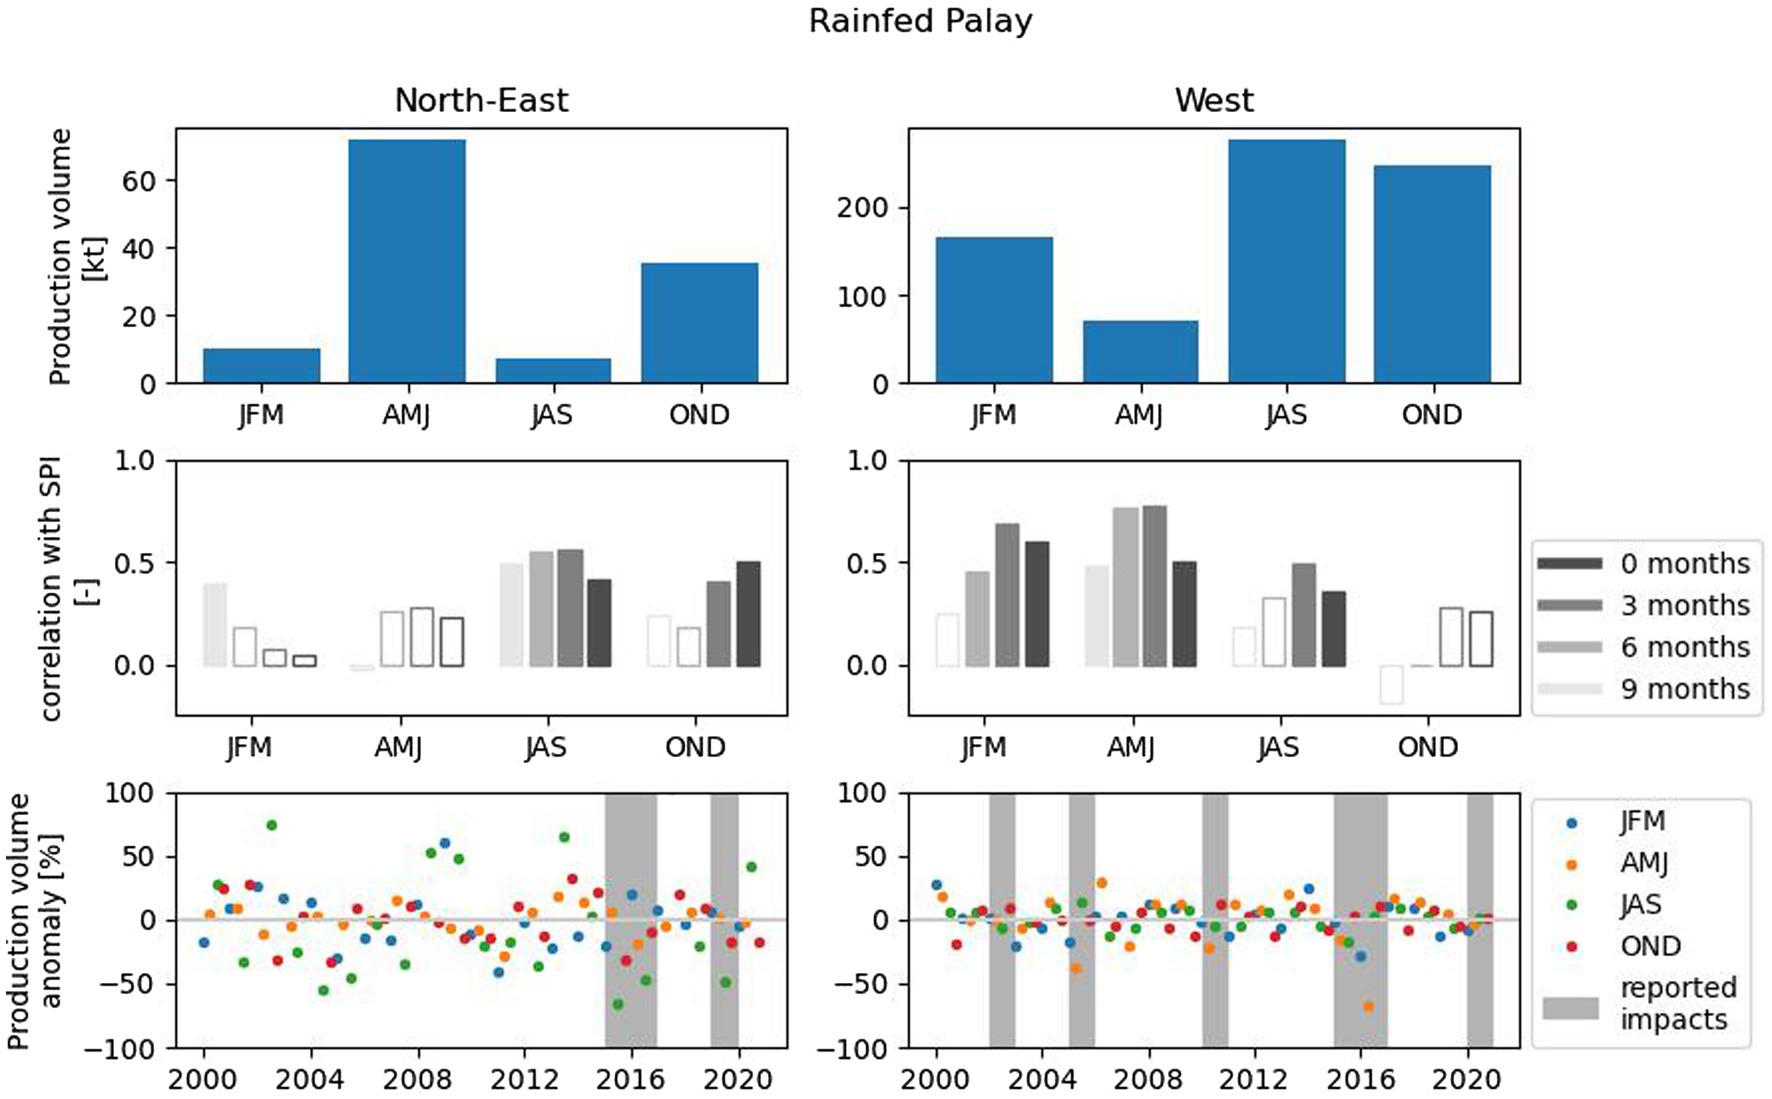
Figure 2. Evaluation of relationship between drought and agricultural impact of drought in two analysed regions for rainfed rice. Production volume by season (top row) calculated as average over 1987–2022. Correlations (middle row) calculated as a Pearson’s correlation between 3-month SPI in the last month of a quarter and that quarter’s production volume, at various lead times, over the period of 1987–2022. Filled bars indicate correlations statistically significant at p = 0.05. Anomalies of production volume (bottom row) calculated as departures from 5-year rolling mean, individually for each season, superimposed on the years with reported agricultural impacts of drought.
3.3 Antecedent conditions and agricultural impacts
Variables expressing antecedent conditions, or what we call precursors of drought impact—e.g. soil moisture or VHI—similarly to the antecedent rainfall anomalies, do not show strong relationships with rainfed rice production in the main harvest seasons (Figure 3). The relationships with ASI are, however, stronger in the western region, besides during JAS.
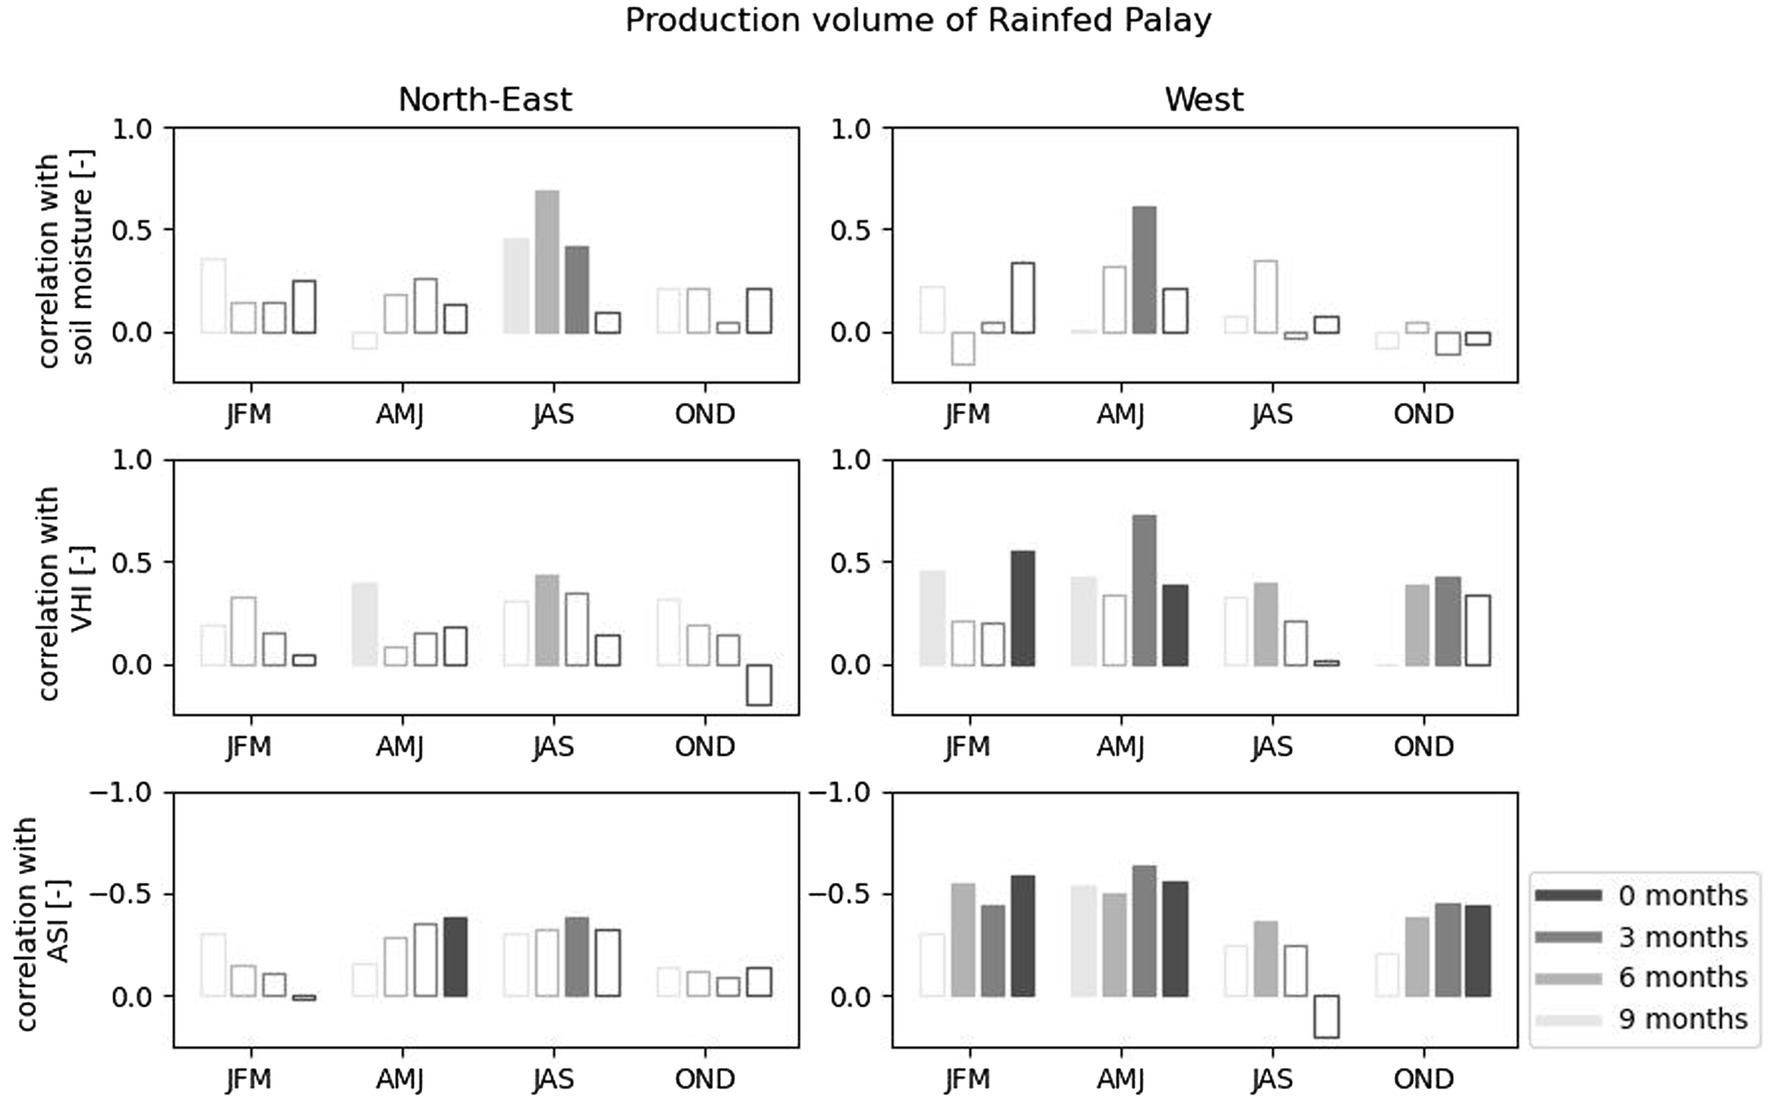
Figure 3. Correlations between rainfed rice production and precursors of drought impact—variables expressing soil moisture availability and vegetation conditions (ASI – Agricultural Stress Index and VHI—Vegetation Health Index) at various lead times. Filled bars indicate correlations statistically significant at p = 0.05.
3.4 Predicting meteorological drought
Since the retrospective seasonal forecast from PAGASA was not available for this project, we utilised forecasts from two systems: the probabilistic forecast from IRI, which is a calibrated output of an ensemble of dynamical models, and a 50-member ensemble forecast from the ECMWF SEAS5 system. The first is openly accessible but only covers the most recent period (March 2017 to November 2022). The second covers a longer period (1990–2023) but needed specific pre-processing for this work. The forecasts’ skills present strong similarities, with relatively high correlation over the year (significant below grey line) but with clear skill reduction observed at the onset of the Western region rainy season, i.e., in April, and lowest skill during the first part of that season, i.e., April–July (Figure 4). While the IRI forecast in general shows much lower level of statistical significance, which reflects the smaller size of the evaluated sample (6 years), it shows strong positive correlations for the month of May, but only negative correlations are meaningful here, as the higher probability of a dry tercile is inversely proportional to the SPI3 value. Positive correlations as those manifested for May have no physical justification and should not be interpreted as expression of skill of the forecast. The ECMWF forecast however maintains mostly significant skill throughout the year.
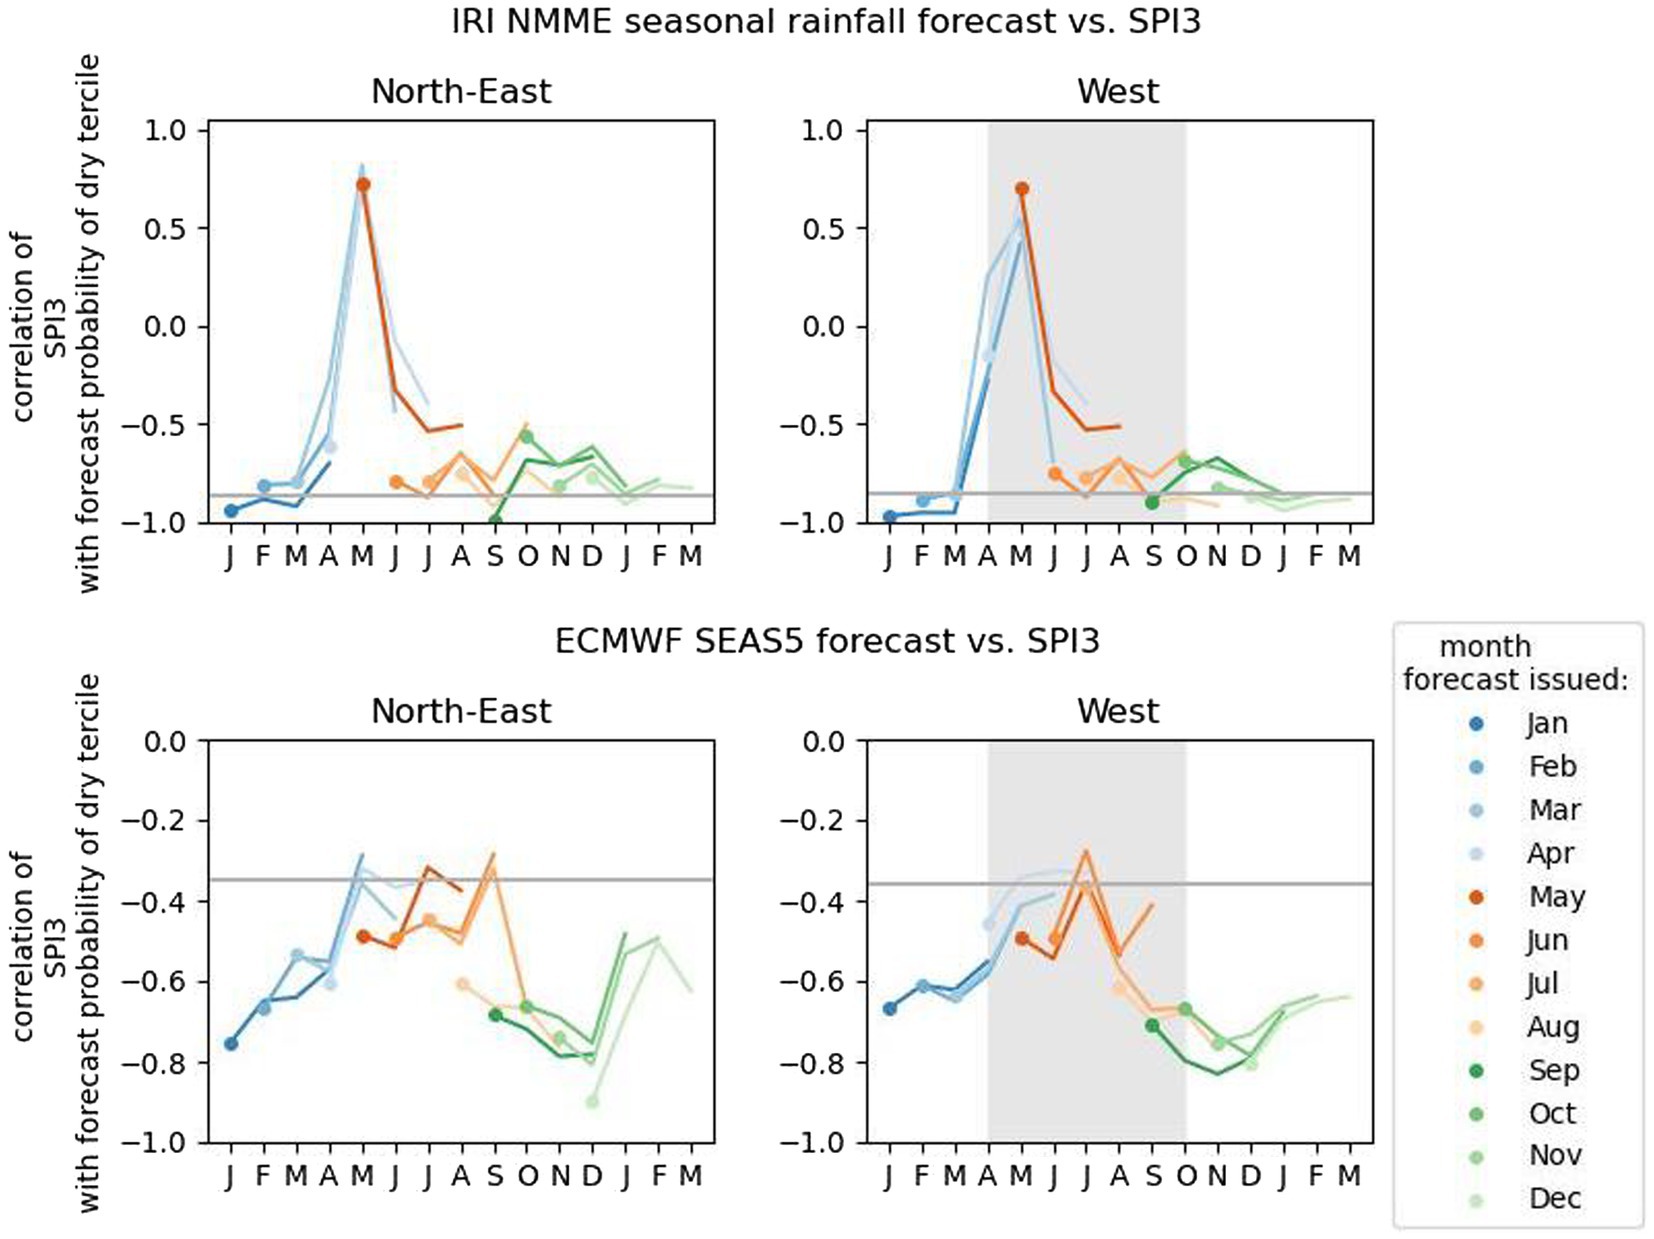
Figure 4. Skill of the calibrated multi-model ensemble IRI forecast (top row) and calibrated probabilistic ECMWF SEAS5 (bottom row) expressed as a correlation between forecast probability of dry tercile and SPI3 at various lead times, across all calendar months. Individual line represents forecasts issued on a particular month (as per legend). Nominal month is the first of the three month period over which SPI3 is calculated and for which a forecast is issued, e.g., point for January represents a value for Jan–Mar. Note that for the IRI forecast this figure is based on available data covering the period of March 2017–November 2022, i.e., 6 years only. Correlations below the grey line are significant at p = 0.05. Shaded box marks the main growing season for rain-fed rice in the Western region.
An alternative approach to forecasting drought (rainfall anomalies) with the dynamical models (as exemplified by the IRI MME and ECMWF SEAS5 forecasts) is to use a tailored statistical model utilising known teleconnections. An obvious choice in the Philippines is linking rainfall anomalies to the state of ENSO, and other global modes of climate variability such as IOD. Figure 5 illustrates such a model based on the monitored status of ENSO, while Figure 6 is based on an ENSO forecast. Both models are qualitatively similar and show similar seasonal patterns of skill to that of the dynamical climate models illustrated in Figure 4, i.e., they show relatively high skill at a range of lead times during off-season, but a collapse of skill across the onset of the Western region’s rainy season (April) and low skill during the first part of that rainy season. Analyses of correlations of SPI3 with observed IOD (not shown) reveal a much weaker signal than that for ENSO.
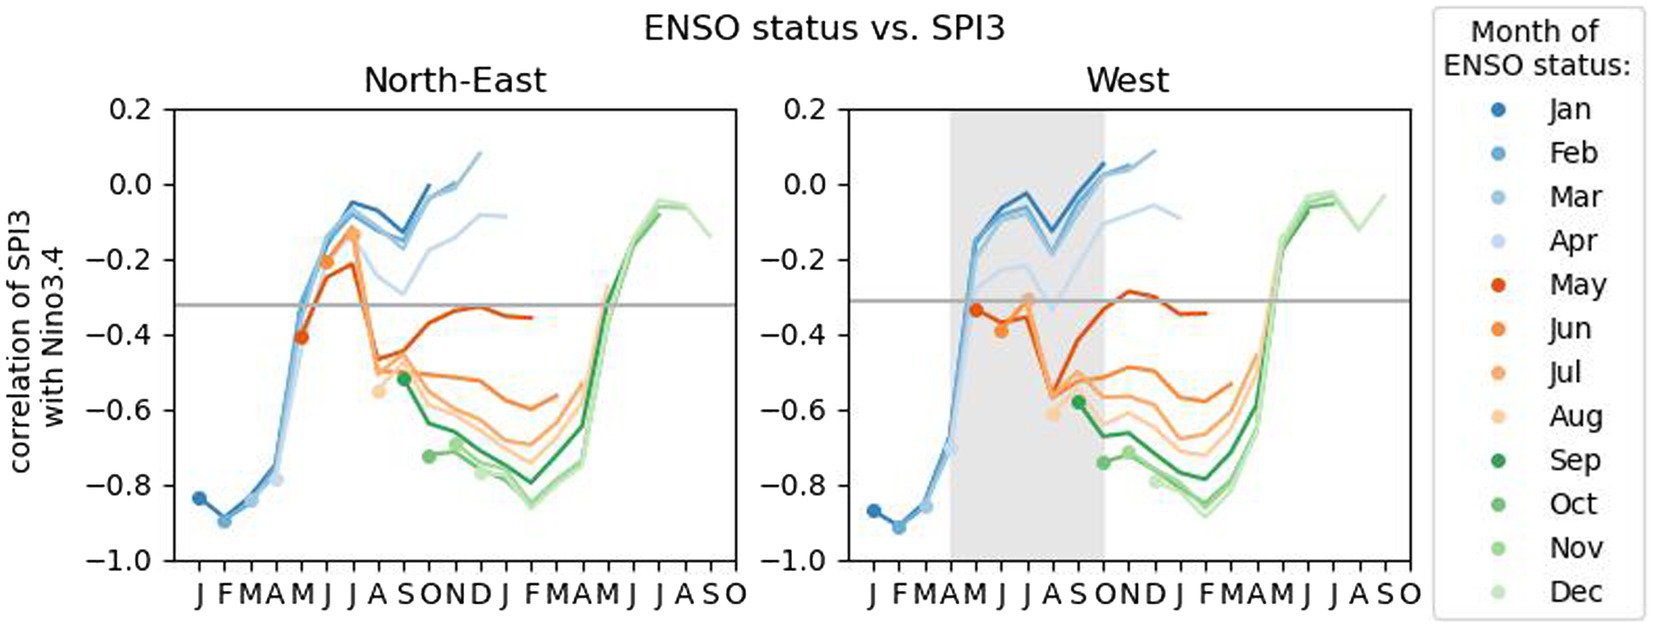
Figure 5. Relationship between current ENSO status (monitored) and SPI3 for various lead times. Individual line illustrates correlations with ENSO value observed on a particular month (as per legend). Nominal month is the first of the three month period over which SPI3 is calculated, e.g., point for January represents SPI3 value over Jan–Mar. Correlations below the grey line are significant at p = 0.05. Shaded box marks the main growing season for rain-fed rice in the Western region.
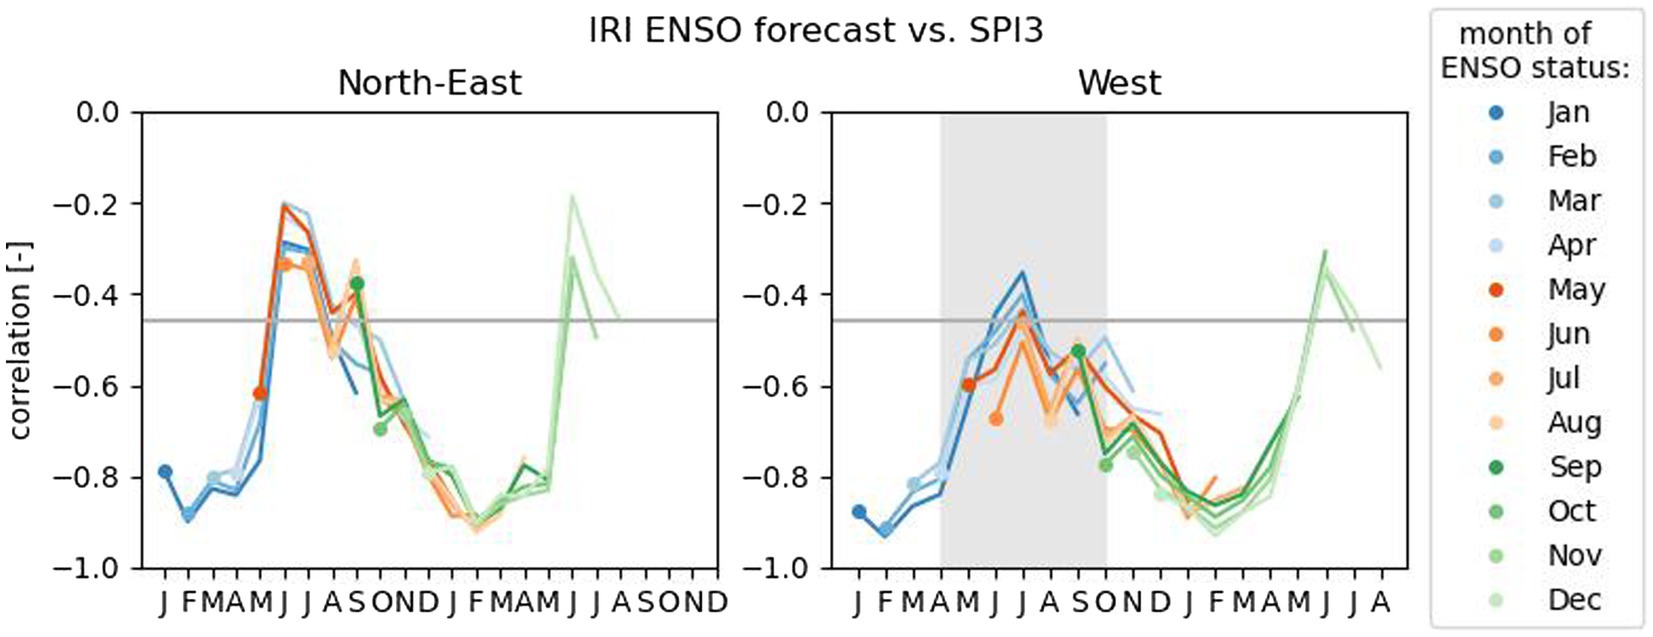
Figure 6. Relationship between IRI ENSO forecast and SPI3 for various seasons and lead times. Individual line represents a forecast issued on a particular month (as per legend). Nominal month is the first of the three period over which SPI3 is calculated, and for which a forecast is issued, e.g., a point for January represents data for Jan–Mar. Forecast value used is the mean of the ensemble of statistical and dynamical ENSO forecasts. Correlations below the grey line are significant at p = 0.05. Shaded box marks the main growing season for rain-fed rice in the Western region.
4 Discussion – implications for developing the trigger model for drought in Mindanao
4.1 The hazard vs. impact challenge
In the analyses carried out above we described available drought impact proxy variables, and evaluated their relationships with meteorological drought indices and antecedent environmental variables (impact precursors). Because these relationships are not conclusive, development of a trigger model in the form of a formal statistical model predicting impact is difficult. One compounding factor is that the relationship between the impact we wish to anticipate and drought will vary in space and time. Typically climate-marginal agricultural areas (a largely spatial characteristic) and/or dry condition growing systems (a largely seasonal characteristic) would be more sensitive to droughts. Decision to initiate anticipatory action in consequence must also consider the extent of the correlation between hazard and impact, an exercise largely limited by the lack of relevant impact data. Decision makers should not assume a consistent or linearly correlated impact as a result of the anticipated hazard. In some instances mechanistic interpretation of the current hazard-focused data can potentially lead to a misguided trigger model with little skill. As a consequence we focused our analyses on predicting the drought hazard (meteorological drought), the assumption being that these spatial and dryland considerations would be taken up either through the additional consideration of vulnerability indicators, or through the process of discussions and consultations as part of the wider AA protocol.
4.2 The space, seasonal and lead times challenge
In univariate analyses, we illustrated relationships between a number of potential drought predictors and SPI3-indexed drought across space, seasons and lead times. These analyses provide a good basis for guiding development of a trigger model based on expert opinion, as they systematically map useful predictor variables. Importantly, our analyses reveal that any such model skill, where/if it exists, has strong connection to specific geographical and temporal conditions. We have seen in the Mindanao example above, the need to clearly differentiate between two rainfall regimes where meaningful indicators of drought in one region, are not necessarily of comparable meaning in the other region. We also have observed that a quantitative-only trigger cannot perform consistently throughout the year, or at varying lead-times. In the West region for instance, drought predictability is relatively high in general, but critically low in the period during the early rainy season. This observation highlights the importance of (possibly quantitatively) further accounting for those seasonal and lead-time variations (i.e., a trigger model would need to be built separately for each target season and lead time), and the need to inform actors within the anticipatory action process of those discrepancies in the skill of the trigger.
Alternatively, a set of formal statistical models could be constructed targeting the SPI3 drought index and involving optimization for (cross-validated) skill and selection of explanatory variables.
4.3 The data and correlation challenge
An important additional consideration in the above is a set of constraints imposed by data availability. One aspect of this is the availability of historical time series to evaluate the role of a particular variable as predictor of drought. In our analyses IRI forecast is available for 6 years only, and thus its utility is limited, both from the perspective of expert system-like and formal statistical models. Another is the lead time at which a variable is available. For example, the dynamical models forecast is available only up to 6 months lead time (4 months, if one considers entire seasons), which expresses the limits of skill of seasonal forecast, while IRI ENSO forecast is available with 9 months lead time.
Our analyses show strong dependence of drought predictors on a similar source of predictability, manifested by similar seasonal patterns of correlations with the target SPI3 variable. These most likely express the ENSO signal which appears to be a dominating driver of interannual rainfall variability in the studied region. This dependence suggests that predictor variables (different rainfall forecasting systems, ENSO forecast, observed ENSO) are strongly cross-correlated, which is confirmed through a correlation matrix (not shown). This adds additional complexity to the development of an expert system-like trigger model. Should the cross-correlated variables be considered independently? or averaged into a single indicator? While cross-correlation of predictor variables can be taken into account explicitly in a formal statistical model (e.g., through dimensionality reduction, or by explicitly modelling interactions between variables), the consequences within trigger models which equally weight several of these variables are much less clear.
4.4 Towards the explicit consideration of trigger model skill
Our analyses clearly show the time varying skill of the trigger model, an aspect which usually receives limited attention in the process of anticipatory action. In our univariate analyses we look at a number of possible predictors of drought hazard, which all express a similar collapse of skill in the period leading to the start and the first part of the Western region’s rainy season (AMJ). As this is ubiquitous across the considered predictors, it appears that in that critical period one cannot simply give more weight to a more skillful predictor to achieve acceptable level of forecast skill, and as a consequence—any trigger model that spans that period is likely to have a large uncertainty and low confidence in its results. In view of the above, it seems appropriate to consider the skill of a trigger model explicitly when deciding whether or not to activate the action, rather than rely purely on the value of the trigger emerging from that model.
Such a model could be built as an ordinary least squares (OLS) regression of predictor variables against the continuous SPI3 value. In a regular application of that model in the AA context, the target value (SPI3 of-1 for drought condition) would be considered as the threshold, and the trigger would be activated if the model’s deterministic prediction was less than that threshold. Assuming that the OLS model’s distribution of error is symmetrical around the best estimate (Wilks, 2011), such a prediction model would enable triggering an action when the probability of drought is larger than 50%. But in a skill-less OLS model (i.e., one with low correlation or low coefficient of determination) model prediction might never reach an actionable threshold (OLS model with coefficient of determination of 0 will always yield the mean value of the predictand).
We hypothesise that expressing the skill of the trigger model explicitly better responds to inherent inconsistencies of the data, model and impacts to anticipate, and offers decision makers an opportunity to transparently take into account their risk acceptance levels while deciding on activating the trigger.
Instead of just presenting the trigger (prediction) generated by the model, we present the performance of a model in predicting historical events of a particular magnitude using a number of hits and misses, i.e., cases when an event was correctly predicted by the model, and cases when the model yielded a false alarm. There are formal skill measures that express models skill as a composite index (e.g., hit/miss ratio), but we find it more evocative to present here just a number of hits and misses, together with the number of events that occurred historically. Importantly, we map the hits and misses across a range of possible trigger thresholds—and this is illustrated in Figures 7, 8.
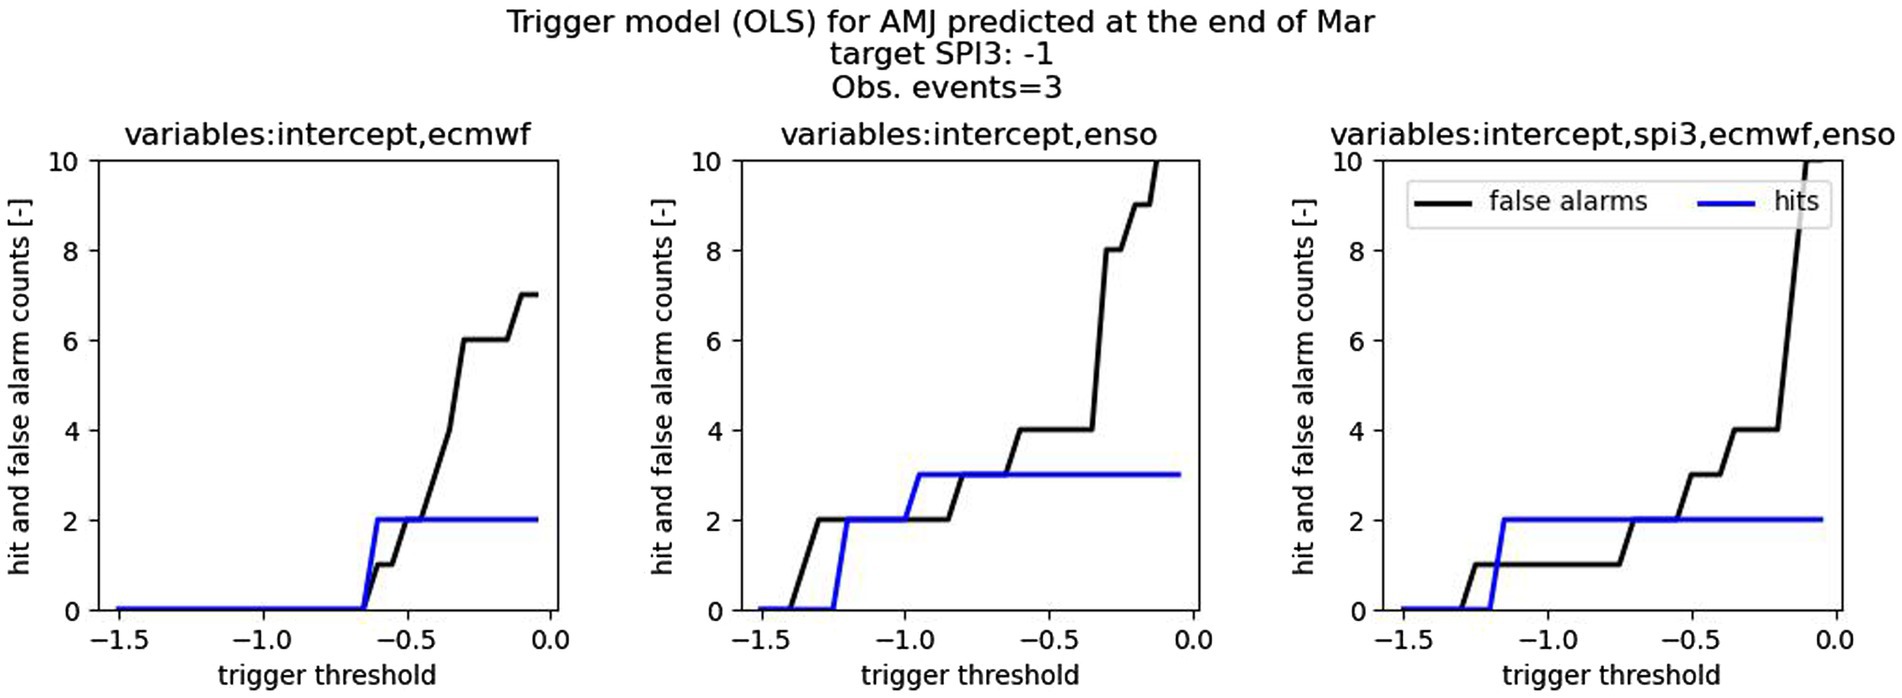
Figure 7. Skill of the OLS trigger model as a function of trigger threshold and a set of variables included in the model.
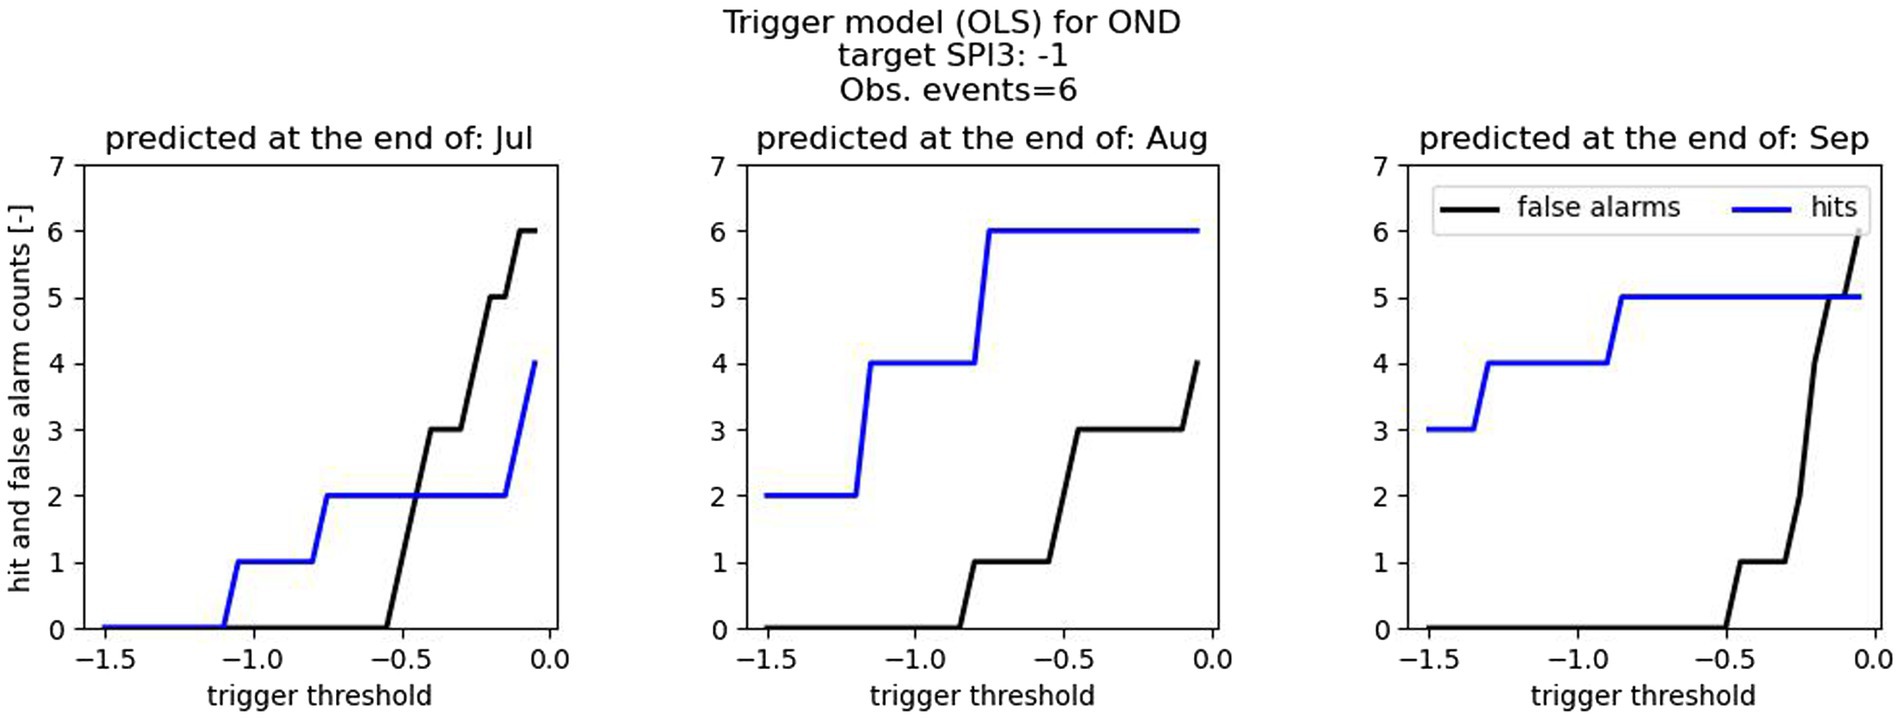
Figure 8. Skill of the OLS trigger model as a function of trigger threshold and lead time. All three models illustrated utilise the same predictor variables, and differ only in lead time.
Figure 7 shows three different trigger models targeting moderate to severe drought (SPI3 of-1 or less) in the AMJ season and utilising predictors available in March. The models differ in the variables considered, and clearly show differences in the level of skill. The first, that utilises only the ECMWF SEAS5 forecast, never predicts the target drought with a low trigger threshold (lower than-0.7), but captures two out of three historical events with a higher trigger threshold (above-0.7, blue line). It also generates false alarms, one with a trigger threshold as low as-0.6, two with-0.5 and more with higher thresholds (black line). The model utilising only observed ENSO state captures all three events when threshold is above-1.0, yet it also issues false alarms, two if threshold is larger than-1.3, three with threshold larger than-0.8 and more with higher threshold values. A model with a more extensive set of predictors, including the forecast, observed state of ENSO and observed SPI3 anomaly, seems to have reduced skill, and at best is able to predict only two out of three events.
A clearer example of the above is shown in Figure 8, which illustrates the skill of a trigger model (with identical predictors in this case) across lead times.
We believe that this form of presentation of trigger model and model skill allows for, firstly, the selection of the predictor variables that provide the maximum information into the very tailored setting of trigger activation, i.e., more hits than false alarms (blue line above black) relating to odds better than chance. Secondly, once the model is decided, this approach provides a basis for undertaking a trigger activation decision that is fully-informed about the consequences of the model and inclusive of data deficiencies. Notably, there is no a priori prescribed trigger threshold, instead, the trigger, as generated at a particular time with a particular lead-time, with set predictor variables, is evaluated within the framing of risk and allows flexibility depending on a decision maker’s risk acceptance. For instance the engaged parties could agree on a “safe-at-all-cost” scenario, i.e., we are prepared to act on a false alarm but we do not accept to miss an event (all observed events were predicted, despite false alarms also issued), its opposite “true-hit-only” scenario: i.e. we are prepared to miss some events, but if we act we want it to be on an event that is certain to occur, or a “middle-of-the-road” scenario: odds of the hits/false alarms ratio is above 1. While the underpinning science is more complex and therefore perhaps difficult to explain to decision makers, interpreting the hit/false alarm rate is relatively easy and well documented. We therefore believe the active involvement of anticipatory action actors (decision-makers) in using and engaging with such tools is an necessary part of the process, particularly in judging and setting acceptable levels of risk and hence thresholds. We are, however, not aware of any anticipatory action protocol where skill of the trigger model is considered explicitly when activating the trigger.
5 Conclusion
We have demonstrated that both drought during the rice growing season and antecedent conditions before the growing season are correlated with measures of agricultural production (volume, yields and harvested areas) in two regions of Mindanao. As such these variables are potentially useful in deriving appropriate trigger models which seek to predict potential agricultural impacts. Additionally, it is clear that the ability of ENSO forecasts to predict SPI is dependent on the time of year, and that the variability in this relationship affects the skill of seasonal forecasts of dry terciles. Furthermore, given that the skill of multiple sources of seasonal forecasts derive from the same forcing, i.e., ENSO, the use of multiple (covarying) forecasts with similar weights within a trigger model will overemphasise the importance of these forecasts, potentially at the expense of other sources of predictive skill.
While the multitude of precursors brings no guarantee of improved skill of the trigger model, the usefulness of the seasonal forecast depends on the time of year, lead time and target region. A model with low skill can be strongly misleading and ultimately destructive to the process of anticipatory action (false alarms and not triggering for destructive events can lead to abandoning of anticipatory action activities). Given these results it is imperative that trigger scores and trigger thresholds used in the process of activating anticipatory action are continuously evaluated and updated, encompassing acceptable levels of risk as discussed. Thus even a rudimentary assessment or illustration of skill of a model is better than no skill information. In Mindanao (and potentially in other locations), the development of a trigger model needs to sufficiently quantify model skill (and uncertainty), separately for each decision timescale (when humanitarian-related decisions are made) and for each forecast period. Understanding these attributes can then inform the selection of variables, determination of weights and establishing suitable trigger thresholds in each case.
Data availability statement
Publicly available datasets were analyzed in this study. This data can be found here: https://web.csag.uct.ac.za/~wolski/fao-philippines/.
Author contributions
PW: Conceptualization, Data curation, Formal analysis, Investigation, Methodology, Visualization, Writing – original draft, Writing – review & editing. OC: Conceptualization, Methodology, Writing – original draft. MT: Conceptualization, Methodology, Writing – original draft. FK: Writing – review & editing, Investigation. TD-P: Writing – review & editing, Investigation. DR: Writing – review & editing, Conceptualization, Funding acquisition. CJ: Writing – review & editing, Conceptualization, Funding acquisition.
Funding
The author(s) declare that financial support was received for the research, authorship, and/or publication of this article. This work was funded by FAO as under OSRO/GLO/113/EC – Baby 5 programme.
Acknowledgments
The authors would like to warmly thank Claire Currie, Sindy Ndara, Tsungai Nkoma and Evelyn Kaliwo, at the time UCT Environmental and Geographical Science students, for their ad-hoc involvement in the literature discovery process, as well as Erkin Isaev4 and Hideki Kanamaru4 for their recurrent and relevant feedback throughout the thought process which lead to this work.
Conflict of interest
The authors declare that the research was conducted in the absence of any commercial or financial relationships that could be construed as a potential conflict of interest.
Publisher’s note
All claims expressed in this article are solely those of the authors and do not necessarily represent those of their affiliated organizations, or those of the publisher, the editors and the reviewers. Any product that may be evaluated in this article, or claim that may be made by its manufacturer, is not guaranteed or endorsed by the publisher.
Footnotes
1. ^Columbia Climate School – International Research Institute for Climate and Society (https://iri.columbia.edu/).
2. ^Philippine Atmospheric, Geophysical and Astronomical Services Administration (https://www.pagasa.dost.gov.ph/).
3. ^Australian Government, Bureau of Meteorology (http://www.bom.gov.au/).
4. ^World Meteorological Organization (https://public.wmo.int/en).
5. ^Food and Agricultural Organization, Global Information and Early Warning System on Food and Agriculture (https://www.fao.org/giews/en/).
References
FAO , (2020). The Philippines – Impact of early warning early action. Rome. Available at: https://www.fao.org/documents/card/fr/c/CA9371EN/
FAO , (2023). Asia-Pacific technical working group on anticipatory action. Technical Standards on Anticipatory Action in Asia and the Pacific, Bangkok. Available at: https://reliefweb.int/attachments/16e0b004-5cca-4185-bda8-c524c3eeabc4/TWG%20AA%20Technical%20Standards%20on%20AA%20in%20Asia-Pacific.pdf
FAO and WFP . (2023). FAO-WFP anticipatory action strategy. Scaling up anticipatory actions to prevent food crises – September 2023. Rome: FAO and FWP.
IFRC , (2022). Operational framework for anticipatory action 2021–2025. Available at: https://www.ifrc.org/document/operational-framework-anticipatory-action-2021-2025
McKee, T. B., Doesken, N. J., and Kleist, J. (1993). “The relationship of drought frequency and duration of time scales” in Eighth conference on applied climatology (Anaheim CA: American Meteorological Society, Jan17-23, 1993), 179–186.
OCHA , (2023). OCHA’s strategic plan 2023–2026: Transforming humanitarian coordination. Available at: https://reliefweb.int/report/world/ochas-strategic-plan-2023-2026-transforming-humanitarian-coordination
Perez, G. J., Enricuso, O., Manauis, K., and Valete, M. A. (2022). Characterizing the drought development in the Philippines using multiple drought indices during the 2019 El Niño. ISPRS Annals of the photogrammetry, remote sensing and spatial. Inf. Sci. V-3–2022, 463–470. doi: 10.5194/ISPRS-ANNALS-V-3-2022-463-2022
Perez, G. J., Macapagal, M., Olivares, R., Macapagal, E. M., and Comiso, J. C. (2016). Forecasting and monitoring agricultural drought in the Philippines. The International Archives of the Photogrammetry, Remote Sensing and Spatial Information Sciences. 41, 1263–1269. doi: 10.5194/isprsarchives-XLI-B8-1263-2016
Salvacion, A. R. (2022). “Multiscale drought hazard assessment in the Philippines,” in Computers in earth and environmental sciences: artificial intelligence and advanced technologies in hazards and risk management. 169–179.
Sutanto, S. J., van der Weert, M., Wanders, N., Blauhut, V., and van Lanen, H. A. J. (2019). Moving from drought hazard to impact forecasts. Nat. Commun. 10:4945 (2019). doi: 10.1038/s41467-019-12840-z
Trenberth, K. E., Dai, A., van der Schrier, G., Jones, P. D., Barichivich, J., Briffa, K. R., et al. (2014). Global warming and changes in drought. Nat. Clim. Chang. 4, 17–22. doi: 10.1038/nclimate2067
UNESCAP , (2021). Ready for the dry years building resilience to drought in South-East Asia Second Edition. Bangkok, Thailand. Available at: https://www.unescap.org/sites/default/files/publications/Ready_for_the_Dry_Years_Second_edition.pdf.pdf
Valete, M. A., Ang, P. D., Veloria, A., and Perez, G. J., (2022). Assessment of combined drought index (cdi) For drought monitoring in the Philippines during the 2018–2019 El Niño. Conference of the Asian association on remote sensing, Mongolia. Available at: https://a-a-r-s.org/proceeding/ACRS2022/ACRS22_172.pdf
van Loon, A. F. (2015). Hydrological drought explained. Wiley Interdisciplinary Reviews: Water. 2, 359–392. doi: 10.1002/WAT2.1085
Vicente-Serrano, S. M., Beguería, S., and López-Moreno, J. I. (2010). A multi-scalar drought index sensitive to global warming: the standardized precipitation evapotranspiration index—SPEI. J. Clim. 23, 1696–1718. doi: 10.1175/2009JCLI2909.1
Wanders, N., and Wood, E. F. (2018). Assessing seasonal climate forecasts over Africa to support decision-making. World Sci. Series Asia Pacific Weather Clim. 10, 1–15. doi: 10.1142/9789813235663_0001
Keywords: anticipatory action, drought, the Philippines, trigger, skill
Citation: Wolski P, Crespo O, Tadross M, Khumalo FZ, Du-Pont T, Riquet D and Jones C (2024) On the quantitative limits for triggering drought anticipatory actions in Mindanao, the Philippines. Front. Clim. 6:1336442. doi: 10.3389/fclim.2024.1336442
Edited by:
Markus Enenkel, Harvard University, United StatesReviewed by:
Katiuscia Fara, Independent Climate and DRR Expert, SwitzerlandIsabelle Tingzon, UNICEF United Nations International Children's Emergency Fund, United States
Copyright © 2024 Wolski, Crespo, Tadross, Khumalo, Du-Pont, Riquet and Jones. This is an open-access article distributed under the terms of the Creative Commons Attribution License (CC BY). The use, distribution or reproduction in other forums is permitted, provided the original author(s) and the copyright owner(s) are credited and that the original publication in this journal is cited, in accordance with accepted academic practice. No use, distribution or reproduction is permitted which does not comply with these terms.
*Correspondence: Piotr Wolski, wolski@csag.uct.ac.za