Climate variability and change in Ecuador: dynamic downscaling of regional projections with RegCM4 and HadGEM2-ES for informed adaptation strategies
 Diego Portalanza1,2*
  Malena Torres3,4,5*
  Flavia Rosso1 Cristian Felipe Zuluaga6 Angelica Durigon1
  Finbarr G. Horgan7,8,9 Eduardo Alava3,5*
  Simone Ferraz1
- 1Department of Physics, Center of Natural and Exact Sciences, Federal University of Santa Maria, Santa Maria, RS, Brazil
- 2Carrera de Ingeniería Ambiental, Facultad de Ciencias Agrarias, Instituto de Investigación, Escuela de Posgrado “Ing. Jacobo Bucaram Ortiz, Ph.D”, Universidad Agraria del Ecuador, Guayaquil, Guayas, Ecuador
- 3Faculty of Life Sciences, Escuela Superior Politécnica del Litoral, Guayaquil, Ecuador
- 4Department of Crop Sciences and Agroforestry, Faculty of Tropical AgriSciences, Czech University of Life Sciences Prague, Prague, Czechia
- 5Rural Research Center, Faculty of Social Sciences, Escuela Superior Politécnica del Litoral, Guayaquil, Ecuador
- 6Faculty of Agricultural Science, Corporación Universitaria Santa Rosa de Cabal, Santa Rosa de Cabal, Colombia
- 7EcoLaVerna Integral Restoration Ecology, Cork, Ireland
- 8Centre for Pesticide Suicide Prevention, University/BHF Centre for Cardiovascular Science, University of Edinburgh, Edinburgh, United Kingdom
- 9Escuela de Agronomía, Facultad de Ciencias Agrarias y Forestales, Universidad Católica del Maule, Curicó, Chile
Ecuador, a country with distinct coastal (CO), highland (HL), and Amazon (AM) regions that are characterized by unique climatic, ecological, and socio-economic features is highly vulnerable to climate change. This study focuses on these three regions, highlighting their individual importance in the broader context of Ecuador's climate vulnerability. Utilizing dynamically downscaled data from the Regional Climate Model (RCM), we generated precipitation and air temperature projections for the period 2070–2099 under three different climate change scenarios. We indicate projected temperature increases across all three regions: mean temperature increases for the CO, HL and AM regions are of 1.35, 1.55, and 1.21°C, respectively. Each year, the largest temperature increases are predicted for the third quarter (June–August), with the smallest increases predicted for the last quarter (December–February). Precipitation patterns show varied changes, with CO exhibiting a positive mean daily change, in contrast to a mean negative change in the AM region. These region-specific projections underscore the differential impacts of climate change within Ecuador and highlight the necessity for tailored adaptation measures. The study's novel approach, focusing on distinct regional impacts within a single nation, offers valuable insights for policymakers, aiding in the development of effective, region-specific climate change mitigation and adaptation strategies. This targeted approach is crucial to address unique challenges faced by different regions, thereby supporting national resilience strategies.
1 Introduction
The exigencies of climate change, compounded by the inherent uncertainties in long-term projections, necessitate robust frameworks for decision-making under deep uncertainty (DMDU). DMDU approaches are specifically designed to inform policy and planning in contexts where the precise outcomes of climate change are unknowable but the stakes are high (Workman et al., 2020; Schinko et al., 2024). Climate change presents an unparalleled challenge to global biodiversity, ecosystems, and human societies, with particularly acute implications for countries with diverse landscapes, such as Ecuador that has widely distinct coastal, highland and Amazonian regions. Such distinct regions exhibit unique climatic conditions, distinct habitats and ecosystems, and consequently distinct socio-economic realities, Such regional differences can determine the vulnerabilities to, and outcomes of, ongoing shifts in global climate patterns. Understanding these different vulnerabilities offers insights, not only to conserve biodiversity, but also, to safeguard existing cultural and socio-economic systems against the adversities of climate change (Buytaert et al., 2009; Eguiguren-Velepucha et al., 2016; Pettorelli et al., 2021).
Amidst the escalating complexities of climate dynamics, accurately projecting regional-scale changes in precipitation and air temperature emerges as a daunting yet crucial endeavor. General circulation models (GCMs), while proficient in simulating atmospheric processes on a broad scale, often fail to capture the nuanced climatic variations intrinsic to regions with complex topographies and diverse microclimates, such as those found in Ecuador (Sheffield et al., 2013; Fuentes-Franco et al., 2014). Such limitation underscores the critical need for high-resolution regional climate models (RCMs) that employ dynamic downscaling techniques to refine coarse GCM outputs, thereby rendering climate projections more locally relevant and accurate (Guo et al., 2018).
A fundamental application of Regional Climate Models (RCMs) is to estimate present and historical climates, contrasting these with future climate projections under various greenhouse gas (GHG) forcing scenarios (henceforth “forcings”), including Representative Concentration Pathways (RCPs) (Van Vuuren et al., 2011). RCPs are scenarios that include time-dependent projections of atmospheric GHG concentrations, developed for climate modeling and research to assess potential global climate outcomes based on different trajectories of human activity. Through multidecadal simulations, RCMs facilitate detailed assessments of future climates, blending climate internal variability and the effects of forcings such as those defined by the RCPs (Tapiador et al., 2019, 2020). Control simulations, which are devoid of external forcings like increased GHG emissions, are crucial for attributing observed climate changes, particularly global warming, to specific forcings. By holding all conditions constant (ceteris paribus) and accounting for internal variability, significant deviations from control runs in RCM outputs indicate the influence of forcings, as specified by the RCPs, on climate alterations (Georgescu et al., 2022; Cheng et al., 2023).
Historically, RCM simulations aimed to give insights into global changes at resolutions finer than those achievable by GCMs. Differences between RCM outputs, once upscaled to match their parent GCM resolutions, and direct GCM outputs were attributed to the enhanced capabilities of RCMs (Ban et al., 2021). The debate on the “added value” of RCMs over GCMs has persisted, with studies quantifying this value across various spatial scales. Despite this, some comprehensive comparisons with GCMs challenge the notion that the increased resolution of RCMs, despite requiring more computational resources, results in significant modifications to mean seasonal changes (Solman and Blázquez, 2019; Vautard et al., 2021). This discourse emphasizes the necessity of critically evaluating the benefits of employing RCMs for local and regional climate projections, especially over complex terrain like that of Ecuador.
By integrating insights from DMDU literature, this research contributes to the evolving discourse on adaptive and resilient policy-making in the face of climatic uncertainties, offering evidence-based strategies tailored to the unique ecological and socio-economic contours of Ecuador. Therefore, by providing region-specific climate projections, the study aids in the development of nuanced, evidence-based policies that can dynamically adjust to the unfolding realities of climate change, thereby enhancing Ecuador's resilience and adaptive capacity (Meinshausen et al., 2011; Thuiller et al., 2019; Depledge, 2022).
In sum, this research endeavors to bridge the gap in regional climate modeling for Ecuador, leveraging the precision of dynamic downscaling to forecast climate impacts with unprecedented detail. Through its focus on DMDU, the study not only contributes to the scientific understanding of climate change impacts but also provides a critical foundation for formulating adaptive policies that can navigate the complexities and uncertainties of a changing climate. Ecuador's proactive stance in international climate negotiations, as reflected in its commitments under the UNFCCC and the Paris Agreement, amplifies the relevance of this research.
1.1 Research objectives and hypothesis
The primary objectives of this study are to:
1. Generate high-resolution climate projections for Ecuador's Coastal, Highland, and Amazonian regions using dynamic downscaling techniques, thereby addressing the gaps in regional-scale climate modeling.
2. Assess the potential impacts of future climate scenarios, derived from a range of Representative Concentration Pathways (RCPs), on key socio-ecological systems within these regions.
3. Explore the applicability of Decision Making Under Deep Uncertainty (DMDU) frameworks in formulating robust climate adaptation strategies for Ecuador, taking into consideration the intrinsic uncertainties of climate projections.
Based on these objectives, we propose the following hypothesis:
Hypothesis 1: Dynamic downscaling will reveal significant regional variations in climate projections for Ecuador, offering more nuanced insights than those provided by coarse-scale General Circulation Models (GCMs).
1.2 Methodological overview
To achieve these objectives, this study employs a two-tiered methodological approach:
Dynamic downscaling: utilizing the Regional Climate Model 4 (RegCM4) to downscale outputs from the Hadley Centre Global Environmental Model 2-Earth System (HadGEM2-ES), providing high-resolution climate projections for the period 2070–2099 under various RCP scenarios.
2 Methods
2.1 Study area
The analysis encompasses Ecuador's entire surface area, uniquely situated on the equator in South America. The country's complex geographical landscape, with borders touching Colombia, Peru, and the Pacific Ocean, spans a total area of 256,370 square kilometers. Ecuador is divided into three distinct regions: Coastal (CO), Highlands (HL), and Amazon (AM), each varying significantly in altitude and climatic conditions. The study delves into the diverse climatic zones of Ecuador, influenced by the Andes cordillera, including Tropical wet and dry, Semi-arid, Tropical monsoon, and Tropical rainforest climates as per Köppen's classification system (Köppen, 1918). This detailed analysis is crucial for understanding the regional climatic contrasts and their implications (Figure 1).
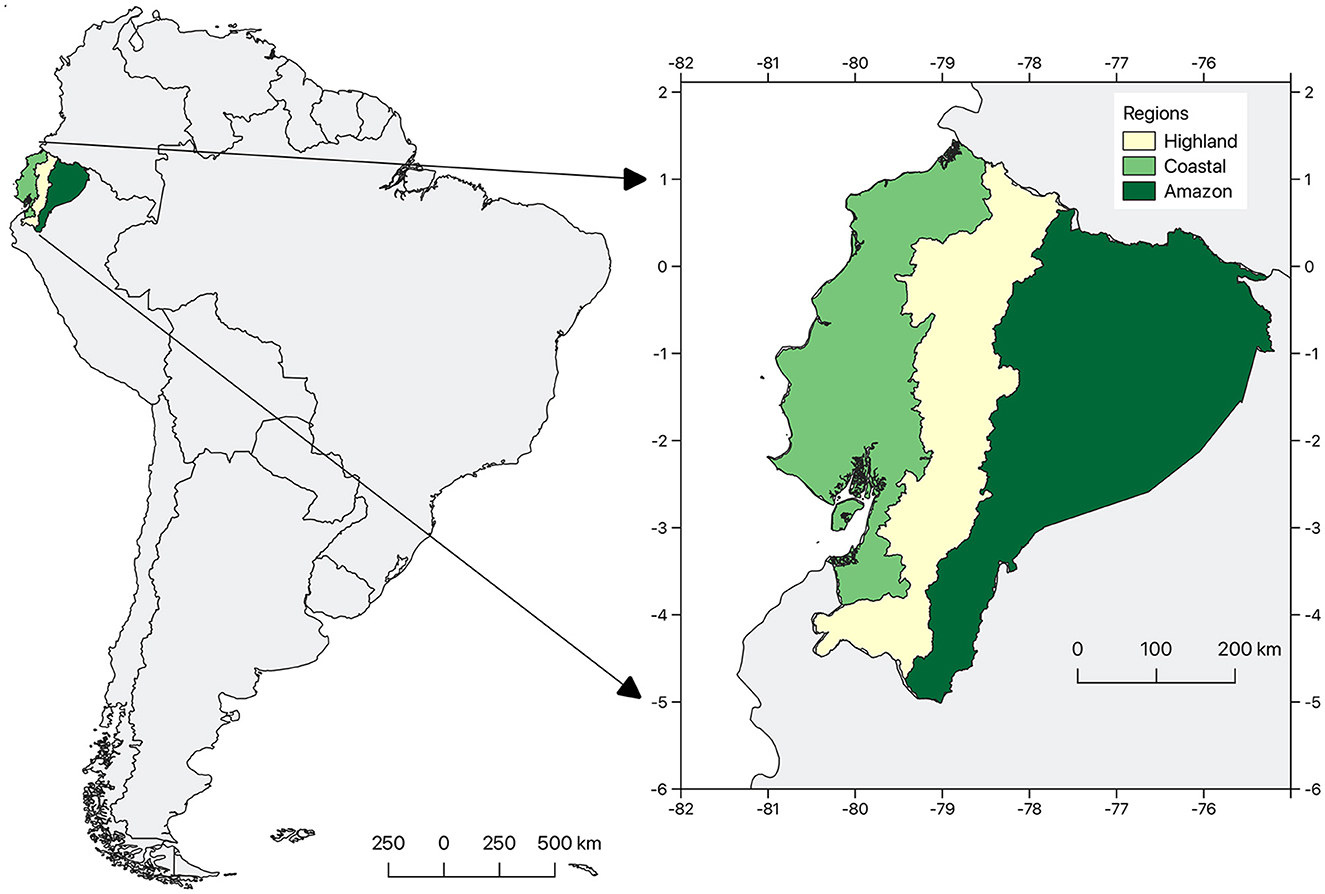
Figure 1. Study area. Box represents simulation domain.
The climate of Ecuador presents distinct climatic contrasts that are primarily determined by the presence of the Andes cordillera. In the Coastal region (west of the Andes cordillera), precipitation patterns are influenced by the Intertropical Convergence Zone (ITCZ), particularly affecting the rainy season, which reaches occurs between December and May. During the second half of the year, the region experiences a dryer season, primarily due to the influence of the South Pacific anticyclone (Sanabria et al., 2019). Beyond the Coastal region, Ecuador's diverse climatic patterns are shaped by a variety of systems. For instance, the Andean highlands experience climate dynamics influenced by altitude and local topography, while the Amazon region's climate is affected by both the ITCZ and the Amazon Basin's unique hydrological dynamics (Morán-Tejeda et al., 2016). These variations underscore the complex interplay of climatic systems across Ecuador (Campozano et al., 2018)
2.2 Regional climate model data and downscaling
The study employs the RegCM4, a public-domain software regularly updated by the International Center for Theoretical Physics (ICTP), ensuring its relevance and applicability to current climate modeling challenges. Originally developed by the National Center for Atmospheric Research (NCAR), RegCM4 has undergone significant improvements by ICTP, making it a robust tool for regional climate studies (Dickinson et al., 1989; Giorgi and Anyah, 2012).
We utilized the Hadley Centre Global Environmental Model 2-Earth System (HadGEM2-ES) for our climate projections. This model, integral to the IPCC Fifth Assessment Report (AR5), offers a comprehensive simulation of earth system processes, making it particularly suitable for our study on Ecuador's diverse climatic conditions (Collins et al., 2011). The data, sourced from the British Atmospheric Data Centre (BADC), span from the historical period of 1975–2004 to future projections of 2070–2099. The horizontal resolution of ~140 km at middle latitudes, while broad, provides a useful scale for examining regional climate patterns. The model's configuration includes 38 atmospheric height levels and 40 oceanic z-levels, facilitating detailed climate simulations.
The HadGEM2-ES data encompass future climate scenarios as outlined in the IPCC's Fifth Assessment Report (AR5), specifically RCP 2.6, 4.5, and 8.5. These scenarios represent low, medium, and high global radiative forcing levels, respectively, and are critical for understanding potential future climate conditions in Ecuador and its surrounding regions. The scenarios forecast CO2 concentrations reaching 490 ppm under RCP 2.6 and 935 ppm under RCP 8.5 by the end of the century (Van Vuuren et al., 2011). RegCM4 simulations were centered over Ecuador and northern South America, with the simulation domain encompassing a latitude range from ~2°N to 6°S and a longitude range from ~82 to 75°W. This specific range was chosen to effectively capture the climatic variations across this geographically diverse area effectively (Figure 1).
The specific configuration of our model, as detailed in Table 1, was carefully selected to accurately represent the complex topography and climate of the region. Convection, a critical process for precipitation in the tropics, necessitates precise parameterization in climate models. Emanuel (1991) convection scheme, which considers cloud mixing to be episodic and inhomogeneous and bases convective fluxes on sub-cloud-scale updrafts and downdrafts, has been demonstrated to produce reliable climate simulations over tropical regions (Giorgi and Anyah, 2012; Martínez-Castro et al., 2018; Komkoua Mbienda et al., 2021). The boundary layer, crucial for capturing surface-atmosphere interactions, is adeptly described by the Holtslag et al. (1990) scheme, which accounts for the evolution of the potential temperature and specific humidity. Its distinct approach to vertical mixing within the convective boundary layer has been shown to simulate precipitation more effectively, particularly in tropical areas (Reboita et al., 2014; Teodoro et al., 2021; Komkoua Mbienda et al., 2022). Furthermore, the moist physics scheme of Pal et al. (2000), as highlighted by Giorgi and Anyah (2012), includes a prognostic equation for cloud water. It determines fractional cloud cover based on local relative humidity and converts cloud water into precipitation, enhancing the model's ability to simulate observed precipitation patterns. This scheme has been a common choice in simulations for this modeling exercise (Pareja-Quispe et al., 2021), due to its efficacy in representing cloud processes and precipitation dynamics in the tropics.
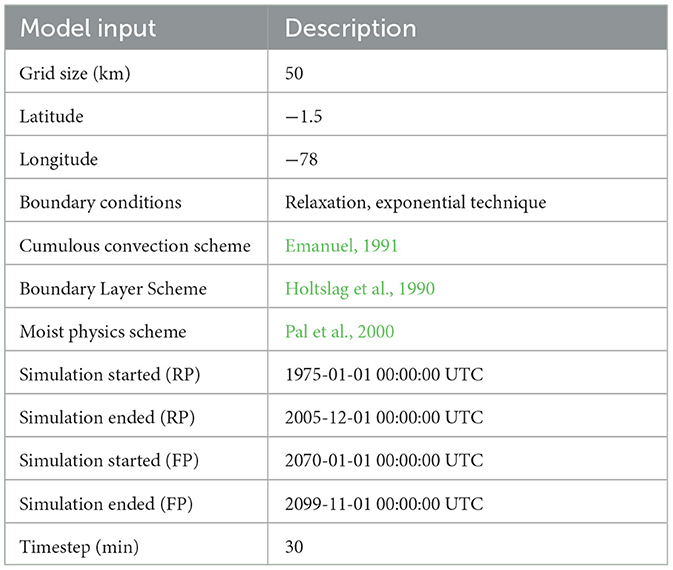
Table 1. RegCM4 model configuration.
2.3 Model bias correction and validation
2.3.1 Observational data
Addressing the challenges posed by the scarcity of refined historical climate data in Ecuador, our approach to bias correction employs two distinct datasets, chosen for their robust representation of extreme weather events across South America. This selection underscores our commitment to grounding our projections in the most accurate observational data available, thereby enhancing the reliability of our climate models under conditions of deep uncertainty.
For precipitation, we utilized the Climate Prediction Center (CPC) dataset, which provides a comprehensive daily precipitation record commencing in 1979 (Dinh et al., 2020). This dataset, with its spatial resolution of 0.5° latitude by 0.5° longitude, covers the period up to 2005, offering a detailed precipitation overview essential for assessing climate impacts on Ecuador's diverse ecosystems.
Daily air temperature data was sourced from the ERA5 reanalysis (Buontempo et al., 2020; Noél et al., 2021), renowned for its intricate portrayal of atmospheric conditions. The ERA5 dataset, with higher spatial resolution of 0.25° latitude by 0.25° longitude, spans from 1980 to 2004. These datasets were meticulously chosen not only for their temporal and spatial comprehensiveness but also for their extensive application in the scientific community, reinforcing their suitability for capturing the range of climate extremes within the region (Heo et al., 2019; Hersbach et al., 2020; Tarek et al., 2020; Jiang et al., 2021).
Considering the ERA5 dataset's commencement in 1980, we performed bias correction for temperature data from this year through 2004. To reconcile the disparities in spatial resolutions between datasets, a regridding procedure was implemented. This step is crucial, as it harmonizes the datasets, ensuring consistency and minimizing errors across our analytical framework. Such meticulous attention to data compatibility is essential for providing a reliable foundation upon which our climate projections can be built, facilitating a robust comparison across all climate variables assessed.
This careful approach to bias correction and validation is essencial in the context of Decision Making Under Deep Uncertainty (DMDU). By rigorously aligning our projections with high-quality observational data, we aim to reduce the uncertainty inherent in climate modeling, thus providing stakeholders and policymakers with a more reliable basis for crafting adaptive, resilience-enhancing strategies for Ecuador.
2.3.2 Bias correction
To mitigate biases inherent in the RCM daily data, our study utilized the quantile mapping (QM) method, a widely recognized empirical adjustment technique. This method leverages the cumulative distribution function (CDF) to reconcile modeled variables with observed data, thus enhancing the accuracy of climate projections (Lafon et al., 2013; Heo et al., 2019; Enayati et al., 2021). The essence of QM (Equation 1) lies in its capacity to map both observed and modeled data onto a unified probability distribution, thereafter adjusting the modeled data to more accurately mirror observed phenomena. The operational equation of QM is articulated as:
where Po represents the observed variable, Pm denotes the modeled variable, F symbolizes the CDF, and F−1 is the inverse CDF. The subscripts o and m are indicative of observed and modeled data, respectively (Li et al., 2010; Piani et al., 2010).
The process of bias correction was meticulously evaluated by segmenting the reference period (1975–2004) into two distinct phases: a baseline period (BP: 1975–1992) and a validation period (VP: 1993–2004). This division allowed for the derivation of QM bias correction coefficients for the RegCM4 temperature and precipitation datasets against the ERA5 and CPC reanalysis data for the BP. These coefficients were subsequently applied to the RegCM4 data throughout the VP, facilitating a rigorous validation process.
To quantitatively ascertain the model's precision post-bias correction, we employed standard goodness-of-fit metrics, including mean square error (MSE) (Equation 2), mean absolute error (MAE) (Equation 3), and root mean square error (RMSE) (Equation 4), formulated as follows:
Here, Pi and Qi correspond to the observed and RCM-predicted data points, respectively, with n representing the total observation count. An annual aggregation of these statistics facilitated a comprehensive assessment of the bias correction's efficacy.
This meticulous bias correction process underscores our commitment to enhancing the fidelity of climate projections, a critical endeavor in the area of Decision Making Under Deep Uncertainty (DMDU). By refining our climate models to more closely align with observed data, we bolster the foundation upon which robust, adaptable climate adaptation strategies can be developed.
2.4 Future projections
To comprehensively project future climatic changes in Ecuador, we focused on delta changes in temperature (minimum, mean, and maximum) and percent changes in precipitation. These changes were calculated by comparing data from two distinct periods: the future period (FP) spanning from 2070 to 2099, and the bias-corrected reference period from 1975 to 2004. This comparison allows us to quantify the expected climatic shifts in detail.
For an enhanced understanding of the statistical significance of these changes, we plotted them with an emphasis on the 95% confidence level (p-value <0.05). This approach visually represents the probability of occurrence of these projected changes, offering a clearer picture of future climate scenarios. In addition to temperature and precipitation, assessing the potential impacts on extreme weather events is crucial. To this end, we incorporated three extreme climate indices as recommended by the Expert Team on Climate Change Detection and Indices (ETCCDI) (Mistry, 2019; Kim et al., 2020). These indices were calculated separately for each of the key regions in Ecuador—Coastal (CO), Highlands (HL), and Amazon (AM). The selected indices include:
• Warm Spell Duration Indicator (WSDI): This index measures the count of days with a minimum of six consecutive days where the maximum temperature (Tmax) exceeds the 90th percentile.
• Consecutive Dry Days (CDD): It quantifies the maximum number of consecutive days with precipitation <1 mm.
• Daily Temperature Range (DTR): This index represents the mean difference between daily maximum (Tmax) and minimum (Tmin) temperatures.
Each of these indices provides insight into different aspects of climate extremes, allowing for a comprehensive analysis of potential future impacts. By calculating these indices for both the reference and future periods, we aim to offer a detailed understanding of how extreme weather patterns might evolve in the coming decades across Ecuador's diverse climatic regions.
3 Results and discussion
3.1 Bias correction and validation
The efficacy of the Quantile Mapping (QM) approach for bias correction in temperature and precipitation modeling was meticulously evaluated. In Figure 2, we present a comprehensive visualization of the impact of Quantile Mapping (QM) bias correction on our climate modeling outputs. The figure is divided into four panels, each illustrating different aspects of the bias correction process and its results.
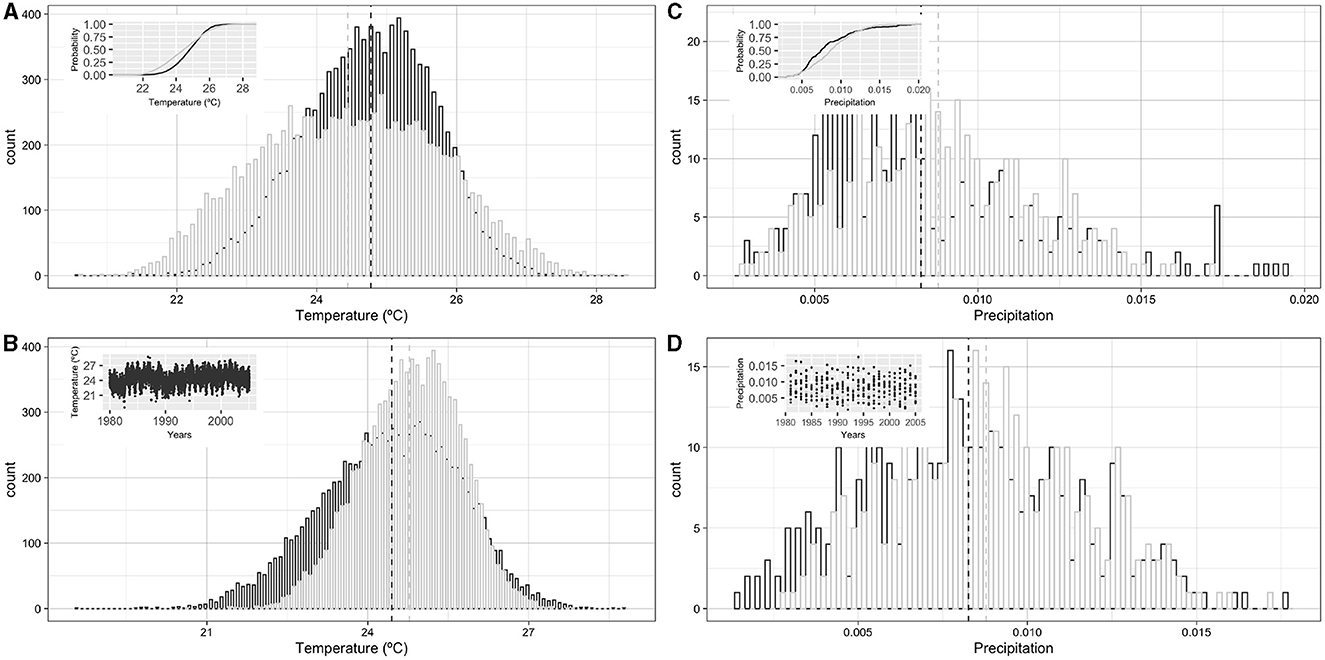
Figure 2. Results of applying a simple quantile mapping bias correction method to the RegCM4 data. (A, C) Display histograms for the RegCM4 simulated mean temperature and precipitation (in light gray) respectively, overlaid with histograms of the observed data (in dark gray). The insets within (A, C) illustrate the cumulative distribution functions (CDFs) for the observed (dark gray line) and the RegCM4 simulated data (light gray line). (B, D) Present the histograms of the RegCM4 data after bias correction (in dark gray). The insets within (B, D) are scatter plots comparing the observed data (x-axis) against the bias-corrected modeled data (y-axis), illustrating the improved alignment post-correction.
Figures 2A, C focus on the initial comparison between the RegCM4 simulated data and the observed climate data, before the application of bias correction. In these panels, histograms represent the distribution of mean temperature (Figure 2A) and precipitation (Figure 2C) as simulated by RegCM4 against the actual observed data. The stark contrast in the histograms highlights the initial discrepancies between the model's output and real-world observations. The insets within these panels further detail this comparison by showing the cumulative distribution functions (CDFs) for both sets of data, with the observed data depicted by a dark gray line and the RegCM4 simulated data by a light gray line, visually quantifying the initial bias in the model's simulations.
Figures 2B, D demonstrate the effectiveness of the QM bias correction, showcasing the improved alignment of the RegCM4 model's output with observed data for temperature and precipitation, respectively, after correction. The dark gray histograms in these panels represent the bias-corrected model data, which now closely mirrors the distribution of the observed data, indicating a significant reduction in bias. The scatter plots inset in these panels compare the observed data (on the x-axis) with the bias-corrected modeled data (on the y-axis), directly illustrating the enhanced agreement between the model outputs and observations post-correction, as evidenced by the proximity of data points to the line of perfect agreement.
A detailed analysis of the bias periods prior to the application of the Quantile Mapping (QM) bias correction method uncovered several uncertainties within the dataset. These uncertainties primarily arose from the model's initial inability to accurately capture extreme weather events, such as uncharacteristically high precipitation during short periods or unexpected temperature spikes, which are critical for assessing climate variability and change. Additionally, discrepancies in the temporal distribution of climatic events, where the model either overpredicted or underpredicted the occurrence of certain weather patterns compared to the observed data, were noted. These inconsistencies suggest a limitation in the model's representation of local climatic conditions, possibly due to the coarse resolution of input data or the model's parameterization of atmospheric processes.
Furthermore, the analysis indicated variability in the model's performance across different time scales, with a tendency to underestimate the intensity of seasonal variations in temperature and precipitation. This underestimation could lead to inaccuracies in long-term climate projections, particularly in forecasting the magnitude of extreme climatic events and their potential impacts on the ecosystem and human activities.
However, after applying the QM bias correction, we observed a substantial improvement in the model's alignment with observed data, as reflected by an R2 value of 0.99 for both temperature and precipitation (Table 2). This indicates a near-perfect fit between the corrected model outputs and the observed values, highlighting the QM method's effectiveness in addressing these uncertainties. Despite this improvement, the Root Mean Square Error (RMSE) for temperature remained higher than desired, although it fell within the thresholds suggested by Gaydon et al. (2017) as indicative of good model predictions. This remaining variance in the temperature data, even post-correction, underscores the inherent challenges in perfectly modeling complex climatic systems and emphasizes the importance of ongoing model refinement and validation.
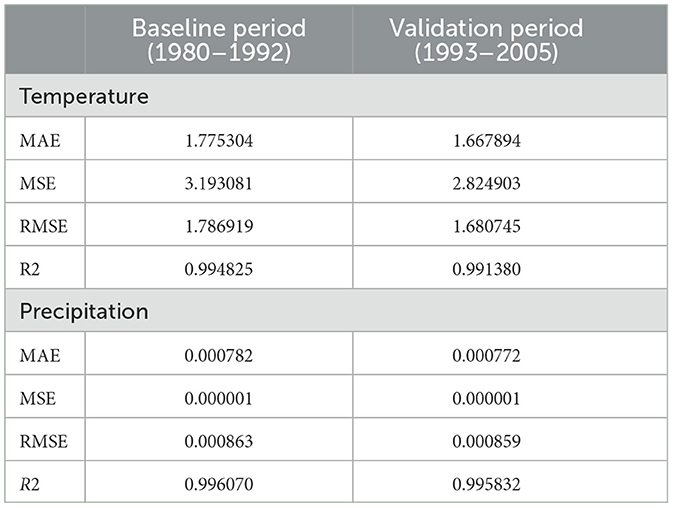
Table 2. Statistical analysis of the ERA5 and RegCM4 bias-corrected daily air mean temperature (°C) and precipitation (mm) for bias correction and validation.
3.2 Present climate analysis
The contemporary climatological assessment underscores significant regional variations in temperature and precipitation patterns across Ecuador, reflecting the diverse altitudinal and geographical landscape of the country. The Highlands (HL) region, characterized by its cooler climate, exhibits the lowest mean minimum temperature (Tmin) at 10.66°C, whereas the Coastal (CO) region records the highest Tmin at 18.46°C, followed by the Amazon (AM) region with a mean Tmin of 16.37°C (Figure 3).
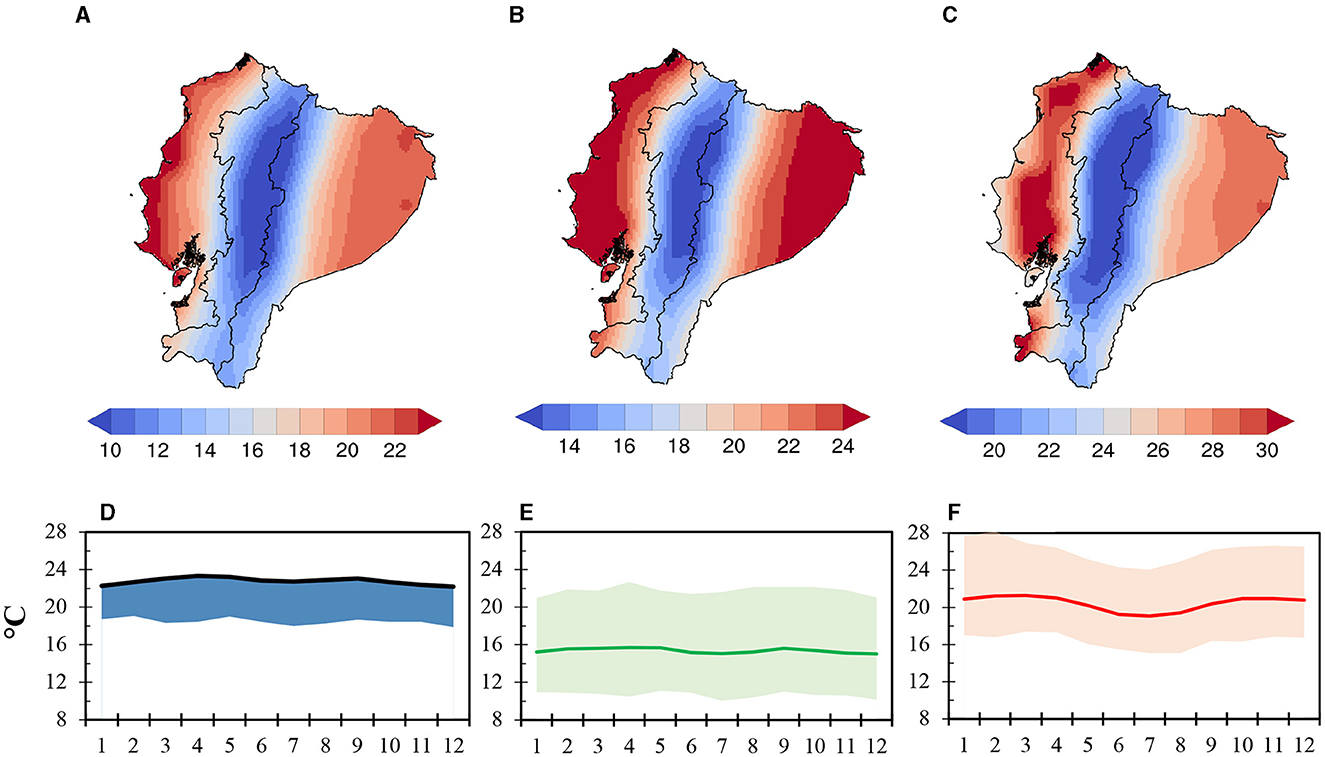
Figure 3. Spatial distribution of mean minimum, mean, and maximum temperatures across Ecuador. (A–C) Map out the Tmin, Tmean, and Tmax, while (D–F) depict the annual temperature cycle for the CO, HL, and AM regions, respectively. Solid lines represent the mean monthly precipitation, while the colored area around the line indicates the range of variability.
Our analysis extends beyond temperature disparities, delving into the variations of maximum temperatures across the regions. The CO region's monthly average maximum temperatures range from 26.3°C in January to 28.9°C in April, illustrating not only the thermal diversity but also the interplay between geographical positioning and climatic influences. Similarly, the HL and AM regions exhibit their own distinct temperature profiles, shaped by their unique environmental and topographical contexts.
These findings not only highlight the distinct climatic characteristics of each region but also illuminate the complex dynamics at play, influenced by factors such as the Andes cordillera and the Amazon basin. The variation in mean maximum temperatures—29.14°C for CO, 21.78°C for HL, and 26.13°C for AM—hihglights the intricate role of regional geography in defining climate regimes.
The annual temperature cycles for CO and HL demonstrate relatively stable values, underscoring a degree of predictability within these regions' climate systems. In contrast, the AM region experiences more pronounced fluctuations, particularly cooler temperatures during the austral winter, highlighting the region's unique climatic sensitivity.
In terms of precipitation, the analysis reveals a pronounced disparity across the regions, with CO experiencing considerably less rainfall than HL and AM. This precipitation pattern, especially CO's peak rainfall coinciding with the southern migration of the Intertropical Convergence Zone (ITCZ), underscores the interplay between geographical location, topographical barriers, and atmospheric dynamics (Figure 4).
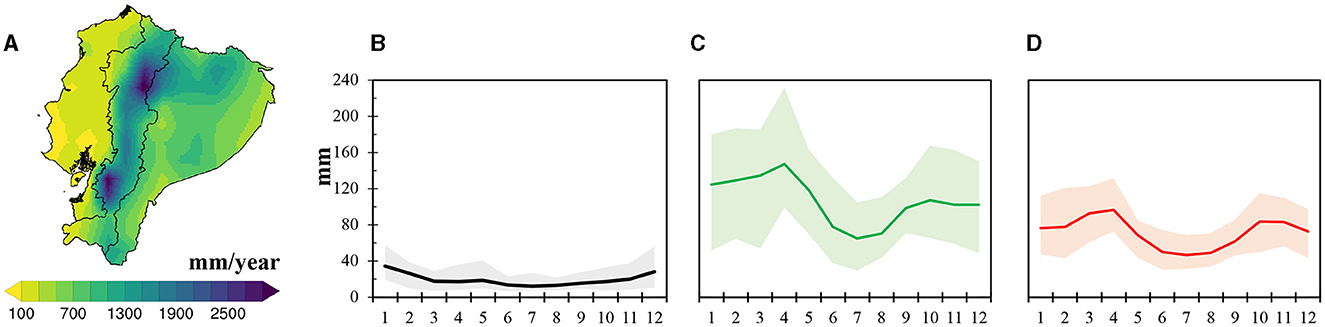
Figure 4. (A) Shows a map of Ecuador with a color gradient representing the annual precipitation rate in millimeters per year. (B–D) Present the monthly precipitation distributions for the CO, HL, and AM regions, respectively. Solid lines represent the mean monthly precipitation, while the colored area around the line indicates the range of variability.
3.3 Future climate projections
3.3.1 Precipitation changes
Climate projections based on the Representative Concentration Pathways (RCPs) indicate significant variability in future precipitation patterns across Ecuador, illustrating how shifts in global climate dynamics are likely to impact regional hydrological cycles. For the RCP 2.6 scenario, projections suggest an increase in mean precipitation by 19.12mm for the CO region, signifying a potential enhancement in water availability. In contrast, the HL and AM regions are anticipated to experience reductions in mean precipitation, with decreases of 22.03 and 24.54mm, respectively. These changes underscore the differential impacts of climate change on regional precipitation regimes, with implications for water resource management, agriculture, and biodiversity conservation.
Under more intensive greenhouse gas emission scenarios, RCP 4.5 and RCP 8.5, the projected trends become more pronounced. In the HL and AM regions, the drier months of June, July, and August could see mean reductions in precipitation of up to 47.83mm, signaling a heightened risk of drought and its associated impacts on ecosystems and human livelihoods. Conversely, the CO region could witness an increase in monthly precipitation by up to 20% under RCP 2.6, while projections for the AM region indicate substantial increases, potentially exceeding 50% during the wetter months of August, September, and October.
These projections highlight the complexity and variability of climate change impacts across Ecuador's distinct ecological zones. The potential for increased precipitation in some regions contrasts sharply with reductions in others, presenting challenges and opportunities for regional planning and adaptation strategies. Understanding these trends is critical for preparing for future hydrological changes, ensuring sustainable water resource management, and mitigating the adverse effects of climate variability on vulnerable communities and ecosystems.
3.3.2 Temperature variations
Projected temperature increases across Ecuador's regions under future climate scenarios suggest significant warming, with the most pronounced changes expected under RCP 8.5. The Highlands (HL) region, in particular, is anticipated to experience the largest increase in maximum temperatures (Tmax), with a projected rise of 4.68°C. This significant warming during the mid-year months will accentuate the region's already warm season, potentially exacerbating heat-related stresses on ecosystems and human health. Similarly, the Coastal (CO) region is forecasted to witness an average increase in Tmax of 3.93°C, with the peak warming reaching 4.20°C relative to the reference period.
3.3.3 Regional implications
The projected climatic shifts carry profound implications for Ecuador's diverse ecosystems and socio-economic sectors. The Andes, facing the greatest temperature variations, may see impacts on its unique biodiversity, including shifts in species distributions and altered phenological patterns, which could, in turn, affect ecosystem services and agriculture. Such temperature increases are also likely to impact water availability, particularly through changes in snowpack and glacial melt rates, posing significant challenges for water resource management.
In the Amazon, the anticipated decrease in precipitation, coupled with significant temperature rises, poses critical challenges for the region's water resources, biodiversity, and indigenous communities. These changes threaten the integrity of the Amazon rainforest ecosystem, emphasizing the urgent need for comprehensive adaptive measures to mitigate the adverse effects of climate change.
Figures 5, 6 illustrate the projected spatial distribution of temperature and precipitation changes across Ecuador, providing a visual understanding of the differential impacts of climate change. These projections underscore the necessity for targeted adaptation and mitigation strategies to address the anticipated climatic changes, safeguarding biodiversity, ensuring water security, and supporting sustainable agricultural practices across the country's varied landscapes.
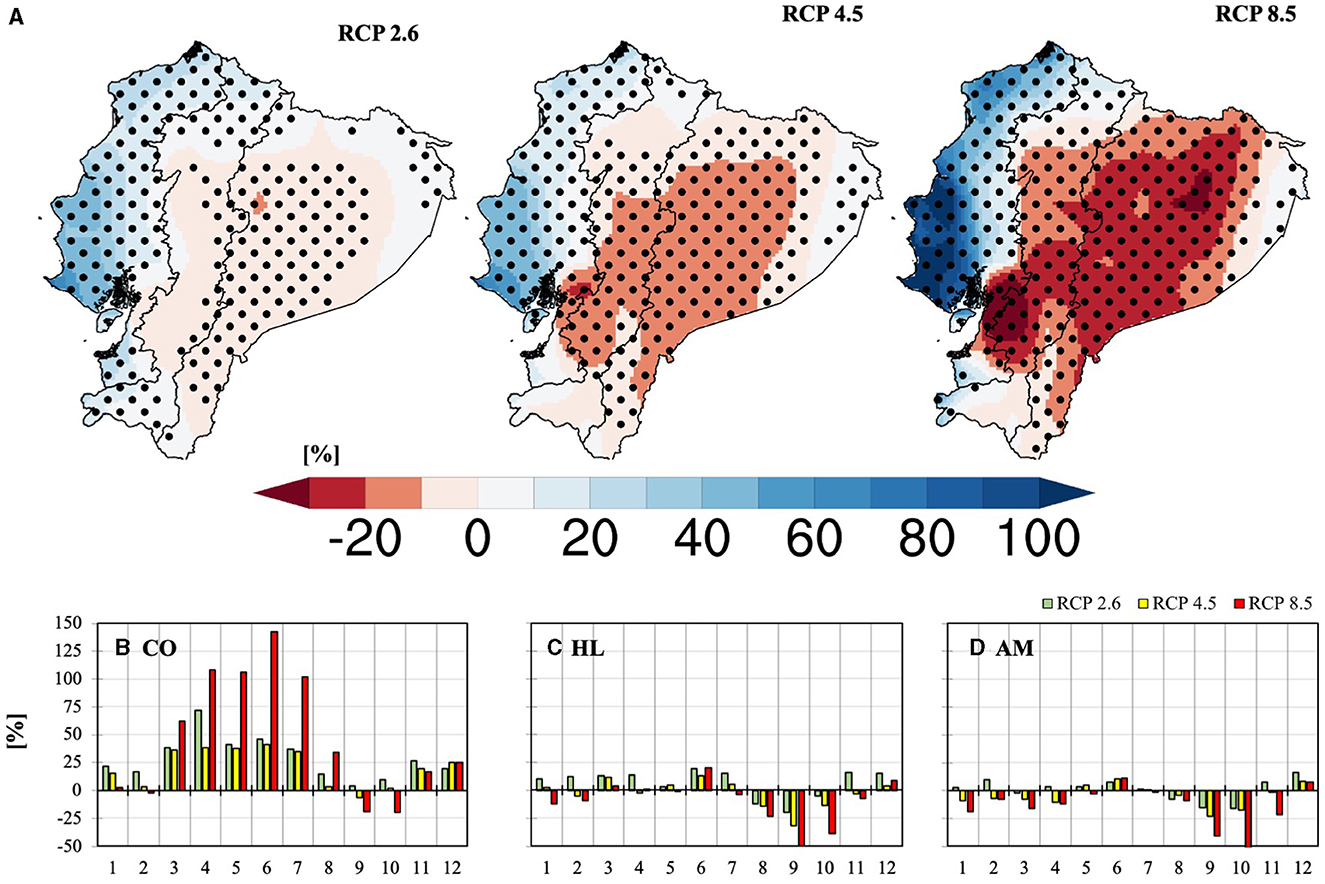
Figure 5. Spatial distribution of projected precipitation changes (%) (RegCM4 driven by the HadGEM2) under RCP 2.6, RCP 4.5, and RCP 8.5 (A) [based on RF (1975–2004) and FP (2070–2099)]. Bars represent changes in different regions [CO (B), HL (C), and AM (D)], and different RCPs [2.6 (green), 4.5 (yellow), and 8.5 (red)]. Significant differences at the 95% confidence level of changes are dotted.
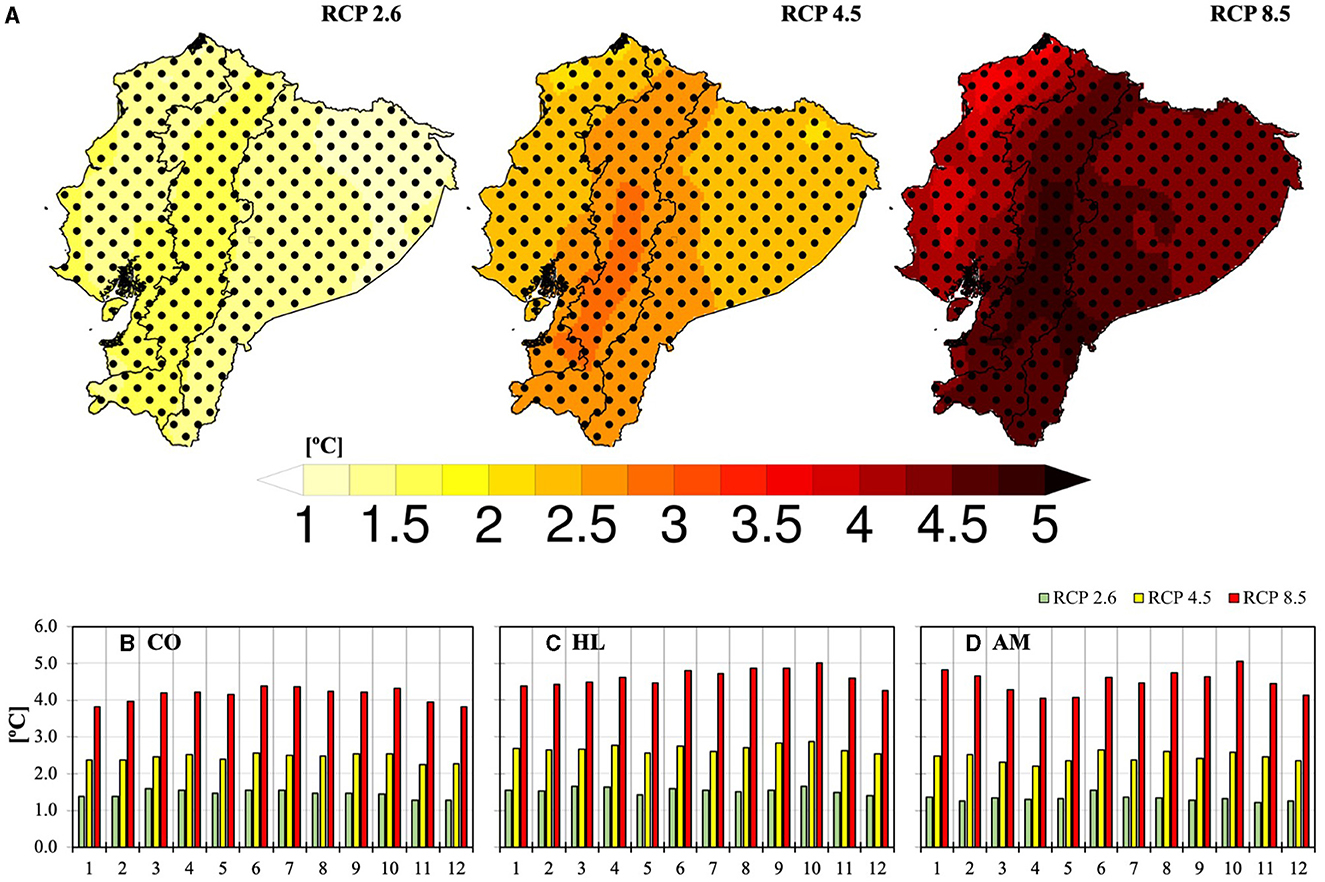
Figure 6. Spatial distribution of projected temperature changes (°C) (RegCM4 driven by the HadGEM2) under RCP 2.6, RCP 4.5, and RCP 8.5 (A) [based on RF (1975–2004) and FP (2070–2099)]. Bars represent changes in different regions [CO (B), HL (C), and AM (D)], and different RCPs [2.6 (green), 4.5 (yellow), and 8.5 (red)]. Significant differences at the 95% confidence level of changes are dotted.
3.4 Extreme climate indices
The analysis of extreme climate indices presents a nuanced perspective on how climate change might manifest in varying weather patterns across Ecuador.
3.4.1 Consecutive Dry Days
A notable west-to-east gradient in Consecutive Dry Days (CDD) is apparent, with the CO region exhibiting a drier pattern, ranging from 160 to 200 days (Figure 7A). In contrast, both the HL and AM regions experience fewer dry days, typically <100. Under RCP 2.6, projections suggest an increase in CDD for HL and AM, indicating drier conditions are likely to become more prevalent. This trend intensifies under RCP 4.5 and RCP 8.5 (Figure 7B), with CDD increasing by up to 60% in HL and 100% in AM, while CO experiences a reduction in dry days by 40% under RCP 8.5, suggesting a shift toward wetter conditions.
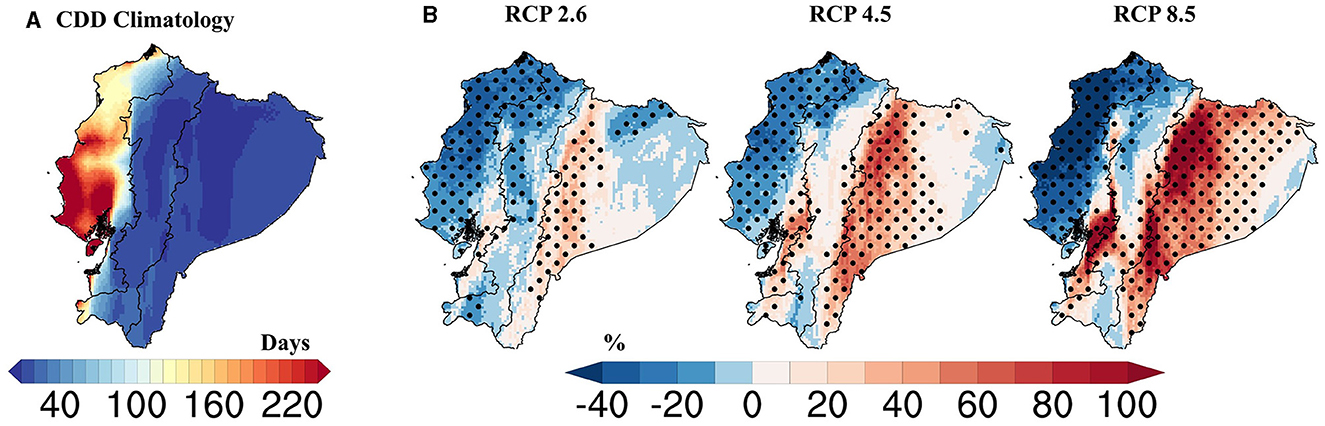
Figure 7. Climatological (A) and projected changes in Consecutive Dry Days (CDD) (RegCM4 driven by the HadGEM2) under RCP 2.6, RCP 4.5, and RCP 8.5 (B) [Based on RF (1975–2004) and FP (2070–2099)]. Significant differences at the 95% level of changes are dotted.
3.4.2 Warm Spell Duration Index
The Warm Spell Duration Index (WSDI) shows a higher frequency of occurrence in CO, with events lasting up to 12 days. However, under RCP 2.6, a significant increase of ~180% is projected for AM, reflecting more pronounced warm spells (Figure 8A). Under RCP 4.5 and 8.5 (Figure 8B), this pattern is expected to extend to central HL and most of AM, further illustrating the anticipated increase in extreme temperature events.
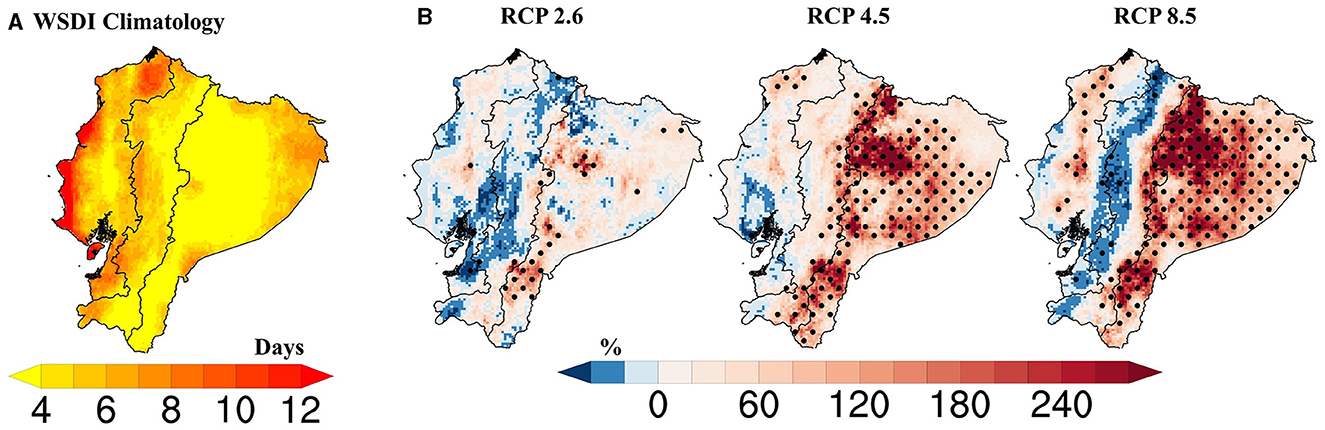
Figure 8. Historical Warm Spell Duration Index (WSDI) (A) and projected changes (RegCM4 driven by the HadGEM2) under RCP 2.6, RCP Q23 4.5, and RCP 8.5 (B) [based on RF (1975–2004) and FP (2070–2099)]. Significant differences at the 95% level of changes are dotted.
3.4.3 Diurnal Temperature Range
The Diurnal Temperature Range (DTR) presents higher variability within central CO, ranging from 2 to 12°C, indicative of the region's climatic dynamics (Figure 9A). Under RCP 2.6, a decrease in DTR is observed for CO and AM, while HL experiences a slight increase, indicating a potential narrowing of the temperature range. Projections for RCP 4.5 and 8.5 (Figure 9B) suggest further alterations, with HL and AM showing an increase in DTR, particularly under the most extreme RCP 8.5 scenario.
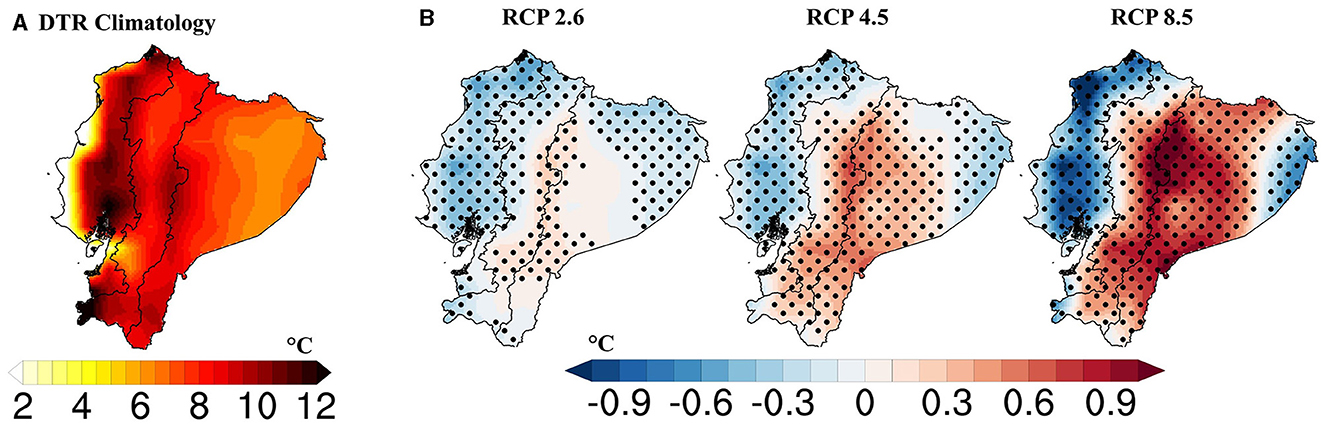
Figure 9. Diurnal Temperature Range (DTR) climatology (A) and expected changes (RegCM4 driven by the HadGEM2) under RCP 2.6, RCP 4.5, and RCP 8.5 (B) [Based on RF (1975–2004) and FP (2070–2099)]. Significant differences at the 95% level of changes are dotted.
4 Discussion
These shifts in extreme climate indices are critical indicators of potential impacts on the region's ecosystems and human activities. Increased CDD could exacerbate water scarcity issues, while more frequent WSDI events could challenge existing agricultural practices. The variations in DTR may influence natural habitats and biodiversity, particularly in sensitive ecological zones. The data underscore the urgency for adaptive strategies to mitigate the adverse effects of these projected changes.
Climate change projections come with inherent uncertainties, a reality that underscores the complexity of predicting future climate conditions. While General Circulation Models (GCMs) offer invaluable insights into global climate dynamics, their application at regional scales introduces uncertainties, especially in predicting seasonal temperature variations (Zhang and Chen, 2021; Wu et al., 2022). These uncertainties extend beyond the magnitude of temperature and precipitation changes, encompassing their spatial distribution as well. Such distinctions are critical for assessing climate change impacts on ecological systems and human societies, necessitating a nuanced interpretation of model outputs to inform effective adaptation and mitigation strategies.
According to the Intergovernmental Panel on Climate Change (IPCC), future scenarios indicate an increase in mean annual precipitation and temperature worldwide, with temperatures expected to rise by 2 to 3°C by the mid-21st century and 3 to 5°C toward its end (Hood, 2019; Noél et al., 2021). Consistent with these global projections, our analysis for Ecuador forecasts mean seasonal temperature increases ranging from 2.3 to 6°C across different climatic regions by the latter half of the century, relative to historical baselines. This trend aligns with the global pattern of warming, yet underscores the regional nuances of climate change impacts. By delineating these expected temperature rises within Ecuador's diverse ecological landscapes, our study contributes to a more localized understanding of global climate dynamics, emphasizing the importance of region-specific analyses in climate science.
Support for our findings comes from research such as Asmamaw et al. (2019), which noted temperature increases of 2–3°C in the Highlands (HL) region, paralleling our projections for Ecuador. Nonetheless, the variability inherent in climate predictions calls for a nuanced interpretation. For example, Demaria et al. (2013)'s work on the Alpine region of Chile provides temperature forecasts under different climate conditions, underscoring the potential for variability when comparing distinct geographical and climatic zones. This disparity in model outcomes highlights the critical need for localized analyses that account for the unique regional climate dynamics, illustrating that one-size-fits-all approaches to climate prediction may overlook crucial local variations.
Acknowledging these uncertainties, our discussion seeks to connect these climate projections to their tangible impacts on Ecuador's diverse ecological systems and human activities. The potential for increased temperatures and shifts in precipitation patterns warrant a detailed examination of how these changes could affect the country's rich biodiversity, agricultural sectors, and water resources. Emphasizing a cautious approach in interpreting model outputs is paramount, as is the necessity to underpin climate adaptation and mitigation strategies with comprehensive localized studies. This strategy ensures that actions taken are closely aligned with the specific needs and conditions of Ecuador's varied landscapes, thereby enhancing resilience and sustainability in the face of climate change challenges.
The projected rise in global temperatures, as detailed in our study's findings, is set to induce significant variations in both human and natural systems. These changes manifest as extreme weather events, sea-level rise, and biodiversity loss, which collectively pose substantial risks to vulnerable populations. This scenario is particularly pertinent to Ecuador, a low- and middle-income tropical country, where our results indicate notable increases in temperatures and shifts in precipitation patterns across its diverse regions. Such climatic shifts are likely to exacerbate food security challenges, a concern that resonates with global observations on climate change's detrimental impacts on agricultural productivity and food security (Pachauri et al., 2014; Mysiak et al., 2016).
Recent studies, including those focusing on regions with climatic and socio-economic conditions similar to Ecuador, like Tamil Nadu in India, reinforce the urgency of addressing accelerating pace of climate change. These studies predict significant declines in the yields of key crops such as rice, maize, black gram, and red gram under various RCP scenarios, especially under higher emission pathways (Geethalakshmi et al., 2023). This trend is expected to be mirrored in Ecuador, where our climate projections under RCP 8.5 suggest substantial temperature increases and variable precipitation patterns, likely impacting agricultural productivity adversely. The methodological diversity of these studies, spanning biophysical and economic models, echoes the complex nexus between climate change and agricultural systems.
While our projections indicate an uptick in CO2 levels and air temperatures across Ecuador, it's important to note that such changes might initially boost the yield of certain crops in specific locales. However, the ostensibly beneficial effects of elevated CO2 concentrations on crop growth are likely to be tempered, if not wholly negated, by the adverse impacts of rising temperatures, increased water scarcity, and nutrient limitations (Ainsworth and Long, 2021). This dynamic is of particular concern for Ecuador, given the paramount importance of agriculture both as a vital economic pillar and as means of subsistence for a significant portion of the population.
The Representative Concentration Pathways (RCPs) developed by the IPCC, projecting various levels of radiative forcing by the year 2100, serve as critical tools for scientific analysis and guide policy formulation (Li et al., 2019). Nonetheless, the inherent uncertainties associated with climate model projections present challenges, especially for agricultural planning and decision-making. To mitigate these uncertainties, the adoption of a multi-model ensemble approach in assessing the impacts of climate change on crop productivity is advocated. Such an approach not only enhances the robustness of impact assessments but is particularly recommended for Ecuador, where nuanced and precise predictions are crucial for safeguarding the agricultural sector (Jägermeyr et al., 2021).
Furthermore, our results on temperature variations also bring to the forefront the vulnerability of Ecuador's tropical dry forests—an ecosystem with diverse and vulnerable species and a range of ecosystem services. These forests are at significant risk from the projected increases in temperature, underscoring a gap in current research and the necessity for comprehensive studies to assess their vulnerability and resilience to climate change (Aguirre et al., 2017; Portalanza et al., 2019). The anticipated temperature anomalies could exacerbate the stress on these already under-researched ecosystems, making it imperative to integrate climate change considerations into conservation and management strategies. This approach would not only safeguard biodiversity but also preserve the ecosystem services vital for local communities and the broader environmental stability of Ecuador.
Ecuador's highlands and Amazonian regions, celebrated for their remarkable biodiversity, are undergoing climatic shifts that pose significant risks to their ecological integrity. The anticipated distributional shifts in species, driven by climate change, highlight the critical need for strategic conservation efforts to safeguard these unique ecosystems (Iturralde-Pólit et al., 2017). Proactive measures, including habitat restoration and the expansion of protected area networks, emerge as indispensable strategies for preserving Ecuador's rich biodiversity. Such initiatives are especially crucial in mitigating the adverse effects of climate change and ensuring the resilience of these vital ecological zones.
Moreover, climate-induced changes in agricultural practices are anticipated across tropical latitudes, spurred by rising temperatures and alterations in rainfall patterns. Particularly in the highlands of Ecuador, a projected decrease in precipitation could severely impact water resources, posing challenges to urban water supply and hydroelectric generation (Buytaert et al., 2009; Lawrence and Vandecar, 2015; Ovalle-Rivera et al., 2015; Carvajal and Li, 2019). Our study aligns with these observations, revealing significant vulnerabilities in specific ecosystems under the RCP 8.5 scenario. Notably, an increase in the number of Consecutive Dry Days (CDD) and the Warm Spell Duration Index (WSDI) underlines the potential for exacerbated vulnerabilities in tropical ecosystems. Such findings underscore the imperative to integrate climate change projections into water resource management and agricultural planning in Ecuador. By acknowledging and preparing for these challenges, Ecuador can enhance the sustainability and resilience of its agricultural sector and broader environmental health in the face of impending climatic changes (Falkland and White, 2020; Naranjo-Silva et al., 2023).
The anticipated temperature and precipitation anomalies pose significant challenges for the Andean region, potentially driving distributional shifts in both biodiversity and agricultural practices. The projected warming, particularly pronounced at higher altitudes, presents a tangible threat to high-altitude species and may compromise the natural barriers mountains provide against species migration (Ghalambor, 2006; Horgan et al., 2023). While urban areas such as Quito and Guayaquil are considered to have lower vulnerability to these changes, it is imperative to recognize that a considerable segment of Ecuador's population resides in regions that are highly sensitive to the impacts of climate change (Fernandez et al., 2015; Manchego et al., 2017).
In response to these projected changes, Ecuador is at a critical juncture to implement comprehensive adaptation strategies aimed at safeguarding its rich biodiversity and ensuring the sustainability of agricultural practices. Key to these strategies is sustainable water resource management, which is paramount for maintaining water availability and quality in light of anticipated climatic shifts (Al-Jawad et al., 2019; Xiang et al., 2021). Proactive measures, informed by the detailed projections provided in our study, are essential to enhancing the resilience of Ecuador's ecosystems and human communities. By embracing adaptive management practices, Ecuador can navigate the complexities of future climate scenarios, mitigating the adverse effects on its environment and populace, and setting a precedent for climate resilience in the region.
5 Conclusions
The future climate of Ecuador, as elucidated by our study, presents significant challenges and opportunities at a pivotal moment for the nation's ecological integrity and socio-economic resilience. Our research forecasts notable increases in temperature and shifts in precipitation patterns, with wide-ranging implications for Ecuador's rich biodiversity, agricultural sustainability, and energy production systems. These projections underscore the critical importance of devising and implementing comprehensive adaptation and mitigation strategies tailored to the unique conditions of Ecuador.
Central to our findings is the vulnerability of the highlands and Amazonian regions, renowned for their exceptional biodiversity. The potential for ecological disturbances in these areas highlights the urgent need for Ecuador to enhance its conservation efforts and enact robust policies to protect its natural heritage in the face of climatic shifts. Moreover, the anticipated changes in climate conditions call for the adoption of resilient agricultural practices, especially within the tropical dry forests and other regions at risk, to ensure food security and support livelihoods amid increasing thermal stress and rainfall variability.
The projected climatic changes also pose significant challenges to Ecuador's hydrological systems, which are foundational to the nation's hydropower generation and freshwater resources. In response, diversifying the renewable energy mix and implementing water-conservation measures are imperative to uphold energy security and manage water resources effectively. This study emphasizes the indispensable role of multidisciplinary research, informed policymaking, and community engagement in addressing climate change. Ecuador's path to climate resilience necessitates an integrative approach, combining scientific knowledge with inclusive governance and innovative adaptation practices. Through such synergistic efforts, Ecuador can navigate the intricacies of climate change, setting a precedent for sustainable development and resilience on a global scale.
In conclusion, Ecuador's response to climate change is a defining factor for its future. The collaboration among government bodies, civil society, and the scientific community is crucial in crafting a cohesive strategy that confronts the multifaceted challenges posed by climate change. By embracing a proactive and visionary stance, Ecuador can safeguard its environmental legacy and ensure the prosperity and wellbeing of its populace in an era of unprecedented climatic change.
Data availability statement
The raw data supporting the conclusions of this article will be made available by the authors, without undue reservation.
Author contributions
DP: Conceptualization, Data curation, Formal analysis, Validation, Writing – original draft, Writing – review & editing. MT: Formal analysis, Investigation, Validation, Writing – original draft. FR: Formal analysis, Investigation, Methodology, Writing – original draft. CZ: Formal analysis, Methodology, Software, Writing – review & editing. AD: Conceptualization, Investigation, Methodology, Validation, Writing – original draft, Writing – review & editing. FH: Conceptualization, Supervision, Visualization, Writing – original draft, Writing – review & editing. EA: Formal analysis, Investigation, Supervision, Writing – original draft, Writing – review & editing. SF: Conceptualization, Data curation, Formal analysis, Methodology, Project administration, Validation, Writing – original draft, Writing – review & editing.
Funding
The author(s) declare that no financial support was received for the research, authorship, and/or publication of this article.
Acknowledgments
Authors recognize the National Council for Scientific and Technological Development (CNPq, Brazil), the Coordination for the Improvement of Higher Education Personnel (CAPES, Brazil), also DP recognizes the Organization of American States (OAS) and the Coimbra Group of Brazilian Universities (GCUB), with the support of the Division of Educational Topics of the Ministry of Foreign Affairs of Brazil (MRE), on behalf of the OAS Partnerships Program for Education and Training (PAEC OAS-GCUB) for the Doctoral academic scholarship.
Conflict of interest
The authors declare that the research was conducted in the absence of any commercial or financial relationships that could be construed as a potential conflict of interest.
Publisher's note
All claims expressed in this article are solely those of the authors and do not necessarily represent those of their affiliated organizations, or those of the publisher, the editors and the reviewers. Any product that may be evaluated in this article, or claim that may be made by its manufacturer, is not guaranteed or endorsed by the publisher.
References
Aguirre, N., Eguiguren, P., Maita, J., Ojeda, T., Sanamiego, N., Furniss, M., et al. (2017). Potential impacts to dry forest species distribution under two climate change scenarios in Southern Ecuador. Neotrop. Biodivers. 3, 18–29. doi: 10.1080/23766808.2016.1258867
Ainsworth, E. A., and Long, S. P. (2021). 30 years of free-air carbon dioxide enrichment (face): what have we learned about future crop productivity and its potential for adaptation? Glob. Change Biol. 27, 27–49. doi: 10.1111/gcb.15375
Al-Jawad, J. Y., Alsaffar, H. M., Bertram, D., and Kalin, R. M. (2019). A comprehensive optimum integrated water resources management approach for multidisciplinary water resources management problems. J. Environ. Manage. 239, 211–224. doi: 10.1016/j.jenvman.2019.03.045
Asmamaw, M., Mereta, S. T., and Ambelu, A. (2019). Exploring households' resilience to climate change-induced shocks using climate resilience index in Dinki watershed, central highlands of Ethiopia. PLoS ONE 14:e0219393. doi: 10.1371/journal.pone.0219393
Ban, N., Caillaud, C., Coppola, E., Pichelli, E., Sobolowski, S., Adinolfi, M., et al. (2021). The first multi-model ensemble of regional climate simulations at kilometer-scale resolution, part I: evaluation of precipitation. Clim. Dyn. 57, 275–302. doi: 10.5194/egusphere-egu2020-22378
Buontempo, C., Hutjes, R., Beavis, P., Berckmans, J., Cagnazzo, C., Vamborg, F., et al. (2020). Fostering the development of climate services through copernicus climate change service (C3S) for agriculture applications. Weather Clim. Extr. 27:100226. doi: 10.1016/j.wace.2019.100226
Buytaert, W., Célleri, R., and Timbe, L. (2009). Predicting climate change impacts on water resources in the tropical andes: effects of gcm uncertainty. Geophys. Res. Lett. 36, n/a-n/a. doi: 10.1029/2008GL037048
Campozano, L., Trachte, K., Célleri, R., Samaniego, E., Bendix, J., Albuja, C., et al. (2018). Climatology and teleconnections of mesoscale convective systems in an Andean basin in southern Ecuador: the case of the Paute basin. Adv. Meteorol. 2018, 1–13. doi: 10.1155/2018/4259191
Carvajal, P. E., and Li, F. G. N. (2019). Challenges for hydropower-based nationally determined contributions: a case study for Ecuador. Clim. Policy 19, 974–987. doi: 10.1080/14693062.2019.1617667
Cheng, H., Yu, Q., Qi, Z., Bukovsky, M. S., Xue, L., Jin, V. L., et al. (2023). Simulating synergistic effects of climate change and conservation practices on greenhouse gas emissions and crop growth in long-term maize cropping systems. Comp. Electron. Agric. 215:108404. doi: 10.1016/j.compag.2023.108404
Collins, W. J., Bellouin, N., Doutriaux-Boucher, M., Gedney, N., Halloran, P., Hinton, T., et al. (2011). Development and evaluation of an earth-system model—hadGEM2. Geosci. Model Dev. 4, 1051–1075. doi: 10.5194/gmd-4-1051-2011
Demaria, E., Maurer, E., Thrasher, B., Vicuña, S., and Meza, F. (2013). Climate change impacts on an Alpine watershed in Chile: do new model projections change the story? J. Hydrol. 502, 128–138. doi: 10.1016/j.jhydrol.2013.08.027
Depledge, J. (2022). The “top-down” Kyoto Protocol? Exploring caricature and misrepresentation in literature on global climate change governance. Int. Environ. Agreements 22, 673–692. doi: 10.1007/s10784-022-09580-9
Dickinson, R., Errico, R., Giorgi, F., and Bates, G. (1989). A regional climate model for the western United States. Clim. Change 1, 383–422. doi: 10.1007/BF00240465
Dinh, K. D., Anh, T. N., Nguyen, N. Y., Bui, D. D., and Srinivasan, R. (2020). Evaluation of grid-based rainfall products and water balances over the Mekong River Basin. Remote Sens. 12:1858. doi: 10.3390/rs12111858
Eguiguren-Velepucha, P. A., Chamba, J. A. M., Aguirre Mendoza, N. A., Ojeda-Luna, T. L., Samaniego-Rojas, N. S., Furniss, M. J., et al. (2016). Tropical ecosystems vulnerability to climate change in Southern Ecuador. Trop. Conserv. Sci. 9:194008291666800. doi: 10.1177/1940082916668007
Emanuel, K. A. (1991). A scheme for representing cumulus convection in large-scale models. J. Atmosph. Sci. doi: 10.1175/1520-0469(1991)048<2313:ASFRCC>2.0.CO;2
Enayati, M., Bozorg-Haddad, O., Bazrafshan, J., Hejabi, S., and Chu, X. (2021). Bias correction capabilities of quantile mapping methods for rainfall and temperature variables. J. Water Clim. Change 12, 401–419. doi: 10.2166/wcc.2020.261
Falkland, T., and White, I. (2020). “Freshwater availability under climate change,” in Climate Change and Impacts in the Pacific. Springer Climate, ed. L. Kumar (Cham: Springer), 403–448. doi: 10.1007/978-3-030-32878-8_11
Fernandez, M. A., Bucaram, S. J., and Renteria, W. (2015). Assessing local vulnerability to climate change in Ecuador. Springerplus 4:738. doi: 10.1186/s40064-015-1536-z
Fuentes-Franco, R., Coppola, E., Giorgi, F., Graef, F., and Pavia, E. G. (2014). Assessment of RegCM4 simulated inter-annual variability and daily-scale statistics of temperature and precipitation over Mexico. Clim. Dyn. 42, 629–647. doi: 10.1007/s00382-013-1686-z
Gaydon, D., Balwinder-Singh, Wang, E., Poulton, P., Ahmad, B., Ahmed, F., et al. (2017). Evaluation of the APSIM model in cropping systems of Asia. Field Crop. Res. 204, 52–75. doi: 10.1016/j.fcr.2016.12.015
Geethalakshmi, V., Gowtham, R., Bhuvaneswari, K., Kumar, S. M., Priyanka, S., Rajavel, M., et al. (2023). Sustainable land-water-food nexus management: integrated modelling approach. J. Agrometeorol. 25, 61–67. doi: 10.54386/jam.v25i1.2052
Georgescu, M., Broadbent, A. M., and Balling Jr, R. C. (2022). Effect of increased greenhouse gas concentration on mean, extreme, and timing of precipitation over Arizona (USA). Int. J. Climatol. 42, 3776–3792. doi: 10.1002/joc.7444
Ghalambor, C. K. (2006). Are mountain passes higher in the tropics? Janzen's hypothesis revisited. Integr. Comp. Biol. 46, 5–17. doi: 10.1093/icb/icj003
Giorgi, F., and Anyah, R. O. (2012). The road towards Regcm4. Clim. Res. 52, 3–6. doi: 10.3354/cr01089
Guo, J., Huang, G., Wang, X., Li, Y., and Lin, Q. (2018). Dynamically-downscaled projections of changes in temperature extremes over China. Clim. Dyn. 50, 1045–1066. doi: 10.1007/s00382-017-3660-7
Heo, J.-H., Ahn, H., Shin, J.-Y., Kjeldsen, T. R., and Jeong, C. (2019). Probability distributions for a quantile mapping technique for a bias correction of precipitation data: a case study to precipitation data under climate change. Water 11:1475. doi: 10.3390/w11071475
Hersbach, H., Bell, B., Berrisford, P., Hirahara, S., Horányi, A., Muñoz-Sabater, J., et al. (2020). The ERA5 global reanalysis. Q. J. R. Meteorol. Soc. 146, 1999–2049. doi: 10.1002/qj.3803
Holtslag, A. A. M., De Bruijn, E. I. F., and Pan, H.-L. (1990). A high resolution air mass transformation model for short-range weather forecasting. Month. Weath. Rev. 118, 1561–1575. doi: 10.1175/1520-0493(1990)118<1561:AHRAMT>2.0.CO;2
Hood, R. (2019). “Global warming,” in A Companion to Applied Ethics (Oxford: Blackwell Publishing Ltd.), 674–684.
Horgan, F. G., Portalanza, D., Pelletier, Y., and Quiring, D. T. (2023). Taxonomic and ecogeographic predictors of resistance against phthorimaea operculella zeller in wild potato tubers. Potato Res. 66, 999–1021. doi: 10.1007/s11540-022-09611-7
Iturralde-Pólit, P., Dangles, O., Burneo, S. F., and Meynard, C. N. (2017). The effects of climate change on a mega-diverse country: predicted shifts in mammalian species richness and turnover in continental Ecuador. Biotropica 49, 821–831. doi: 10.1111/btp.12467
Jägermeyr, J., Müller, C., Ruane, A. C., Elliott, J., Balkovic, J., Castillo, O., et al. (2021). Climate impacts on global agriculture emerge earlier in new generation of climate and crop models. Nat. Food 2, 873–885. doi: 10.1038/s43016-021-00400-y
Jiang, Q., Li, W., Fan, Z., He, X., Sun, W., Chen, S., et al. (2021). Evaluation of the ERA5 reanalysis precipitation dataset over Chinese mainland. J. Hydrol. 595:125660. doi: 10.1016/j.jhydrol.2020.125660
Kim, Y.-H., Min, S.-K., Zhang, X., Sillmann, J., and Sandstad, M. (2020). Evaluation of the CMIP6 multi-model ensemble for climate extreme indices. Weather Clim. Extr. 29:100269. doi: 10.1016/j.wace.2020.100269
Komkoua Mbienda, A. J., Guenang, G. M., Kaissassou, S., Tchakoutio Sandjon, A., Tanessong, R. S., Matho Lontio, S. L., et al. (2022). Boundary layer schemes in the regional climate model RegCM4.6 over Central Africa. Clim. Dyn. 58, 691–709. doi: 10.1007/s00382-021-05928-0
Komkoua Mbienda, A. J., Guenang, G. M., Tanessong, R. S., Ashu Ngono, S. V., Zebaze, S., and Vondou, D. A. (2021). Possible influence of the convection schemes in regional climate model RegCM4.6 for climate services over Central Africa. Meteorol. Appl. 28:1980. doi: 10.1002/met.1980
Köppen, W. (1918). Classification of climates according to temperature, precipitation and seasonal cycle. Petermanns Geogr. Mitt. 64, 193–203.
Lafon, T., Dadson, S., Buys, G., and Prudhomme, C. (2013). Bias correction of daily precipitation simulated by a regional climate model: a comparison of methods. Int. J. Climatol. 33, 1367–1381. doi: 10.1002/joc.3518
Lawrence, D., and Vandecar, K. (2015). Effects of tropical deforestation on climate and agriculture. Nat. Clim. Chang. 5, 27–36. doi: 10.1038/nclimate2430
Li, H., Sheffield, J., and Wood, E. F. (2010). Bias correction of monthly precipitation and temperature fields from intergovernmental panel on climate change AR4 models using equidistant quantile matching. J. Geophys. Res. 115(D10):D10101. doi: 10.1029/2009JD012882
Li, M., Fu, Q., Singh, V. P., Ji, Y., Liu, D., Zhang, C., et al. (2019). An optimal modelling approach for managing agricultural water-energy-food nexus under uncertainty. Sci. Total Environ. 651, 1416–1434. doi: 10.1016/j.scitotenv.2018.09.291
Manchego, C. E., Hildebrandt, P., Cueva, J., Espinosa, C. I., Stimm, B., and Günter, S. (2017). Climate change versus deforestation: implications for tree species distribution in the dry forests of Southern Ecuador. PLoS ONE 12:e0190092. doi: 10.1371/journal.pone.0190092
Martínez-Castro, D., Vichot-Llano, A., Bezanilla-Morlot, A., Centella-Artola, A., Campbell, J., Giorgi, F., et al. (2018). The performance of RegCM4 over the Central America and Caribbean region using different cumulus parameterizations. Clim. Dyn. 50, 4103–4126. doi: 10.1007/s00382-017-3863-y
Meinshausen, M., Smith, S. J., Calvin, K., Daniel, J. S., Kainuma, M. L. T., Lamarque, J.-F., et al. (2011). The RCP greenhouse gas concentrations and their extensions from 1765 to 2300. Clim. Change 109, 213–241. doi: 10.1007/s10584-011-0156-z
Mistry, M. N. (2019). A high-resolution global gridded historical dataset of climate extreme indices. Data. doi: 10.3390/data4010041
Morán-Tejeda, E., Bazo, J., López-Moreno, J. I., Aguilar, E., Azorín-Molina, C., Sanchez-Lorenzo, A., et al. (2016). Climate trends and variability in Ecuador (1966-2011). Int. J. Climatol. 36, 3839–3855. doi: 10.1002/joc.4597
Mysiak, J., Surminski, S., Thieken, A., Mechler, R., and Aerts, J. (2016). Brief communication: Sendai framework for disaster risk reduction—success or warning sign for Paris? Nat. Hazards Earth Syst. Sci. 16, 2189–2193. doi: 10.5194/nhess-16-2189-2016
Naranjo-Silva, S., Punina-Guerrero, D., Rivera-Gonzalez, L., Escobar-Segovia, K., Barros-Enriquez, J. D., Almeida-Dominguez, J. A., et al. (2023). Hydropower scenarios in the face of climate change in Ecuador. Sustainability 15:10160. doi: 10.3390/su151310160
Noél, T., Loukos, H., Defrance, D., Vrac, M., and Levavasseur, G. (2021). A high-resolution downscaled CMIP5 projections dataset of essential surface climate variables over the globe coherent with the ERA5 reanalysis for climate change impact assessments. Data Brief 35:106900. doi: 10.1016/j.dib.2021.106900
Ovalle-Rivera, O., Läderach, P., Bunn, C., Obersteiner, M., and Schroth, G. (2015). Projected shifts in coffea arabica suitability among major global producing regions due to climate change. PLoS ONE 10:e0124155. doi: 10.1371/journal.pone.0124155
Pachauri, R. K., Allen, M. R., Barros, V. R., Broome, J., Cramer, W., Christ, R., et al. (2014). Climate Change 2014: Synthesis Report. Contribution of Working Groups I, II and III to the Fifth Assessment Report of the Intergovernmental Panel on Climate Change. IPCC. p. 151.
Pal, J. S., Small, E. E., and Eltahir, E. A. B. (2000). Simulation of regional-scale water and energy budgets: representation of subgrid cloud and precipitation processes within RegCM. J. Geophys. Res. 105, 29579–29594. doi: 10.1029/2000JD900415
Pareja-Quispe, D., Franchito, S. H., and Fernandez, J. P. R. (2021). Assessment of the RegCM4 performance in simulating the surface radiation budget and hydrologic balance variables in South America. Earth Syst. Environ. 5, 499–518. doi: 10.1007/s41748-021-00249-y
Pettorelli, N., Graham, N. A., Seddon, N., Maria da Cunha Bustamante, M., Lowton, M. J., Sutherland, W. J., et al. (2021). Time to integrate global climate change and biodiversity science-policy agendas. J. Appl. Ecol. 58, 2384–2393. doi: 10.1111/1365-2664.13985
Piani, C., Haerter, J. O., and Coppola, E. (2010). Statistical bias correction for daily precipitation in regional climate models over Europe. Theoret. Appl. Climatol. 99, 187–192. doi: 10.1007/s00704-009-0134-9
Portalanza, D., Barral, M., Villa-Cox, G., Ferreira-Estafanous, S., Herrera, P., Durigon, A., et al. (2019). Mapping ecosystem services in a rural landscape dominated by cacao crop: a case study for Los Rios province, Ecuador. Ecol. Indic. 107:105593. doi: 10.1016/j.ecolind.2019.105593
Reboita, M., Fernandez, J., Pereira Llopart, M., Porfirio da Rocha, R., Albertani Pampuch, L., and Cruz, F. (2014). Assessment of RegCM4.3 over the CORDEX South America domain: sensitivity analysis for physical parameterization schemes. Clim. Res. 60, 215–234. doi: 10.3354/cr01239
Sanabria, J., Carrillo, C. M., and Labat, D. (2019). Unprecedented rainfall and moisture patterns during el niño 2016 in the Eastern Pacific and tropical andes: Northern Peru and Ecuador. Atmosphere 10:768. doi: 10.3390/atmos10120768
Schinko, T., Karabaczek, V., Menk, L., and Kienberger, S. (2024). Identifying constraints and limits to climate change adaptation in Austria under deep uncertainty. Front. Clim. 6:1303767. doi: 10.3389/fclim.2024.1303767
Sheffield, J., Barrett, A. P., Colle, B., Nelun Fernando, D., Fu, R., Geil, K. L., et al. (2013). North american climate in CMIP5 experiments. Part I: evaluation of historical simulations of continental and regional climatology. J. Clim. 26, 9209–9245. doi: 10.1175/JCLI-D-12-00592.1
Solman, S. A., and Blázquez, J. (2019). Multiscale precipitation variability over South America: analysis of the added value of CORDEX RCM simulations. Clim. Dyn. 53, 1547–1565. doi: 10.1007/s00382-019-04689-1
Tapiador, F. J., Moreno, R., Navarro, A., Sánchez, J. L., and García-Ortega, E. (2019). Climate classifications from regional and global climate models: performances for present climate estimates and expected changes in the future at high spatial resolution. Atmosph. Res. 228, 107–121. doi: 10.1016/j.atmosres.2019.05.022
Tapiador, F. J., Navarro, A., Moreno, R., Sánchez, J. L., and García-Ortega, E. (2020). Regional climate models: 30 years of dynamical downscaling. Atmosph. Res. 235:104785. doi: 10.1016/j.atmosres.2019.104785
Tarek, M., Brissette, F. P., and Arsenault, R. (2020). Evaluation of the ERA5 reanalysis as a potential reference dataset for hydrological modelling over North America. Hydrol. Earth Syst. Sci. 24, 2527–2544. doi: 10.5194/hess-24-2527-2020
Teodoro, T. A., Reboita, M. S., Llopart, M., da Rocha, R. P., and Ashfaq, M. (2021). Climate change impacts on the South American monsoon system and its surface—atmosphere processes through RegCM4 CORDEX-CORE projections. Earth Syst. Environ. 5, 825–847. doi: 10.1007/s41748-021-00265-y
Thuiller, W., Guéguen, M., Renaud, J., Karger, D. N., and Zimmermann, N. E. (2019). Uncertainty in ensembles of global biodiversity scenarios. Nat. Commun. 10:1446. doi: 10.1038/s41467-019-09519-w
Van Vuuren, D. P., Edmonds, J., Kainuma, M., Riahi, K., Thomson, A., Hibbard, K., et al. (2011). The representative concentration pathways: An overview. Clim. Change 109, 5–31.
Vautard, R., Kadygrov, N., Iles, C., Boberg, F., Buonomo, E., Bülow, K., et al. (2021). Evaluation of the large euro-cordex regional climate model ensemble. J. Geophys. Res. Atmosph. 126:e2019JD032344. doi: 10.1029/2019JD032344
Workman, M., Dooley, K., Lomax, G., Maltby, J., and Darch, G. (2020). Decision making in contexts of deep uncertainty-an alternative approach for long-term climate policy. Environ. Sci. Policy 103, 77–84. doi: 10.1016/j.envsci.2019.10.002
Wu, Y., Miao, C., Fan, X., Gou, J., Zhang, Q., and Zheng, H. (2022). Quantifying the uncertainty sources of future climate projections and narrowing uncertainties with bias correction techniques. Earths Fut. 10:e2022EF002963. doi: 10.1029/2022EF002963
Xiang, X., Li, Q., Khan, S., and Khalaf, O. I. (2021). Urban water resource management for sustainable environment planning using artificial intelligence techniques. Environ. Impact Assess. Rev. 86:106515. doi: 10.1016/j.eiar.2020.106515
Keywords: Ecuador, climate change, climate projections, climate vulnerability, adaptation, coastal, highlands
Citation: Portalanza D, Torres M, Rosso F, Zuluaga CF, Durigon A, Horgan FG, Alava E and Ferraz S (2024) Climate variability and change in Ecuador: dynamic downscaling of regional projections with RegCM4 and HadGEM2-ES for informed adaptation strategies. Front. Clim. 6:1344868. doi: 10.3389/fclim.2024.1344868
Received: 26 November 2023; Accepted: 13 May 2024;
Published: 27 May 2024.
Edited by:
Edmundo Molina-Perez, Monterrey Institute of Technology and Higher Education (ITESM), MexicoReviewed by:
Luana Pampuch, São Paulo State University, BrazilYosune Miquelajauregui, National Autonomous University of Mexico, Mexico
Copyright © 2024 Portalanza, Torres, Rosso, Zuluaga, Durigon, Horgan, Alava and Ferraz. This is an open-access article distributed under the terms of the Creative Commons Attribution License (CC BY). The use, distribution or reproduction in other forums is permitted, provided the original author(s) and the copyright owner(s) are credited and that the original publication in this journal is cited, in accordance with accepted academic practice. No use, distribution or reproduction is permitted which does not comply with these terms.
*Correspondence: Diego Portalanza, diegoportalanza@gmail.com; Eduardo Alava, eialava@espol.edu.ec; Malena Torres, amtorres@espol.edu.ec