Examining climate trends and patterns and their implications for agricultural productivity in Bagamoyo District, Tanzania
 Paschal Mugabe
 Harison Kipkulei
 Stefan Sieber
 Emmanuel Mhache6†
  Katharina Löhr
- 1College of Social Sciences, University of Dar es Salaam, Dar es Salaam, Tanzania
- 2Leibniz Centre for Agricultural Landscape Research, Müncheberg, Germany
- 3Faculty of Life Sciences, Humboldt-Universität zu Berlin, Berlin, Germany
- 4Department of Geomatic Engineering and Geospatial Information Systems, Jomo Kenyatta University of Agriculture and Technology, Nairobi, Kenya
- 5Faculty of Applied Computer Sciences, Institute of Geography, University of Augsburg, Augsburg, Germany
- 6Department of Geograpy, The Open University of Tanzania, Dar es Salaam, Tanzania
Climate variability impacts various global challenges, including food security, biodiversity loss, water scarcity, and human well-being. However, climate patterns and trends and community perceptions at spatially-explicit levels have been minimally addressed. The spatial and temporal trends of climate conditions in Bagamoyo District in Tanzania were examined using historical (1983–2010) and projected (2022–2050) meteorological and climate model data, respectively. Community knowledge and experiences of past climate occurrences were included. The implications of projected climate change for regional agricultural production and food security were assessed. The study drew on empirical data obtained from household surveys conducted in seven villages in the district. Effectively, 309 households were randomly sampled across the villages to provide the perception of climate change and associated impacts on agriculture and livelihoods. Both qualitative and quantitative statistical techniques were employed to analyse the incidence, frequency, and intensity of regional extreme climate events. The meteorological and climate modelling data were subjected to trend analysis using the Mann–Kendall and Sen’s slope estimator tests, and the present and projected spatial and temporal trends of climatic variables in the region were analysed. The household-based questionnaire results were combined with climate modelling and the literature to determine the implications of climate change for regional agricultural production and food security. The results revealed that local knowledge and climate model data strongly concur on regional climate changes. Furthermore, the region is highly likely to experience increased warming and decreased precipitation at varying magnitudes. The shifts in climate trends and patterns are anticipated to greatly impact agricultural production, affecting livelihoods and hampering food security efforts. Recommendations include adopting context-specific measures and tailored strategies for enhancing resilience throughout the entire region.
1 Introduction
Climate change affects various facets of human and environmental systems. As one of the greatest threats of the 21st century, climate change has had a significant impact on the agricultural sector, which is the main source of food, feed, and fibre for both humans and animals. Climate change directly or indirectly affects the four pillars of food security (availability, access, utilization, and stability), according to the Food and Agricultural Organization (FAO) of the United Nations (UN) (Affoh et al., 2022). This is manifested in extreme climate change events that cause key crops to experience declines and instability productivity. These declines affect market prices, thus reducing food accessibility for the population. Furthermore, the nutritional quality of various food products is expected to decrease, affecting household food utilization (Mbow et al., 2020). Therefore, understanding the nexus between climate change and agricultural production is crucial for developing better climate change adaptation strategies and increasing agricultural system resilience.
The impact of climate change on agriculture and food security is a major concern globally. Climate change is expected to disproportionately affect different regions based on geographical location, underlying weather conditions, economic capacity, and technological capabilities (Kogo et al., 2021). Developing regions will experience more impacts than their developed counterparts, largely due to insufficient social safety nets, lack of proper infrastructure, low technology uptake, and inadequate policy instruments to handle climate change-related challenges. Sub-Saharan Africa (SSA) accounts for most of these developing economies, which experience frequent climate extremes. The region relies heavily on rainfed agriculture, which is highly sensitive to weather and climate variables, including temperature and precipitation (Kotir, 2011). This dependence increases the vulnerability of its population to climate change effects amidst the very low adaptive capacity in the region (Parry et al., 2007). Climatic trends indicate that this region is already experiencing increased warming compared with other parts of the world, in addition to intensified aridity, land degradation, and highly variable rainfall (Serdeczny et al., 2017).
Climate models have emerged as useful tools for projecting future climates. These models provide information on likely precipitation and temperature conditions in the future under changing demographic conditions, elevated carbon dioxide emissions, increased urbanization, and technological shifts. These models have been used to project climate change dynamics in various regions of the world. Despite multiple uncertainties, climate models project varying patterns and trends for climatic variables. In SSA, for instance, climate models project drier states in the southern region and highly variable and reduced rainfall in West Africa (Kotir, 2011). However, these models lack consensus regarding future precipitation changes in the East Africa (EA) region (Choi et al., 2023). The EA region comprises the greater horn of Africa, which in the recent past has witnessed frequent droughts and persistent food shortages (Nicholson, 2014). Furthermore, the region experiences low potential and high temporal variability in groundwater resources (Agutu et al., 2019). These climate shortcomings have propagated resource conflicts and contributed to humanitarian crises across the region (Scheffran et al., 2019). The EA region is characterized by a highly heterogeneous landscape in terms of soil, vegetation, and topographic characteristics (Thornton et al., 2010). These conditions shape the underlying climate and its effect on agricultural production and livelihood. Over the years, the region has faced severe climate change effects manifested in the form of droughts, heat waves, and floods. Various factors, including proximity to the equator, shifts in the intertropical convergence zone (ITCZ), varied topography, and remote teleconnections, namely, the El Niño–Southern Oscillation and the Indian Ocean dipole, are responsible for climate dynamics and extremes in the region (Nicholson, 2019; Gebrechorkos et al., 2020; Palmer et al., 2023).
Climatic extremes are more pronounced in EA than in other parts of the SSA region. The region is familiar with rainfall-induced disasters and droughts and is considered a climate change hotspot (Thalheimer et al., 2021). The Ethiopian and Kenyan highlands and Lake Victoria region often experience high rainfall intensities, with frequent landslides (Onyutha, 2020). Similarly, in the last five years, countries such as Somalia, Kenya, and Ethiopia have experienced severe droughts that have plunged millions of people into severe hunger (Funk et al., 2023). Furthermore, rainfall deficits have been observed in Kenya, Somalia, and Ethiopia (Devi, 2022). These climate extremes have increased the frequency of crop failures, escalated livestock deaths, and amplified regional food insecurity (Devi, 2022). Additionally, extreme climate events have favoured swarm formation and the spread of pests such as desert locusts (Meynard et al., 2020). Pest outbreaks have occurred in Djibouti, Eritrea, Ethiopia, Kenya, Somalia, South Sudan, and Uganda, causing damage to large tracts of croplands (Kassegn and Endris, 2021). All these conditions have affected agricultural production and exacerbated prevailing food insecurity in the region (Omambia and Gu, 2010).
Similarly, Tanzania has been subjected to rising temperatures in recent years (Block et al., 2022). Furthermore, it has experienced high variations in rainfall. These variations are strongly related to sea surface temperature (SST) variations in the Indian and Atlantic Oceans, which can alter standard oscillation outcomes (Paavola, 2003). Moreover, the climate of Tanzania is greatly influenced by El Niño and La Niña phases, with potentially severe consequences. El Niño refers to periods in which the sea surface temperature is warmer than normal in the eastern tropical Pacific Ocean, whereas La Niña is associated with low temperatures near the equator (Philander, 1985). In Tanzania, the first and second years of El Nino events result in less and more than usual amounts of rainfall, respectively. Rainfall decreases in the first year of La Niña and increases in the second year. This alteration results in flooding and drought, the most common climatic hazards in the country (Paavola, 2003). An analysis of accurate regional climatic databases shows that the east coast of Tanzania has been experiencing increasing drying events and a high frequency of mild and severe droughts (Gebrechorkos et al., 2020).
Climate models project an increase in maximum temperatures of 3.5°C in Tanzania. The minimum temperatures will also likely increase by up to 4.8°C (Luhunga et al., 2018). This increase might be experienced countrywide, albeit at different magnitudes. Furthermore, projections indicate mixed trends of precipitation patterns with no general pattern; precipitation intensity will increase in some regions and decrease in others (Adhikari et al., 2017; Gebrechorkos et al., 2019). Several studies have been carried out on various aspects of the Tanzanian climate (Mutai and Ward, 2000; Behera et al., 2005; Marchant et al., 2007); most have been conducted at the national scale. However, Arndt et al. (2012) reported that local-scale assessments are more effective and can optimally support adaptation policies that are usually context-based. Additionally, climate change effects are becoming more intense in coastal areas, predisposing Tanzania, which has an extensive coastline, to increased risks (Rubekie et al., 2022). The literature has focused more on inland regions and less on coastal environments. The latter environments face severe threats from climate change, including salt intrusions, rising sea levels, and flooding (Lyimo et al., 2013).
Additionally, climate change assessments at subnational scales in Tanzania have focused on a single season and thus have failed to reveal trends and dynamics across seasons (Mbilinyi et al., 2013). Furthermore, studies examining the implications of climate risks for agricultural production have focused extensively on household-level impacts (Shikuku et al., 2017). Most of these studies lack local-scale analysis, which involves extensive analysis at spatiotemporal scales. Therefore, the impacts of localized climate change on agricultural production and food security in the present and future have scarcely been addressed. We hypothesize that accounting for spatiotemporal influences via historical and projected climate change assessments will provide more localized insights and thus support better targeted site-specific strategies and better informed policies at both the local and regional levels. These strategies will include smart soil, water, and energy practices at agroecological zones, catchment scales, and regional levels that are tailored for enhancing the resilience of agricultural systems and improving agricultural production and food security.
Thus, the present study addresses these gaps by investigating historical and future climatic trends and integrating data from monitoring stations, high-resolution satellite data, and regional climate models (RCMs) to assess climate variability and trends in Bagamoyo District, Tanzania. This study is imperative since fluctuations in weather patterns along the coast play an important role in terrestrial and marine ecosystems, water supply, agriculture, human health, and other socioeconomic issues. To our knowledge, no study has integrated climatic aspects with agriculture and food security in the region and analysed the implications of future climates for agricultural productivity. Therefore, the objectives of this study, linked to the research gaps identified in the study, are to (i) analyse the historical and future climatic trends/patterns in Bagamoyo District in Tanzania, accounting for spatiotemporal influences; (ii) evaluate the modelling skills of regional climatic models using station data and high-resolution satellite data and assess model uncertainties in predicting climatic variables in the study area; (iii) examine the spatiotemporal influence of the historical climate on agriculture and food security, accounting for space and time implications; and (iv) analyse the spatiotemporal implications of future climatic trends/patterns on agriculture and food production to project future climate change influences at spatiotemporal scales.
2 Materials and methods
2.1 Study area
Bagamoyo district is located on the east coast of Tanzania and north of Dar es Salaam, a major commercial city in Tanzania. It is one of six districts in Tanzania’s coastal (“Pwani”) region. The study area is bounded by latitudes of 5° 48′ and 6° 26′ S and longitudes of 37° 48′ and 39° 08′ E (Figure 1). It borders the Tanga region to the north, Morogoro to the west, the Indian Ocean to the east, and Kibaha District to the south. The district has a total population of approximately 311,740 people, according to the 2012 census (Madumla et al., 2022). Before 2016, the district was politically subdivided into two parliamentary constituencies, namely, Chalinze and Bagamoyo, with seven divisions, 22 wards, and 97 villages. However, with the current changes in the political administration of the district, the Bagamoyo District Council has retained two divisions, 11 wards and eight villages (Gourt, 2016).
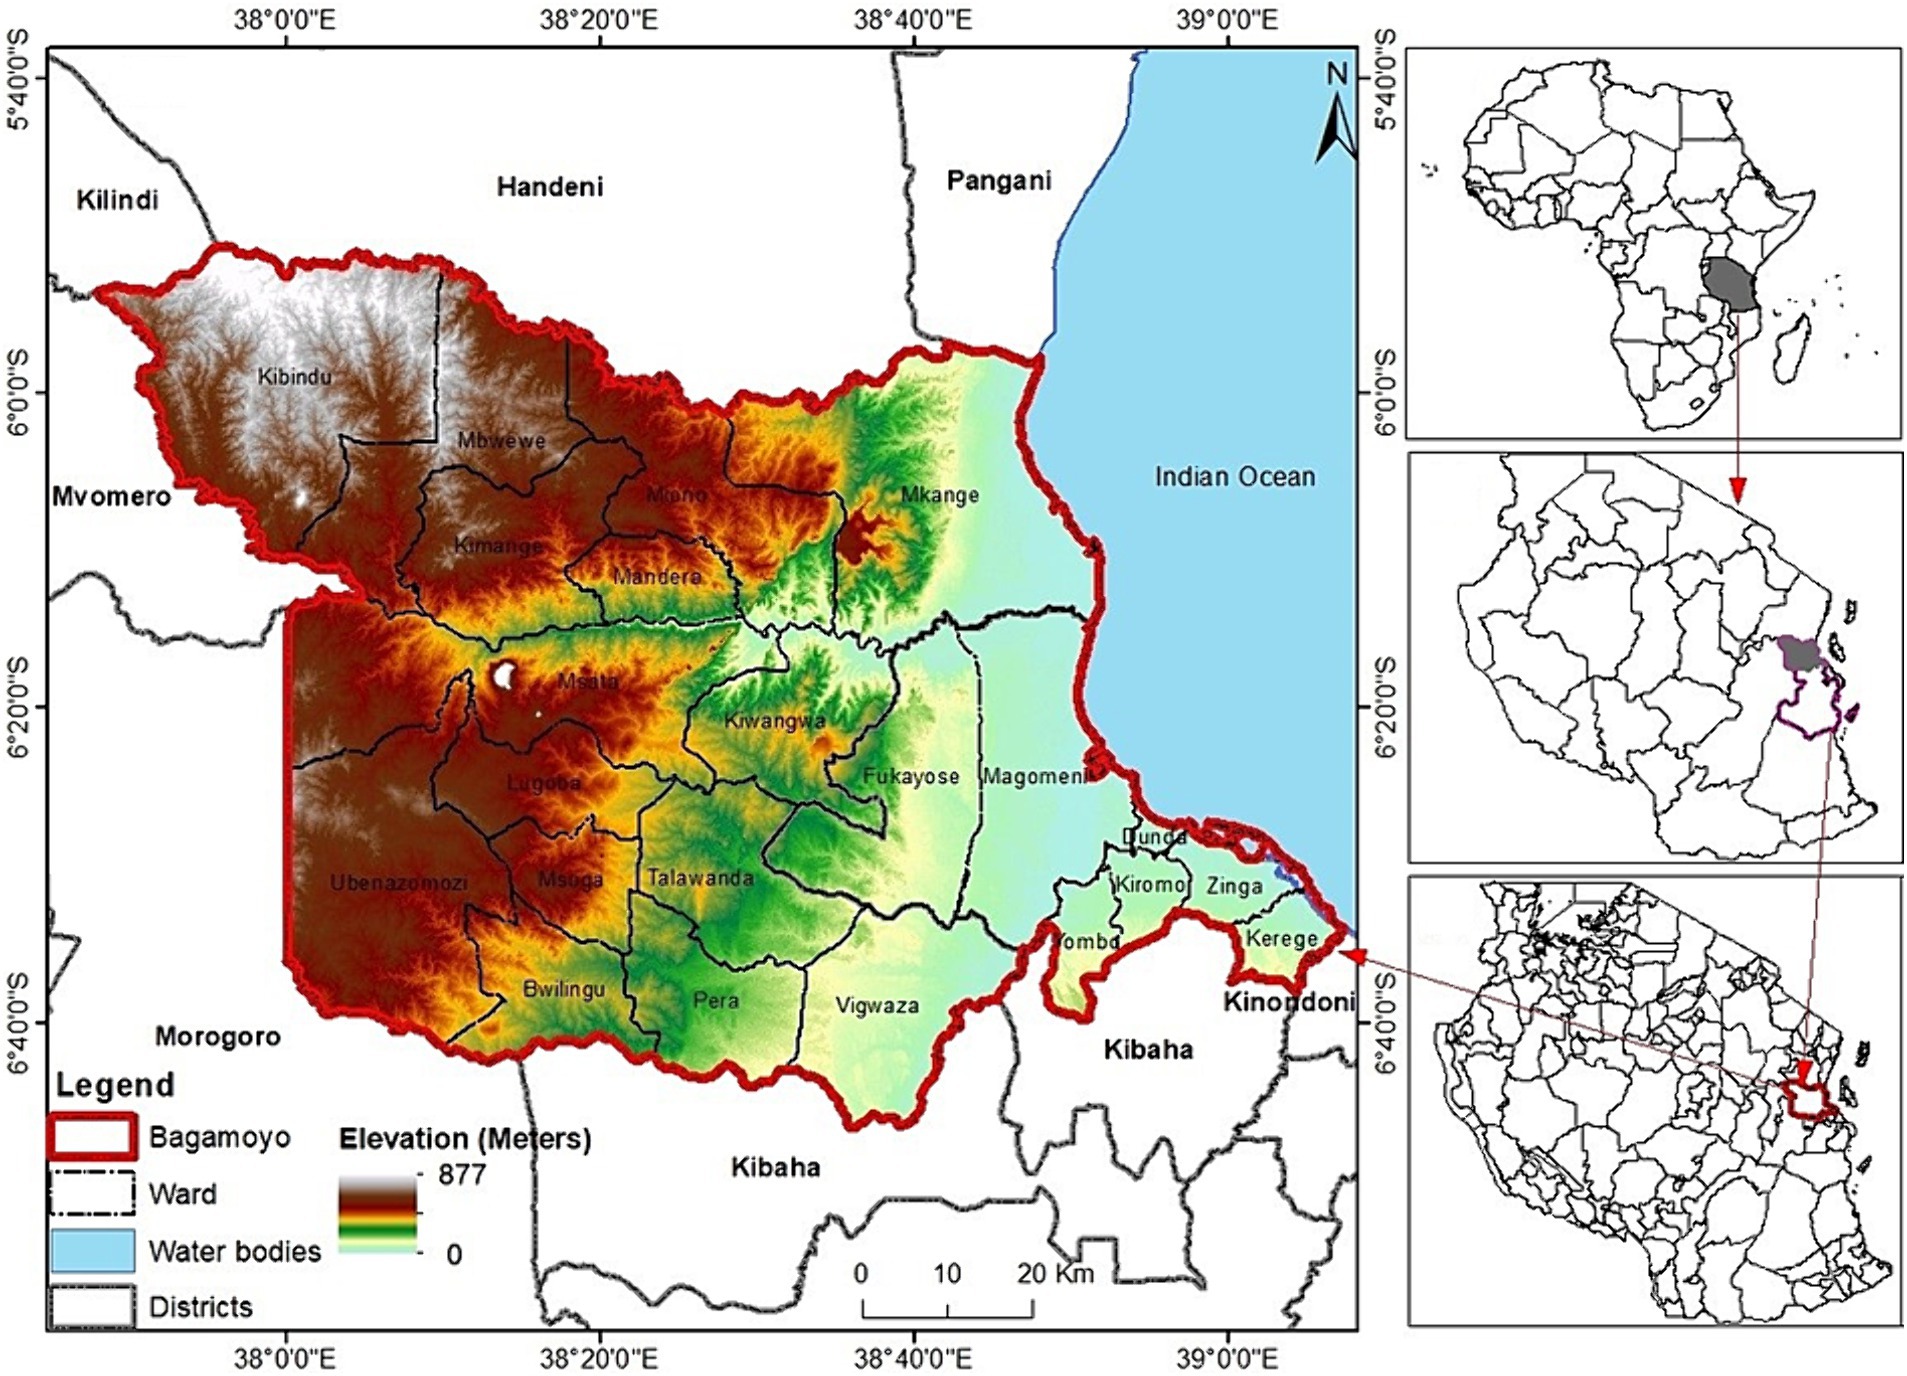
Figure 1. Bagamoyo District and wards (left), Tanzania’s location within Africa (upper right), Bagamoyo’s location in the Pwani region (middle right), Bagamoyo’s location among other districts (lower right). A 30 m resolution digital elevation model derived from the Shuttle radar topography mission is overlaid on the district.
2.2 Climatic and geographical characteristics
2.2.1 Climate characteristics
Bagamoyo District has fluctuating maximum and minimum monthly air temperatures throughout the year. The minimum mean temperature varies from 18°C in July/August to 24°C in January/February; the maximum mean temperature ranges from 29°C in July to 32°C in February. The annual precipitation in the area is approximately 1,000 mm. The rainfall pattern is bimodal, with the first long rainfall events occurring in April and May and short rainfall events occurring from November to January. The driest months in the area are June to September, when the monthly rainfall is generally less than 50 mm per month (Lyimo et al., 2013).
2.2.2 Soils, vegetation, and topography
Bagamoyo District is largely covered by sandy soils. These soils support the growth of coconut and cashew nut trees. Additionally, loamy soils cover some parts of the district. The soils are suitable for food crop production. A small portion (10%) of the study area comprises developing soils (stony type), which essentially support the natural forest zone covered by mangrove swamps. Natural forests cover the northeastern, northwestern, and western parts of the district. Mangrove swamps are found on the coastal belt. Bagamoyo District has a largely gently undulating to rolling topography characterized by extensive plains, low hills or ridges, bottomlands, and shallow valleys. The terrain rises gradually from the coastal mudflats to approximately 880 m above sea level at the northwestern border.
2.2.3 Economic activities
Formal and informal socioeconomic activities characterize most parts of the district. Approximately 80% of the population is engaged in agriculture, mainly subsistence farming. The cultivated cash and food crops include maize, paddy, millet, cassava, sweet potatoes, legumes, simsim, cashew nuts, pineapples, oranges, mangoes, and sunflower. Agriculture is mainly rainfed. Similarly, livestock farming is another important economic activity in the district.
2.3 Data sources
2.3.1 Primary data
Obtaining perspectives on climate change occurrences from local communities is an important step towards creating awareness and preparing communities to respond to different climate manifestations. In the present study, we collected field data in December 2015 in Bagamoyo District. Furthermore, we supplemented the data with climate model outputs and secondary data from meteorological stations in the region. Random sampling was used to select 309 households from seven villages in the district to participate in the study. A household was chosen as the basic unit for the interviews because it has traditionally been the primary unit of production and consumption in rural Tanzania. The sample size was determined using the Equation 1 by Cochran (1977).
where n = sample size, Z = abscissa of the standard normal curve (Z = 1.96 for 95% confidence), p = proportion of agriculture-based households (72% in Bagamoyo District), d = error set at 0.05, and q = 1 − p. In this study, priority was given to household heads who had resided in the study area for more than 35 years. The rationale for selecting this group of communities was that they have good recall of changes in weather conditions and agricultural practices and immense knowledge of livelihoods due to their long period of residency (Uprety et al., 2017; Dyke et al., 2020). Thus, the interviewees included 175 (58%) adult women and 125 (52%) adult men who were regarded as representatives of their households. The household interviews provided first-hand information from the community members on their perceptions of climate change and key events in the past. The data were obtained as part of the first author’s doctoral research, but an integration of climate modelling data was added to enhance the present study findings. The initial research expanded other climate change-related concepts in the study area by including data collection techniques such as focus group discussions (FGDs) and participatory research approach (PRA) exercises. Thus, in the present study, only data on interview-based questionnaires at the household level were analysed to derive information on community perceptions. Both qualitative and quantitative analyses were used to analyse data from the household interviews. During the interviews, respondents were asked about the incidences, intensities, and frequencies of extreme climate events they had experienced. The data sourced from the respondents were entered into a spreadsheet database and processed to obtain statistics, including counts and percentages of the different questionnaire items. We refer the readers to Mugabe (2016) for further information regarding the data collection. The larger project assesses climate variability and food security in Tanzania using the case of Bagamoyo District. The general research examines how climate variability affects food security in Tanzania. The survey was conducted for three years beginning in September 2013 and involved data collection methods such as questionnaire surveys, key informants/thematic interviews, FGDs, and PRA.
2.3.2 Meteorological and satellite climate data
This study utilized meteorological station rainfall and temperature data from the Bagamoyo Meteorological Office from 1981 to 2010. The data acquired were recorded from the District Agricultural Office weather station in Bagamoyo. The climatic variables measured at the station included the annual average maximum and minimum temperatures and annual average precipitation.
Additionally, due to limited meteorological station data coverage in the district, we acquired gridded data from the Climate Hazard Infrared Radiation with Stations (CHIRPS) dataset (Funk et al., 2015). These data are among the most highly accurate and high-resolution precipitation products in the SSA region. The CHIRPS gridded data have a spatial resolution of approximately 5 km (0.05°), with a daily temporal resolution. These attributes make the data the most reliable for assessing agricultural landscape dynamics and environmental monitoring in data-scarce areas. Additionally, the data have been validated in the EA region and found to adequately represent the prevailing weather and climatic conditions (Dinku et al., 2018; Macharia et al., 2020; Mwabumba et al., 2022).
Therefore, the CHIRPS data were ideal for supplementing the station data in this data-limited environment. Subsequently, monthly precipitation data for the entire Bagamoyo District were downloaded from the CHIRPS database. The temporal coverage of the data ranged from 1981 to 2021, enabling the detection of both interseasonal and intraseasonal trends. The data were provided in raster GIS format. The station data were supplemented with climate hazard infrared temperature with stations (CHIRTS) temperature data. These data provide high-resolution 5 km (0.05°) temperature data on a daily temporal scale (Verdin et al., 2020). The meteorological station data, CHIRPS, and CHIRTS climatic variables were used to evaluate the historical climate modelling data.
2.3.3 Climate modelling data
The future climate dataset for Bagamoyo District was obtained using an ensemble of six models acquired from the Coordinated Regional Climate Downscaling Experiment (CORDEX). The data included RCMs provided by different institutes and for different domains. In the present study, we obtained data for the African domain with a spatial resolution of approximately 50 km.1 The RCMs assessed in this study were selected based on their average to good performances in simulating regional climates in the EA region (Kiprotich et al., 2021; Mathewos et al., 2023). The RCMs were assessed using two representative concentration pathway (RCP4.5 and RCP8.5) scenarios. RCP4.5, a medium emission scenario, reflects a future with moderate climate change effects. However, RCP 8.5 represents a future with increased use of fossil fuels and emissions. RCP4.5 and RCP8.5 represent the intermediate GHG emission (650 ppm CO2 eq.) and very high GHG emission (1,370 ppm CO2 eq.) scenarios, respectively. RCP 4.5 is the intermediary scenario, whereas RCP 8.5 represents the pessimistic scenario, with assumptions that climate targets will not be easily attainable. A description of the RCMs considered in the study is presented in Table 1.
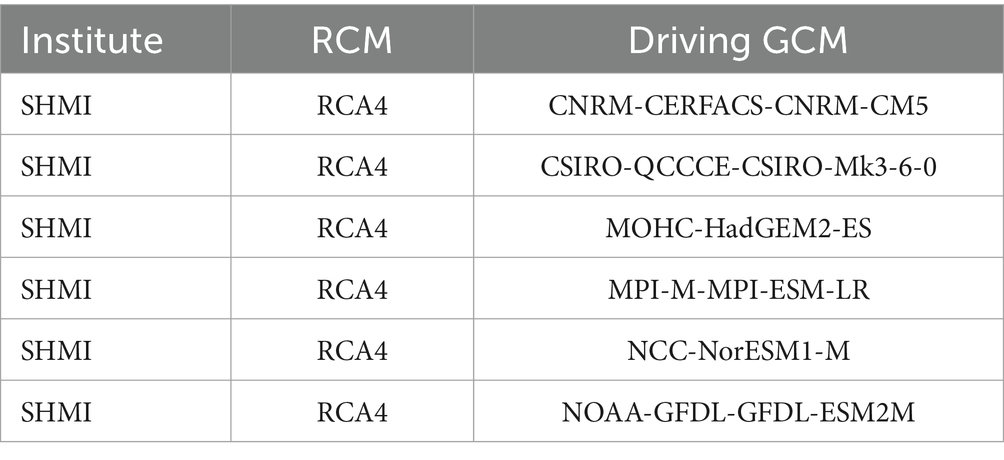
Table 1. Regional climate models (RCMs) used in the study.
For the RCMs, all the grids that overlapped Bagamoyo District were used to provide the projected climate variable estimates. Additional gridded data outside the extent of the district were downloaded to provide complete coverage of the study area extent. Point shapefiles representing the centroid of the RCM grids were used to extract the climatic variables by employing the valueto points tool in ArcGIS. The Earth System Grid Foundation (ESGF) OpenID was used to access the climate modelling data. The data are freely available upon account creation. The NetCDF files were converted to point data (downloaded for each grid) by extracting date stamps from the files and saving the stamps in a text file. Climatic variables (precipitation and minimum and maximum temperatures) were extracted for the latitudes and longitudes. Empty data frames created using the pandas library (McKinney, 2010) were populated with the extracted precipitation and temperature variables. Other Python libraries, including os, numpy, datetime, netCDF4, fnmatch, and cftime, were used to develop functions for extracting data for each station coordinate for the historical period (1950–2005) and the future period (2006–2100). The data for each RCM were downloaded and saved using the CSV table format. The files were then concatenated to obtain seamless time series data for each station. The files for each station were then summarized as annual means (for temperature variables) and annual sums (for precipitation variables) by grouping the data according to the station names.
2.4 Quality control and evaluation of the RCMs
We performed data quality control by validating the model skills and biases of the various RCMs using observed data from the Bagamoyo meteorological station and additional data sourced from the CHIRPS2 and CHIRTS databases.3 The two databases have demonstrated excellent performance according to various statistical assessments of various climate models in the EA region (Kiprotich et al., 2021). Other studies have found these databases useful for filling gaps in meteorological station data (Kwawuvi et al., 2022). Therefore, we evaluated the performance of the RCMs against the station, CHIRPS, and CHIRTS data and used a Taylor diagram to visually represent the evaluations. This diagram provides a visual representation of the comparison between simulated and observed variables by using correlation coefficients, the centred root-mean-square difference, and the amplitude of their variation represented by standard deviations. Thus, it provides a visual representation of multiple metrics, which are ideal for evaluating the model accuracies of nonlinearly driven phenomena and processes. Based on the evaluation of the models, the best-performing model was subsequently adopted for bias correction of the precipitation and temperature variables. The Climate Model data for hydrological modeling (CMhyd) (Rathjens et al., 2016) was selected for bias correction of the simulated daily precipitation and maximum and minimum temperature datasets for the study region. We adopted distribution mapping (DM) for bias correction of the temperature and local intensity scaling (LOCI) for bias correction of the precipitation, as recommended by Kiprotich et al. (2021).
2.5 Trends and spatiotemporal patterns of climatic variables
The downloaded files were imported into ArcGIS 8.10 software (Environmental Systems Research Institute) for further processing. Climatic data for the entire Bagamoyo district were downloaded from the CHIRPS, CHIRTS, and CORDEX databases. The CHIRPS and CHIRTS data were readily available as GeoTIFF files. The raster GeoTIFF files for the baseline period (1981–2010) were downloaded and aggregated to an annual scale. The mean and sum statistics were calculated for the temperature and precipitation values. Graphs and tables were used to analyse and display climate trends at the weather station scale, whereas maps were used to analyse and display observed and projected climatic trends and patterns at the district scale.
The precipitation and temperature variables were analysed using the Mann–Kendall (MK) (Mann, 1945; Kendall, 1975) and Sen’s slope estimator (SSE) (Sen, 1968) statistical tests (Eqs 2–6). MK is a nonparametric test that detects monotonic trends in time series data. The tau statistic of this method shows whether the monotonic trend is increasing or decreasing. The test compares the null hypothesis (Ho) of no trend against the alternative hypothesis (H1) of a trend. Thus, a p value is used to confirm the significance or nonsignificance of the monotonic trend at the 5% significance level. Accordingly, the processed precipitation raster files were subjected to trend analysis using the ‘raster’ and ‘Kendall’ R packages (McLeod, 2005; Hijmans et al., 2022b). The ‘calc’ function from the Kendall package generated surfaces of the Kendall tau statistic, p values, and Sen’s slope estimator.
The MK test is mathematically expressed as follows:
where n represents the time series data points (X1, X2……Xn) and sgn is a value assigned to each data point based on the difference between each pair of time series data. The conditions for sgn are as follows:
Kendall’s tau τ is computed as:
Accordingly, τ ranges from −1 for a monotonic negative trend to +1 for a monotonic positive trend. The SSE statistic (Eq. 5) is used to determine the magnitude and direction of the variable trend. The statistic is a ratio of the difference between data points and their respective ranks. The SSE estimation test computes the linear rate of change in the variable. A positive SSE value indicates an upwards trend; a negative value indicates a declining trend. The SSE is expressed as:
where n represents the time steps and j and k represent the ranks of the data points. Accordingly, the n values are arranged from smallest to largest in the SSE calculation. The SSE magnitude is computed as the median value of the slopes using Eq. 6.
The MK technique robustly handles outliers and can effectively model spatiotemporal data. Furthermore, it can be used for skewed distributed time series such as rainfall (Hamed, 2008). The trend analysis was based on long-term (1978–2021) rainfall and temperature observations at the weather station level. Additionally, a trend analysis of precipitation was conducted at the pixel level to provide insight into the spatiotemporal variability in rainfall over Bagamoyo District from 1981 to 2021. The terra (Hijmans et al., 2022a) and Kendall (McLeod, 2015) packages in R were used to generate the MK tau and slope surfaces.
3 Results
3.1 Evaluation of climate models
The Taylor diagrams for evaluating the model skills for precipitation, maximum temperature, and minimum temperature are shown in Figure 2. The plots display individual model correlation coefficients, standard deviations, and centred root mean square (RMS) errors of the RCMs and compares them to those of the CHIRPS and CHIRTS datasets.
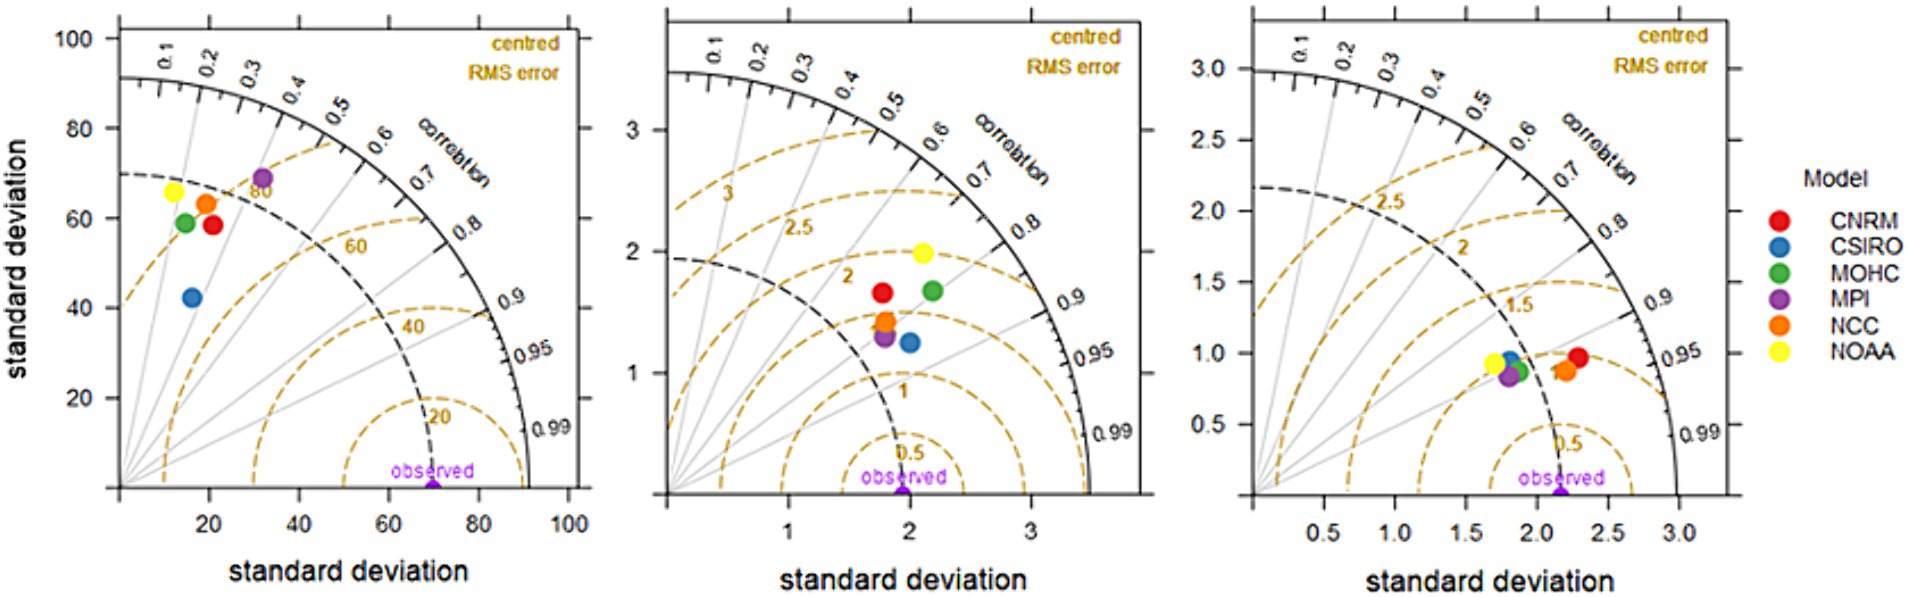
Figure 2. Taylor diagrams used to evaluate the model skill of various RCMs. The plots display the correlation coefficients, standard deviations, and centered root mean square errors for (left) precipitation, (middle) maximum temperature, and (right) minimum temperature variables in the individual models. The coloured circles represent the different RCMs.
The modelling skill level varied across the RCMs. The results from the Taylor plot showed that the Max Planck Institute for Meteorology (MPI-M) RCM exhibited better model performance in precipitation and temperature variable assessment in the baseline period. However, the performance for the precipitation variable was low across the RCMs. An evaluation of the minimum and maximum temperatures for the RCMs and the observed CHIRTS data revealed high correlations and low standard deviations. The performance assessment for minimum temperature was higher than that for maximum temperature (R > 0.95).
Based on its high model performance, we adopted the MPI model to assess the projected future climatic conditions for Bagamoyo District. The spatiotemporal trends of the future climatic conditions for Bagamoyo District under RCP4.5 and RCP8.5 were characterized, analysed, and represented using MK tau and SS.
3.2 Observed and projected climatic trends at the Bagamoyo weather station
3.2.1 Observed climate trends
Table 2 shows the time series trend and magnitude with respect to the annual amount of rainfall and average precipitation between 1981 and 2010. The results from the Bagamoyo weather station showed that precipitation exhibited a negative trend over the years, whereas the average temperature increased.
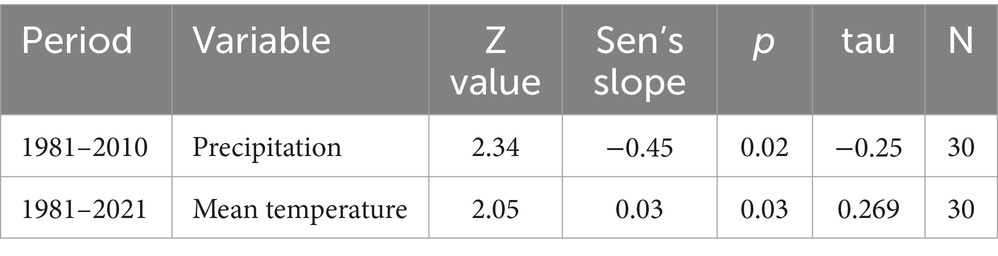
Table 2. MK trends for precipitation, maximum temperature, and minimum temperature at the Bagamoyo weather station based on historical data (1983–2021).
3.2.2 Future climatic trends
The future climatic projections based on the MK analysis showed varied trends in temperature and precipitation across Bagamoyo District (Figure 3). The projected annual precipitation was likely to exhibit an increasing trend under RCP 8.5, whereas, under RCP 4.5, a likelihood of declining precipitation in the region was revealed.
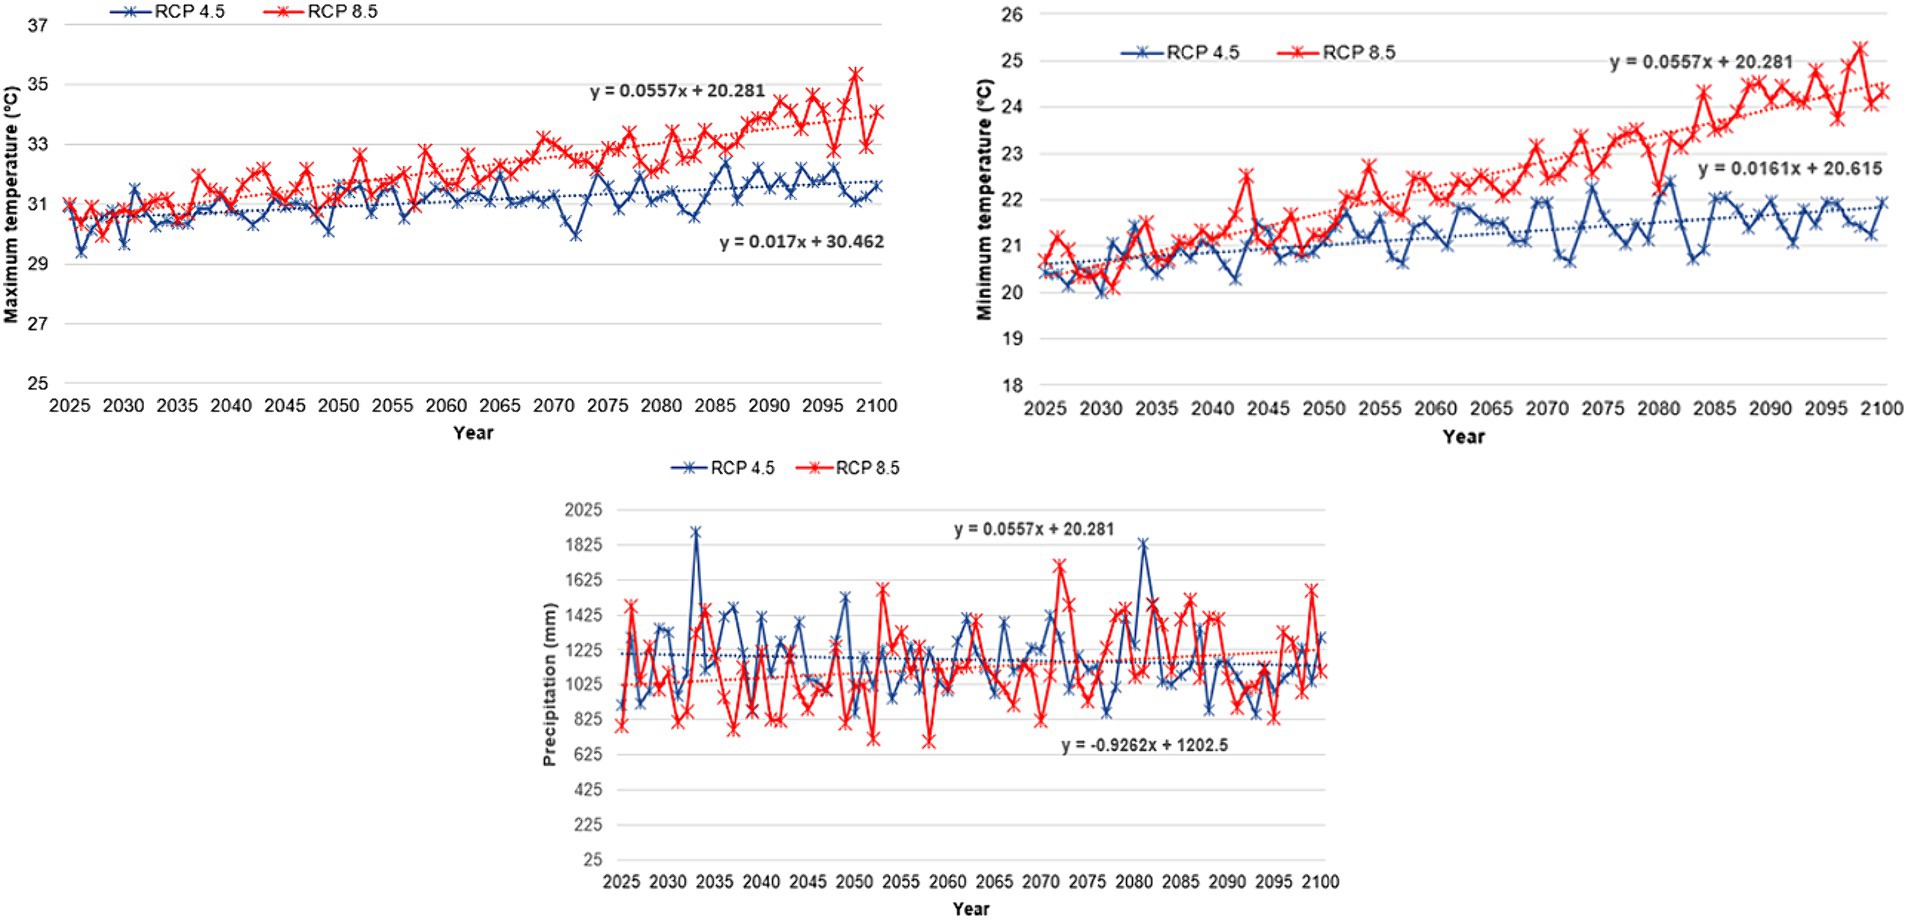
Figure 3. Trends in maximum temperature (upper left), minimum temperature (upper right), and precipitation (lower middle) for a sample station in Bagamoyo District under RCP4.5 and RCP8.5.
The minimum and maximum temperature trends are similar in the study region. Both variables showed a likelihood of increasing in the future and a high magnitude under RCP8.5 compared to under RCP4.5.
3.3 Spatiotemporal trends of the historical and projected climates in Bagamoyo District
3.3.1 Observed climatic trends
The spatiotemporal climatic trends for the observed data varied across Bagamoyo District (Figure 4). The trends analysed from the high-resolution satellite data showed that Bagamoyo District experienced a decrease in precipitation and increases in both maximum and minimum temperatures during the baseline period. The reductions (increases) in precipitation and temperature variables were indicated by the negative (positive) MK tau values. Spatially, the results showed that the western parts of Bagamoyo District experienced greater decreases in precipitation and increases in warming. Additionally, the northeastern parts of the district experienced decreases in precipitation. However, the decrease in precipitation in the southern and southwestern parts of Bagamoyo District was minimal. The magnitude of the decrease was also high in the western parts of the region, as shown by Sen’s slope raster.
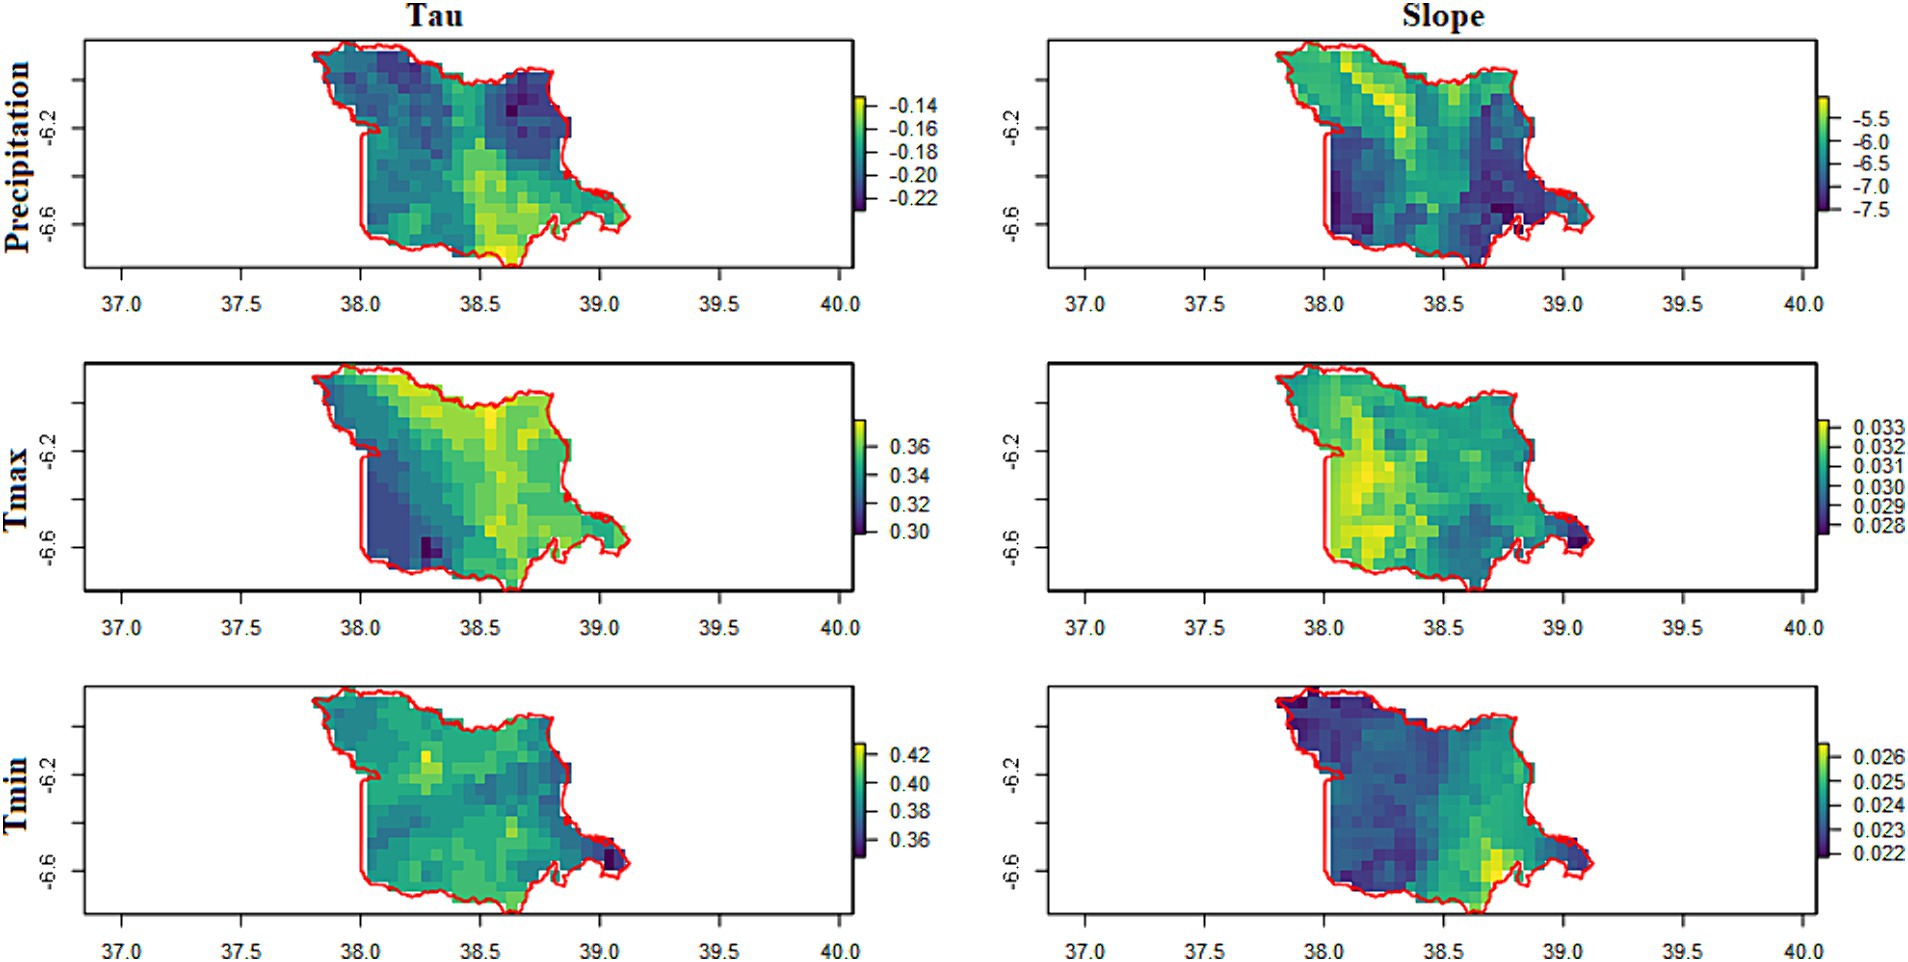
Figure 4. Spatial distributions of the trend and magnitude of precipitation, maximum temperature, and minimum temperature variables for the baseline (1980–2010) period according to the Kendall-Tau and Sen slopes.
The maximum temperature increase was high in the northeastern part of the district, as was its magnitude. The temperatures in the southwestern region increased but at lower magnitudes than those in the northeastern region. The minimum temperature showed increasing trends and appeared more uniform across the study region. Apart from some small areas in the northern part of the district, the overall trend across a large part of the study area was relatively uniform. The magnitude of the increase in minimum temperature was also lower than that of the maximum temperature.
3.3.2 Projected climate trends
The projected climate trends for Bagamoyo District under RCPs 4.5 and 8.5 are shown in Figure 5. The climate models project a reduction in precipitation under RCP4.5 but increased precipitation under the RCP8.5 scenario. The reduction in precipitation is greater in the northern and northeastern parts of the district under RCP4.5. The southern and southwestern parts of the district are likely to experience lower rates of precipitation reduction. From the projected precipitation increase under RCP 8.5, the northern parts will experience increased rainfall compared with the southern zones.
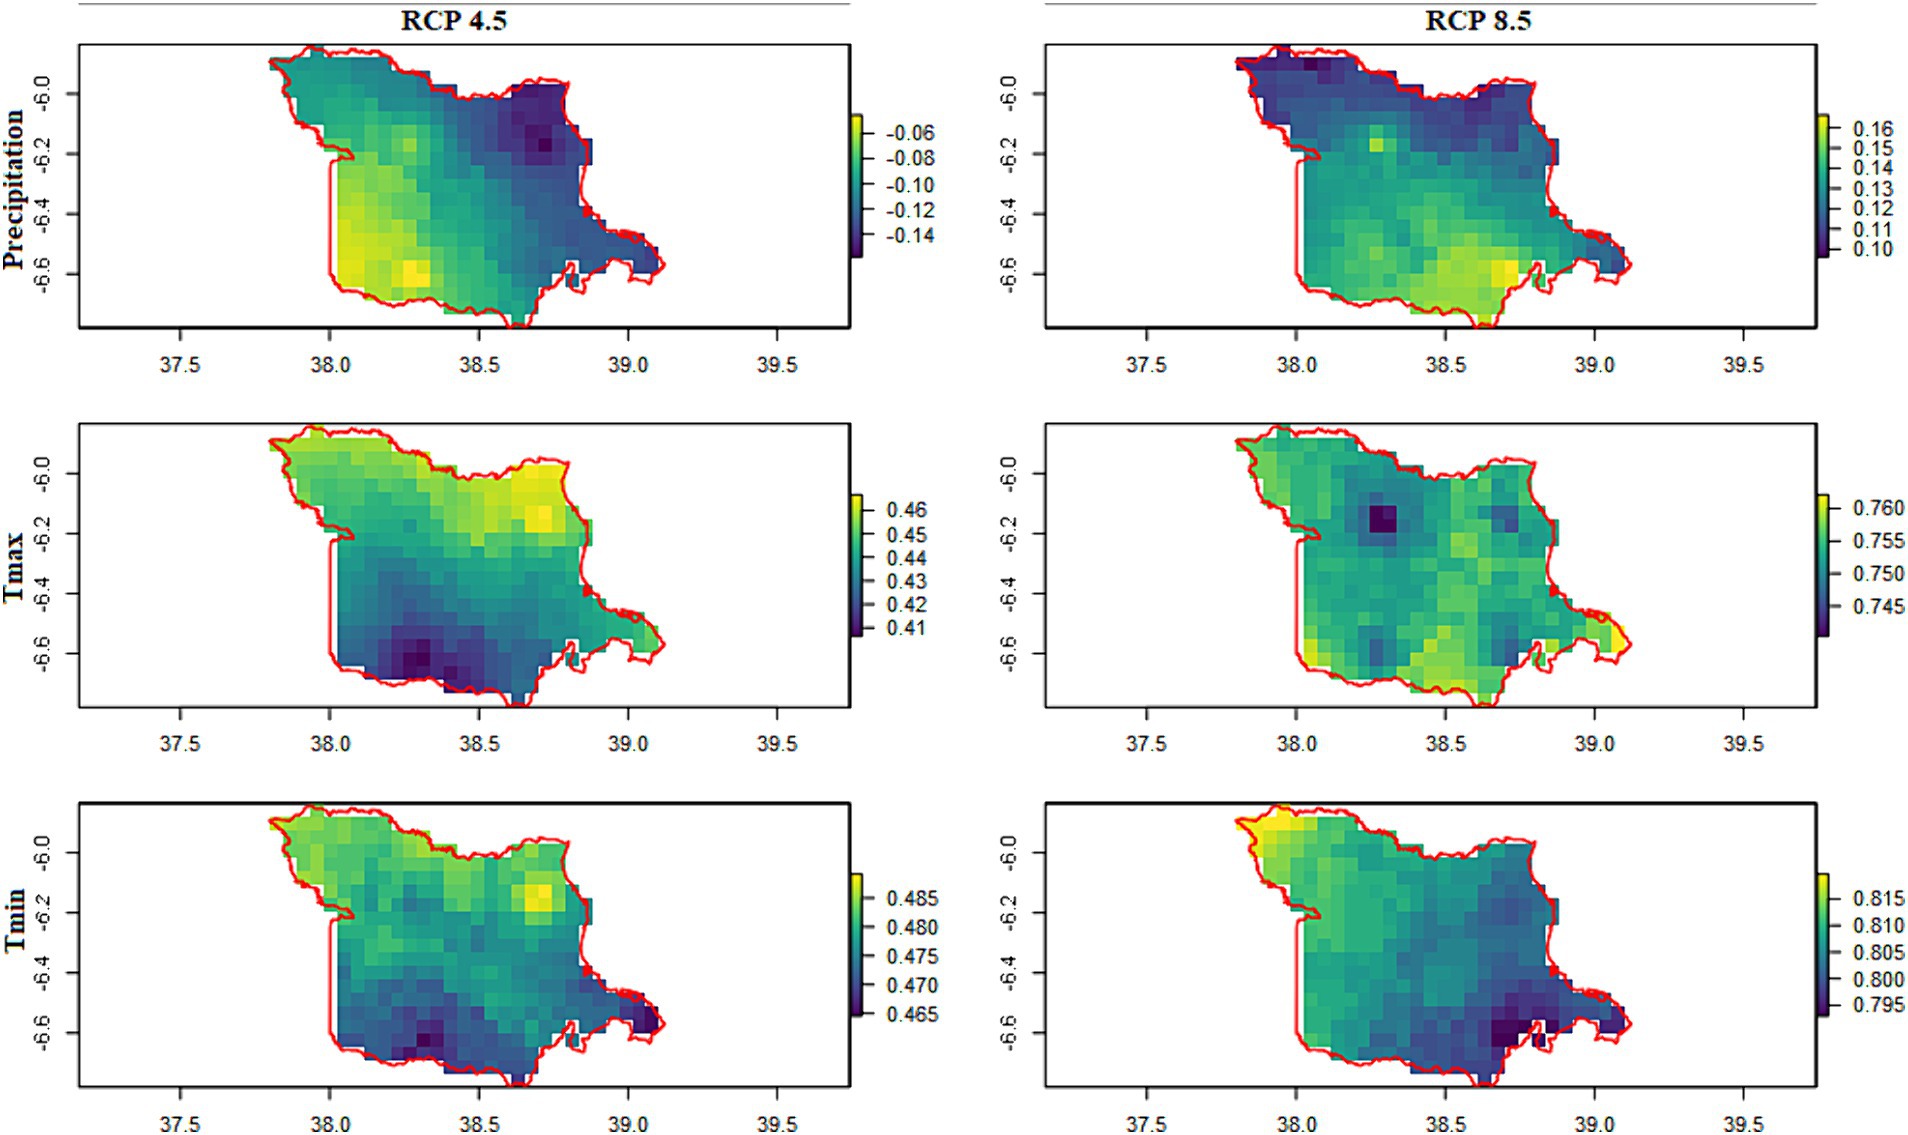
Figure 5. Spatial distribution of the Kendall Tau precipitation and maximum and minimum temperatures under the RCP4.5 and RCP8.5 RCPs.
3.4 Community responses to patterns and trends of climate variability
Tables 3, 4 indicate the community response to climate change. Almost all the interviewed respondents (95%) from the surveyed villages affirmed changes in climate over the years. The results indicate that droughts were more prevalent than floods over the years. Regarding their experience of droughts or dry spells, the majority of respondents indicated increased incidences in the historical period in comparison to recent years (56.3% experienced many more droughts and 38.3% experienced more droughts), while the remaining respondents either observed no changes (2%), fewer droughts than before (2.7%) or reported that no droughts occurred (0.7). Regarding floods, only 3.3% experienced many more floods, 1.3% experienced more floods, 35.7% experienced approximately the same number of floods as before, 50.7% experienced fewer floods than before, and 9% did not experience floods at all.
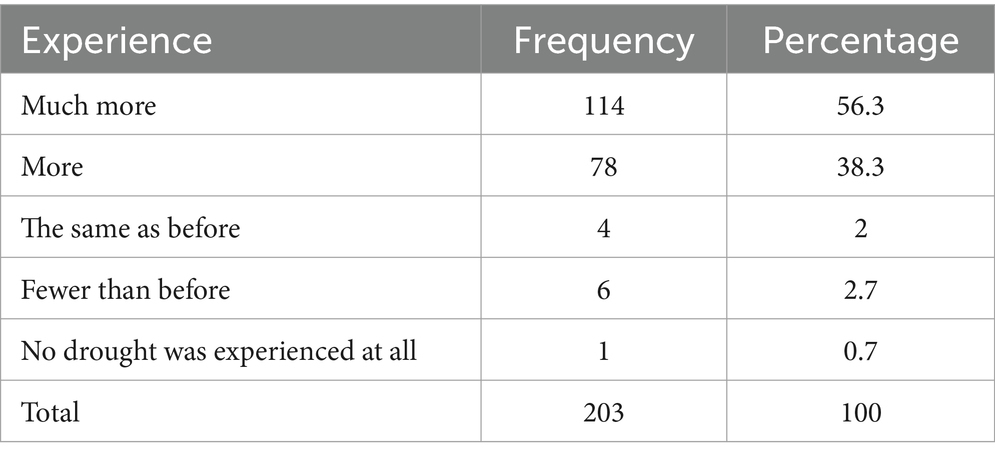
Table 3. Community experience of drought.
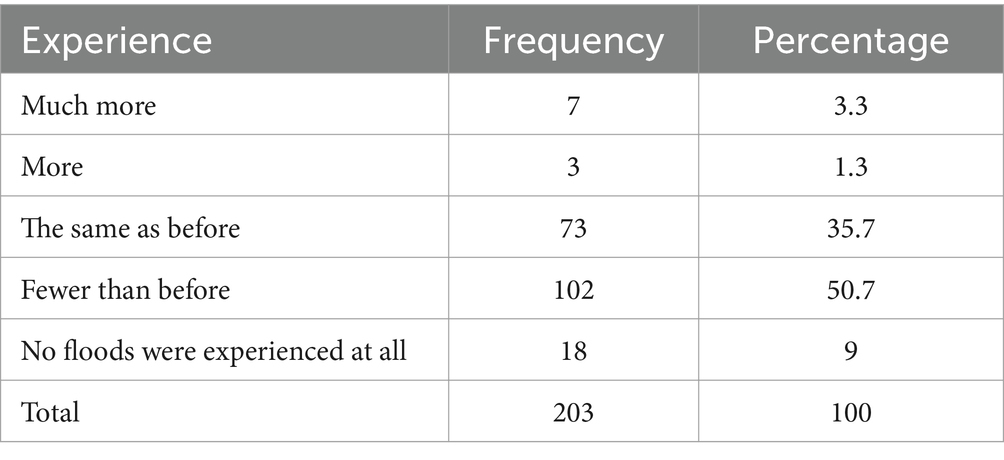
Table 4. Community experience of floods.
According to respondents interviewed at Mkenge Village, the climatic trend showed that the variability was rampant compared to that in previous years, in which there were two rainfall seasons, “Vuli” (short season between September and January) and “Masika” (long season between March and June). In recent years, there has been one unpredictable season. Most respondents, for example, described the drying of the Mkombezi River as a result of drought. People living in Mkenge village depend on rivers for domestic use and for vegetable production.
The respondents’ main climate concern was drought in the Mkwama sub village (Mkenge village), where most inhabitants are pastoralists. The village last experienced flooding (El Nino) in 1997/1998, but drought incidences have increased since then. Interviews with village elders, such as the former village executive officer (VEO), indicated that in recent years, the major changes were increased drought occurrence and the change in the rainy season pattern from a bimodal to a unimodal pattern. These variations were similar in Kidomole village, where respondents complained about the harsh climate and indicated that water scarcity was affecting domestic and small-scale food production.
In interviews and discussions in Mwavi village, the respondents reported droughts as the major shock experienced by the community, with rainfall declining in recent years. Other respondents revealed that droughts have been prolonged in recent years, and temperatures have increased. The patterns and trend of rainfall were perceived to be declining, as evidenced by the rapid drying of water catchment areas and reduced run-off in the region. Other respondents reported crop failure.
During an interview with community education experts at Fukayosi, the respondents noted that rainfall in the village has become scarce over the years. For instance, February–March, which has always been considered the long rainy season, was dry in 2012. However, two years later, heavy rains accompanied by strong winds damaged fruit trees and destroyed property in the village. The changes in the seasons were more strongly associated with the changing rainfall patterns. However, floods occurred sparingly in previous seasons. For instance, one flooding incident occurred in 2000. Discussions on several shocking events and changing climatic conditions indicated that many people associated drought with a lack of water due to dry water catchments. People associated famine with a lack of rainfall, which affected their agricultural production. The communities interviewed reported increasing food insecurity due to crop failure and declining livestock production. Most households in the region adopted food rationing and reduced their number of daily meals. They reported a strong effect of climate change on agricultural activities, which are considered the main livelihood in the study area.
4 Discussion
4.1 Evaluation of climate models
Climate models developed by various institutions worldwide play a key role in estimating future climatic trends and thus enable various sectors of the economy that experience direct climate effects to enhance their social, economic, and ecological resilience to climate change effects. Determining how each model performs is vital in selecting the model that best reflects the climatic conditions in a particular region. Thus, evaluating climate models and selecting the model that best characterizes the conditions of our study area improves the reliability of the findings to address the effects of climate on the population in the region. The models reproduced the temperature variables, whereas precipitation exhibited moderate accuracies. Analyses of climate models tested in other regions indicate good performance. For instance, Luhunga et al. (2016) assessed the performance of various RCMs in the CORDEX database in Tanzania. They found good model performance in terms of temperature variables, but there were uncertainties in precipitation estimation during the short rainy seasons in the region.
Similarly, Girma et al. (2022) noted the satisfactory performance of various models in replicating temperature variables over the Ethiopian Rift Valley Basin. Moreover, their study noted the best performance of the MPI RCM, which was also the case with our work. Another study in the Upper Blue Nile Basin showed relatively high biases in the simulation of seasonal precipitation cycles by RCMs (Dibaba et al., 2019). Therefore, the uncertainties in the different RCMs call for careful interpretation of the results when developing climate adaptation measures. Overall, our evaluation showed that the models could represent the historical conditions of Bagamoyo District and form a basis for predicting future conditions to support climate adaptation initiatives.
4.2 Historical climatic trends
Climate model evaluations form the basis on which regional trends and patterns of climatic variables can be assessed. Strong climate model performance regarding regional climatic conditions can create confidence in the reliability of climate change interventions. This study investigated the rainfall and temperature trends in Bagamoyo District, as these climatic variables have major implications for agriculture and other related sectors. Historical analyses of trends and patterns of temperature and precipitation revealed that the study area has experienced a decrease in precipitation and an increase in warming over the years (Chang’a et al., 2017). These conditions have led to increased evapotranspiration rates and, at times, crop failure in parts of the study area (Mhache, 2017). Similar studies in the region have shown that Bagamoyo District and the coastal region have been experiencing periodic droughts (Besa, 2013). Furthermore, climate change manifested through droughts has affected most parts of the EA region, including Tanzania (Gebremeskel Haile et al., 2019). The region is characterized by considerable topographic and climatic variability, which leads to varied responses of crops to changing climates (Ongoma and Chen, 2017).
The local climate patterns also revealed varied spatiotemporal trends in the climate variables. The trends indicated that the eastern parts of the study area experienced a greater decrease in precipitation than did the northeastern parts. This finding was expected, as the northeastern parts fall in high-elevation zones, which have favourable meteorological conditions (Favier et al., 2009). Nonetheless, both concentration pathways agreed on the direction of the precipitation trends across the study area. The observed precipitation pattern was in line with the study of Gebrechorkos et al. (2019), who found an increased frequency of consecutive dry days in the region in previous years. The study findings also revealed increased temperature rates in the western parts of the study region. Despite the region’s relatively high elevation, studies in EA show that the highlands warm dramatically under the effects of climate change (Case, 2006; Moore et al., 2012). The findings further showed an increase in the minimum temperature in the western region but at a lower rate relative to the maximum temperature increase. Similar observations have been documented in other regional and global studies (Bhutiyani et al., 2007; Camberlin, 2018).
4.3 Future climate trends
Future climate trends reveal increased warming, which is anticipated to affect the region’s agricultural production and food security. However, the trends in future precipitation are uncertain, with the assessed optimal RCM under RCP 4.5 revealing declining precipitation across the study area. In contrast, under RCP 8.5, the precipitation appears to increase across the study area. Previous climate modelling studies in the EA region have also reported temperature projections. Our findings on precipitation appear to agree with other studies that have shown that the future precipitation trends from RCMs under different pathways have high uncertainty over the EA region (Sylla et al., 2013; Assamnew and Tsidu, 2020).
4.4 Community perception and climate modelling data
Climate-modelled data of climate change occurrences in the study area were compared with local perceptions of climate change. Knowledge from local communities is important because it supports tailored climate change adaptation measures. The study showed the concordance of community perceptions of climate change with historical climate change occurrences. For instance, the historical climate for Bagamoyo District, as assessed from climate models, shows that the entire region experienced a decrease in precipitation. This is indicated by the negative MK tau value over the entire region. Over 94% of the interviewed households in the region affirmed that droughts have been severe. Both climate modelling analysis and community-sourced information align with the findings of previous studies in the region (Kangalawe, 2012; Haapanen and Mhache, 2013; Lyimo et al., 2013).
The study also revealed differential impacts of climate change across the district, as indicated by the varying magnitudes. The model data showed that the southwestern and eastern parts are experiencing high precipitation decreases and temperature increases. In addition to affirming perceived droughts in the region, other studies have documented the alarming effects of climate change, including saltwater intrusion into estuaries and freshwater aquifers (Ligate et al., 2017), which has greatly affected the production of major crops such as rice and maize. The spatially explicit information on climate variables, trends, and patterns presented in this work provides an in-depth reference to guide communities in developing appropriate measures for adapting to the effects of climate change. Such information has been utilized in other regions; however, Bagamoyo District and Tanzania, which face enormous risks from climate change in the future, have received less attention. In previous studies, large-scale analyses of perceptions and meteorological data analysis have been integrated. However, meteorological data are not always readily available and may have poor coverage, with missing records at some stations. Therefore, conducting a comprehensive analysis of large-scale climate change effects can be challenging due to data limitations. This situation, in turn, undermines the understanding of how future climate change might affect different areas and hinders efforts to effectively prioritize adaptation measures. The existing downscaled data had not been applied to local decision-making.
4.5 Implications of observed and future climate change for agriculture and food security
Climate change is apparent in the study area. The area has experienced increased warming and declining precipitation, which is evident and manifested through droughts. Climate models indicate uneven patterns of temperature increases and precipitation decline. These differential effects of climate change across the region reflect varying levels of exposure and livelihood vulnerability to climate change effects. Regions with increased temperature experience intense heat, and prolonged droughts which affects crop production and escalates food insecurity. Furthermore, areas in high-temperature zones are prone to high moisture loss, which amplifies the decline in agricultural production. Under moisture stress, water use efficiency declines, and the duration of crop growth decreases. In other cases, intense heat combined with low precipitation leads to crop failure. Smallholder farmers in these regions might have to focus on adaptations such as planting heat-tolerant crops, adopting early maturing varieties, and upscaling soil water conservation measures.
The agreement between the climate modelling data and the local people’s experiences indicates that locals can discern climate change occurrences well. Additionally, future projections from the RCMs indicate that the region will continue to experience increased warming and decreased precipitation. The spatiotemporal analysis of the projected climate indicates that the effect will vary across the study area. Thus, it is imperative for the local people to be aware of these occurrences to better develop effective local measures. Such measures include timely crop planting, adopting short-maturing cultivars, planting drought-resistant crops, promoting climate-smart technologies such as irrigation, developing sound soil and water conservation strategies, and paying attention to weather forecasts. Such measures will greatly enhance agricultural production and improve food security efforts in the district. Moreover, as it is situated along the coastal region, Bagamoyo District might also experience challenges related to rising sea levels and ocean water intrusion on land. This will have a devastating effect on the freshwater supply systems that support ecosystem services and thus will have a direct influence on food production. Therefore, preventative actions and technology needed to protect freshwater systems and cropland areas from increased salinity, which might further reduce yields.
4.6 Limitations of the study
One of the limitations of this study is that community perceptions of climate change were investigated based on the recall of multiple events over a long period (35 years). Although such data can provide valuable information and insights, multiple waves of data collection could provide detailed perspectives on prevailing weather conditions. This could help reduce seasonal biases and spatiotemporal uncertainties. However, climate modelling studies often consider a trade-off between spatial resolution, data accuracy, scale (spatial and temporal), and data reliability. Furthermore, climate model projections have inherent uncertainties and might introduce biases in different regions. The results from climate models must thus be interpreted with caution. Existing studies consider multimodel ensembles to account for the differences among models. Nonetheless, evaluation of model performance is necessary before applying them in a particular region.
5 Conclusion
The present study assessed the spatial and temporal variations in climate conditions in Bagamoyo District by combining data from climate models, meteorological stations, community experiences, and the literature. The study showed that the district has experienced climate extremes manifested in the form of droughts over the years. Climate modelling analysis revealed that climatic conditions vary across the region and are likely to have differential effects on agricultural productivity and food security in the region. The models show that the southern and southwestern parts of the district will experience minimal climate effects in the future. The identification of the areas likely to experience significant climate extremes enables the development of context-specific measures tailored for specific environments and transition pathways through which agricultural production can be improved. Integrating local community knowledge with climate modelling analysis is crucial for enabling local people and decision-makers to formulate strategies that enhance production under future climate conditions. Furthermore, the integration of spatially explicit information can improve the understanding of climate change effects across space and time and the precision of adaptation measures in specific regions. Future research will focus on assessing the influence of context-specific measures across the region, thus opening frontiers for proper adaptation to projected climate conditions. Future studies will also evaluate other climate data products of the region to assess scale and resolution effects.
Data availability statement
The raw data supporting the conclusions of this article will be made available by the authors, without undue reservation.
Ethics statement
The study was conducted in accordance with local legislation and institutional requirements. Research approval for the fieldwork was sought and granted by the Bagamoyo District Director. In addition, the contacts of authorities at ministerial, regional, district, and ward-level meetings were held with the village leaders at each research site to inform them about the study process and its goals and to ask for their approval for conducting the study. Informed consent for participation in this study was obtained from the participants before the data collection.
Author contributions
PM: Conceptualization, Formal analysis, Investigation, Methodology, Writing – original draft, Writing – review & editing. HK: Data curation, Formal analysis, Investigation, Writing – review & editing. SS: Formal analysis, Investigation, Writing – review & editing. EM: Formal analysis, Visualization, Writing – review & editing. KL: Formal analysis, Investigation, Methodology, Supervision, Writing – review & editing.
Funding
The author(s) declare financial support was received for the research, authorship, and/or publication of this article. The publication of this article was funded by the Open Access Fund of the Leibniz Association.
Conflict of interest
The authors declare that the research was conducted in the absence of any commercial or financial relationships that could be construed as a potential conflict of interest.
Publisher’s note
All claims expressed in this article are solely those of the authors and do not necessarily represent those of their affiliated organizations, or those of the publisher, the editors and the reviewers. Any product that may be evaluated in this article, or claim that may be made by its manufacturer, is not guaranteed or endorsed by the publisher.
Footnotes
References
Adhikari, U., Nejadhashemi, A. P., Herman Matthew, R., and Messina Joseph, P. (2017). Multiscale assessment of the impacts of climate change on water resources in Tanzania. J. Hydrol. Eng. 22:05016034. doi: 10.1061/(ASCE)HE.1943-5584.0001467
Affoh, R., Zheng, H., Dangui, K., and Dissani, B. M. (2022). The impact of climate variability and change on food security in sub-Saharan Africa: perspective from panel data analysis. Sustain. For. 14:759. doi: 10.3390/su14020759
Agutu, N. O., Awange, J. L., Ndehedehe, C., Kirimi, F., and Kuhn, M. (2019). Grace-derived groundwater changes over greater horn of Africa: temporal variability and the potential for irrigated agriculture. Sci. Total Environ. 693:133467. doi: 10.1016/j.scitotenv.2019.07.273
Arndt, C., Farmer, W., Strzepek, K., and Thurlow, J. (2012). Climate change, agriculture and food security in Tanzania. Rev. Dev. Econ. 16, 378–393. doi: 10.1111/j.1467-9361.2012.00669.x
Assamnew, A. D., and Tsidu, G. M. (2020). The performance of regional climate models driven by various general circulation models in reproducing observed rainfall over East Africa. Theor. Appl. Climatol. 142, 1169–1189. doi: 10.1007/s00704-020-03357-3
Behera, S. K., Luo, J.-J., Masson, S., Delecluse, P., Gualdi, S., Navarra, A., et al. (2005). Paramount impact of the Indian Ocean dipole on the east African short rains: a CGCM study. J. Clim. 18, 4514–4530. doi: 10.1175/JCLI3541.1
Besa, M. C. (2013). Using climate information to support adaptation planning and policy-making: A practical case study in Bagamoyo District, coastal Tanzania.
Bhutiyani, M. R., Kale, V. S., and Pawar, N. J. (2007). Long-term trends in maximum, minimum and mean annual air temperatures across the northwestern Himalaya during the twentieth century. Clim. Chang. 85, 159–177. doi: 10.1007/s10584-006-9196-1
Block, S., Haile, B., You, L., and Headey, D. (2022). Heat shocks, maize yields, and child height in Tanzania. Food Secur. 14, 93–109. doi: 10.1007/s12571-021-01211-6
Camberlin, P. (2018). Climate of eastern Africa. Oxford research encyclopedia of climate science. Oxford: Oxford University Press.
Chang’a, L. B., Kijazi, A. L., Luhunga, P. M., Ng’ongolo, H. K., and Mtongor, H. I. (2017). Spatial and temporal analysis of rainfall and temperature extreme indices in Tanzania. Atmos. Clim. Sci. 7, 525–539. doi: 10.4236/acs.2017.74038
Choi, Y.-W., Campbell, D. J., and Eltahir, E. A. B. (2023). Near-term regional climate change in East Africa. Clim. Dyn. 61, 961–978. doi: 10.1007/s00382-022-06591-9
Devi, S. (2022). Climate change driving East Africa towards famine. Lancet 400, 150–151. doi: 10.1016/S0140-6736(22)01325-3
Dibaba, W. T., Miegel, K., and Demissie, T. A. (2019). Evaluation of the Cordex regional climate models performance in simulating climate conditions of two catchments in upper Blue Nile Basin. Dyn. Atmos. Oceans 87:101104. doi: 10.1016/j.dynatmoce.2019.101104
Dinku, T., Funk, C., Peterson, P., Maidment, R., Tadesse, T., Gadain, H., et al. (2018). Validation of the CHIRPS satellite rainfall estimates over eastern Africa. Q. J. R. Meteorolog. Soc. 144, 292–312. doi: 10.1002/qj.3244
Dyke, T., Mathew, T. H., and Agnes, R. S. (2020). Rural community perceptions on the impact of climate change on subsistence farming: Mutoko community in Zimbabwe. e-Bangi 17, 89–104,
Favier, V., Falvey, M., Rabatel, A., Praderio, E., and López, D. (2009). Interpreting discrepancies between discharge and precipitation in high-altitude area of Chile's Norte Chico region (26–32°S). Water Resour. Res. 45. doi: 10.1029/2008WR006802
Funk, C., Fink, A. H., Harrison, L., Segele, Z., Endris, H. S., Galu, G., et al. (2023). Frequent but predictable droughts in East Africa driven by a Walker circulation intensification. Earth's Future 11:e2022ef003454. doi: 10.1029/2022EF003454
Funk, C., Peterson, P., Landsfeld, M., Pedreros, D., Verdin, J., Shukla, S., et al. (2015). The climate hazards infrared precipitation with stations—a new environmental record for monitoring extremes. Sci. Data 2, 1–21. doi: 10.1038/sdata.2015.66
Gebrechorkos, S. H., Hülsmann, S., and Bernhofer, C. (2019). Changes in temperature and precipitation extremes in Ethiopia, Kenya, and Tanzania. Int. J. Climatol. 39, 18–30. doi: 10.1002/joc.5777
Gebrechorkos, S. H., Hülsmann, S., and Bernhofer, C. (2020). Analysis of climate variability and droughts in East Africa using high-resolution climate data products. Glob. Planet. Chang. 186:103130. doi: 10.1016/j.gloplacha.2020.103130
Gebremeskel Haile, G., Tang, Q., Sun, S., Huang, Z., Zhang, X., and Liu, X. (2019). Droughts in East Africa: causes, impacts and resilience. Earth Sci. Rev. 193, 146–161. doi: 10.1016/j.earscirev.2019.04.015
Girma, R., Fürst, C., and Moges, A. (2022). Performance evaluation of Cordex-Africa regional climate models in simulating climate variables over Ethiopian main rift valley: evidence from Gidabo river basin for impact modeling studies. Dyn. Atmos. Oceans 99:101317. doi: 10.1016/j.dynatmoce.2022.101317
Haapanen, T., and Mhache, E. (2013). From farming to charcoal production: agricultural decline, food security and deforestation in Bagamoyo District, Tanzania. Tanzania J. For. Nat. Conserv. 82, 24–41.
Hamed, K. H. (2008). Trend detection in hydrologic data: the Mann–Kendall trend test under the scaling hypothesis. J. Hydrol. 349, 350–363. doi: 10.1016/j.jhydrol.2007.11.009
Hijmans, R. J., Bivand, R., Forner, K., Ooms, J., Pebesma, E., and Sumner, M. D. (2022a). Package ‘terra’. Vienna, Austria.
Hijmans, R. J., Etten, J. V., Sumner, M., Cheng, J., Baston, D., Bevan, A., et al. (2022b). Raster: geographic data analysis and modeling.
Kangalawe, R. Y. (2012). Food security and health in the southern highlands of Tanzania: a multidisciplinary approach to evaluate the impact of climate change and other stress factors. Afr. J. Environ. Sci. Technol. 6, 50–66. doi: 10.5897/AJEST11.003
Kassegn, A., and Endris, E. (2021). Review on socio-economic impacts of ‘triple threats’ of Covid-19, desert locusts, and floods in East Africa: evidence from Ethiopia. Cogent Soc. Sci. 7:1885122. doi: 10.1080/23311886.2021.1885122
Kiprotich, P., Wei, X., Zhang, Z., Ngigi, T., Qiu, F., and Wang, L. (2021). Assessing the impact of land use and climate change on surface runoff response using gridded observations and swat+. Hydrology 8:48. doi: 10.3390/hydrology8010048
Kogo, B. K., Kumar, L., and Koech, R. (2021). Climate change and variability in Kenya: a review of impacts on agriculture and food security. Environ. Dev. Sustain. 23, 23–43. doi: 10.1007/s10668-020-00589-1
Kotir, J. H. (2011). Climate change and variability in sub-Saharan Africa: a review of current and future trends and impacts on agriculture and food security. Environ. Dev. Sustain. 13, 587–605. doi: 10.1007/s10668-010-9278-0
Kwawuvi, D., Mama, D., Agodzo, S. K., Hartmann, A., Larbi, I., Bessah, E., et al. (2022). An investigation into the future changes in rainfall onset, cessation and length of rainy season in the Oti River basin, West Africa. Model. Earth Syst. Environ. 8, 5077–5095. doi: 10.1007/s40808-022-01410-w
Ligate, E. J., Kitila, M. M., Chen, C., and Wu, C. (2017). Impacts of salt water intrusion on maize (zea mays) and rice (oryza sativa) production under climate change scenarios in Bagamoyo District-Tanzania. Univers. J. Agric. Res. 5. doi: 10.13189/ujar.2017.050210
Luhunga, P., Botai, J., and Kahimba, F. (2016). Evaluation of the performance of Cordex regional climate models in simulating present climate conditions of Tanzania. J. South. Hemisph. Earth Syst. Sci. 66, 32–54. doi: 10.1071/ES16005
Luhunga, P. M., Kijazi, A. L., Chang'A, L., Kondowe, A., Ng'ongolo, H., and Mtongori, H. (2018). Climate change projections for Tanzania based on high-resolution regional climate models from the coordinated regional climate downscaling experiment (Cordex)-Africa. Front. Environ. Sci. 6:122, 148–158. doi: 10.3389/fenvs.2018.00122
Lyimo, J. G., Ngana, J. O., Liwenga, E., and Maganga, F. (2013). Climate change, impacts and adaptations in the coastal communities in Bagamoyo District, Tanzania. Environ. Econ. 4, 63–71,
Macharia, J. M., Ngetich, F. K., and Shisanya, C. A. (2020). Comparison of satellite remote sensing derived precipitation estimates and observed data in Kenya. Agric. For. Meteorol. 284:107875. doi: 10.1016/j.agrformet.2019.107875
Madumla, E. P., Moore, S. J., Moore, J., Mbuba, E., Mbeyela, E. M., Kibondo, U. A., et al. (2022). “In starvation, a bone can also be meat”: a mixed methods evaluation of factors associated with discarding of long-lasting insecticidal nets in Bagamoyo, Tanzania. Malar. J. 21:101. doi: 10.1186/s12936-022-04126-5
Mann, H. B. (1945). Nonparametric tests against trend. Econometrica 13, 245–259. doi: 10.2307/1907187
Marchant, R., Mumbi, C., Behera, S., and Yamagata, T. (2007). The Indian Ocean dipole – the unsung driver of climatic variability in East Africa. Afr. J. Ecol. 45, 4–16. doi: 10.1111/j.1365-2028.2006.00707.x
Mathewos, Y., Abate, B., and Dadi, M. (2023). Characterization of the skill of the Cordex-Africa regional climate models to simulate regional climate setting in the east African transboundary Omo Gibe River basin, Ethiopia. Heliyon 9:e20379. doi: 10.1016/j.heliyon.2023.e20379
Mbilinyi, A., Saibul, G. O., and Kazi, V. (2013). Impact of climate change to small scale farmers: Voices of farmers in village communities in Tanzania. Dar es Salaam: Economic and Social Research Foundation, 36.
Mbow, C., Rosenzweig, C. E., Barioni, L. G., Benton, T. G., Herrero, M., Krishnapillai, M., et al. (2020). “Food Security” in Climate Change and Land: an IPCC special report on climate change, desertification, land degradation, sustainable land management, food security, and greenhouse gas fluxes in terrestrial ecosystems. eds. P. R. Shukla, J. Skea, V. Calvo Buendia, V. Masson-Delmotte, H.-O. Pörtner, and D. C. Roberts, et al. (in press).
McKinney, W. (2010) Data structures for statistical computing in python. Proceedings of the 9th Python in science conference, 2010. Austin, TX, pp. 51–56.
Meynard, C. N., Lecoq, M., Chapuis, M.-P., and Piou, C. (2020). On the relative role of climate change and management in the current desert locust outbreak in East Africa. Glob. Chang. Biol. 26, 3753–3755. doi: 10.1111/gcb.15137
Mhache, E. (2017). The impact of climate change on food production in Lugoba Ward, Western Bagamoyo. Huria J. Open Univ. Tanzania 24, 191–207,
Moore, N., Alagarswamy, G., Pijanowski, B., Thornton, P., Lofgren, B., Olson, J., et al. (2012). East African food security as influenced by future climate change and land use change at local to regional scales. Clim. Chang. 110, 823–844. doi: 10.1007/s10584-011-0116-7
Mugabe, P. A. (2016). “Climate variability and food security in Tanzania: evidence from Western Bagamoyos” in Implementing climate change adaptation in cities and communities: Integrating strategies and educational approaches. eds. W. Leal Filho, K. Adamson, R. M. Dunk, U. M. Azeiteiro, S. Illingworth, and F. Alves (Cham: Springer International Publishing).
Mutai, C. C., and Ward, M. N. (2000). East African rainfall and the tropical circulation/convection on intraseasonal to interannual timescales. J. Clim. 13, 3915–3939. doi: 10.1175/1520-0442(2000)013<3915:EARATT>2.0.CO;2
Mwabumba, M., Yadav, B. K., Rwiza, M. J., Larbi, I., Dotse, S.-Q., Limantol, A. M., et al. (2022). Rainfall and temperature changes under different climate scenarios at the watersheds surrounding the Ngorongoro conservation area in Tanzania. Environ. Challenges 7:100446. doi: 10.1016/j.envc.2022.100446
Nicholson, S. E. (2014). A detailed look at the recent drought situation in the greater horn of Africa. J. Arid Environ. 103, 71–79. doi: 10.1016/j.jaridenv.2013.12.003
Nicholson, S. E. (2019). A review of climate dynamics and climate variability in eastern Africa. Limnology, climatology and paleoclimatology of the east African Lakes. 1st Edn. London: Routledge.
Omambia, C. S., and Gu, Y. (2010). The cost of climate change in Tanzania: impacts and adaptations. J. Am. Sci. 6, 182–196,
Ongoma, V., and Chen, H. (2017). Temporal and spatial variability of temperature and precipitation over East Africa from 1951 to 2010. Meteorog. Atmos. Phys. 129, 131–144. doi: 10.1007/s00703-016-0462-0
Onyutha, C. (2020). Analyses of rainfall extremes in East Africa based on observations from rain gauges and climate change simulations by Cordex Rcms. Clim. Dyn. 54, 4841–4864. doi: 10.1007/s00382-020-05264-9
Paavola, J. (2003). Vulnerability to climate change in Tanzania: sources, substance and solutions. A paper presented at the inaugural workshop of southern Africa vulnerability initiative (Savi) in Maputo, Mozambique June, 2003, pp. 19–21.
Palmer, P. I., Wainwright, C. M., Dong, B., Maidment, R. I., Wheeler, K. G., Gedney, N., et al. (2023). Drivers and impacts of eastern African rainfall variability. Nat. Rev. Earth Environ. 4, 254–270. doi: 10.1038/s43017-023-00397-x
Parry, M. L., Canziani, O., Palutikof, J., Van Der Linden, P., and Hanson, C. (2007). Climate change 2007-impacts, adaptation and vulnerability: Working group ii contribution to the fourth assessment report of the IPCC, Cambridge University Press.
Philander, S. G. H. (1985). El Niño and La Niña. J. Atmos. Sci. 42, 2652–2662. doi: 10.1175/1520-0469(1985)042<2652:ENALN>2.0.CO;2
Rathjens, H., Bieger, K., Srinivasan, R., Chaubey, I., and Arnold, J. (2016). Cmhyd user manual: Documentation for preparing simulated climate change data for hydrologic impact studies.
Rubekie, A. P., Pauline, N. M., and Kaaya, L. T. (2022). Coastal communities’ responses to climate change and variability impacts: a threat to coastal and marine resources? Clim. Dev. 14, 842–856. doi: 10.1080/17565529.2021.2018984
Scheffran, J., Link, P. M., and Schilling, J. (2019). Climate and conflict in Africa. Oxford research encyclopedia of climate science. Oxford: Oxford University Press.
Sen, P. K. (1968). Estimates of the regression coefficient based on Kendall's tau. J. Am. Stat. Assoc. 63, 1379–1389. doi: 10.1080/01621459.1968.10480934
Serdeczny, O., Adams, S., Baarsch, F., Coumou, D., Robinson, A., Hare, W., et al. (2017). Climate change impacts in sub-Saharan Africa: from physical changes to their social repercussions. Reg. Environ. Chang. 17, 1585–1600. doi: 10.1007/s10113-015-0910-2
Shikuku, K. M., Winowiecki, L., Twyman, J., Eitzinger, A., Perez, J. G., Mwongera, C., et al. (2017). Smallholder farmers’ attitudes and determinants of adaptation to climate risks in East Africa. Clim. Risk Manag. 16, 234–245. doi: 10.1016/j.crm.2017.03.001
Sylla, M., Giorgi, F., Coppola, E., and Mariotti, L. (2013). Uncertainties in daily rainfall over Africa: assessment of gridded observation products and evaluation of a regional climate model simulation. Int. J. Climatol. 33, 1805–1817. doi: 10.1002/joc.3551
Thalheimer, L., Otto, F., and Abele, S. (2021). Deciphering impacts and human responses to a changing climate in east Africa. Front. Clim. 3:692114. doi: 10.3389/fclim.2021.692114
Thornton, P., Jones, P., Alagarswamy, G., Andresen, J., and Herrero, M. (2010). Adapting to climate change: agricultural system and household impacts in East Africa. Agric. Syst. 103, 73–82. doi: 10.1016/j.agsy.2009.09.003
Uprety, Y., Shrestha, U. B., Rokaya, M. B., Shrestha, S., Chaudhary, R. P., Thakali, A., et al. (2017). Perceptions of climate change by highland communities in the Nepal Himalaya. Clim. Dev. 9, 649–661. doi: 10.1080/17565529.2017.1304886
Keywords: climate change, climate variability, temperature, rainfall, time series, food security, agriculture
Citation: Mugabe P, Kipkulei H, Sieber S, Mhache E and Löhr K (2024) Examining climate trends and patterns and their implications for agricultural productivity in Bagamoyo District, Tanzania. Front. Clim. 6:1346677. doi: 10.3389/fclim.2024.1346677
Edited by:
Farirai Rusere, University of the Witwatersrand, South AfricaReviewed by:
Priscilla Ntuchu Kephe, Potsdam Institute for Climate Impact Research (PIK), GermanyPortia Adade Williams, Science and Technology Policy Research Institute CSIR-STEPRI, Ghana
Copyright © 2024 Mugabe, Kipkulei, Sieber, Mhache and Löhr. This is an open-access article distributed under the terms of the Creative Commons Attribution License (CC BY). The use, distribution or reproduction in other forums is permitted, provided the original author(s) and the copyright owner(s) are credited and that the original publication in this journal is cited, in accordance with accepted academic practice. No use, distribution or reproduction is permitted which does not comply with these terms.
*Correspondence: Katharina Löhr, katharina.loehr@zalf.de
†ORCID: Paschal Mugabe, https://orcid.org/0000-0002-6592-2087
Harison Kipkulei, https://orcid.org/0000-0003-0643-2077
Stefan Sieber, https://orcid.org/0000-0002-4849-7277
Emmanuel Mhache, https://orcid.org/0000-0002-5580-5696
Katharina Löhr, https://orcid.org/0000-0003-2691-9712