Future projections of hurricane intensity in the southeastern U.S.: sensitivity to different Pseudo-Global Warming methods
 Patrick Olschewski
 Harald Kunstmann
- 1Institute of Meteorology and Climate Research (IMK-IFU), Karlsruhe Institute of Technology, Garmisch-Partenkirchen, Germany
- 2Institute of Geography and Centre for Climate Resilience, University of Augsburg, Augsburg, Germany
Tropical cyclones are prone to cause fatalities and damages reaching far into billions of US Dollars. There is evidence that these events could intensify under ongoing global warming, and accordingly disaster prevention and adaptation strategies are necessary. We apply Pseudo-Global Warming (PGW) as a computational cost-efficient alternative to conventional long-term modeling, enabling the assessment of historical events under future storylines. Not many studies specifically assess the sensitivity of PGW in the context of short-term extreme events in the United States. In an attempt to close this gap, this study explores the sensitivity of hurricane intensity to different PGW configurations, including a purely thermodynamic, a dynamic, and a more comprehensive modulation of initial and boundary conditions using the Weather and Research and Forecasting Model (WRF). The climate perturbations are calculated using two individual CMIP6 climate models with a relatively low and high temperature change and the CMIP6 ensemble mean, all under SSP5-8.5. WRF was set up in a two-way nesting framework using domains of 25 and 5 km spatial resolution. Results show that high uncertainties exist between the thermodynamic and dynamic approaches, whereas the deviations between the dynamic approach and the comprehensive variable modulation are low. Hurricanes modeled under the thermodynamic approach tend toward higher intensities, whereas the perturbation of wind under the dynamic approach may impose unwanted effects on cyclogenesis, for example due to increased vertical wind shear. The highest sensitivity, however, stems from the selected CMIP6 model. We conclude that PGW studies should thoroughly assess uncertainties imposed by the PGW scheme, similar to those imposed by model parameterizations. All simulation results suggest an increase in maximum wind speeds and precipitation for the high impact model and the ensemble mean. An unfolding of the inspected events in a warmer world could therefore exacerbate the impacts on nature and society.
1 Introduction
Tropical cyclones, due to their high intensity and large spatial extent, impose one of the greatest threats to coastal regions worldwide. Flooding and extreme wind speeds cause fatalities and injuries, as well as billions of US Dollars of economic and private losses annually and their effects are exacerbated due to their compounding nature within tropical cyclones. Despite their immense socioeconomic impacts, the probable behavior of tropical cyclones under ongoing global warming remains to be fully understood. In its Sixth Assessment Report, the Intergovernmental Panel on Climate Change (IPCC) states that, while the mechanisms and drivers of tropical cyclones are well-known, the derivation of long-term trends in both, frequency and intensity, is aggravated due to low data quality and availability (Seneviratne et al., 2021). On the other hand, the IPCC points out a remarkable number of studies indicating an increasing trend in the intensity of tropical cyclones. In the face of this trend, it is all the more important to be able to make accurate projections for the future, in order to provide suitable prevention and adaptation strategies. For a 2°C warmer world, compared to the pre-industrial age, Knutson et al. (2020) found the highest confidence in increasing storm surge levels, increasing near-storm precipitation rates, increase in global average intensity, and an increase in the proportion of Category 4 and 5 tropical cyclones.
In the United States, tropical cyclones, which are referred to as hurricanes, already today represent the costliest climate disasters (Smith and Katz, 2013). While Weinkle et al. (2018) found no significant trend in historical annual hurricane damages in the U.S., they point out the potentially detrimental effects that an increase in hurricane frequency and/or intensity may have in the future. This was taken up by Grinsted et al. (2019) and, using an alternative method, they found remarkable increases in the damage potential of hurricanes throughout the past. A plurality of studies projected the global indication of increased hurricane intensities under global warming to similarly apply for the North Atlantic basin (Ting et al., 2019; Jewson, 2023; Salarieh et al., 2023). Together with a high population density, socioeconomically important infrastructure, and an above-average population growth rate in hurricane-prone coastal counties (Park, 2021), this makes the U.S. Gulf Coast and Atlantic Coast a highly relevant region for climatological assessment of future hurricane intensities.
For climatological research, regional climate models have proven to be a valuable resource. Either driven by reanalysis, weather forecast, or projections from climate models, these models have been increasingly well-capable of reproducing hurricane characteristics such as track position and extremes of precipitation and wind throughout the past, enhancing our abilities in long-term climatological assessment (Camargo and Wing, 2016). On the other hand, performing long-term simulations for the future is not only computationally expensive, but can also limit the applicability. This affects, for example, conclusions drawn from multi-model, probabilistic long-term assessments, as these often go along with model-internal errors, uncertainties between multiple driving models, and statistical averaging (Knutti et al., 2013; Kennel et al., 2016). In this context, Shepherd et al. (2018) introduced the concept of storylines. The authors define a storyline as a physically self-consistent unfolding of past events, or of plausible future events and emphasize the event-based assessment of involved drivers and their plausibility within the storyline approach.
One combination of a storyline approach with regional climate modeling is the method of Pseudo-Global Warming (PGW). PGW embodies a computationally cost-efficient alternative to traditional long-term modeling. Instead of driving a regional climate model using the output of projection-based GCM data directly as initial and boundary conditions, a climate delta is extracted from the projection data and added to historical driving data, e.g., reanalysis (Schär et al., 1996; Lynn et al., 2009; Rasmussen et al., 2011; Brogli et al., 2023). This simplistic approach enables the possibility of assessing real historical events under future climate conditions.
PGW was applied in multiple studies focusing on tropical cyclone research, for example Chen et al. (2022), Chih et al. (2022), Toyoda et al. (2022), Tran et al. (2022), and Delfino et al. (2023) for the Northwest Pacific domain, Parker et al. (2018) for northeast Australia, and Nakamura and Mäll (2021) for the South Atlantic Ocean. One central study regarding PGW in the North Atlantic was conducted by Gutmann et al. (2018), who investigated 22 hurricanes between 2001 and 2013 under PGW derived from CMIP5 simulations. Additionally, several case studies applied PGW, for example Lynn et al. (2009) for Hurricane Katrina (2005) and Lackmann (2015) for Hurricane Sandy (2012). While all these studies have the PGW method in common, they differ in the decisive question of which variables are adjusted within the PGW set up. For example, Lackmann (2015), Chen et al. (2022), and Chih et al. (2022) explicitly assessed impacts of thermodynamic changes, i.e., temperature changes, on tropical cyclone intensity, whereas Lynn et al. (2009) and Nakamura and Mäll (2021) additionally added a dynamic component to the PGW set up, i.e., horizontal wind speed. Gutmann et al. (2018) and Parker et al. (2018) assessed tropical cyclones under an even more comprehensive PGW set up, additionally including surface and atmospheric pressure next to temperature and wind. While some studies conduct sensitivity testing regarding the PGW set up, for example Delfino et al. (2023), they are mostly limited to atmospheric and surface temperature changes, next to a comprehensive PGW set up. In addition, to our knowledge, there exists no systematic review of PGW sensitivity in the context of hurricane research for the North Atlantic domain, i.e., the United States. Xue et al. (2023) recently published a study in which sensitivity testing of the PGW method in the context of flooding events in the northeastern United States was conducted. This was performed under consideration of purely thermodynamic, as well as additional dynamic variables. Based on this example, this study is aimed at extending their investigations to the field of hurricane research for the United States, by addressing the following research questions: How does the perturbation of thermodynamic and dynamic variables within PGW affect the sensitivity of simulated hurricanes under future climate conditions? How large are the differences in the simulated hurricane intensity for purely thermodynamic PGW set ups and the inclusion of dynamic components and how do these differences impact the drawn conclusions? And to what extent are the selected hurricane events projected to increase or decrease in intensity and how sensitive are the results to the magnitude of climate change?
For this study, we selected five historical hurricane events based on historical significance in terms of storm intensity and losses. These include Isabel (2003), Katrina (2005), Irene (2011), Florence (2018), and Idalia (2023). In order to best reflect the variability in PGW set ups within the previously listed literature, we inspect three PGW set ups. These comprise of a thermodynamical set up adjusting surface and atmospheric temperatures, a dynamical set up additionally including horizontal wind speeds, and a more comprehensive (“full”) set up, in which surface and sea level pressure, geopotential, and relative humidity are additionally adjusted. The study is structured as follows: the acquired data sets, the regional climate model, and the applied methods are described in section 2, the results are presented in Section 3 and subsequently discussed in Section 4. Conclusions are drawn in Section 5.
2 Material and methods
2.1 Data
The initial and boundary conditions that drive the regional model were obtained from the latest generation reanalysis data provided by the European Centre for Medium-Range Weather Forecasts (ECMWF), ERA5 (Hersbach et al., 2023a,b). This dataset currently consists of over 200 variables within 137 vertical layers on an hourly basis and is spatially resolved at 31 km, respectively 0.25° × 0.25°, reaching from 1940 to the present (Hersbach et al., 2020). The data was extracted on an event-basis and handed to the regional model unmodified to conduct the historical simulations and modified according to the PGW scheme to conduct the PGW simulations.
The future projections, which are necessary to apply PGW, were obtained from CMIP6, the World Climate Research Programme's (WCRP) sixth phase of the Coupled Model Intercomparison Project (Eyring et al., 2016). An ensemble of 15 models was regarded (Table 1), based on the availability of the necessary variables, each from the 8.5 Wm−2 scenario within the Shared Socioeconomic Pathway 5 (SSP5-8.5). This scenario was selected in order to specifically address possible climate effects at the higher end of the spectrum of climate projections. While the likelihood of possible future scenarios is scientifically discussed, there is evidence that recent human activity causes an unfolding of future climate change close to Representative Concentration Pathway 8.5 (Christensen et al., 2018; Schwalm et al., 2020), which is situated within SSP5.
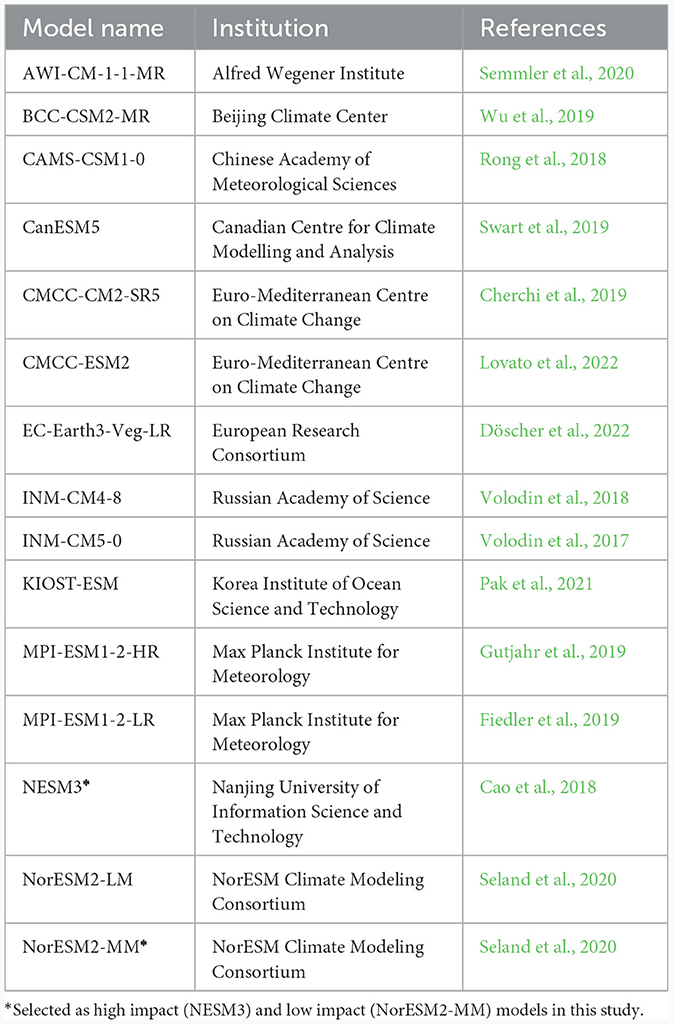
Table 1. Description of the 15 models from the CMIP6 ensemble used in this study.
The CMIP6 data was obtained for a historical (1985–2014) and a future time period (2071–2100) and the climate delta for PGW computed as the monthly mean difference between these periods. The selected ensemble of models continuously provides atmospheric information on 17 pressure levels reaching to the 1 hPa level. In order to match the 37 vertical layers included in the ERA5 input data, the CMIP6 data was cut off at the 50 hPa level and vertically interpolated. Based on Emanuel (2005) and Duan et al. (2018), the warming in sea surface temperature plays a pivotal role regarding hurricane intensity, therefore we selected the model with the highest and lowest projected increase in sea surface temperature and assessed the corresponding PGW runs as high impact and low impact runs. To simplify this selection, the model indicated by the majority of hurricane events was selected. Accordingly, NESM3 was selected as high impact model and NorESM2-MM as low impact model. This thermal impact was assessed for each event individually, by including all values within a 400 × 400 km box moving along with the simulated hurricane path (see also Section 2.4). Three different set ups (high impact, ensemble mean, low impact) were included in the final analysis.
To validate the historical WRF simulations driven by ERA5, the International Best Track Archive for Climate Stewardship (IBTrACS) dataset, version 4, was obtained (Knapp et al., 2018). This dataset provides extensive information on the position and intensity of tropical cyclones on a 3 hourly basis for basins around the world and is updated on a nearly day-to-day basis. The North Atlantic version of IBTrACS was obtained for this study and the data on maximum wind speed and minimum central pressure provided by U.S. agencies were used as reference. During the preparation of this study, only provisional track data was available for Hurricane Idalia, which may result in an increased level of uncertainty.
2.2. WRF set up
The Advanced Research Weather Research and Forecasting Model (WRF-ARW), version 4.4 (Skamarock et al., 2019), was used to conduct the simulations of this study. A plurality of studies has demonstrated the capabilities and suitability of WRF to simulate tropical cyclones across the globe, also when applying PGW, e.g., Gutmann et al. (2018), Chen et al. (2020), Nakamura and Mäll (2021), and Delfino et al. (2023). There exists no consensus on which WRF configurations within the wide range of possibilities deliver the most suitable results, imposing large uncertainties on the simulation results (Sun et al., 2023). However, the focus of this study is to specifically extract the uncertainties in the simulated hurricane intensity resulting solely from the PGW set up, which may add to the general uncertainty level when simulating tropical cyclones. Therefore, we adopted an established WRF set up that has proven to deliver acceptable results in the context of hurricane simulations, in detail described by Delfino et al. (2022, 2023).
WRF was set up in a two-way nesting framework for two domains. The first domain was resolved at 25 km horizontal resolution, the second domain at 5 km horizontal resolution. For both domains, WRF was run for 51 vertical eta levels with the 50 hPa level as top level. As parameterizations, WSM6 was used as microphysics scheme, RRTM scheme for longwave, and Dudhia scheme for shortwave radiation, as well as the Yonsei University PBL scheme, MM5 surface layer and the Noah Land Surface Model. Cumulus parameterization was conducted using the Kain-Fritsch scheme. In addition, a spectral nudging scheme was applied, to ensure comparable storm tracks of reference and simulation data and to allow for a comparison of simulations independently of the track position. Spectral nudging of u and v wind speeds was applied above the 500 hPa level and for wavelengths of 1,000 km and greater, as this sufficiently adjusted the main steering flow and therefore the tracks, but didn't influence the inner core of the storm system.
The simulation domain 1 (Figure 1) covers most of the tropical and subtropical North Atlantic, i.e., the region relevant for cyclogenesis, as well as large parts of the eastern and southern United States, Central America and northern South America. Domain 2 was specified to cover the decisive areas the selected hurricanes passed before making landfall. While Katrina, Irene, and Idalia developed and remained inside d02, Isabel and Florence developed in d01 and subsequently moved into d02, additionally allowing for a comparison of simulation performance between these two development types.
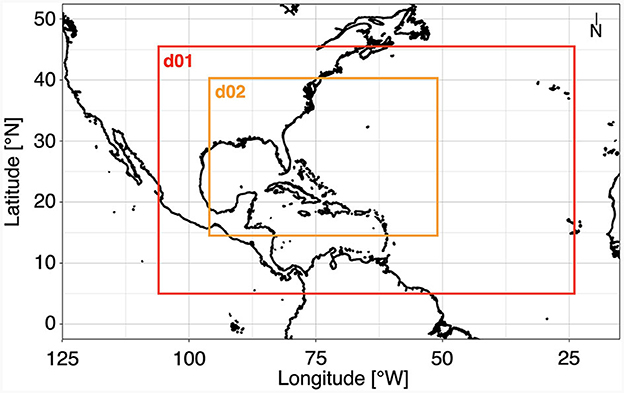
Figure 1. Study region and simulation domains. Domain 1 depicted by red outline, domain 2 depicted by orange outline.
As, for example, demonstrated by Delfino et al. (2023) and Sun et al. (2023), an initialization of WRF toward the beginning of cyclogenesis, i.e., during the transition from tropical depression to tropical cyclone intensity, with maximum wind speeds exceeding 18 m s−1, results in a higher simulation quality. Therefore, we initialize WRF at 24 August 2005 00 UTC for hurricane Katrina, 21 August 2011 06 UTC for Hurricane Irene, 07 September 2018 00 UTC for Hurricane Florence, and 27 August 2023 00 UTC fur Hurricane Idalia. Hurricane Isabel is an exception, with initialization taking place when the system enters domain 2, at 11 September 06 UTC. Preliminary testing showed no significant deviations in the simulation results when the simulation was initialized at 6 September 2003 00 UTC, which corresponds to the initialization time of the other events. In addition, as the results of this study show, no significant deviations in PGW sensitivity can be detected between Isabel and the other events. Similar to the parameterizations, initialization time is an uncertainty factor arising from WRF, not the PGW scheme, and was therefore beyond the scope of this study.
2.3 Pseudo-Global Warming—three approaches
In this study, we assess three different PGW set ups of increasing complexity, which are summarized in Table 2. First, the thermodynamic change signal is added to the event-based ERA5 data, including the deltas of air temperature on the 37 atmospheric pressure levels handed to WRF, as well as sea surface temperature and surface temperature. The second approach adds a dynamic component to the thermodynamic change signal, by including the deltas of u and v wind speeds throughout the 37 vertical levels. For the third approach, the deltas of atmospheric relative humidity and geopotential, surface pressure and sea level pressure are additionally altered next to the previously modified variables, accounting for what is hereafter referred to as “full” PGW. As the results below demonstrate, the most dominant deviations exist between the thermodynamic and the dynamic approach. In order to assess the statistical significance of these deviations, a statistical hypothesis test was performed and assessed for three significance levels, i.e., 10, 5, and 1%. The non-parametric Mann-Whitney U-test was chosen for hypothesis testing, since the Gaussian distribution could not be assumed for all samples (Student, 1908; Mann and Whitney, 1947). The further statistical evaluation is conducted using boxplots indicating the 25th percentile of a sample at the bottom of the box and the 75th percentile at the top of the box. Additionally, the median (50th percentile) is indicated by a bold line within the lower and upper box margins. To gain more insights into the high-impact extremes, the maximum values were included for maximum wind speed and precipitation, as well as the minimum values for sea level pressure.
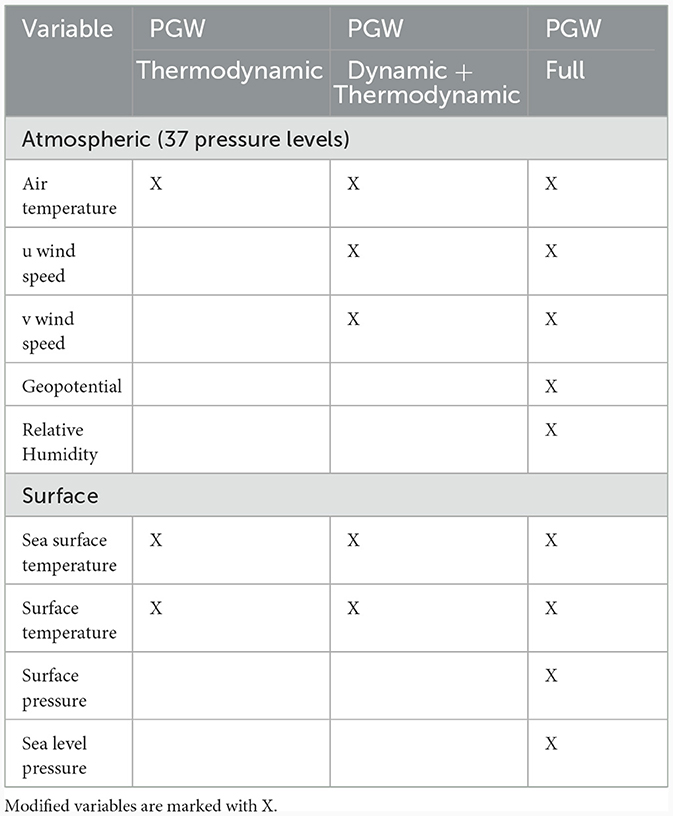
Table 2. Description of PGW set ups assessed in this study.
2.4 PGW modulations derived from CMIP6
The projected air and sea surface temperature changes, as provided by the 15 selected GCMs, are presented in Figure 2. The mean vertical atmospheric warming (Figure 2A) shows a similar structure across all events, with near-surface deviations reaching from slight positive changes up to ca. 4.5°C. With increasing altitude, the level of warming increases, reaching its maximum within the 250 and 150 hPa layers, at 3–9.5°C. Above the 100 hPa level, a cooling is projected within all models. The vertical warming pattern is similar among all models and the intensity of this warming is closely related to the projected increases in sea surface temperature (Figure 2). While there are only small variations between the selected events, the inter-model range lies within <1°C and up to 3.75°C. As described in Section 2.1, we selected a model with a high sea surface temperature delta, i.e., NESM3, and a model with a low sea surface temperature delta, i.e., NorESM2-MM, next to the ensemble mean, for the final investigation.
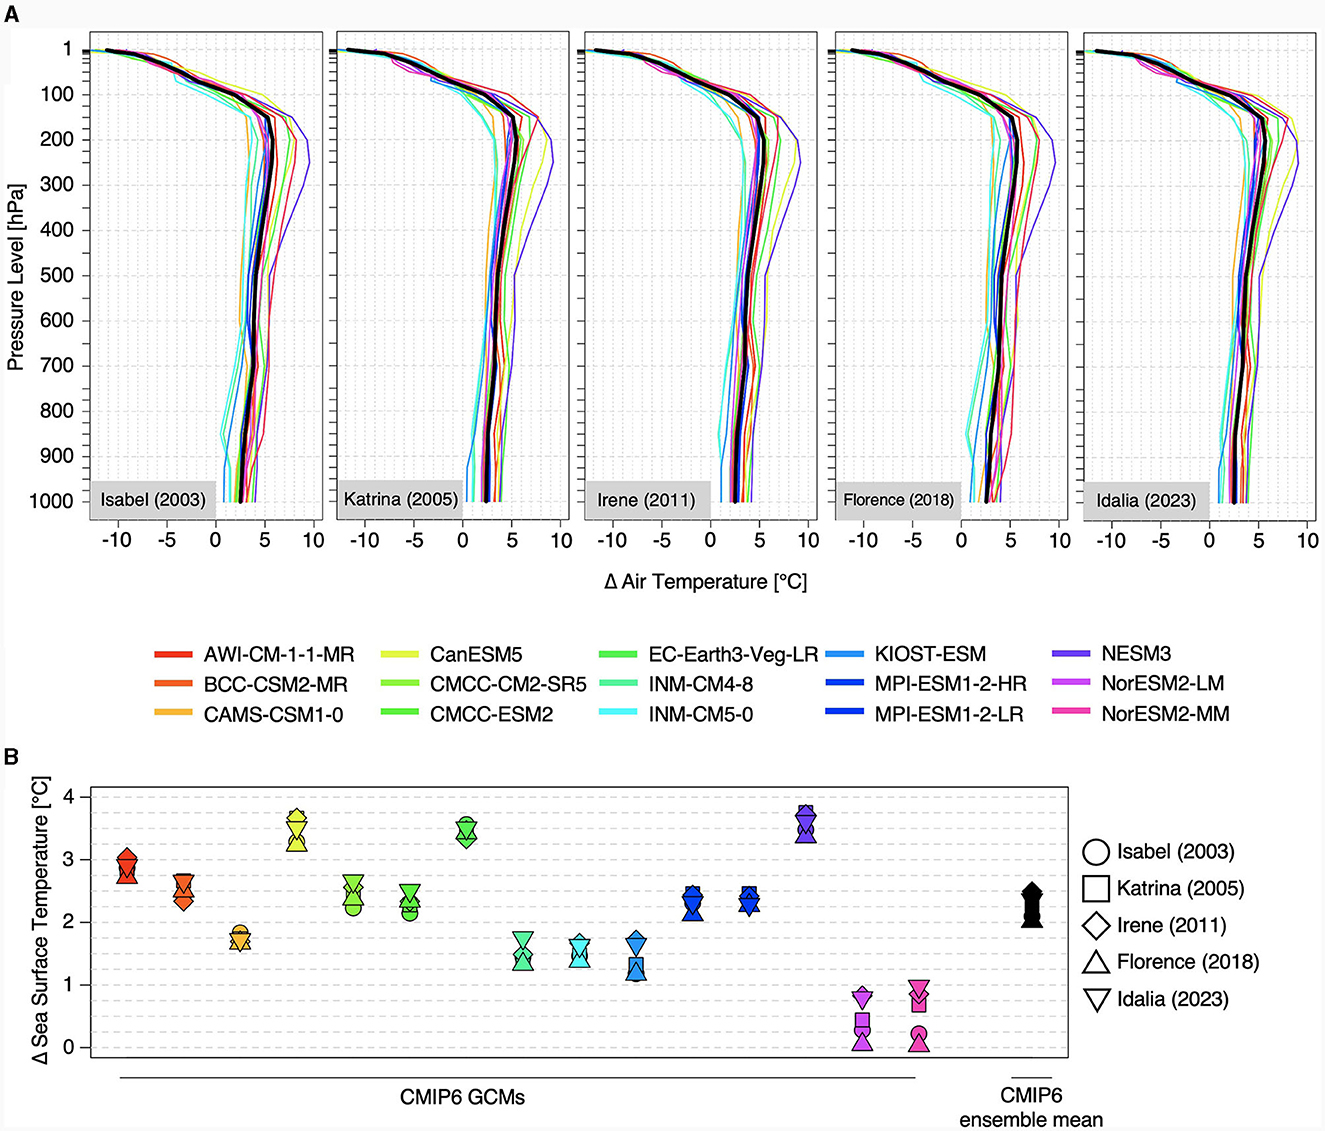
Figure 2. Projected spatial mean changes in (A) atmospheric temperature on 37 vertical pressure levels and (B) sea surface temperature, as given by the 15 selected GCMs (colors) and the ensemble mean (black). Depicted values embody spatial mean values of all grid cells within the 400 × 400 km box around the simulated storm center.
Next to the thermal deltas, u and v wind speed deltas are added for the dynamic and full PGW runs. The spatial extent of the conjoined projections of u and v vector magnitude is shown in Figures 3A, B, each for the 850 and 500 hPa level. In addition, the amount of vertical wind shear (VWS) is shown, which is defined as the difference in wind vector magnitude between the 200 and 850 hPa level and is consequential when including u and v deltas. It is important to note, that all descriptions refer to the change signal that is added to the ERA5 input data, instead of the actual atmospheric flow during the inspected events. In general, the three model set ups do not vary significantly between August and September. The NESM3 model projects an increased easterly flow for the tropical and extratropical regions and nearly no changes over the Gulf of Mexico and the Caribbean, on the mid-troposphere 500 hPa level. Closer to the surface, the change signal indicates increased westerly streams over the Gulf of Mexico and reaching out into the Atlantic. However, VWS is low throughout most parts of the domain. The NorESM2-MM model indicates increased continental off-shore winds streaming southward from the U.S. onto the Gulf of Mexico and subsequentially west to northwest into the open North Atlantic. This is similar for the 500 and 850 hPa level, while the intensity of change is markable lower for the latter. Also, a high level of VWS is indicated for most of the Gulf of Mexico, the northern Caribbean and the North Atlantic. By nature, most extremes within the 15 ensemble members are smoothed when computing averages, and therefore the ensemble mean indicates the weakest changes. These generally comprise of an increased tendency toward westerly flows, originating from the continental U.S. and Mexico, reaching southeastward into the Gulf of Mexico and the Caribbean, before shifting northwestward over the North Atlantic. In addition, the deltas of u and v amount to a notable amount of VWS.
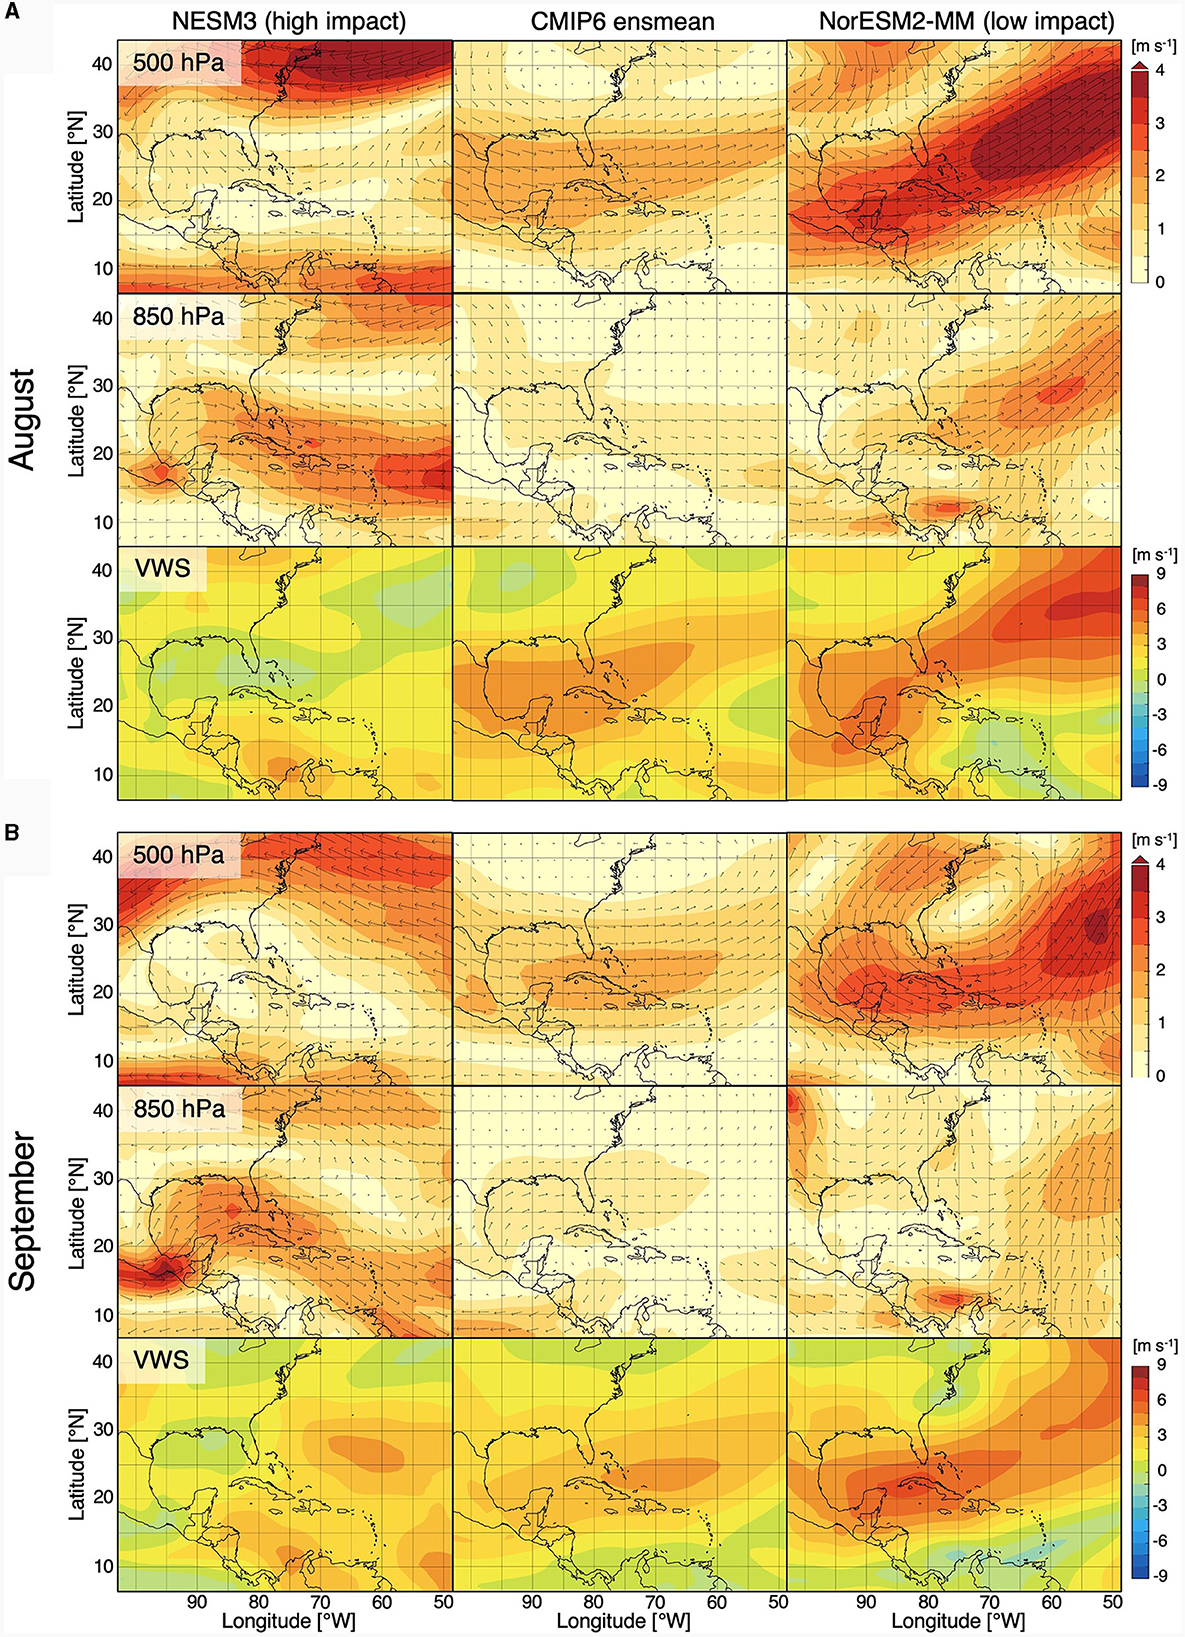
Figure 3. Projected mean monthly wind changes for (A) August and (B) September. Top row denotes changes in horizontal wind speed and direction on the 500 hPa level, second row same as first row, but for the 850 hPa level. Bottom row denotes changes in vertical wind shear. First column shows changes in high impact model (NESM3), second column denotes ensemble mean, third column shows low impact model (NorESM2-MM).
For the full PGW set up, relative humidity, geopotential, surface pressure, and sea level pressure are adjusted. As relative humidity is not expected to significantly impact the results (Xue et al., 2023) and geopotential is closely related to changes in air temperature, the corresponding deltas are not explicitly highlighted. Since this study focuses on maritime areas, the projected changes in surface pressure and sea level pressure are equivalent. Therefore, the spatial extent of the projected changes in surface pressure, next to sea surface temperature, is displayed in Figures 4A, B. These projected changes are similar for August and September. For the high impact model, the warming in sea surface temperature reaches 3–4°C for most parts of the domain, accompanied by extremes of more than 5°C. Within the relevant region for cyclogenesis, a latitudinal low-pressure trough reaching from the eastern U.S. across the North Atlantic to the Azores is added to the historical model input data. The low impact model projects an increase in sea surface temperature south of 25°N of up to 2°C. North of 25°N, only marginal changes or slight decreases are projected, with decreases being highest around the shorelines of the U.S. In terms of surface pressure, the model predicts a slight decrease of <1 hPa. The ensemble mean sea surface temperature warming is 2–3°C, with slight local deviations, and surface pressure is slightly increased, but not more than 1 hPa.
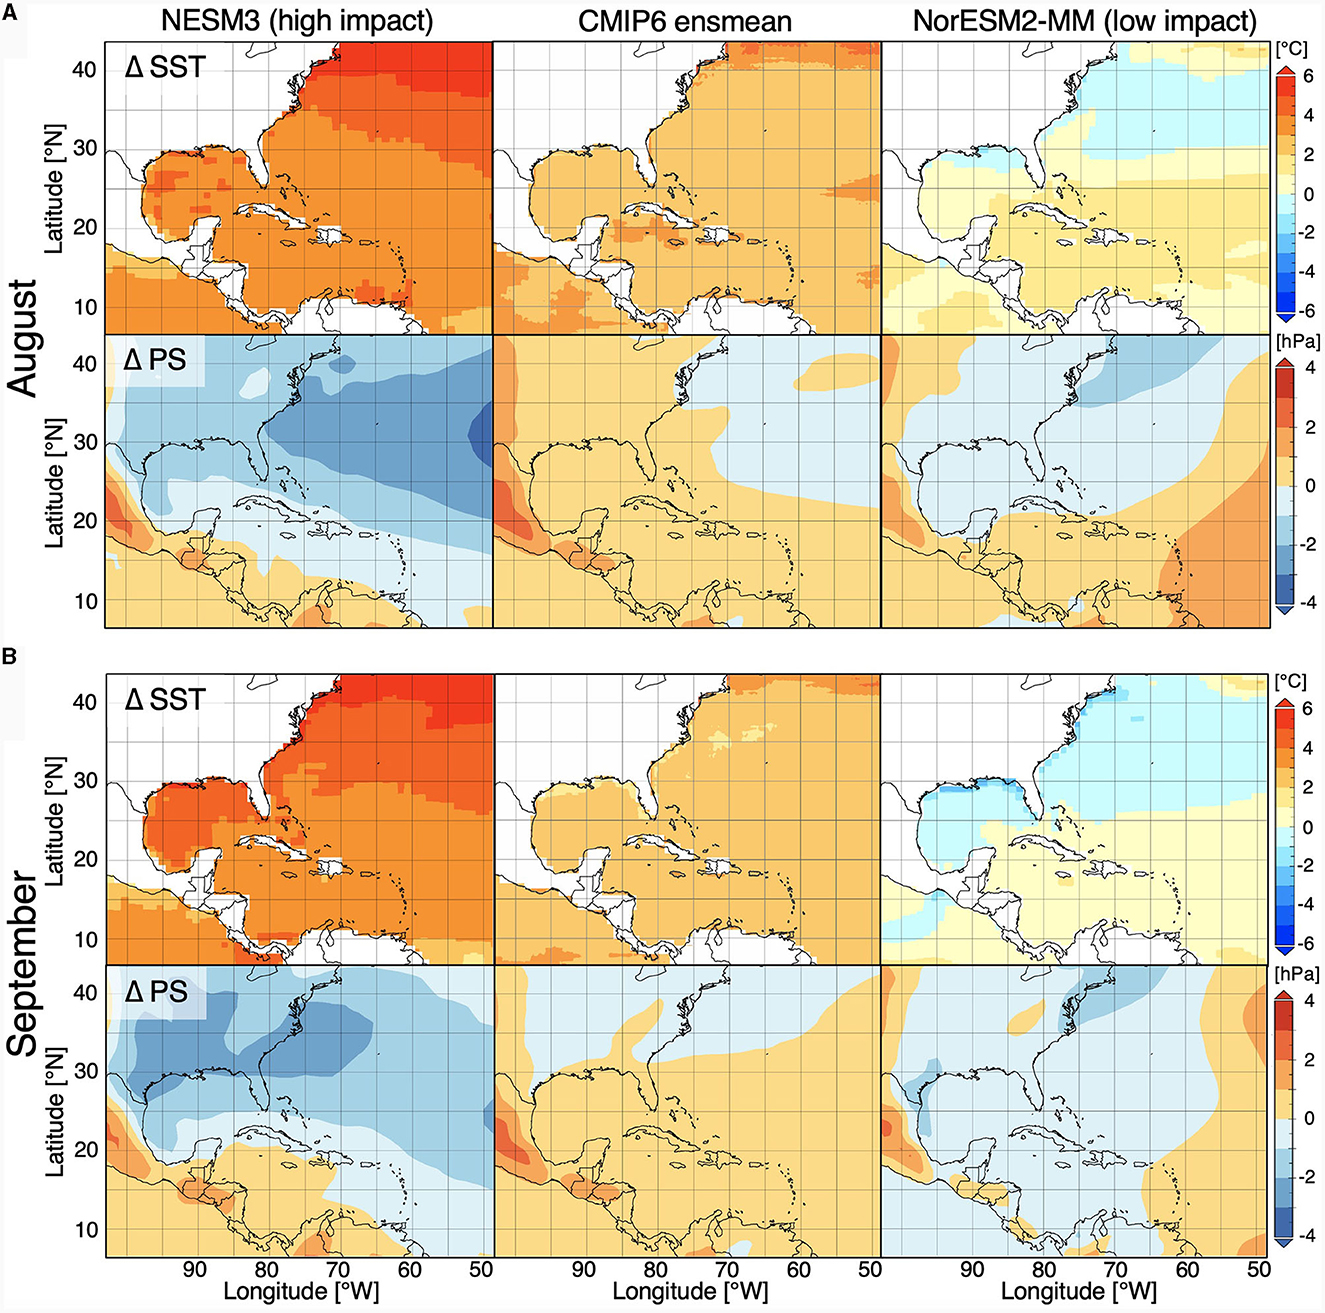
Figure 4. Projected mean monthly surface changes for (A) August and (B) September. Top row denotes changes in sea surface temperature, bottom row denotes changes in surface pressure. First column shows changes in high impact model (NESM3), second column denotes ensemble mean, third column shows low impact model (NorESM2-MM).
2.5 Case descriptions
All financial losses listed below are given by the National Oceanic and Atmospheric Administration (NOAA-NCEI, 2023). Hurricane Isabel developed west of the Cape Verde Islands and reached hurricane intensity on 07 September 2003. After attaining category five shortly after, Isabel made landfall in North Carolina on 18 September as category two storm, making it one of the strongest Cape Verde hurricanes to make landfall in the US, causing over 50 fatalities and $5.5 bn in damages (Beven and Cobb, 2014).
Hurricane Katrina developed quickly over the Bahamas and made its first landfall over Florida on 25 August 2005. While moving west into the Gulf of Mexico, the storm rapidly intensified and reached peak intensity as category five storm in 28 August. Katrina made landfall over Louisiana as category three storm on 29 August. It is to date the hurricane with the highest damage amount on record, causing $125 bn in damages, in addition to 1,392 fatalities (Knabb et al., 2023).
Hurricane Irene formed over the Lesser Antilles and subsequently intensified into a hurricane on 22 August 2011. Continuing its path northwest, the storm reached peak intensity as category three system on 23 August. Shifting north, Irene slightly weakened and made landfall over North Carolina on 27 August as category one storm. Irene caused at least 48 fatalities and $13.5 bn in damages (Avila and Cangialosi, 2013).
Hurricane Florence developed south of Cape Verde and moved northwestward over the Atlantic Ocean, taking a similar path to Isabel. On 08 September, the storm shifted to the west and re-intensified, reaching peak intensity on 11 September. Florence made landfall on 14 September as a category one storm. The slow movement of the system around the time of landfall caused significant precipitation amounts and widespread flooding, resulting in 15 fatalities and $24 bn in damages (Stewart and Berg, 2019).
Idalia developed east of the Yucatán Peninsula and moved into the Gulf of Mexico, reaching hurricane intensity on 29 August 2023. One day later, Idalia made landfall over Florida as category three system, after an extremely rapid intensification into a category four system at peak intensity on early 30 August. While no final impact estimations were available during the preparation of this study, the extreme intensification process makes it interesting for further research.
2.6 Tracking algorithm
In order to statistically analyze the simulated storms and validate the results with IBTrACS, we adopted an objective hurricane tracking algorithm developed by Gutmann et al. (2018). Accordingly, hourly 10 m wind speeds and surface pressure, which are output from WRF, were used to identify the center of a hurricane candidate. Gutmann et al. (2018) used a specified threshold of 27 hPa below the 13-year maximum pressure of the corresponding grid cell and maximum wind speeds exceeding 25 m s−1 in a 400 × 400 km box surrounding the candidate grid cell to determine the onset of continuous tracking. Analogous to Gutmann et al. (2018), the WRF diagnostics flag for maximum wind speed was not activated. Since intensities varied greatly between different PGW set ups, the start time of tracking was harmonized across all simulations of a specific event according to the model run with the latest onset of tracking, to ensure that all resulting data sets have an equal number of time steps. While the initialization of tracking is solely based on the metrics of the tracking algorithm, a minimum spin up time of 21 h was ensured for all events. When tracking was initiated, the 400 × 400 km box around the current storm center was investigated for a pressure minimum in the subsequent timestep. If this minimum remained 17 hPa below the long-term local maximum pressure and maximum wind speed within the box was above 15 m s−1 for at least one grid cell, tracking was continued. Next to minimum surface pressure and maximum wind speed, one hourly maximum and mean precipitation rates, the radius of >33 m s−1 wind speed, and the translation speed were also tracked. As land areas may negatively influence the simulation quality, the following statistical analyses only include data until landfall.
3 Results
3.1 Model validation
The storm track, as well as the time series of minimum central pressure and maximum wind speed, as provided by IBTrACS, were used to validate the historical simulation results driven by ERA5. The simulated tracks, including those of the PGW runs further examined in Section 3.3, are shown in Figure 5. Across all simulations, including historical and PGW runs, there is a high agreement with the reference data, apart from isolated small uncertainties close to the initialization time and after landfall, proving the functionality of the spectral nudging scheme. There is in general close agreement of the historical and simulated hurricane tracks. This is a benefit allowing for a more robust comparison of the different simulations, as each simulated hurricane passes through a similar environment. The temporal evolution of the storm intensities is shown in Figure 6. For Irene (Figure 6C) and Idalia (Figure 6E), the simulated intensity closely coincides with the reference, capturing both, the temporal succession, as well as the intensification process and peak intensity. For Katrina (Figure 6B), central pressure is slightly underestimated throughout the intensification process, and wind speed correspondingly overestimated. On the other hand, while the temporal succession is captured well, the peak intensity is not fully captured by the model. This is also the case for Isabel (Figure 6A), for which the peak intensity is underestimated. However, after the track shift and corresponding intensity weakening, the reference data is matched closely. For Florence (Figure 6D), a general overestimation of central minimum pressure occurs, while the general temporal succession is captured well. While maximum wind speed is underestimated throughout the phase of peak intensity, it remains close to the reference subsequently until landfall.
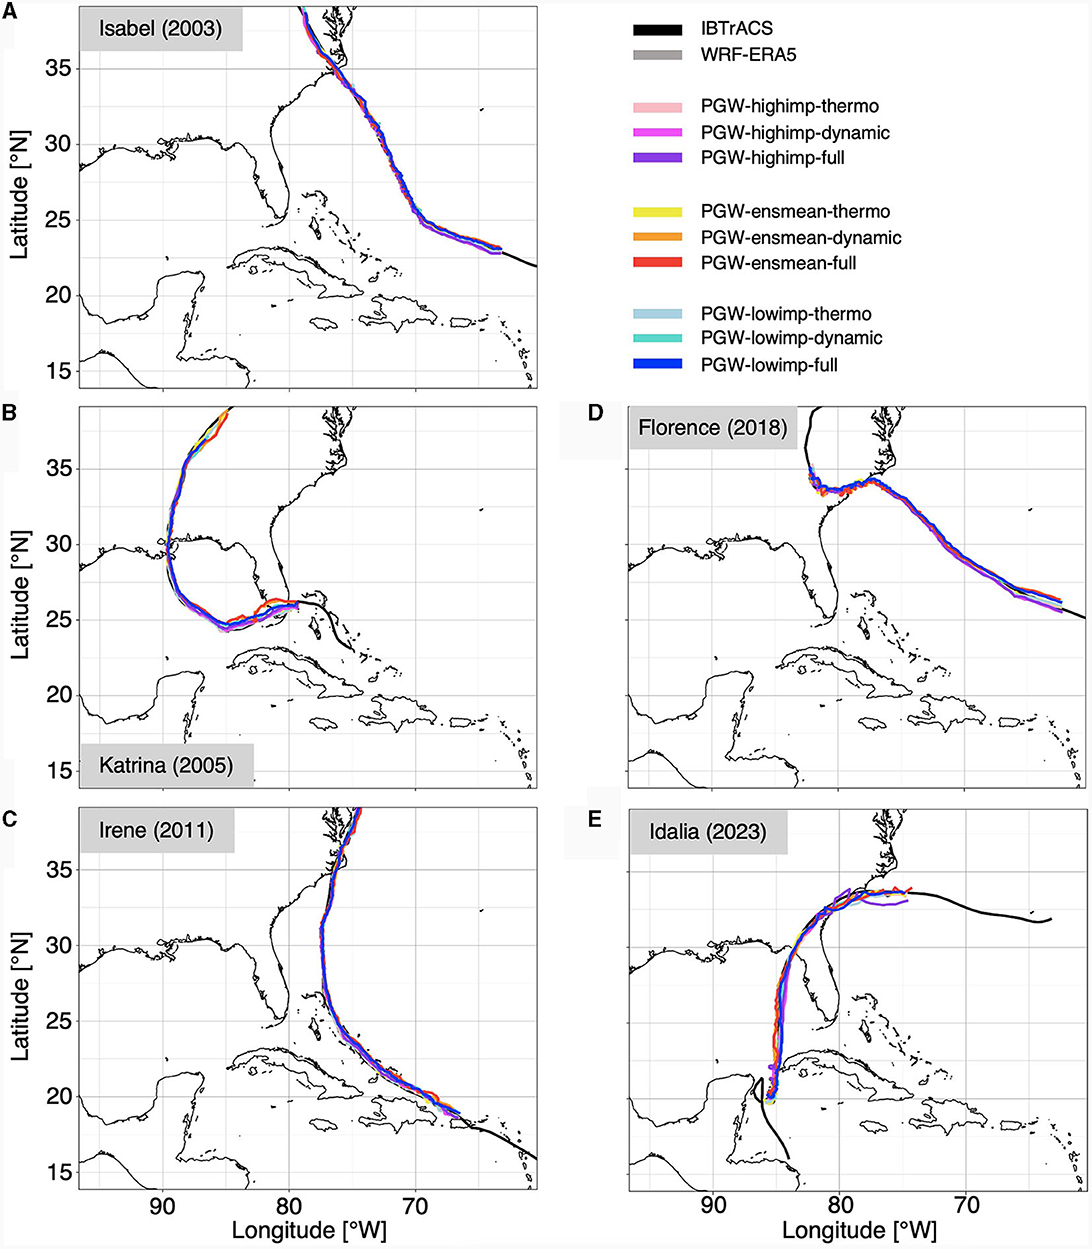
Figure 5. Simulated and reference tracks of the five hurricane events: (A) Isabel, (B) Katrina, (C) Irene, (D) Florence, (E) Idalia. IBTrACS reference data in gray, WRF simulation driven by ERA5 in black. WRF simulation results under PGW perturbation using the high impact model (“highimp”), ensemble mean (“ensmean”), and low impact model (“lowimp”), each for the thermodynamic set up (“thermo”), thermodynamic + dynamic set up (“dynamic”), and full PGW set up (“full”) in colors.
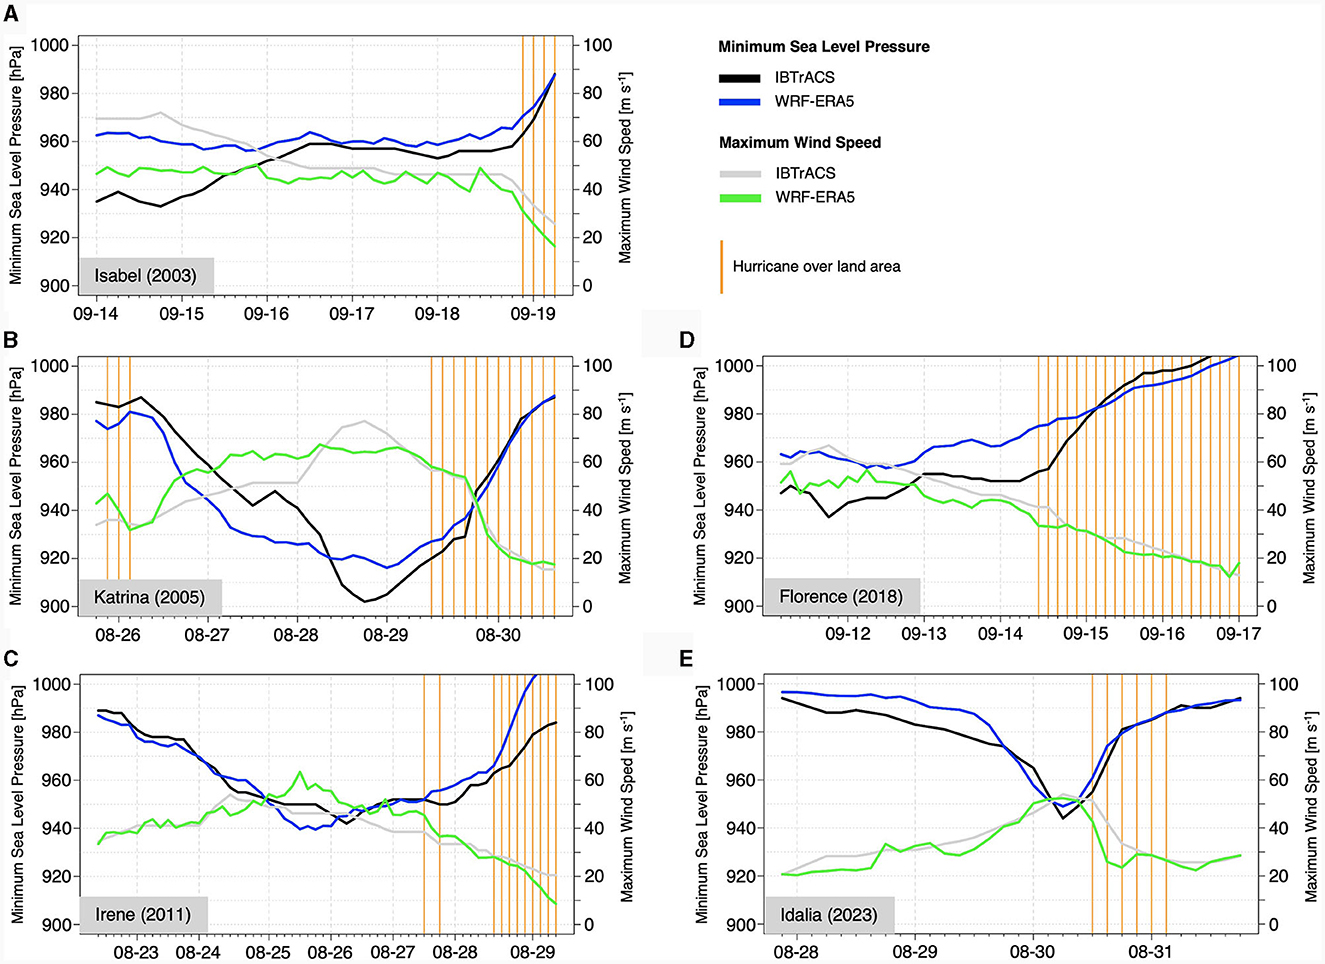
Figure 6. Simulated and reference historical intensities of the five hurricane events: (A) Isabel, (B) Katrina, (C) Irene, (D) Florence, (E) Idalia. Minimum central pressure on the left axis, IBTrACS data in black, WRF simulation results in blue. Maximum wind speed on the right axis, IBTrACS data in gray, WRF simulation results in green.
3.2 PGW assessment
Figure 7 shows the temporal succession of the five selected hurricanes for the ERA5-driven simulation, as well as the nine sensitivity runs, each for the central minimum pressure and the maximum wind speed. The sensitivity runs consist of combinations of each one of the three CMIP6-based data modulations (highimp, ensmean, lowimp) and the three PGW configurations (thermo, dynamic, full, w.r.t Table 2). Due to the close physical relation of air pressure and wind speed, both metrics are hereafter jointly assessed under the term intensity.
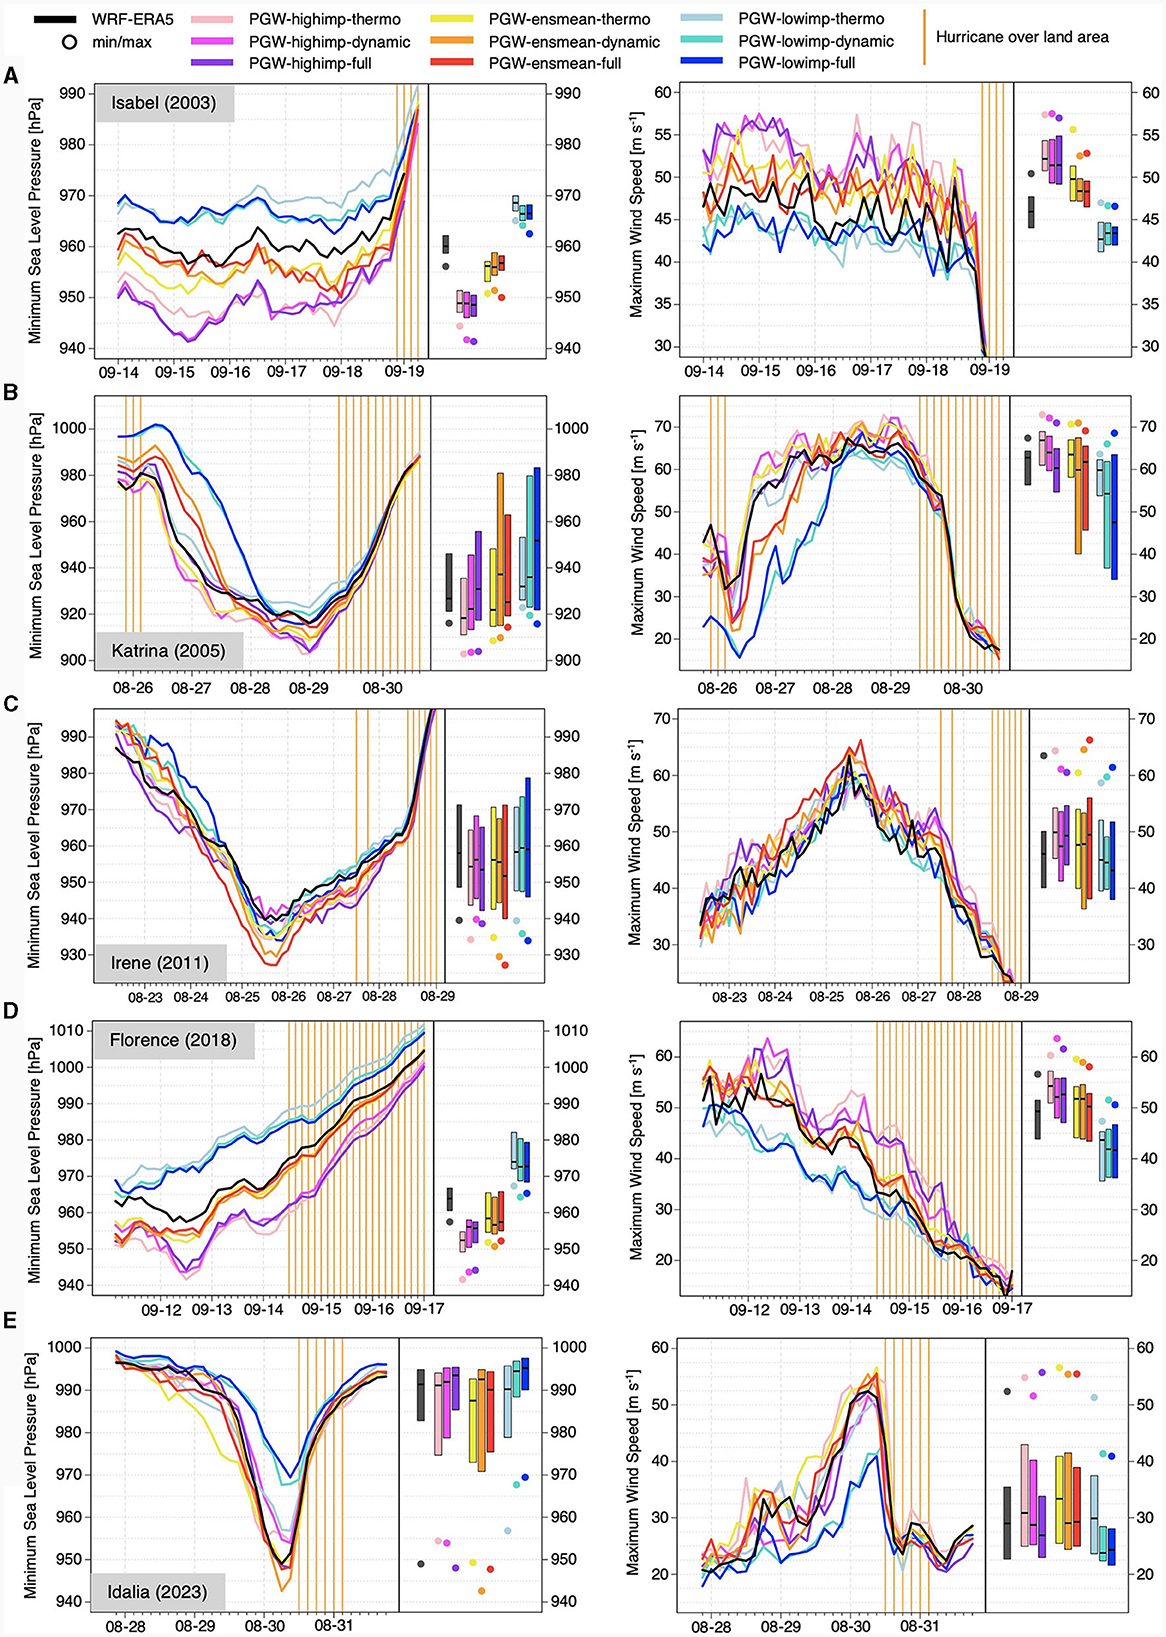
Figure 7. Temporal succession of minimum central pressure (left column) and maximum wind speed (right column) for the five hurricane events: (A) Isabel, (B) Katrina, (C) Irene, (D) Florence, (E) Idalia. WRF simulation driven by ERA5 in black. WRF simulation results under PGW perturbation using the high impact model (“highimp”), ensemble mean (“ensmean”), and low impact model (“lowimp”), each for the thermodynamic set up (“thermo”), thermodynamic + dynamic set up (“dynamic”), and full PGW set up (“full”) in colors. Boxplots depict 25th and 75th percentile (top and bottom of box), as well as the median (bold). Extreme values depicted by colored circles.
In general, across all events, the results are most sensitive to the selection of the GCM. The simulated hurricanes under the low impact model are remarkably less intense than those of the other data modulators. In addition, the low impact simulations are weaker than the reference simulation, with Irene being an exception, where results are comparable. The most significant deviations occur for Isabel and Florence, where the median deviation in central pressure/wind speed is >6 hPa/<-3 m s−1 and >9 hPa/<-6 m s−1, respectively. For the ensemble mean and the high impact model, results differ depending on the month of occurrence. For events occurring in September (Isabel, Florence), the hurricanes under the high impact model are more intense across all PGW configurations, both in terms of median and maximum values. The most extreme deviations are −15 hPa/7 m s−1 for Isabel and −16.5 hPa/6 m s−1 for Florence. For events occurring in August (Katrina, Irene, Idalia), results differ less, with extremes of the ensemble mean-based simulations exceeding those of the high impact model for Irene and Idalia. The most extreme deviations for Katrina are −13.5 hPa/5.5 m s−1, for Irene −13 hPa/3 m s−1, and for Idalia −6.5 hPa/4.5 m s−1.
Regarding the sensitivity to the PGW set up, the largest deviations occur between the purely thermal and the dynamical adjustment. These deviations can be seen best for Katrina and Idalia, for the ensemble mean and the low impact model. The high impact model shows similar deviations, but considerably less distinct. The thermally adjusted runs produce intensities closely resembling the historical simulation, with slightly increased intensities for the ensemble mean and slightly decreased intensities for the low impact model. Both runs including a dynamical PGW adjustment, however, are significantly less intense throughout the intensification and peak intensity stages. For Isabel and Florence, the same effect can be seen, but the deviations of the thermally and dynamically adjusted runs are less dominant. All inspected cases have a high similarity of the dynamically adjusted and full PGW runs in common. The distinct deviations between the thermodynamical and dynamical set up are substantiated when inspecting their statistical significance (Table 3). For the low impact model, deviations in minimum sea level pressure and maximum wind speed are highly significant for Isabel, Katrina, and Irene. Statistical significance is also given for Isabel and Katrina under the CMIP6 ensemble mean. For the high impact model, only Irene shows statistically significant deviations.
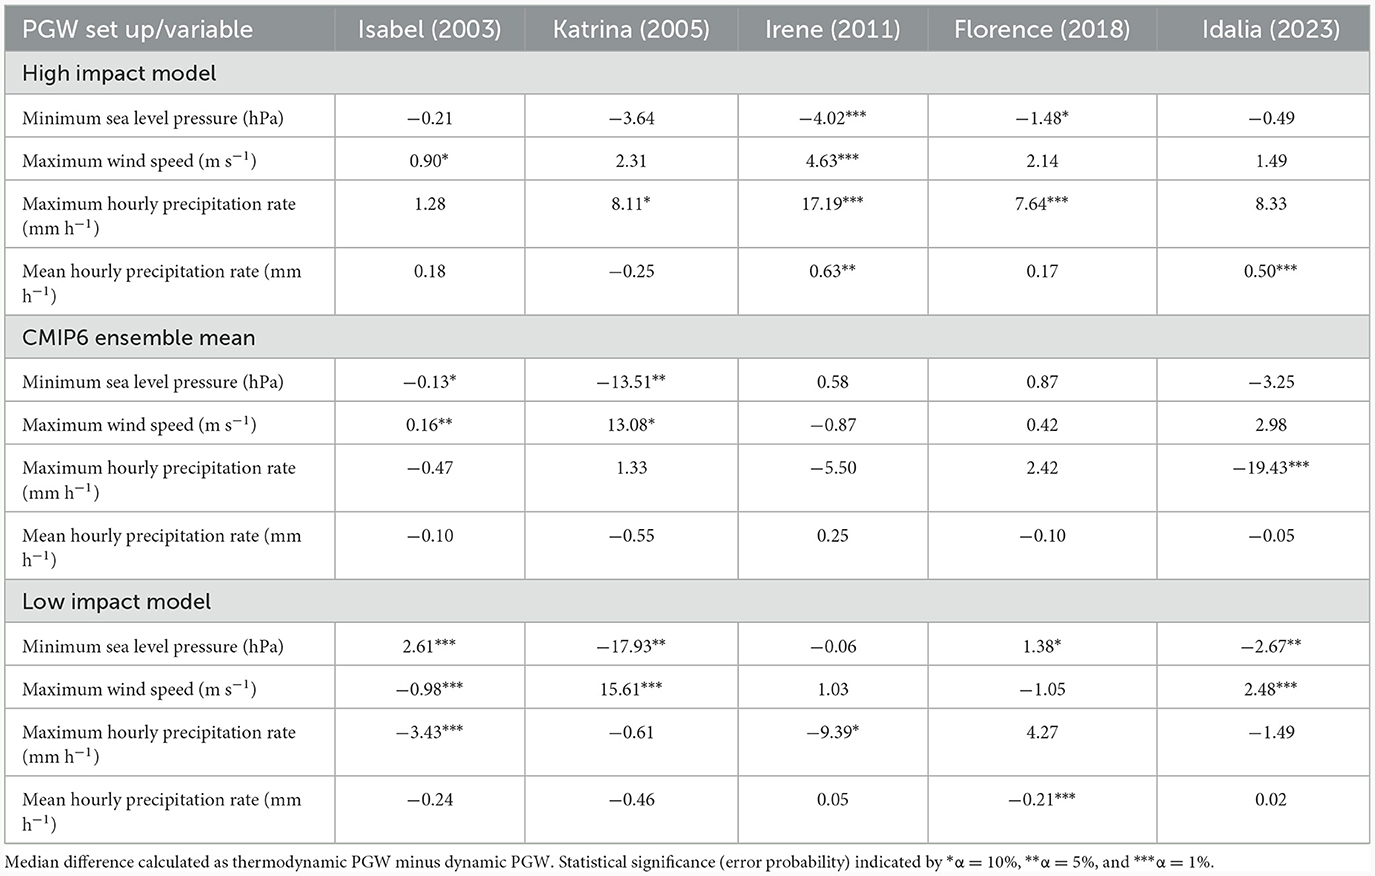
Table 3. Median difference and results of statistical significance testing for the thermodynamically and dynamically adjusted PGW simulations.
3.3 Precipitation assessment
The temporal succession of the maximum and mean 1-hourly precipitation rate within the 400 × 400 km box around the storm center are shown in Figure 8. As for minimum pressure and maximum wind speed, the highest sensitivity emanates from the GCM selection. This is most apparent for Isabel, Katrina, and Florence, whereas the deviations are less distinct for Irene and Idalia. Throughout all cases, distinct increases in both, maximum and mean precipitation rates, are detected for the high impact model and the ensemble mean. The low impact model delivers results that are in close statistical range of the historical simulation. However, the extreme values under the low impact model are mostly lower than the historical simulation.
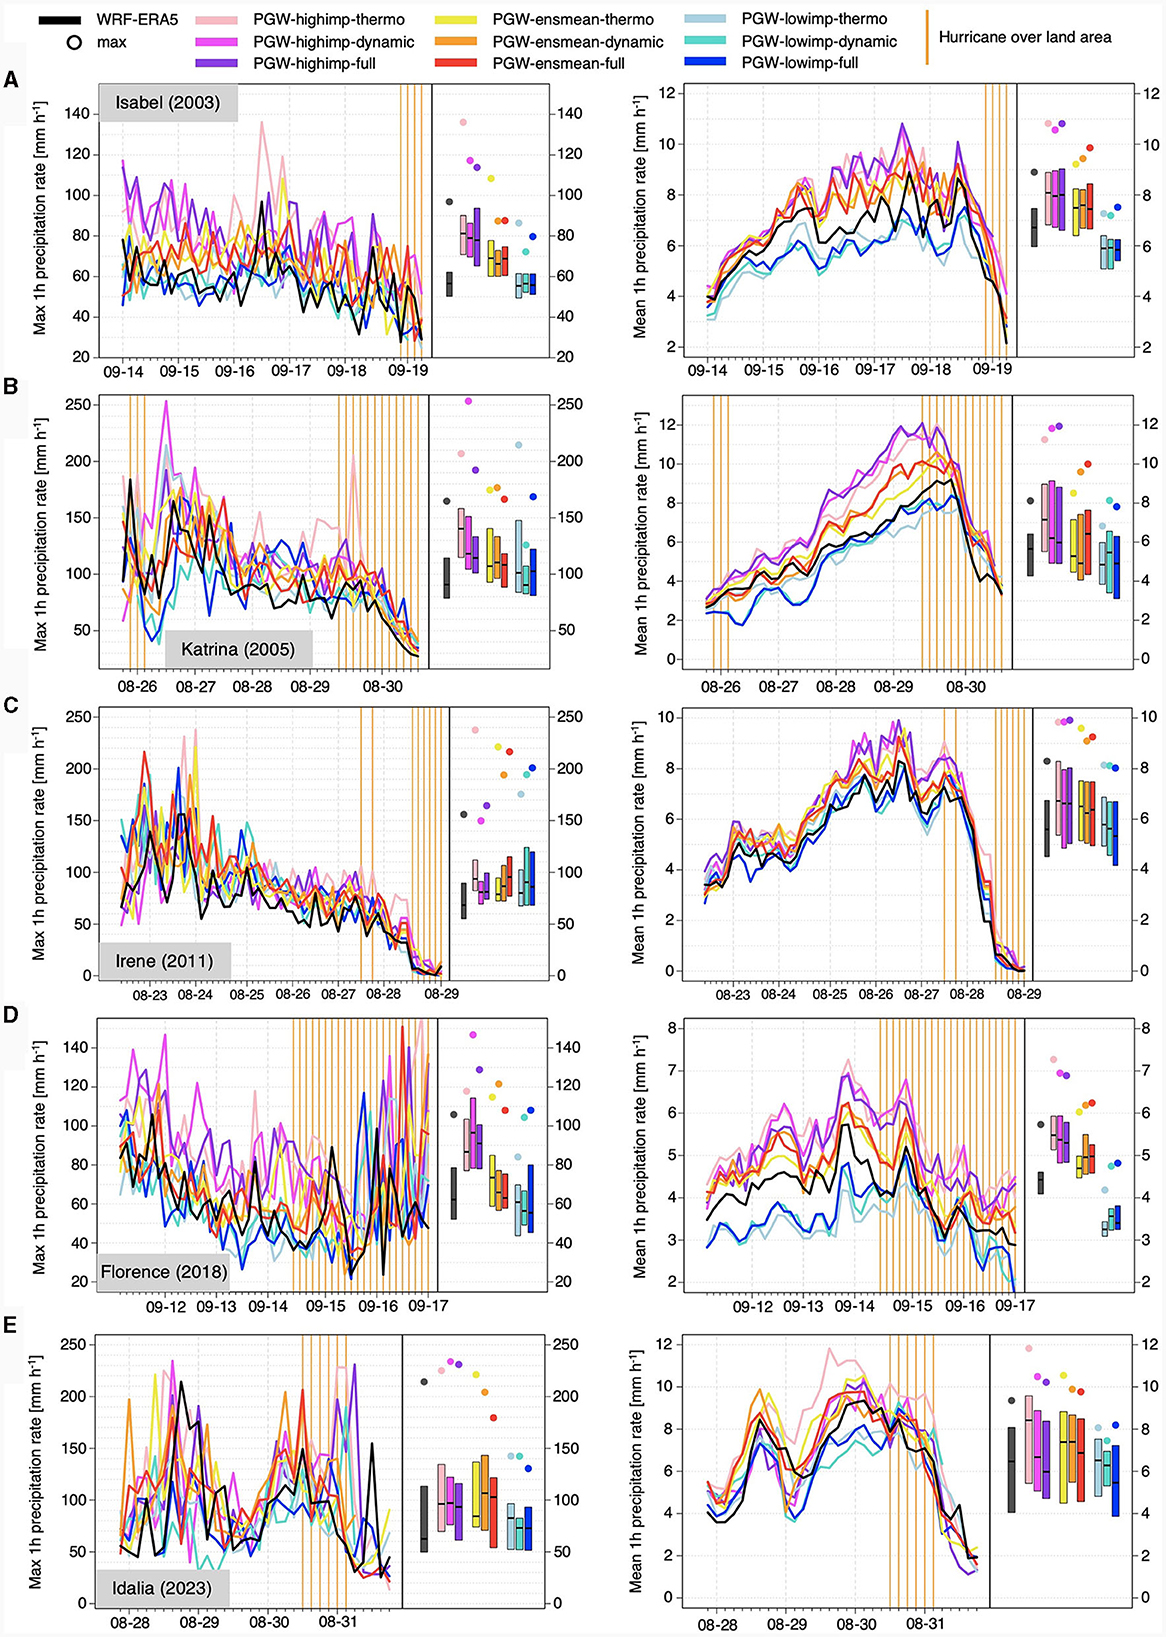
Figure 8. Temporal succession of 1-hourly maximum (left column) and mean (right column) precipitation rates for the five hurricane events: (A) Isabel, (B) Katrina, (C) Irene, (D) Florence, (E) Idalia. WRF simulation driven by ERA5 in black. WRF simulation results under PGW perturbation using the high impact model (“highimp”), ensemble mean (“ensmean”), and low impact model (“lowimp”), each for the thermodynamic set up (“thermo”), thermodynamic + dynamic set up (“dynamic”), and full PGW set up (“full”) in colors. Boxplots depict 25th and 75th percentile (top and bottom of box), as well as the median (bold). Extreme values depicted by colored circles.
For maximum precipitation, while some configurations show significant deviations (Table 3), no general statement regarding the sensitivity to the PGW set up can be made, with each of the three set ups appearing as highest and lowest deviation for specific events and set ups. The largest potential increase in the median of maximum 1-hourly precipitation is reached under the high impact GCM for four events, and under the ensemble mean for Idalia, reaching ca. 43, 56, 40, 53, and 74%, respectively, for Isabel, Katrina, Irene, Florence, and Idalia. A similar picture is given for the temporal maximum values of 1-hourly maximum precipitation, with maximum increases of ca. 42, 55, 52, 39, and 10%, with Idalia being an outlier.
In terms of mean 1-hourly precipitation, there is a more distinct deviation between the thermally and dynamically adjusted PGW runs resembling that of the minimum central pressure. However, fewer events show this distinction clearly, i.e., Katrina, Florence, and Idalia. On the other hand, the runs driven by the three different GCM set ups show a clearer distinction than for maximum precipitation, with higher precipitation levels under the high impact model and the ensemble mean and similar/lower precipitation levels under the low impact model across all events. The maximum range of increase in the median of 1-hourly mean precipitation is ca. 19, 29, 21, 25, and 29%, respectively, for Isabel, Katrina, Irene, Florence, and Idalia. As for maximum precipitation, the changes in the temporal maximum of the 1-hourly precipitation mean correspond closely, with respective increases of ca. 21, 45, 19, 26, and 27%.
4 Discussion
In the following sections, the different components of the results of this study are subsequently discussed. This firstly includes the simulation quality for the historical cases with regard to the IBTrACS reference, explicitly assessing the suitability of the WRF set up. Next to the sensitivity of the PGW runs regarding the GCM and the set-up selection, the potential consequences of increased hurricane intensity, as suggested by the models, are highlighted, as well as limitations linked to this study.
4.1 WRF suitability
In general, the simulated hurricanes using ERA5 as driving data lie well within the error margins of former studies (Islam et al., 2015; Gutmann et al., 2018; Di et al., 2019; Lui et al., 2021; Delfino et al., 2023). This is especially the case for Irene and Idalia, for which the simulated minimum central pressure and maximum wind speed closely agree with the IBTrACS reference throughout the entire study period. The historical simulation of Katrina shows some intensity overestimation within the intensification period, but subsequently the model underestimates the highest intensities below 918 hPa and above 67 m s−1. This can, however, be expected, as the selected spatial and temporal resolution is too coarse to simulate the highest intensities. The same issue appears for Isabel and Florence, who depict an intensity underestimation for the strongest phase, which is in both cases close to the beginning of the study periods. For Isabel, the agreement of storm intensity is high after the phase of de-intensification and remains high until landfall. Hurricane Florence inherits the largest deviations from the reference in terms of central pressure. Maximum wind speed, apart from an underestimation at the beginning of the study period, is yet in close agreement with the reference. This effect of overestimated central pressure but close agreement in wind speed was also detected by Delfino et al. (2023), whose WRF set up was adapted in this study. In addition, the results for Florence regarding PGW sensitivity do not significantly deviate from those of the other events, suggesting some amount of robustness of the PGW sensitivity toward the historical simulation correspondence. Concluding, while some deviations in storm intensity do appear, we evaluate the initial simulations results as suitable for the context of this study. Next to the literature review, this becomes evident by no discernible difference in PGW sensitivity for phases of high and low agreement of WRF with IBTrACS, as well as for events of differing correspondence with IBTrACS. In addition to the good agreement of pressure and wind speed, the track accuracy is high throughout all historical and PGW simulations. With central pressure for Florence being one exception, the agreement of alle three evaluation metrics is high close to landfall, making the results regarding projected intensity changes particularly valuable for the assessment of socioeconomical impacts and adaptation strategies.
4.2 PGW sensitivity
It is well-understood that sea surface temperature is one of the most important modulators of hurricane intensity, as a higher sea surface temperature offers more potential energy to the storm system due to increased latent and sensible heat fluxes (Palmén, 1948; Ooyama, 1969; Emanuel, 1986). On the other hand, an increased level of warming in the upper troposphere increases the thermodynamic stability of the troposphere, which in turn acts detrimental toward the formation of hurricanes (Shen et al., 2000). As these two factors mainly determine the potential intensity of tropical cyclones, the choice of GCM for the setting up of PGW plays an important role, hence explaining the high sensitivity of PGW to this aspect in this study. Both, an increased sea surface temperature and an increased upper tropospheric warming are present in the underlying CMIP6 data of this study. For the ensemble mean and the high impact model, the increased upper tropospheric warming is accompanied by an increase of sea surface temperature of >2°C. In these cases, the intensities of the simulated hurricanes under PGW are in general increased, indicating that the effects of near-surface warming surpass the effects of upper tropospheric warming, respectively, an increased thermodynamic stability. The low impact model also projects an increased atmospheric stability but nearly no changes in sea surface temperature. As the higher atmospheric stability is in this case not counteracted by increased surface temperatures, hurricane intensity is generally decreased under the low impact model PGW and may even be lower than for the simulations under historical conditions.
An additional limiting factor of typhoon intensity can be detected when inspecting the PGW sensitivity with regard to which variables are adjusted. The largest differences in typhoon intensity within the same selected GCM set up occur between the purely thermally and the dynamically adjusted runs for four of the five events, excluding Irene. In the case of Katrina and Idalia, the storm system moves through an area within the Gulf of Mexico for which a large amount of vertical wind shear is added for the ensemble mean and the low impact model. As, for example, described by Frank and Ritchie (2001), Vecchi and Soden (2007), and Fu et al. (2019), increased vertical wind shear inherits the development of tropical cyclones, thus causing the particular deviations found in this study. Accordingly, the deviations between the thermodynamical and dynamical approach are statistically significant under the ensemble mean and the low impact model. For the high impact model, no notable vertical wind shear is added, and accordingly the deviations between the thermal and dynamical run are less dominant and show no statistical significance. Both, Isabel and Florence, pass through an area over the North Atlantic with an increased level of vertical wind shear, that is imposed by all three GCMs. Under the low impact model, a mid-tropospheric, cyclonic wind field close to the point of landfall is added under the dynamic and full PGW set ups, resulting in significantly more intense hurricane systems when compared to the thermally adjusted set up. While the inclusion of dynamic variables into PGW mostly restricts the intensification of hurricanes, this example indicates that the opposite may occur under specific circumstances. In contrast to this, the differences between the dynamical and full PGW set ups are in general low. These runs can be considered as comparable, which indicates the low influence of relative humidity, geopotential, and air pressure on the simulations.
As indicated within the results section, Hurricane Irene shows a different behavior under PGW than the other four events. While the high impact model applies the least amount of vertical wind shear and the highest temperature delta, the corresponding simulations only inherit the highest intensities during early intensification and the late stages shortly before landfall. During peak intensity, the intensity is surpassed by that of the ensemble mean simulations. One reason for this may be the high amount of continental, lateral flow in the lower troposphere under the high impact model.
4.3 Socioeconomic impacts
Changes in tropical cyclone activity and intensity under ongoing global warming have been extensively discussed in the past. While there remains discussion on whether tropical cyclone frequency may decrease or increase under anthropogenic global warming, there exists higher confidence in an increase in tropical cyclone intensity, referring to inundation, precipitation, and wind speed (Knutson et al., 2020). This especially applies to the North Atlantic and the U.S. east coast (Emanuel, 2017; Balaguru et al., 2023; Li et al., 2023; Xi et al., 2023). The results of this study, for five selected hurricanes within 2003–2023, demonstrate a high dependence of future hurricane intensity on the socioeconomic pathway, respectively, the nature of human-based energy consumption and emissions. The responsibility of human actions and the likelihood of their influence on tropical cyclone intensity were discussed, for example, by Bhatia et al. (2019) and Seneviratne et al. (2021). Based on the results of this study, the socioeconomic implications from hurricane events comparable to those investigated, next to natural variability, depend on the future course of human actions. Apart from the related uncertainties of human actions on tropical cyclones, the projected increase in temperature and unchanged relative humidity will be accompanied by an increase in precipitation. This is in accordance with the Clausius-Clapeyron relation and especially applies to heavy precipitation (Pall et al., 2007). This can also be found in the results of this study, with median mean (maximum) precipitation rates increased by up to 19–29% (40–74%) under the high impact GCM and ensemble mean simulations, further amplifying the potential future risk of flooding. On the other hand, precipitation rates were reduced under a low-warming scenario. A similar picture can be drawn for maximum wind speeds, which this study projects to be increased under the high impact and ensemble mean drivers. Both, increased precipitation levels and increased wind speeds, will require a considerable effort in terms of mitigation, protection, and public awareness (Mousavi et al., 2011; Shultz and Galea, 2017; Shultz et al., 2018; Wong-Parodi and Garfin, 2022; Otto et al., 2023).
4.4 Limitations
There are some limitations that apply to the presented results. As the sensitivity to the WRF model and its parameterizations was intentionally not included in the statistical assessment, it imposes a limitation to the results. This also includes the model initialization, which could be further assessed by including an ensemble of perturbed initial conditions. Based on the results of this study, with increased computational capacity, the combined uncertainties of the model configurations (parameterization and initialization) and the PGW set up could be assessed in a follow-up study. This could also include a higher spatial resolution to capture local-scale extremes that remained undetected by the 5 km resolution used in this study. The PGW approach proves to be a strong, computationally cost-efficient alternative to long-term modeling that offers the possibility of assessing real historic events. However, precisely this characteristic prevents the user from drawing general conclusions on hurricane activity in a long-term context, imposing an additional limitation. Therefore, while there exists significant evidence within the existing literature that the described results may lie within the scientific consensus, this study can only make assumptions on the specific selection of events. In order to enhance the robustness of the results, a larger number of events could be included in a potential follow-up study. In addition, the robustness of conclusions on the PGW sensitivity may be enhanced by adding events that occurred in other than the included months. Finally, while the simulated track position, central pressure and maximum wind speed were validated using IBTrACS, precipitation data was not validated. The assessment of precipitation using e.g., station-based data was aggravated by the fact that the simulations do not perfectly correspond with the historical tracks. Therefore, rain bands may be shifted, imposing a bias when comparing to real-life data. Also, the model is run freely and may develop an own dynamic. General changes in precipitation characteristics can be assessed in a statistical context, for example in terms of spatial and temporal mean and maximum. This, however, excludes the possibility of historically assessing grid point data. In addition, we statistically assess storms only until landfall to avoid unwanted disturbances imposed by the land surface, hence the data availability is significantly reduced. Under the assumption of stationary precipitation bias between the historical and the PGW-driven simulations, we assessed the relative differences in precipitation characteristics.
5 Conclusions
Multiple studies have pointed out a potential increase in hurricane intensity under ongoing global warming and demonstrated the predominant influencing factors. One of the many ways to assess this change is the method of Pseudo-Global Warming (PGW). However, there exist insufficient scientific consensus and guidelines on the application PGW in the context of hurricane research for the United States. This particularly applies to the decision as to which variables are perturbed within the PGW set up and how this decision may influence the resulting simulations and conclusions drawn from them. We therefore applied PGW under varying set ups and GCM inputs for five historically significant hurricanes in the southeastern United States and assessed the variations based on hurricane intensity metrics. The PGW set ups included a purely thermodynamical perturbation of the initial and boundary conditions, a combination of thermodynamical and dynamical perturbation, i.e., the addition of horizontal wind, and a more comprehensive set up that, in addition to temperatures and wind, perturbed surface and sea level pressure, geopotential, and relative humidity. These set ups were each tested for a high and low impact GCM, as well as the multi-model ensemble mean. With regard to the research questions, we can draw the following conclusions.
1.1 The highest sensitivity of the resulting hurricane intensities to the PGW set up appears between the thermodynamical and the dynamical configurations. When adding the dynamical component to the thermal changes, hurricane intensity was, under specific circumstances, significantly altered. This alteration primarily manifest itself in a reduced typhoon intensity caused by a modification of the wind fields, i.e., an increase in vertical wind shear. However, while under rarer circumstances, the perturbation of the wind fields could also result in increased intensities.
1.2 The sensitivity between the dynamical and full PGW configurations was, apart from slight variations, low across all inspected events, manifesting that the climate change signals of surface and atmospheric temperature, as well as horizontal wind speed, have the highest impact on simulated hurricane intensity.
2.1 Due to the high level of sensitivity to thermodynamic and dynamic change signals, and the high dependency of the sensitivity on the selected case, an inspection of both set ups should be generally conducted in the context of future impact assessment. Perturbating wind fields using monthly deltas may not reflect the atmospheric state during the actual unfolding of the inspected events in the future. Therefore, while the dynamic approach offers a more comprehensive picture of climate change in the future, information on the “true” potential of a system may be lost, when intensities are reduced by including wind in to PGW. Systematically inspecting both approaches could prevent the drawing of biased conclusions by offering a more robust view into the future potential of an investigated hurricane event. The PGW sensitivity should be treated similarly to the sensitivity of regional climate models to the parameterization and initialization schemes.
3.1 The sensitivity of the resulting intensities to the selected GCM surpass that of any investigated PGW set up. Both, the high impact model and the ensemble mean, indicate that the investigated hurricanes could be significantly more severe in a warmer world. This applies both to phases of peak intensity on the open sea as well as to phases immediately before landfall. On the other hand, the intensities of all cases were reduced under the low impact model, i.e., a storyline with a restriction of sea surface temperature increase to under 2°C compared to today.
3.2 While the investigated cases already imposed significant impacts on nature and society, the projected increases in maximums in wind speed, precipitation rates and precipitation sums will require considerable additional expenditures for protective measures. The modeled increase in precipitation rates for a case such as Katrina, which historically brought unprecedented rain, flooding, and losses, could significantly exacerbate the unfolding of a similar event in the future.
Data availability statement
The raw data supporting the conclusions of this article will be made available by the authors, without undue reservation.
Author contributions
PO: Conceptualization, Data curation, Formal analysis, Investigation, Methodology, Resources, Software, Validation, Visualization, Writing – original draft, Writing – review & editing. HK: Project administration, Supervision, Writing – review & editing.
Funding
The author(s) declare financial support was received for the research, authorship, and/or publication of this article. The study was conducted in the wider context of MitRiskFlood which is financially supported by the German Ministry of Education and Research (BMBF), grant number 01LP2005A. We acknowledge support by the KIT-Publication Fund of the Karlsruhe Institute of Technology.
Acknowledgments
We would like to express our deep gratitude to Joël Arnault for providing support in setting up and running WRF, Jianhui Wei for support with the review and editing process, as well as Benjamin Fersch, Frank Neidl, and Christoph Sörgel (all KIT) for arranging the necessary computational capacities at the Linux cluster of KIT IMK-IFU in Garmisch-Partenkirchen. In addition, we acknowledge the provision of the programming environment R, version 4.2.2 (R Core Team, 2022), which was used to perform the statistical computations of this study. Furthermore, we acknowledge Copernicus for the public provision of ERA5, DKRZ (German Climate Computing Center) and ESGF (Earth System Grid Federation) for the public provision of CMIP6, and NCEI (National Centers for Environmental Information) for the public provision of IBTrACS.
Conflict of interest
The authors declare that the research was conducted in the absence of any commercial or financial relationships that could be construed as a potential conflict of interest.
Publisher's note
All claims expressed in this article are solely those of the authors and do not necessarily represent those of their affiliated organizations, or those of the publisher, the editors and the reviewers. Any product that may be evaluated in this article, or claim that may be made by its manufacturer, is not guaranteed or endorsed by the publisher.
References
Avila, L. A., and Cangialosi, J. (2013). Tropical Cyclone Report - Hurricane Irene (AL092011) - 21-28 August 2011. Available online at: https://www.nhc.noaa.gov/data/tcr/AL092011_Irene.pdf (accessed October 17, 2023).
Balaguru, K., Xu, W., Chang, C.-C., Leung, L. R., Judi, D. R., Hagos, S. M., et al. (2023). Increased U.S. coastal hurricane risk under climate change. Sci. Adv. 9:adf0259. doi: 10.1126/sciadv.adf0259
Beven, J., and Cobb, H. (2014). Tropical Cyclone Report - Hurricane Isabel - 6-19 September 2003. Available online at: https://www.nhc.noaa.gov/data/tcr/AL132003_Isabel.pdf (accessed October 17, 2023).
Bhatia, K. T., Vecchi, G. A., Knutson, T. R., Murakami, H., Kossin, J., Dixon, K. W., et al. (2019). Recent increases in tropical cyclone intensification rates. Nat. Commun. 10:635. doi: 10.1038/s41467-019-08471-z
Brogli, R., Heim, C., Mensch, J., Sørland, S. L., and Schär, C. (2023). The pseudo-global-warming (PGW) approach: methodology, software package PGW4ERA5 v1.1, validation, and sensitivity analyses. Geosci. Model Dev. 16, 907–926. doi: 10.5194/gmd-16-907-2023
Camargo, S. J., and Wing, A. A. (2016). Tropical cyclones in climate models. WIREs Clim. Chang. 7, 211–237. doi: 10.1002/wcc.373
Cao, J., Wang, B., Yang, Y.-M., Ma, L., Li, J., Sun, B., et al. (2018). The NUIST Earth System Model (NESM) version 3: description and preliminary evaluation. Geosci. Model Dev. 11, 2975–2993. doi: 10.5194/gmd-11-2975-2018
Chen, J., Tam, C. Y., Wang, Z., Cheung, K., Li, Y., Lau, N.-C., et al. (2022). Future thermodynamic impacts of global warming on landfalling typhoons and their induced storm surges to the Pearl River Delta region as inferred from high-resolution regional models. J. Clim. 35, 4905–4926. doi: 10.1175/JCLI-D-21-0436.1
Chen, J., Wang, Z., Tam, C.-Y., Lau, N.-C., Lau, D.-S. D., and Mok, H.-Y. (2020). Impacts of climate change on tropical cyclones and induced storm surges in the Pearl River Delta region using pseudo-global-warming method. Sci. Rep. 10:1965. doi: 10.1038/s41598-020-58824-8
Cherchi, A., Fogli, P. G., Lovato, T., Peano, D., Iovino, D., Gualdi, S., et al. (2019). Global mean climate and main patterns of variability in the CMCC-CM2 coupled model. J. Adv. Model. Earth Syst. 11, 185–209. doi: 10.1029/2018MS001369
Chih, C.-H., Chou, K.-H., and Wu, C.-C. (2022). Idealized simulations of tropical cyclones with thermodynamic conditions under reanalysis and CMIP5 scenarios. Geosci. Lett. 9:33. doi: 10.1186/s40562-022-00239-6
Christensen, P., Gillingham, K., and Nordhaus, W. (2018). Uncertainty in forecasts of long-run economic growth. Proc. Natl. Acad. Sci. U. S. A. 115, 5409–5414. doi: 10.1073/pnas.1713628115
Delfino, R. J., Bagtasa, G., Hodges, K., and Vidale, P. L. (2022). Sensitivity of simulating Typhoon Haiyan (2013) using WRF: the role of cumulus convection, surface flux parameterizations, spectral nudging, and initial and boundary conditions. Nat. Hazards Earth Syst. Sci. 22, 3285–3307. doi: 10.5194/nhess-22-3285-2022
Delfino, R. J., Vidale, P. L., Bagtasa, G., and Hodges, K. (2023). Response of damaging Philippines tropical cyclones to a warming climate using the pseudo global warming approach. Clim. Dyn. 61, 3499–3523. doi: 10.1007/s00382-023-06742-6
Di, Z., Gong, W., Gan, Y., Shen, C., and Duan, Q. (2019). Combinatorial optimization for WRF physical parameterization schemes: a case study of three-day typhoon simulations over the Northwest Pacific Ocean. Atmosphere 10:233. doi: 10.3390/atmos10050233
Döscher, R., Acosta, M., Alessandri, A., Anthoni, P., Arsouze, T., Bergman, T., et al. (2022). The EC-Earth3 Earth system model for the Coupled Model Intercomparison Project 6. Geosci. Model Dev. 15, 2973–3020. doi: 10.5194/gmd-15-2973-2022
Duan, H., Chen, D., and Lie, J. (2018). The impact of global warming on hurricane intensity. IOP Conf. Ser. Earth Environ. Sci. 199:022045. doi: 10.1088/1755-1315/199/2/022045
Emanuel, K. (2005). Increasing destructiveness of tropical cyclones over the past 30 years. Nature 436, 686–688. doi: 10.1038/nature03906
Emanuel, K. (2017). Assessing the present and future probability of Hurricane Harvey's rainfall. Proc. Natl. Acad. Sci. U. S. A. 114, 12681–12684. doi: 10.1073/pnas.1716222114
Emanuel, K. A. (1986). An air-sea interaction theory for tropical cyclones. part I: steady-state maintenance. J. Atmos. Sci. 43, 585–605. doi: 10.1175/1520-0469(1986)043<0585:AASITF&>2.0.CO;2
Eyring, V., Bony, S., Meehl, G. A., Senior, C. A., Stevens, B., Stouffer, R. J., et al. (2016). Overview of the Coupled Model Intercomparison Project Phase 6 (CMIP6) experimental design and organization. Geosci. Model Dev. 9, 1937–1958. doi: 10.5194/gmd-9-1937-2016
Fiedler, S., Stevens, B., Wieners, K.-H., Giorgetta, M., Reick, C., Jungclaus, J., et al. (2019). MPI-M MPI-ESM1.2-LR model output prepared for CMIP6 RFMIP piClim-control. Version 20220825. Earth System Grid Federation. doi: 10.22033/ESGF/CMIP6.6662
Frank, W. M., and Ritchie, E. A. (2001). Effects of vertical wind shear on the intensity and structure of numerically simulated hurricanes. Mon. Weather Rev. 129, 2249–2269. doi: 10.1175/1520-0493(2001)129<2249:EOVWSO&>2.0.CO;2
Fu, H., Wang, Y., Riemer, M., and Li, Q. (2019). Effect of unidirectional vertical wind shear on tropical cyclone intensity change—Lower-layer shear versus upper-layer shear. J. Geophys. Res. Atmos. 124, 6265–6282. doi: 10.1029/2019JD030586
Grinsted, A., Ditlevsen, P., and Christensen, J. H. (2019). Normalized US hurricane damage estimates using area of total destruction, 1900–2018. Proc. Natl. Acad. Sci. U. S. A. 116, 23942–23946. doi: 10.1073/pnas.1912277116
Gutjahr, O., Putrasahan, D., Lohmann, K., Jungclaus, J. H., von Storch, J.-S., Brüggemann, N., et al. (2019). Max Planck Institute Earth System Model (MPI-ESM1.2) for the High-Resolution Model Intercomparison Project (HighResMIP). Geosci. Model Dev. 12, 3241–3281. doi: 10.5194/gmd-12-3241-2019
Gutmann, E. D., Rasmussen, R. M., Liu, C., Ikeda, K., Bruyere, C. L., Done, J. M., et al. (2018). Changes in hurricanes from a 13-Yr convection-permitting pseudo- global warming simulation. J. Clim. 31, 3643–3657. doi: 10.1175/JCLI-D-17-0391.1
Hersbach, H., Bell, B., Berrisford, P., Biavati, G., Horányi, A., Muñoz Sabater, J., et al. (2023a). ERA5 Hourly Data on Pressure Levels From 1940 to Present. Copernicus Climate Change Service (C3S) Climate Data Store (CDS). doi: 10.24381/cds.bd0915c6
Hersbach, H., Bell, B., Berrisford, P., Biavati, G., Horányi, A., Muñoz Sabater, J., et al. (2023b). ERA5 Hourly Data on Single Levels From 1940 to Present. doi: 10.24381/cds.adbb2d47
Hersbach, H., Bell, B., Berrisford, P., Hirahara, S., Horányi, A., Muñoz-Sabater, J., et al. (2020). The ERA5 global reanalysis. Q. J. R. Meteorol. Soc. 146, 1999–2049. doi: 10.1002/qj.3803
Islam, T., Srivastava, P. K., Rico-Ramirez, M. A., Dai, Q., Gupta, M., and Singh, S. K. (2015). Tracking a tropical cyclone through WRF–ARW simulation and sensitivity of model physics. Nat. Hazards 76, 1473–1495. doi: 10.1007/s11069-014-1494-8
Jewson, S. (2023). Tropical cyclones and climate change: global landfall frequency projections derived from Knutson et al. Bull. Am. Meteorol. Soc. 104, E1085–E1104. doi: 10.1175/BAMS-D-22-0189.1
Kennel, C. F., Briggs, S., and Victor, D. G. (2016). Making climate science more relevant. Science (80-.) 354, 421–422. doi: 10.1126/science.aag3248
Knabb, R. D., Rhome, J. R., and Brown, D. P. (2023). Tropical Cyclone Report - Hurricane Katrina - 23-30 August 2005. Available online at: https://www.nhc.noaa.gov/data/tcr/AL122005_Katrina.pdf (accessed October 17, 2023).
Knapp, K. R., Diamond, H. J., Kossin, J. P., Kruk, M. C., and Schreck, C. J. I. (2018). International Best Track Archive for Climate Stewardship (IBTrACS) Project, Version 4r00. Available online at: https://doi.org/10.25921/82ty-9e16 (accessed October 17, 2023).
Knutson, T., Camargo, S. J., Chan, J. C. L., Emanuel, K., Ho, C.-H., Kossin, J., et al. (2020). Tropical cyclones and climate change assessment: part II: projected response to anthropogenic warming. Bull. Am. Meteorol. Soc. 101, E303–E322. doi: 10.1175/BAMS-D-18-0194.1
Knutti, R., Masson, D., and Gettelman, A. (2013). Climate model genealogy: generation CMIP5 and how we got there. Geophys. Res. Lett. 40, 1194–1199. doi: 10.1002/grl.50256
Lackmann, G. M. (2015). Hurricane Sandy before 1900 and after 2100. Bull. Am. Meteorol. Soc. 96, 547–560. doi: 10.1175/BAMS-D-14-00123.1
Li, X., Fu, D., Nielsen-Gammon, J., Gangrade, S., Kao, S.-C., Chang, P., et al. (2023). Impacts of climate change on future hurricane induced rainfall and flooding in a coastal watershed: a case study on Hurricane Harvey. J. Hydrol. 616:128774. doi: 10.1016/j.jhydrol.2022.128774
Lovato, T., Peano, D., Butenschön, M., Materia, S., Iovino, D., Scoccimarro, E., et al. (2022). CMIP6 simulations with the CMCC Earth System Model (CMCC-ESM2). J. Adv. Model. Earth Syst. 14:e2021MS002814. doi: 10.1029/2021MS002814
Lui, Y. S., Tse, L. K. S., Tam, C.-Y., Lau, K. H., and Chen, J. (2021). Performance of MPAS-A and WRF in predicting and simulating western North Pacific tropical cyclone tracks and intensities. Theor. Appl. Climatol. 143, 505–520. doi: 10.1007/s00704-020-03444-5
Lynn, B., Healy, R., and Druyan, L. (2009). Investigation of Hurricane Katrina characteristics for future, warmer climates. Clim. Res. 39, 75–86. doi: 10.3354/cr00801
Mann, H. B., and Whitney, D. R. (1947). On a test of whether one of two random variables is stochastically larger than the other. Ann. Math. Stat. 18, 50–60. doi: 10.1214/aoms/1177730491
Mousavi, M. E., Irish, J. L., Frey, A. E., Olivera, F., and Edge, B. L. (2011). Global warming and hurricanes: the potential impact of hurricane intensification and sea level rise on coastal flooding. Clim. Change 104, 575–597. doi: 10.1007/s10584-009-9790-0
Nakamura, R., and Mäll, M. (2021). Pseudo global warming sensitivity experiments of subtropical Cyclone Anita (2010) under RCP 8.5 scenario. J. Geophys. Res. Atmos. 126:e035261. doi: 10.1029/2021J.D.035261
NOAA-NCEI (2023). Costliest U.S. Tropical Cyclones. Available online at: https://www.ncei.noaa.gov/access/billions/dcmi.pdf (accessed October 17, 2023).
Ooyama, K. (1969). Numerical simulation of the life cycle of tropical cyclones. J. Atmos. Sci. 26, 3–40. doi: 10.1175/1520-0469(1969)026<0003:NSOTLC>2.0.CO;2
Otto, C., Kuhla, K., Geiger, T., Schewe, J., and Frieler, K. (2023). Better insurance could effectively mitigate the increase in economic growth losses from U.S. hurricanes under global warming. Sci. Adv. 9:add6616. doi: 10.1126/sciadv.add6616
Pak, G., Noh, Y., Lee, M.-I., Yeh, S.-W., Kim, D., Kim, S.-Y., et al. (2021). Korea Institute of Ocean Science and Technology Earth System Model and its simulation characteristics. Ocean Sci. J. 56, 18–45. doi: 10.1007/s12601-021-00001-7
Pall, P., Allen, M. R., and Stone, D. A. (2007). Testing the Clausius–Clapeyron constraint on changes in extreme precipitation under CO2 warming. Clim. Dyn. 28, 351–363. doi: 10.1007/s00382-006-0180-2
Park, G. (2021). A comprehensive analysis of hurricane damage across the U.S. Gulf and Atlantic Coasts Using Geospatial Big Data. ISPRS Int. J. Ge –Inf. 10:781. doi: 10.3390/ijgi10110781
Parker, C. L., Bruyère, C. L., Mooney, P. A., and Lynch, A. H. (2018). The response of land-falling tropical cyclone characteristics to projected climate change in northeast Australia. Clim. Dyn. 51, 3467–3485. doi: 10.1007/s00382-018-4091-9
R Core Team (2022). R: A Language and Environment for Statistical Computing. Available online at: https//www.r-project.org/ (accessed December 9, 2023).
Rasmussen, R., Liu, C., Ikeda, K., Gochis, D., Yates, D., Chen, F., et al. (2011). High-resolution coupled climate runoff simulations of seasonal snowfall over Colorado: a process study of current and warmer climate. J. Clim. 24, 3015–3048. doi: 10.1175/2010JCLI3985.1
Rong, X., Li, J., Chen, H., Xin, Y., Su, J., Hua, L., et al. (2018). The CAMS climate system model and a basic evaluation of its climatology and climate variability simulation. J. Meteorol. Res. 32, 839–861. doi: 10.1007/s13351-018-8058-x
Salarieh, B., Ugwu, I. A., and Salman, A. M. (2023). Impact of changes in sea surface temperature due to climate change on hurricane wind and storm surge hazards across US Atlantic and Gulf coast regions. SN Appl. Sci. 5:205. doi: 10.1007/s42452-023-05423-7
Schär, C., Frei, C., Lüthi, D., and Davies, H. C. (1996). Surrogate climate-change scenarios for regional climate models. Geophys. Res. Lett. 23, 669–672. doi: 10.1029/96GL00265
Schwalm, C. R., Glendon, S., and Duffy, P. B. (2020). RCP8.5 tracks cumulative CO 2 emissions. Proc. Natl. Acad. Sci. U. S. A. 117, 19656–19657. doi: 10.1073/pnas.2007117117
Seland, Ø., Bentsen, M., Olivié, D., Toniazzo, T., Gjermundsen, A., Graff, L. S., et al. (2020). Overview of the Norwegian Earth System Model (NorESM2) and key climate response of CMIP6 DECK, historical, and scenario simulations. Geosci. Model Dev. 13, 6165–6200. doi: 10.5194/gmd-13-6165-2020
Semmler, T., Danilov, S., Gierz, P., Goessling, H. F., Hegewald, J., Hinrichs, C., et al. (2020). Simulations for CMIP6 With the AWI Climate Model AWI-CM-1-1. J. Adv. Model. Earth Syst. 12:e2019MS002009. doi: 10.1029/2019MS002009
Seneviratne, S. I., Zhang, X., Adnan, M., Badi, W., Dereczynski, C., Di Luca, A., et al. (2021). “Weather and climate extreme events in a changing climate,” in Climate Change 2021: The Physical Science Basis. Contribution of Working Group I to the Sixth Assessment Report of the Intergovernmental Panel on Climate Change, eds. V. Masson-Delmotte, P. Zhai, A. Pirani, S. L. Connors, C. Péan, S. Berger, et al. (Cambridge; New York, NY: Cambridge University Press).
Shen, W., Tuleya, R. E., and Ginis, I. (2000). A sensitivity study of the thermodynamic environment on GFDL model hurricane intensity: implications for global warming. J. Clim. 13, 109–121. doi: 10.1175/1520-0442(2000)013<0109:ASSOTT>2.0.CO;2
Shepherd, T. G., Boyd, E., Calel, R. A., Chapman, S. C., Dessai, S., Dima-West, I. M., et al. (2018). Storylines: an alternative approach to representing uncertainty in physical aspects of climate change. Clim. Change 151, 555–571. doi: 10.1007/s10584-018-2317-9
Shultz, J. M., and Galea, S. (2017). Preparing for the Next Harvey, Irma, or Maria — addressing research gaps. N. Engl. J. Med. 377, 1804–1806. doi: 10.1056/NEJMp1712854
Shultz, J. M., Shepherd, J. M., Kelman, I., Rechkemmer, A., and Galea, S. (2018). Mitigating tropical cyclone risks and health consequences: urgencies and innovations. Lancet Planet. Heal. 2, e103–e104. doi: 10.1016/S2542-5196(18)30021-4
Skamarock, W. C., Klemp, J. B., Dudhia, J., Gill, D. O., Liu, Z., Wang, W., et al. (2019). A Description of the Advanced Research WRF Model Version 4. Boulder, CO: National Center for Atmospheric Research. doi: 10.5065/1dfh-6p97
Smith, A. B., and Katz, R. W. (2013). US billion-dollar weather and climate disasters: data sources, trends, accuracy and biases. Nat. Hazards 67, 387–410. doi: 10.1007/s11069-013-0566-5
Stewart, S. R., and Berg, R. (2019). Tropical Cyclone Report - Hurricane Florence (AL062018) - 31 August-17 September 2018. Available online at: https://www.nhc.noaa.gov/data/tcr/AL062018_Florence.pdf (accessed October 17, 2023).
Sun, Q., Olschewski, P., Wei, J., Tian, Z., Sun, L., Kunstmann, H., et al. (2023). Key ingredients in regional climate modeling for improving the representation of typhoon tracks and intensities. Hydrol. Earth Syst. Sci. Discuss. 2023, 1–26. doi: 10.5194/hess-2023-222
Swart, N. C., Cole, J. N. S., Kharin, V. V., Lazare, M., Scinocca, J. F., Gillett, N. P., et al. (2019). The Canadian Earth System Model version 5 (CanESM5.0.3). Geosci. Model Dev. 12, 4823–4873. doi: 10.5194/gmd-12-4823-2019
Ting, M., Kossin, J. P., Camargo, S. J., and Li, C. (2019). Past and future hurricane intensity change along the U.S. East Coast. Sci. Rep. 9:7795. doi: 10.1038/s41598-019-44252-w
Toyoda, M., Yoshino, J., and Kobayashi, T. (2022). Future changes in typhoons and storm surges along the Pacific coast in Japan: proposal of an empirical pseudo-global-warming downscaling. Coast. Eng. J. 64, 190–215. doi: 10.1080/21664250.2021.2002060
Tran, T. L., Ritchie, E. A., Perkins-Kirkpatrick, S. E., Bui, H., and Luong, T. M. (2022). Future changes in tropical cyclone exposure and impacts in Southeast Asia from CMIP6 pseudo-global warming simulations. Earths Futur. 10:e2022EF003118. doi: 10.1029/2022EF003118
Vecchi, G. A., and Soden, B. J. (2007). Increased tropical Atlantic wind shear in model projections of global warming. Geophys. Res. Lett. 34, L08702. doi: 10.1029/2006GL028905
Volodin, E. M., Mortikov, E. V., Kostrykin, S. V., Galin, V. Y., Lykossov, V. N., Gritsun, A. S., et al. (2017). Simulation of the present-day climate with the climate model INMCM5. Clim. Dyn. 49, 3715–3734. doi: 10.1007/s00382-017-3539-7
Volodin, E. M., Mortikov, E. V., Kostrykin, S. V., Galin, V. Y., Lykossov, V. N., Gritsun, A. S., et al. (2018). Simulation of the modern climate using the INM-CM48 climate model. Russ. J. Numer. Anal. Math. Model. 33, 367–374. doi: 10.1515/rnam-2018-0032
Weinkle, J., Landsea, C., Collins, D., Musulin, R., Crompton, R. P., Klotzbach, P. J., et al. (2018). Normalized hurricane damage in the continental United States 1900–2017. Nat. Sustain. 1, 808–813. doi: 10.1038/s41893-018-0165-2
Wong-Parodi, G., and Garfin, D. R. (2022). Hurricane adaptation behaviors in Texas and Florida: exploring the roles of negative personal experience and subjective attribution to climate change. Environ. Res. Lett. 17:034033. doi: 10.1088/1748-9326/ac4858
Wu, T., Lu, Y., Fang, Y., Xin, X., Li, L., Li, W., et al. (2019). The Beijing Climate Center Climate System Model (BCC-CSM): the main progress from CMIP5 to CMIP6. Geosci. Model Dev. 12, 1573–1600. doi: 10.5194/gmd-12-1573-2019
Xi, D., Lin, N., and Gori, A. (2023). Increasing sequential tropical cyclone hazards along the US East and Gulf coasts. Nat. Clim. Chang. 13, 258–265. doi: 10.1038/s41558-023-01595-7
Keywords: Pseudo-Global Warming, hurricanes, WRF, sensitivity, risk assessment, United States
Citation: Olschewski P and Kunstmann H (2024) Future projections of hurricane intensity in the southeastern U.S.: sensitivity to different Pseudo-Global Warming methods. Front. Clim. 6:1353396. doi: 10.3389/fclim.2024.1353396
Received: 10 December 2023; Accepted: 26 January 2024;
Published: 13 February 2024.
Edited by:
Xiaosong Yang, NOAA/Geophysical Fluid Dynamics Laboratory, United StatesReviewed by:
Alyssa M. Stansfield, Colorado State University, United StatesKun Gao, Princeton University, United States
Copyright © 2024 Olschewski and Kunstmann. This is an open-access article distributed under the terms of the Creative Commons Attribution License (CC BY). The use, distribution or reproduction in other forums is permitted, provided the original author(s) and the copyright owner(s) are credited and that the original publication in this journal is cited, in accordance with accepted academic practice. No use, distribution or reproduction is permitted which does not comply with these terms.
*Correspondence: Patrick Olschewski, patrick.olschewski@kit.edu