Economic evaluation of decarbonizing the electricity sector in the Dominican Republic
 Luis Victor-Gallardo1
  Susana Solórzano-Jiménez1 Lucía Rodríguez-Delgado1
  Jessica Roccard1
  Jairo Quirós-Tortós1* Rafael Gómez2 Maribel Dionicio3 Hector Baldivieso3 Benoit Lefevre3
- 1School of Electrical Engineering, University of Costa Rica, San José, Costa Rica
- 2Ministry of Energy and Mines, Santo Domingo, Dominican Republic
- 3Inter-American Development Bank, Washington, DC, United States
This paper presents an in-depth analysis of decarbonizing the electricity sector in the Dominican Republic, pivotal for addressing climate change and fostering economic growth. Employing the robust-decision making methodology, we studied multiple scenarios via computational models, capturing inputs from stakeholders and evaluating each scenario across 1,000 futures to capture deep uncertainty. Four scenarios were examined: baseline, reference, natural gas, and renewable. The renewable scenario emerged as the most advantageous, proposing the replacement of coal-fired power generation with renewable sources, primarily solar and wind, coupled with batteries. A significant investment, averaging US$3.3 billion, is necessary for this shift toward renewable energy; however, these investments are overcompensated by savings in operational costs. Crucially, this transition promises substantial benefits by 2050: an estimated cumulative average net economic gain of US$2.7 billion, an 8% reduction in average generation costs in 2050, the creation of 160,000 direct jobs, and the avoidance of circa 140 million tons of CO2. The findings underscore the feasibility and economic viability of transitioning to a 55% renewable energy generation by 2050. The study offers a critical roadmap for policymakers, highlighting renewable energy expansion, transmission grid strengthening, and strategic coal generation replacement, thus offering a comprehensive blueprint for the nation's energy transition.
1 Introduction
In the face of mounting global climate challenges, the transition to sustainable energy systems has become a critical imperative. Central to international efforts like the Paris Agreement (United Nations, 2015), this transition aims to mitigate climate change impacts by substantially reducing greenhouse gas (GHG) emissions, particularly in the electricity sector, a major global CO2 emitter (IEA, 2023a,b). The transformation of this traditionally fossil-fuel-dependent sector is vital for meeting global warming reduction targets and aligns with broader United Nations Sustainable Development Goals (McCollum et al., 2018; Vogt-Schilb, 2021), fostering sustainable economic growth, ensuring access to affordable and clean energy, and encouraging innovation.
In this context, countries like Costa Rica, Peru, Chile, and Colombia have actively examined the cost-benefit aspects of decarbonizing their economies (Groves et al., 2020; Benavides et al., 2021; Quirós-Tortós et al., 2021; Arguello et al., 2022), a trend that the Dominican Republic closely follows. These studies have shown that decarbonization offers substantial economic opportunities for Latin American countries. A recent regional analysis revealed that decarbonizing the economies of Latin America and the Caribbean could yield a net benefit of ~2.7 trillion US dollars by 2050, marking a significant economic and environmental paradigm shift (Kalra et al., 2023).
In the Dominican Republic, 84% of electricity is currently generated from fossil fuels, posing economic challenges due to global price fluctuations and supply chain vulnerabilities, and contributing significantly to the country's carbon footprint. The goal is to meet 25% of electricity needs with renewable sources by 2025. However, despite advances in solar and wind energy, coal generation tripled by 2022, led by the Punta Catalina coal-fired power plant. This transition away from fossil fuels is compounded by limited hydroelectric capacity and integration challenges with renewables, necessitating energy storage and system improvements.
This paper offers an in-depth analysis of sustainable transition pathways for the Dominican Republic's electricity sector. We employ a robust decision-making (RDM) methodology, developing the Exploratory Model of Expansion Pathways for the Electricity Sector (EMEPES)—a tool inspired by OSeMOSYS (Howells et al., 2011), specialized for long-term electricity sector scenario analysis considering uncertainties. Each scenario is evaluated under 1,001 alternative futures using the Latin Hypercube Sampling technique (Iman, 2014). The scenarios, along with their uncertainties, were defined in three participatory workshops, engaging over 70 diverse stakeholders from the Dominican electricity sector per workshop, including government officials, industry experts, and civil society representatives. The results of the simulations and constant feedback from stakeholders were then used to produce a robust roadmap to pursue decarbonization in the electricity sector of the country. This comprehensive, collaborative approach provides a nuanced understanding of the trade-offs and synergies in each potential pathway.
Our analysis reveals the renewable energy scenario as especially promising. Advocating a transition from coal to a mix of solar and wind energy, supported by energy storage technologies, this scenario demands significant investment but offers considerable returns. By 2050, it could lead to a cumulative net economic gain of US$2.7 billion, reduce average generation costs by 8%, create 160,000 direct jobs, and decrease CO2 emissions by ~140 million tons, demonstrating the economic, environmental, and social benefits of this transition. The analysis also highlights the feasibility and urgency of the Dominican Republic's shift toward a renewable energy future, proposing a roadmap to achieve 55% renewable energy generation by 2050. This includes expanding renewable infrastructure, enhancing the transmission grid, and strategically phasing out coal generation. While focused on the Dominican Republic, this study offers valuable insights and frameworks for other countries facing similar challenges, contributing to the global sustainable energy transition discourse.
The paper is structured as follows: Section 2 describes the methods (overarching methodology, model used and roadmap development). Section 3 presents the results ranging from technical insights to social implications of the decarbonization of the electricity sector in the Dominican Republic. Section 4 concludes the paper.
2 Methods
This section explains the methods deployed in this study. The overarching methodology of this study is based on the Robust Decision Making (RDM) approach (Lempert et al., 2003). We co-created scenarios with stakeholders and studied them via simulations using sophisticated modeling tools in thousands of simulations to capture uncertainties. The corresponding results were discussed, and they then helped to design a robust decarbonization roadmap for the electricity sector in the Dominican Republic. Below the details of the process.
2.1 Stakeholder engagement and scenarios
RDM involves a participatory process conducted through consultative workshops and bilateral meetings with stakeholders, reflecting various objectives and ideas in the analysis. We conducted three participatory workshops with over 70 participants each and held more than 30 bilateral meetings with key actors in the Dominican Republic's electricity sector. In the first participatory workshop, we gathered concerns, ideas, and initiatives from stakeholders, which were captured in the XLRM matrix (Lempert et al., 2003). The XLRM matrix maps uncertainties that can affect the outcome of the analysis, identifies policy levers for the electricity sector's decarbonization, collects key information, including data and models, and defines key metrics to measure the outcome of the analysis. In the second workshop, we presented key results in terms of environmental, financial, economic, and social metrics defined with stakeholders, and discussed possible improvements toward the results. In the third workshop, we presented final results and discussed the resulting roadmap to achieve decarbonization in the electricity sector of the Dominican Republic.
Key stakeholder inputs were used to generate four main scenarios (please see Section 2.2. and Section 3 for exploratory modeling details):
1. Business-as-usual (BAU) scenario: it describes the evolution of the electricity sector until 2060 based on trends, where coal plants continue significant electricity production.
2. Reference scenario: it is based on existing energy policies in the country, including the National Energy Plan (NEP; CNE, 2022a), incorporating natural gas projects tendered in 2022 according to information received from the Ministry of Energy and Mines of the country.
3. Natural gas scenario: it is based on the reference scenario but explores the conversion of coal plants to natural gas.
4. Renewable scenario: it is based on the reference scenario but explores the conversion or replacement of coal plants with non-conventional renewable energies (i.e., aside from large-scale hydro generation). There are three variations of this scenario based on the interests of the stakeholders:
° only onshore and solar;
° onshore, solar and biomass;
° and onshore, offshore, and biomass.
Crucially, the renewable scenario focuses on coal replacement as the main driver of decarbonization for the sector. Natural gas is part of the scenario because of the existing and planned capacity (Section 3 details these sources), and because flexible thermal generation is needed to back up the seasonal variability of wind resources. Being an island nation, the lack of interconnection to a large, robust system makes the local grid require thermal generation capacity, including fuel oil and natural gas. All these elements are analyzed in detail in this study, highlighting the critical role of coal replacement and thermal generation capacity in decarbonization efforts. Should additional electricity demand arise, it would undoubtedly complicate the decarbonization challenge, yet such considerations are beyond the current scope of our analysis.
2.2. Exploratory Model of Expansion Pathways for the Electricity Sector
RDM leverages models to inform policy questions through the development and analysis of various scenarios. In this study, we developed the Exploratory Model of Expansion Pathways for the Electricity Sector (EMEPES). It is a tool inspired by the Open Source Energy Modeling System (OSeMOSYS; Howells et al., 2011) for structure, but specifically designed for conducting assumption-driven scenario analyses in the electricity sector. However, unlike the least-cost approach of OSeMOSYS, EMEPES simulates electricity supply and demand dynamics based on exogenously defined demand profiles and user-specified generation mix scenarios. Instead, it is specially designed for analyzing long-term scenarios in the electricity sector, with a particular focus on incorporating uncertainties. First, EMEPES matches electricity supply with a demand profile that is defined exogenously. Then, it calculates the composition of the generation mix, represented by different technologies, according to each user-defined scenario. We conduct an initial simulation for each scenario using base assumptions, i.e., projections of costs, efficiency, and other parameters according to reputable international sources. This initial step provides a baseline understanding of each scenario's potential outcomes under a set of expected conditions.
To explore a broader range of possibilities and incorporate uncertainties inherent in long-term planning, we then expand our analysis into a more comprehensive experiment. This involves generating a set of simulations designed to capture the impacts of various forms of uncertainty—technological, financial, and political. We achieve this by systematically randomizing input parameters, identified as key uncertainties, within predefined ranges. This method allows us to explore a wide spectrum of potential futures and understand the robustness of each scenario under different conditions. In this study, for each scenario, we generate 1,001 unique parameterizations, referred to as “possible futures”. In total, this process results in 6,006 simulations, each providing insights into how different scenarios might perform under a diverse array of circumstances. These simulations are then systematically analyzed to identify key decarbonization milestones. We assess these milestones based on their performance across various modeled metrics, such as economic benefits and emissions reduction. This comprehensive analysis aids in understanding the resilience and effectiveness of each decarbonization pathway under uncertainty.
EMEPES allows estimating investment costs, operational costs (fixed and variable), and externality costs. It also allows estimating capacity expansion, generation production per type of power plant, generation costs per energy unit, number of jobs created per scenario, and GHG emission trajectory per power plant and fuel type. Estimations follow approaches similar to existing literature (Groves et al., 2020; Saget et al., 2020; Benavides et al., 2021; Quirós-Tortós et al., 2021; Solano-Rodríguez et al., 2021; Welsby et al., 2021; Arguello et al., 2022; Galindo et al., 2022; Kalra et al., 2023; Victor-Gallardo et al., 2024):
• Annual GHG emissions are estimated by multiplying annual fuel consumption by the corresponding emission factor.
• Capital costs of generation projects are calculated by multiplying required capacity by a unit cost from national (CNE, 2022a) and international sources (NREL, 2023).
• Plant maintenance costs are based on installed capacity and unit cost per technology type (NREL, 2023). Operational costs are estimated based on fuel consumption for each technology.
• In the Dominican Republic, the “Organismo Coordinador del Sistema Eléctrico Nacional Interconectado” (OC-SENI), translated as “Coordinating Organism of the Interconnected National Electric System”, handles electricity data and operates the system. Fuel prices are derived from historical data for 2018–2021 reported by the OC-SENI, and average projections by CME Group and World Economic Outlook (IMF, 2023) until 2024, using international projections from World Energy Outlook (IEA, 2023b) for subsequent years.
• Employment factors are from international studies with regional coefficients (Greenpeace, 2019; Teske, 2019) and are associated with each generation technology in the model, including construction, operation, and maintenance components.
• Decarbonization benefits are estimated by comparing scenarios to a benchmark scenario -the BAU in this analysis (see Section 2.1. definitions). A lower-cost renewable scenario than the BAU scenario implies a net benefit; otherwise, it indicates a net cost.
EMEPES is constructed in four modules, each covering different aspects of the future electrical system. Figure 1 shows how the modules relate. Each module provides the input to the next one. There is an overarching administrator that generates parameter variations that are reflective of uncertainties. The administrator uses a Latin hypercube sampling technique (Iman, 2014) to produce N samples of parameter variations for P parameters. Each variation is called a future, and the total number of futures is equal to N, which the user must define. For exploratory modeling assumptions, see Section 3 for the case study. Below, the function of each module is described.
• Demand module (Module A): estimates the future electricity demand based on the energy balance. The base year needs energy balance data for final energy consumption by sector and energy carrier. Then, the demand increases with a combination of economic growth and demand energy intensity, which are assumption inputs. The demand applies equally for all the scenarios defined.
• Supply module (Module B): estimates the generation and installed capacity by technology to meet electricity demand. This expansion follows the renewable energy shares inputted by the user. It also considers other user inputs: planned projects per technology type, planned retired capacity, and shares per technology type to quantify unplanned demand expansion. The technologies are: combined cycle and open cycle turbines running on natural gas, wind turbines, solar photovoltaic, hydropower, internal combustion engines that run on fuel oil, and steam power plants that run on biomass and coal.
• Hourly analysis module (Module C): it verifies the hourly match between supply and demand. It requires a load profile per hour for each month. Also, it requires the daily capacity factor profiles, per month, for solar and wind generation. Renewable generation is supported by storage for peak shaving. Gas turbines and internal combustion engine generators are used flexibly to meet demand when supply is insufficient. If there is insufficient capacity, the module adjusts the capacity expansion from Module B.
• Metrics module (Module D): estimates metrics for each scenario, such as capital costs, fixed operational costs associated with capacity, variable operational costs related to fuel consumption and other costs that are a function of production, externalities related to pollution, and its effects on human health, emissions, and jobs.

Figure 1. EMEPES logical structure.
2.3 Roadmap development
The method for creating the decarbonization roadmap proposal is both quantitative and qualitative. The results of the 6,006 simulations are systematically analyzed to find characteristics associated with desirable performance metrics. For example, high production of electricity with renewable sources would lower emissions, beneficial for the environmental dimension. Based on stakeholder inputs, we identified and selected simulations that fell within the top decile simultaneously for each of the three key metrics evaluated: generation cost (lowest 10% for economic dimension), jobs generated (highest 10% for social dimension), and emissions (lowest 10% for environmental dimension).
To create the roadmap, characteristics representing the evolution of the electrical system are determined, considering the previously identified simulations. Four characteristics are extracted from the simulations: (i) installed capacity; (ii) percentage of non-conventional renewable energy generation (ERNC); (iii) battery storage level; and (iv) investment levels by technology. The values identified for these four characteristics set the roadmap goals for the years 2025, 2030, 2040, and 2050.
Additionally, we developed a tool to collect barriers and identify enabling conditions for the decarbonization. The tool was used and completed by sector actors and supplemented through bilateral meetings. The roadmap proposal results from integrating the desirable decarbonization goals with the actions required to overcome identified barriers and achieve decarbonization by 2050. The roadmap creation process was iterative, culminating in a workshop with over 70 representatives from different agencies in the electricity sector.
3 Data and assumptions
The following are key considerations for the simulations (find exploratory modeling aspects in Table 3):
• Battery installation post-2025: lithium-ion batteries are installed proportional to the installed solar and wind capacity. Solar capacity includes 50% storage capacity with 4-h duration, and wind capacity uses 20% storage, independent of generation projects.
• Minimum reserve margin: a 20% reserve margin is maintained, combining coal, combined cycle, and gas turbine plants, 85% of battery capacity, and 20% of hydro capacity. The 85% battery factor accounts for charge-discharge losses, and the 20% hydro factor is based on minimum capacity explored. Future studies should refine reserve margin criteria, integrating a more detailed SENI electrical analysis. New dual internal combustion engines (natural gas or fuel oil) are introduced if more dispatchable capacity is needed.
• Coal plant operation: from 2025, replaced coal plants operate at an 80% annual plant factor. Natural gas replacement must equal the replaced technology in terms of installed capacity.
• Exclusion of decommissioning costs: costs for plant decommissioning aren't considered. Future work could evaluate the reuse of plant assets and more technological options to support new renewable generation.
• Demand and supply balancing: the model simulates a demand-supply balance. Electricity demand until 2036 is based on the NEP's trend scenario, including sector-wise energy demands. Post-2036 demand projection combines GDP growth and energy intensity trends. GDP is assumed to grow by 5% from 2022 to 2026 and then linearly decrease to 3.7% by 2050.
• Energy composition: the energy composition of each demand sector, defined in the NEP until 2036, is assumed constant until 2050.
• Electricity demand calculation: the country's electricity demand until 2050 is calculated by multiplying GDP with sectoral energy intensity and demand composition. Electricity demand considers self-producers, isolated systems, and technical losses. Transmission losses are assumed constant at 1.82% until 2050, and technical distribution losses at 14.85%. Within the confines of this study's scope, detailed electrification scenarios were not explored, focusing instead on broader electricity demand projections up to 2050. Recognizing the significance of sectoral electrification, future research is encouraged to undertake a comprehensive cost-benefit analysis of electrification in an integrated manner.
• System supply: data from the OC-SENI is used to determine the initial generation mix. The monthly capacity and generation by technology and energy source from OC-SENI are used to calculate the capacity factor for renewables per month. Hourly generation is matched to hourly demand to determine potential dispatch for thermal plants and lithium-ion batteries. The capacity factors are adjusted to the yearly averages of the NEP (CNE, 2022a): 21.5% for solar and 35% for onshore wind. For offshore wind, the capacity factor is increased to 50%, but the same profiles of onshore wind are maintained for lack of additional data.
• Generation expansion: based on the NEP's. The NEP presents multiple scenarios; we use the one with maximum renewable ambition. We also included planned capacity according to the Long-Term Operation Program of the OC-SENI up to 2027.
To the extent that is possible, we used data available in the country. Below are the data and sources of the parameters used in the case study.
• The emission factors per fossil fuel are based on national sources (GIZ, 2020; MIMARENA et al., 2020). These factors in Gg CO2e/GWh are 0.57, 0.4, and 1.23, for fuel oil, natural gas, and carbon, respectively.
• The variable operating cost is directly related to the fuel consumption and its price. The historical fuel prices were sourced from the OC-SENI in Dominican Republic. Data was extracted from reports spanning from 2018 until 2021. The projections presented by CME Group (CME Group, 2023) and the World Energy Outlook (IEA, 2023b) were used for later years up to 2024; beyond that, we used long-term projections of the World Energy Outlook (IEA, 2023b). The data is presented in Table 1.
• The capital costs per technology mix international and local references. For 2022, the capital unit cost in US$/kW for solar, wind onshore and wind offshore are 1,023.5, 1,688, and 3,185, respectively (CNE, 2021); the same source has costs of 15.33, 26.47, and 110.56 US$/kW for solar, wind onshore, and wind offshore. Table 2 shows normalized future costs, using the trajectories from the NREL ATB database (NREL, 2023).
• The capital and operational costs for various energy technologies are specified based on a combination of international and local sources, which are held constant over the simulation horizon. The unit capital expenditure (CAPEX) for biomass reconversion is $38.46/kW (CNE, 2022a), for natural gas with combined cycles is $1,084/kW (CNE, 2022a), for natural gas reconversion is $231/kW (GIZ, 2018), for hydroelectricity is $2,769/kW (CNE, 2022a), and for combustion engines is $1,100/kW (CNE, 2022a). Regarding operational expenditures (OPEX), hydroelectricity incurs a cost of $42.01/kW (NREL, 2023), combustion engines cost $35.16/kW (CNE, 2022a), steam turbines operating on coal cost $82/kW (NREL, 2023), biomass costs $29.37/kW (NREL, 2023), and natural gas costs $14.10/kW (CNE, 2022a).
• Job factors (jobs/MW) form international studies (Greenpeace, 2019; Teske, 2019) are: 1.8, 14, 3, 6.5, and 3.5 for the construction and installation of new capacity of natural gas, biomass, onshore wind, offshore wind, and solar projects. The study also shows operation and maintenance jobs per unit of total installed capacity: 0.14, 1.5, 0.3, 0.15, and 0.7 for natural gas, biomass, onshore wind, offshore wind, and solar projects. According to the same source, for coal, the operation and maintenance jobs are 0.14 jobs/MW.
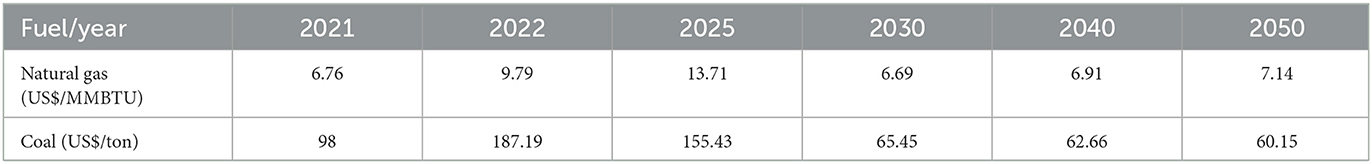
Table 1. Based values utilized for fuel prices.
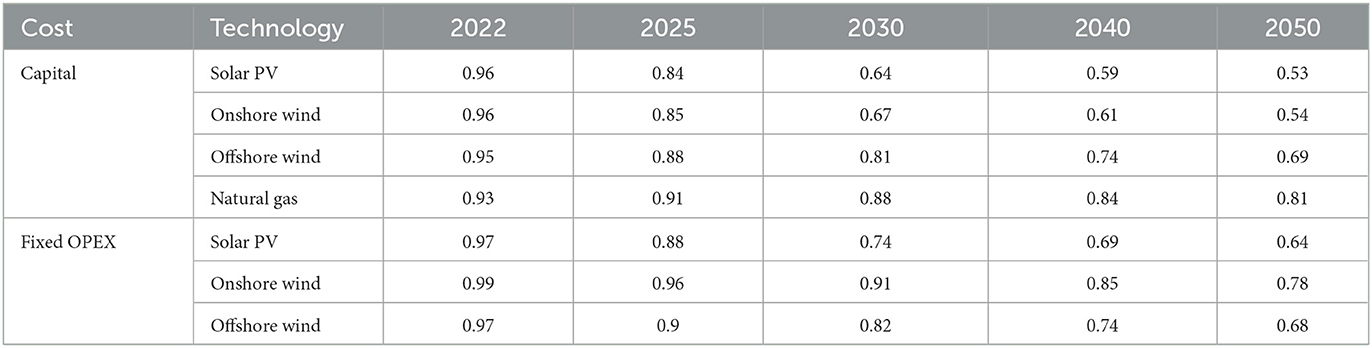
Table 2. Capital and fixed operating costs normalized to 2021.
A fixed parameterization applies to an initial future. The parameters can take various values depending on assumptions about the future. An additional 1,000 parameter combinations are created with the Latin Hypercube Sampling (LHS) algorithm, which creates a matrix of numbers for N samples and P parameters. Table 3 shows the varied parameters (a total of 13). LHS generates a matrix of 1,000 rows (representing futures) and 13 columns (representing parameters), with random numbers between 0 and 1 per cell. These numbers are adjusted to the value range intervals of the “Min” column (when the random number is 0) and the “Max” column (when the random number is 1) in Table 3. The “initial future' column displays the value used for the base case before varying parameters.
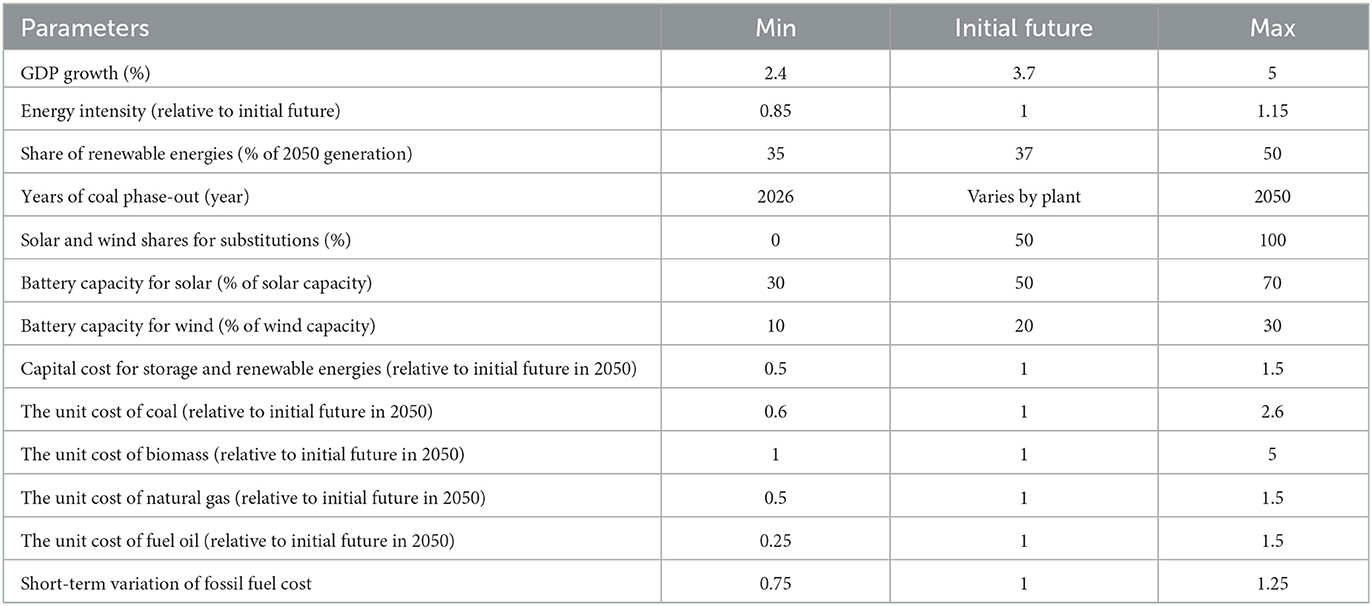
Table 3. Uncertainties and their range explored.
4 Results
This section presents the outcomes of our comprehensive analysis using the EMEPES. We present the results of the four scenarios under different conditions, discussing key outcomes in terms of their feasibility, economic implications, social impacts, and environmental impact. The analysis, enriched by 6,006 simulations, reveals critical findings about the potential trajectories of the Dominican Republic's electricity sector, highlighting key milestones in the journey toward a sustainable energy future. Note the renewable scenario has 3,003 simulations, since three permutations are modeled (see Section 2.1.). We explore metrics such as GHG emissions, economic benefits, investment needs, and employment opportunities associated with each scenario. Finally, we present the proposed roadmap to deliver high benefits, a high number of jobs, and low emissions by 2050.
4.1 Technical, socioeconomic, and environmental outcomes
4.1.1 Installed capacity and electricity generation
The results of our study, illustrated in Figures 2 through 5, offer insightful discussions about the future of the Dominican Republic's electricity sector under different decarbonization scenarios.
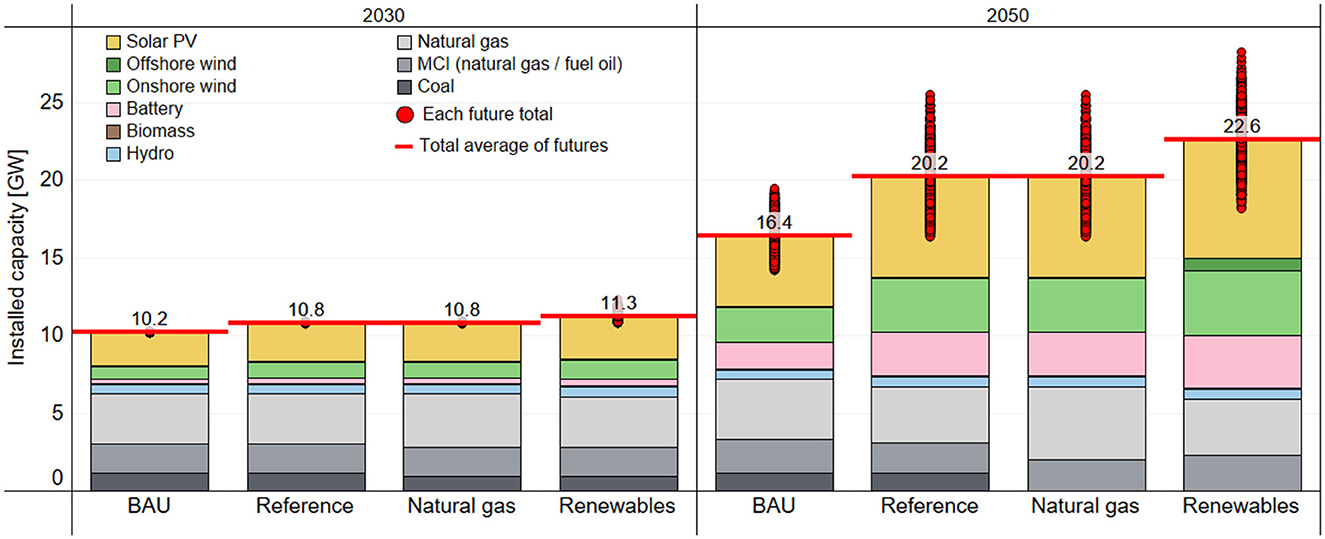
Figure 2. Installed capacity per scenario in 2030 and 2050.
Figure 2 highlights the projected installed capacity by 2030 and 2050 for each scenario. The red line shows the average value across all futures and the red dots represent the values of the simulations.
The renewable scenario demands the highest capacity due to the lower capacity factors of solar and wind systems compared to fossil fuel plants. The required capacity ranges from a minimum of 18.1 GW to a maximum of 28.2 GW by 2050, varying with demand magnitude and the mix of renewable sources. The greater the solar capacity compared to wind, the higher the total installed capacity. Hydro capacity remains constant at 0.62 GW. By 2030, natural gas (combined cycle and gas turbines) would have an installed capacity of 3.2 GW in the base, reference, and renewable scenarios, and 3.41 GW in the natural gas scenario. By 2050, this increases to 3.6 GW for the reference and renewable scenarios, 3.8 GW for the BAU scenario, and 4.7 GW for the natural gas scenario.
For onshore wind, the installed capacity is 0.92 GW in the BAU scenario by 2030, reaching 1.31 GW in the renewable scenario. By 2050, this scenario projects the highest wind capacity at 4.1 GW, compared to 2.30 GW in the BAU scenario. The renewable scenario also includes 0.83 GW of offshore wind by 2050—this would replace Punta Catalina coal-fired power plant generation. Solar photovoltaic capacity is expected to reach 7.6 GW in the renewable scenario by 2050. Internal combustion engines' installed capacity, required to maintain a 20% reserve margin and cover demand when batteries and combined cycle plants are insufficient, would be higher in the renewable scenario (2.4 GW by 2050) compared to 1.9 GW in the natural gas scenario.
Battery capacity needs vary across scenarios, with the renewable scenario requiring the most (3.11 GW by 2050). Figure 3 shows the penetration of non-conventional renewable energy as a percentage of installed capacity, highlighting its growth in all scenarios and reaching two-thirds by 2050 in the renewable scenario. The largest installed capacity is reached in the renewable scenario only. By 2050, 66% of the power plants installed in the country would need to be on average based on wind, solar and biomass.
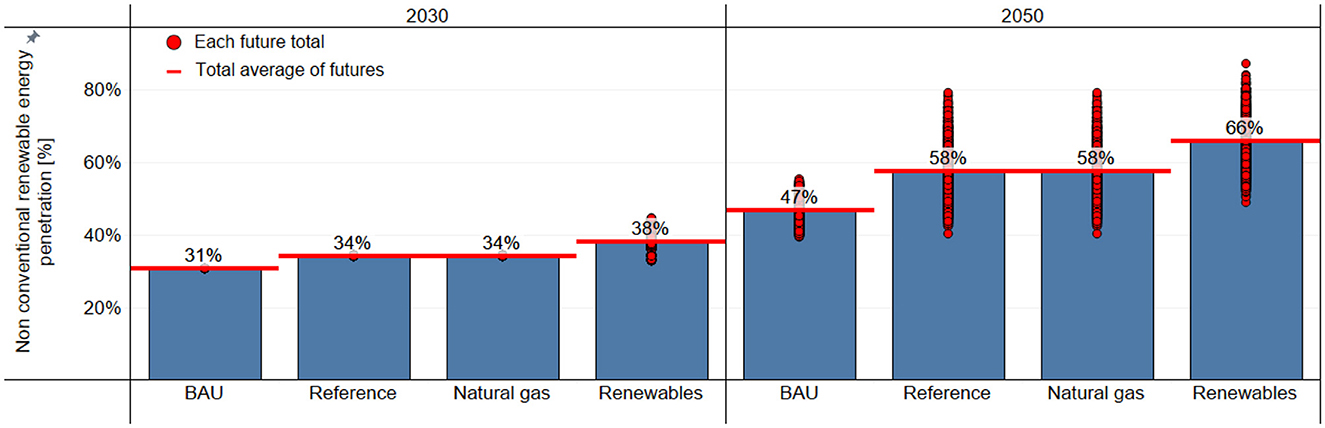
Figure 3. Proportion of installed capacity of non-conventional renewable energy sources per scenario in 2030 and 2050.
Figure 4 depicts the distribution of generation by technology and fuel. By 2030, more than 65% of generation would still rely on fossil fuels in all scenarios. By 2050, combustion engine generation would be between 3 and 6%, potentially utilizing natural gas. Figure 5 finally shows the percentage of electricity generation from non-conventional renewable sources. By 2050, the renewable scenario (solar, wind, biomass, and water) contributes between 48 and 63%, reducing vulnerability to imported energy price shocks.
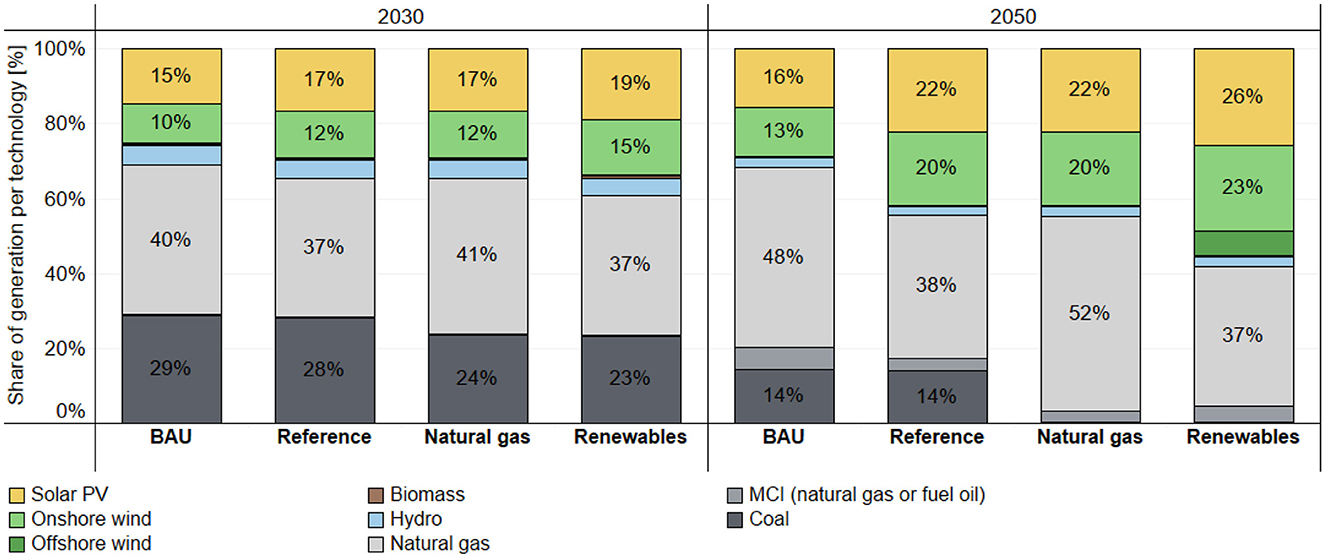
Figure 4. Average proportion of electricity generation per technology per scenario in 2030 and 2050.
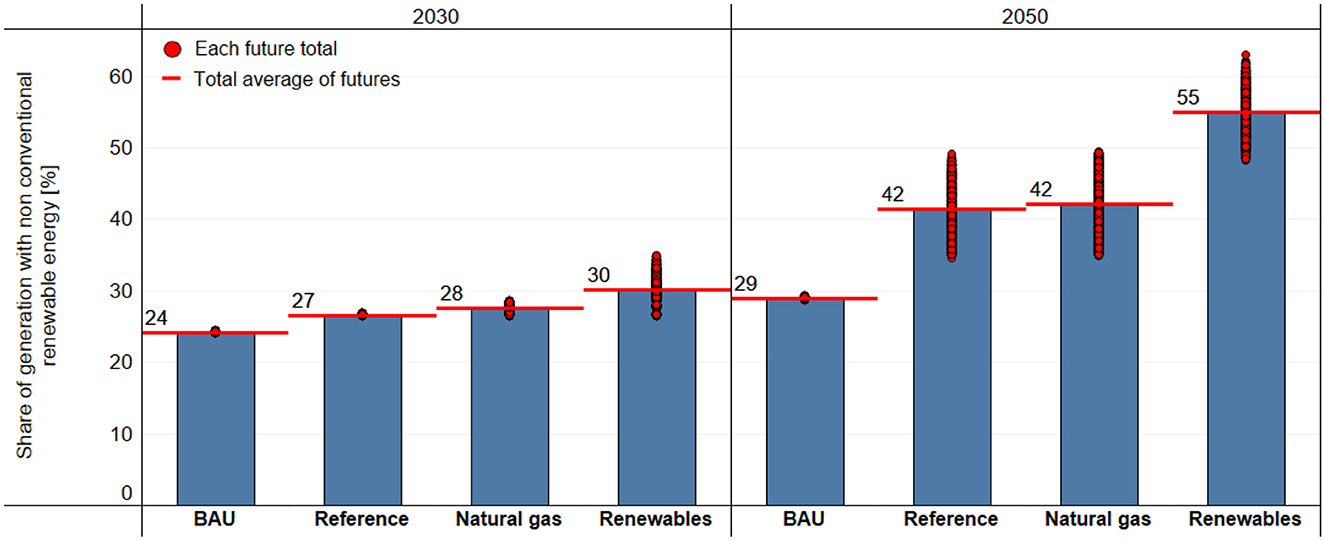
Figure 5. Porcentaje de generación de energía con ERNC por escenario.
4.1.2 Cost-benefit assessment
We estimate cumulative costs from 2023 to 2050 for each scenario, using a 5.04% discount rate based on a local study that estimates the Weighted Average Cost of Capital (WACC) for the electricity sector (CNE, 2022b). The costs of the reference, natural gas and renewable scenarios are then contrasted with the costs of the BAU scenario. We define net benefit if the cost of the BAU scenario is larger than the cost of the other scenario. A net cost implies the opposite (i.e., the BAU scenario is less expensive).
Figure 6 details the net benefit of net cost per scenario and future. For the renewable scenario, the average net benefit is estimated at $2.7 billion, and this ranges between a loss of $1.5 billion and a gain of $8.0 billion. The average investment costs for generation in the renewable scenario are $3.3 billion higher than in the BAU scenario. However, reduced operational costs would compensate for the higher investment, translating into an average country-level economic benefit of nearly $5.7 billion by 2050. In all scenarios, the largest benefit corresponds to avoided variable costs, mostly linked to fuel expenses.
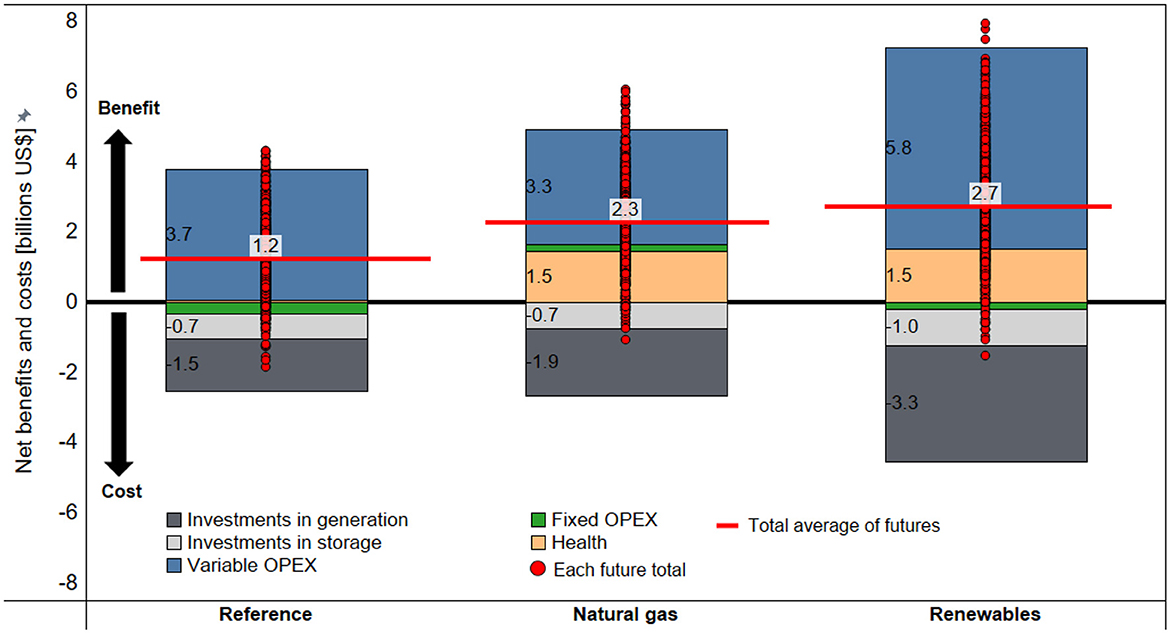
Figure 6. Cumulative net benefit or net cost of the scenarios relative to the BAU scenario. The disaggregated bars show the specific components of net benefits and costs. If the bar's value is positive, it corresponds to a net benefit. If the value is negative, the bar is a net cost. The bars are the average values across futures. The red line is the total net benefit (summing the disaggregated components), averaged across futures. The dots show the total net benefits and costs for each future.
The analysis of variable cost components reveals that natural gas would be the most significant expenditure between 2023 and 2050, followed by coal and fuel oil. In terms of avoided variable costs, both the reference and renewable scenarios could save around $3 billion in natural gas expenses. However, the natural gas scenario negates these savings as almost the same amount of gas is consumed. Additionally, avoiding fuel oil consumption contributes over a billion dollars in benefits in the renewable scenario. The average savings in variable costs from replacing coal generation amount to ~$1.8 billion.
To realize the variable cost savings , capital investments in generation and batteries are required. The magnitude of these investments varies across scenarios. The net cost, or additional cost relative to the BAU scenario, is lower than the variable cost savings, resulting in overall positive benefits on average.
The CAPEX magnitude for offshore wind and internal combustion engines is similar in the renewable scenarios. The net CAPEX cost for the renewable scenario with only solar and wind would be slightly lower than the other two renewable scenarios, primarily because solar energy is cheaper than offshore wind in most futures. However, factors like transmission and land availability, which were not quantitatively analyzed in this study, may make the option of offshore wind more viable despite its higher cost.
4.1.3 Jobs
Figure 7 illustrates the cumulative job creation across various scenarios. The renewable scenario would generate the highest number of jobs by both 2030 and 2050, with at least 45,000 jobs by 2030 and 121,000 by 2050 (minimum values from the figure). By 2030, the renewable scenario is expected to create at least 11,000 more jobs than the BAU scenario and at least 4,000 more than both the natural gas and reference scenarios. By 2050, this advantage significantly increases, with the renewable scenario generating 70,000 more jobs than the BAU scenario and at least 31,000 more than the natural gas scenario.
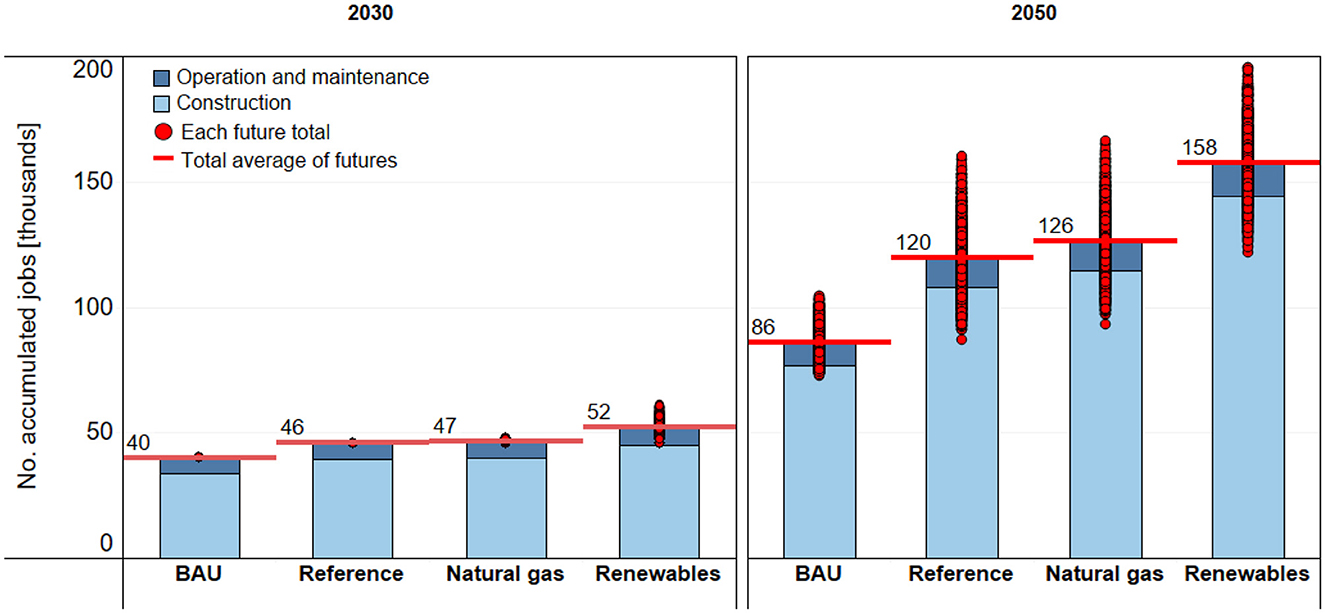
Figure 7. Cumulative jobs created by 2030 and 2050 per scenario.
These figures underscore the substantial employment benefits that can be realized through a shift toward renewable energy. Not only does the renewable scenario contribute to environmental sustainability, but it also plays a role in job creation, surpassing the employment opportunities offered by the other scenarios. This highlights the broader socio-economic benefits of transitioning to renewable energy, demonstrating that such a shift not only addresses environmental concerns but also has the potential to significantly boost employment and contribute to economic growth.
4.1.4 GHG emissions
Figure 8 in the study displays greenhouse gas (GHG) emission outcomes for each scenario. In the BAU scenario, emissions are projected to increase to 23.7 million tons of CO2 equivalent (MtCO2e) by 2050. The reference scenario shows a slight improvement, with emissions rising to 20.5 MtCO2e by the same year. The natural gas scenario demonstrates a more significant reduction, averaging 14.5 MtCO2e, although in some futures, it could reach as high as 17.7 MtCO2e.
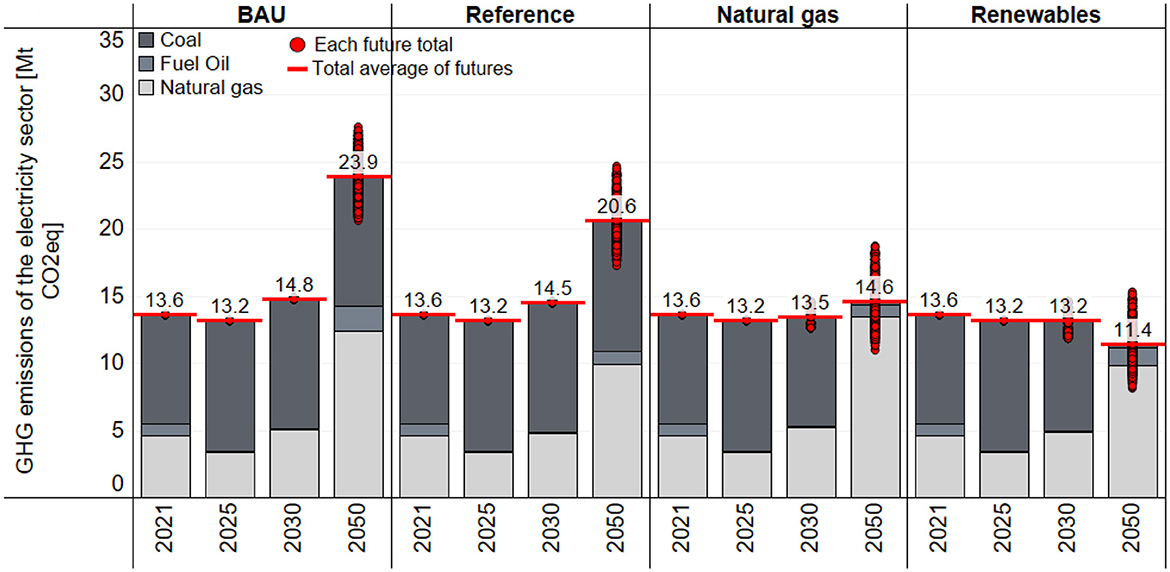
Figure 8. Greenhouse emissions per scenario.
The renewable scenario is expected to have the lowest emissions among all scenarios, averaging 11.2 MtCO2e, with a maximum of around 14 MtCO2e. To move toward carbon neutrality, further reductions in the long term could be achieved in the electricity sector if natural gas were replaced or blended with green hydrogen, a technological option that should be explored in future analyses.
This analysis highlights the critical role of renewable energy in reducing GHG emissions in the electricity sector, with the renewable scenario showing the most promise for substantial emission reductions.
4.2 Discussion of results
This paper has described the effects on employment, emissions, and economic investment of four scenarios in which the electrical sector in the Dominican Republic may develop. This analysis provides support for understanding the strategies to decarbonize the electricity sector of the country.
The economic benefits of the renewable scenario notably include a significant reduction in health-related costs, amounting to $1.511 billion of the $2.730 billion average benefits. However, these are not direct benefits from the electricity system itself.
Economic benefits correlate with four key input parameters, determining the magnitude of these benefits (Figure 9). The relationship between benefits and each parameter varies by scenario:
• In the Reference scenario, benefits directly relate to the cost of natural gas and inversely to the cost of renewable energy. Higher natural gas costs and lower renewable costs enhance the benefits, as the BAU scenario (for comparison) relies more on natural gas for electricity production.
• In the Natural Gas scenario, it's more beneficial when fuel oil generation is costlier, as the BAU scenario uses a similar proportion of natural gas.
• In the Renewable scenarios, benefits increase with lower costs for renewable energies (solar, wind, and storage).
• Across all scenarios, benefits grow with rising coal prices, as this would increase the cost of the BAU scenario.
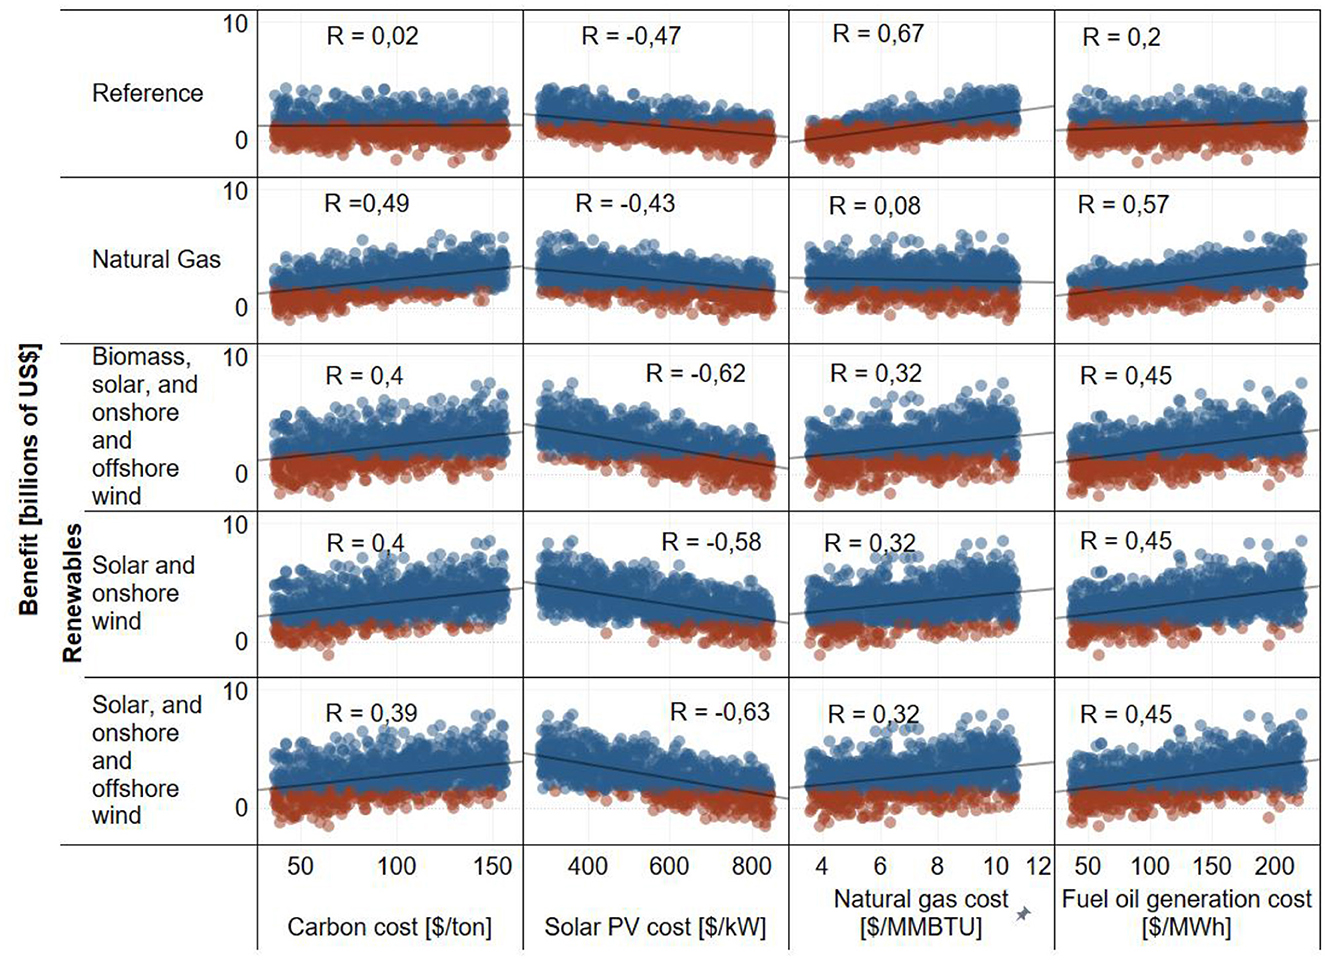
Figure 9. Economic benefits vs. technology and fuel costs.
After exploring the simulation results, we find that 63% of futures in the Reference scenario yield benefits below the $1.511 billion benefits associated solely with health benefits in the initial simulations. For other scenarios, the percentages are 27% for Natural Gas, 30% for Renewable with biomass, solar, and wind (land and sea), 12% for Renewable with solar and wind (land), and 22% for Renewable with solar and wind (land and sea).
We also identified the median parameters for 2050 associated with low benefits. For instance, in the Reference scenario, benefits are low if renewable costs don't fall below $627/kW, natural gas costs don't exceed $6/MMBTU, and fuel oil generation costs don't rise above $123/MWh. Understanding these inflection points can inform policy design to maximize benefits.
The renewable scenario with solar and wind (land) shows more significant cost reductions compared to other sub-scenarios. This is because offshore wind is relatively more expensive than land-based solar and wind. Lower natural gas costs reduce the cost of renewable scenarios compared to the reference. This is linked to the use of combustion engines supporting high ERNC penetration systems. The reduction in generation cost for the Natural Gas scenario relative to the Reference and the cost of natural gas are variables with a higher Pearson correlation coefficient (the R defined in Figure 9), due to high dependence on this resource in that scenario.
4.3 Proposed roadmap
The economic assessment of various scenarios under uncertainty provides valuable insights for proposing a set of milestones that bring benefits from multiple perspectives. For instance, identifying milestones that offer maximum net benefits or create the most jobs is possible. However, an ideal set of milestones for the Dominican Republic should satisfy various policy objectives while steering the country toward electric sector decarbonization. This approach would not only reduce GHG emissions, aiding the country's goal of carbon neutrality, but also potentially decrease generation costs per energy unit and create more jobs, thereby contributing to economic recovery and a just transition.
Key milestones are extracted by looking for parameter combinations that yield the most desirable performance metrics: generation cost, emissions, and jobs. An analysis of 6,006 simulations identified the top 10% with the best metrics. Three groups of futures were selected, one for each metric, and the final set of milestones was derived by examining variables at the intersection of these groups.
These milestones, spanning four periods (2025, 2030, 2040, 2050), are presented with minimum and maximum values derived from the simulations that satisfy the three mentioned metrics. Values outside these ranges may lead to poor performance in the indicated metrics. Table 4 presents Key observations include:
• Significant growth in solar and wind (onshore and offshore) generation capacity is necessary in the long term. Solar capacity should increase more than wind due to the country's resource availability and lower technology costs. Offshore wind could be an effective alternative for the medium to long term.
• The country needs to increase non-conventional renewable energy (ERNC) penetration gradually to about 60% by mid-century. Correspondingly, ERNC production should rise to about 55% by then.
• Increasing ERNC penetration initially requires low investments, which will grow as the country's needs increase.
• Battery capacity should expand in the long term as technology costs become competitive.
• Substituting or converting coal plants is not feasible in the very short term. By 2030, some units could be substituted or converted, but not exceeding 312 MW. By 2040, the suggested retirement for good performance in the three metrics could be at least 312 MW, increasing to the total if coal becomes too costly. By 2050, all coal generation should be phased out.
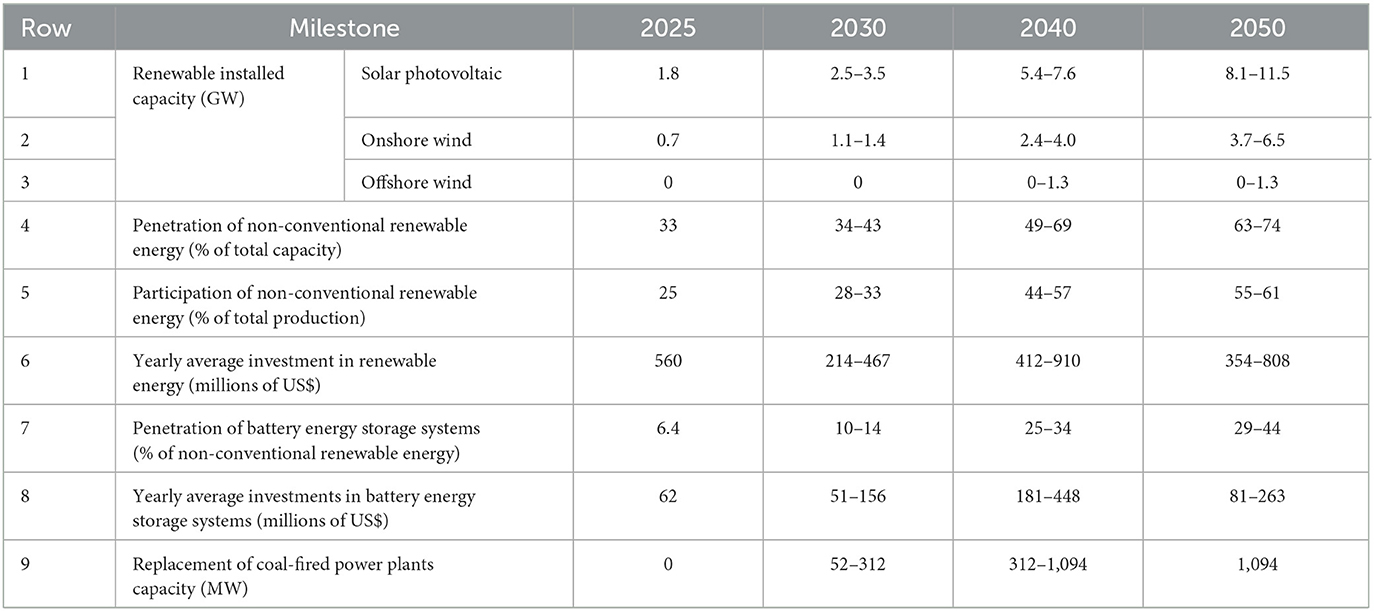
Table 4. Milestones to decarbonize the electricity sector in the Dominican Republic.
These milestones are unique in that they align with concurrent benefits across the three metrics of interest, implying that values within identified thresholds would bring economic, environmental, and social benefits to the Dominican Republic. The lower threshold values correspond to low demand growth, while the higher values are linked to demand increases.
5 Conclusions
The comprehensive analysis of various decarbonization scenarios for the Dominican Republic's electricity sector, conducted under conditions of uncertainty, provides pivotal insights into the country's path toward a sustainable and carbon-neutral future. This study highlights the intricate balance between economic, environmental, and social factors in the transition to renewable energy.
1. Economic implications: the renewable scenario emerges as the most economically viable pathway. Despite higher initial investment requirements, it offers the lowest overall system costs, mainly due to significant savings in operational expenses. The potential for reduced health-related costs, due to lower emissions, further underscores the economic benefits of this scenario. Moreover, the analysis reveals the sensitivity of economic benefits to key input parameters, such as the costs of natural gas, renewable energy, and fuel oil.
2. Environmental benefits: the renewable scenario significantly lowers greenhouse gas emissions, aligning with the Dominican Republic's aspirations for carbon neutrality and its commitments under the NDC. The projected decrease in emissions demonstrates the environmental superiority of the renewable scenario over others, especially considering the potential for integrating green technologies like hydrogen in the future.
3. Social impact and employment: this scenario also leads in terms of job creation, with substantial employment opportunities emerging from the expansion of renewable energy infrastructure. The creation of new jobs in the renewable sector not only contributes to economic growth but also supports the country in its post-pandemic economic recovery and ensures a just transition for workers.
4. Milestones and long-term strategy: the study identifies critical milestones for the Dominican Republic's journey toward decarbonization. These include significant growth in solar and wind energy capacity, increased penetration of non-conventional renewable energies, and the gradual phasing out of coal generation. Achieving these milestones requires strategic planning and investments, especially in the context of varying demand growth scenarios.
5. Policy implications and future directions: the findings suggest that policy measures should focus on incentivizing renewable energy, optimizing energy storage solutions, and carefully planning the transition from coal. Future analyses should consider additional technological options, such as green hydrogen and a more in-depth analysis of offshore wind, as well as the evaluation of the potential impacts of transmission and land availability on renewable energy deployment. Moreover, future analyses should study the electrification of other end-use demand sectors in detail and test whether the renewable energy pathway would still be convenient. Such analyses could find synergies between renewable supply and flexible demand through technologies like demand-side management.
In conclusion, the Dominican Republic stands at a critical juncture in its energy transition. By adopting a renewable-focused energy strategy, the country can achieve significant economic, environmental, and social benefits. This transition requires comprehensive planning, robust policy support, and strategic investments, which will not only help the Dominican Republic meet its climate commitments but also foster sustainable economic growth and social development. The insights from this study offer a valuable blueprint for the Dominican Republic and other nations pursuing similar energy transitions, demonstrating that a shift toward renewables is not just environmentally imperative but also economically and socially beneficial.
Data availability statement
The raw data supporting the conclusions of this article will be made available by the authors, without undue reservation.
Author contributions
LV-G: Methodology, Writing – original draft, Writing – review & editing, Formal analysis, Investigation, Software, Visualization. SS-J: Data curation, Investigation, Software, Writing – review & editing. LR-D: Data curation, Investigation, Software, Visualization, Writing – review & editing. JR: Funding acquisition, Investigation, Methodology, Writing – review & editing. JQ-T: Conceptualization, Funding acquisition, Methodology, Resources, Supervision, Writing – original draft, Writing – review & editing. RG: Resources, Writing – review & editing. MD: Resources, Supervision, Writing – review & editing. HB: Writing – review & editing. BL: Project administration, Resources, Validation, Writing – review & editing.
Funding
The author(s) declare financial support was received for the research, authorship, and/or publication of this article. This study was funded by the Inter-American Development Bank (RG-E1855).
Acknowledgments
The authors gratefully acknowledge the contributions of the electricity sector of the Dominican Republic and Interamerican Development Bank.
Conflict of interest
The authors declare that the research was conducted in the absence of any commercial or financial relationships that could be construed as a potential conflict of interest.
Publisher's note
All claims expressed in this article are solely those of the authors and do not necessarily represent those of their affiliated organizations, or those of the publisher, the editors and the reviewers. Any product that may be evaluated in this article, or claim that may be made by its manufacturer, is not guaranteed or endorsed by the publisher.
References
Arguello, R., Delgado, R., Valderrama-Espinosa, M., González, T., and Sandoval, J. M. (2022). Análisis costo-beneficio de las opciones para alcanzar cero emisiones netas en Colombia. Interamerican Development Bank.
Benavides, C., Cifuentes, L. A., Díaz, M., Gilabert, H., Gonzales, L., González, D., et al. (2021). Opciones para lograr la carbono-neutralidad en Chile: una evaluación bajo incertidumbre. Interamerican Development Bank.
CME Group (2023). Coal (API2) CIF ARA (ARGUS-McCloskey). Available online at: https://www.cmegroup.com/markets/energy/coal/coal-api-2-cif-ara-argus-mccloskey.html (accessed January, 2024).
CNE (2021). Precios de referencia 2021, 10–14. Available online at: https://ww.cne.gob.do/transparencia/base-legal-de-la-institucion/resoluciones-2/ (accessed January, 2024).
CNE (2022a). Plan Energético Nacional (PEN) 2022 - 2036. Available online at: https://www.cne.gob.do/documentos/plan-energetico-nacional-pen/ (accessed January, 2024).
CNE (2022b). Estudio del régimen económico de las energías renovables en la República Dominicana para el año 2022. Available online at: https://www.cne.gob.do/documentos/regimen-economico/ (accessed January, 2024).
Galindo, L. M., Hoffman, B., and Vogt-Shilb, A. (2022). ¿Cuánto costará lograr los objetivos del cambio climático en América Latina y el Caribe? Available online at: https://publications.iadb.org/publications/spanish/document/Cuanto-costara-lograr-los-objetivos–del-cambio-climatico–en-America-Latina-y-el-Caribe.pdf (accessed January, 2024).
GIZ (2018). Estudio de alternativas tecnológicas al retiro y/o reconversión de las unidades de carbón en Chile. Available online at: https://energia.gob.cl/sites/default/files/11_2018_inodu_alternativas_tecnologi~cas.pdf (accessed January, 2024).
GIZ (2020). Actualización del inventario de gases de efecto invernadero para la subcategoría Industrias de la Energía (1. A. 1): período 2015–2018. Santo Domingo: Ministerio de Medio Ambiente y Recursos Naturales; Ministerio. Available online at: https://transicionenergetica.do/wp-content/uploads/2020/09/Actualización-del-Inventario-de-Gases-de-Efecto-Invernadero-para-la-subcategoría-Industrias-de-la-Energía.pdf (accessed January, 2024).
Greenpeace (2019). Outlook on Employment Effects of a Global Energy Transition. Available online at: https://www.greenpeace.org/static/planet4-africa-stateless/2019/04/6cd35f47-jt-global-employment-report.pdf (accessed January, 2024).
Groves, D. G., Syme, J., Molina-Perez, E., Calvo, C., Víctor-Gallardo, L. F., Godinez-Zamora, G., et al. (2020). The Benefits and Costs of Decarbonizing Costa Rica's Economy - Informing the Implementation of Costa Rica's National Decarbonization Plan Under Uncertainty. Interamerican Development Bank.
Howells, M., Rogner, H., Strachan, N., Heaps, C., Huntington, H., Kypreos, S., et al. (2011). OSeMOSYS: the open source energy modeling system. Energy Policy 39, 5850–5870. doi: 10.1016/j.enpol.2011.06.033
IEA (2023a). Latin America Energy Outlook 2023. Available online at: https://iea.blob.core.windows.net/assets/fd4c48e3-fe02-4e75-bf94-057fcafa56db/LatinAmericaEnergyOutlook.pdf (accessed January, 2024).
IEA (2023b). World Energy Outlook 2023. Available online at: https://iea.blob.core.windows.net/assets/42b23c45-78bc-4482-b0f9-eb826ae2da3d/WorldEnergyOutlook2023.pdf (accessed January, 2024).
Iman, R. L. (2014). “Latin hypercube sampling,” in Wiley StatsRef: Statistics Reference Online, eds. N. Balakrishnan, T. Colton, B. Everitt, W. Piegorsch, F. Ruggeri, and J. L. Teugels. doi: 10.1002/9781118445112.stat03803
IMF (2023). World Economic Outlook. Available online at: https://www.imf.org/external/datamapper/datasets/WEO (accessed January, 2024).
Kalra, N., Molina-Pérez, E., Syme, J., Esteves, F., Cortés, H., Rodríguez-Cervantes, M. T., et al. (2023). The Benefits and Costs of Reaching Net Zero Emissions in Latin America and the Caribbean. Available online at: https://publications.iadb.org/en/benefits-and-costs-reaching-net-zero-emissions-latin-america-and-caribbean (accessed January, 2024).
Lempert, R. J., Popper, S. W., and Bankes, S. C. (2003). Shaping the Next One Hundred Years: New Methods for Quantitative, Long-Term Policy Analysis. RAND Corporation.
McCollum, D. L., Zhou, W., Bertram, C., De Boer, H. S., Bosetti, V., Busch, S., et al. (2018). Energy investment needs for fulfilling the Paris Agreement and achieving the Sustainable Development Goals. Nat. Energy 3, 589–599. doi: 10.1038/s41560-018-0179-z
MIMARENA CNCCMDL, and PNUD. (2020). Primer Informe Bienal de Actualización de la República Dominicana ante la Convención Marco de las Naciones Unidas sobre el Cambio Climático. Available online at: https://unfccc.int/sites/default/files/resource/Dominican%20Republic-%20BUR1.pdf (accessed January, 2024).
NREL (2023). 2023 Annual Technology Baseline. Annual Technology Baseline. Available online at: https://atb.nrel.gov/electricity/2023/data (accessed January, 2024).
Quirós-Tortós, J., Godínez-Zamora, G., De La Torre Ugarte Pierrend, D. G., Heros, C., Lazo Lazo, J., Ruiz, E., et al. (2021). Costos y beneficios de la carbono-neutralidad en Perú: Una evaluación robusta. Interamerican Development Bank.
Saget, C., Vogt-Schilb, A., and Luu, T. (2020). Jobs in a Net-Zero Emissions Future in Latin America and the Caribbean. Washington, DC; Geneva: Inter-American Development Bank and International Labour Organization.
Solano-Rodríguez, B., Pye, S., Li, P.-H., Ekins, P., Manzano, O., and Vogt-Schilb, A. (2021). Implications of climate targets on oil production and fiscal revenues in Latin America and the Caribbean. Energy Clim. Change 2:100037. doi: 10.1016/j.egycc.2021.100037
Teske, S. (2019). Achieving the Paris Climate Agreement Goals: Global and Regional 100% Renewable Energy Scenarios With Non-energy GHG Pathways for +1.5°C and +2°C. Available online at: https://library.oapen.org/handle/20.500.12657/22899 (accessed January, 2024).
United Nations (2015). Paris Agreement. Available online at: https://unfccc.int/sites/default/files/english_paris_agreement.pdf (accessed January, 2024).
Victor-Gallardo, L., Rodríguez Zúñiga, M., Quirós-Tortós, J., Jaramillo, M., and Vogt-Schilb, A. (2024). Policy options to mitigate the fiscal impact of road transport decarbonization: application to Costa Rica. Energy Policy 185:113958. doi: 10.1016/j.enpol.2023.113958
Vogt-Schilb, A. (2021). “Stronger sustainable growth,” in Opportunities for Stronger and Sustainable Postpandemic Growth, eds. E. Cavallo, and A. Powell (Interamerican Development Bank). Available online at: https://publications.iadb.org/publications/english/document/2021-Latin-American-and-Caribbean-Macroeconomic-Report-Opportunities-for-Stronger-and-Sustainable-Postpandemic-Growth.pdf (accessed January, 2024).
Welsby, D., Rodriguez, B. S., Pye, S., and Vogt-Schilb, A. (2021). High and Dry: Stranded Natural Gas Reserves and Fiscal Revenues in Latin America and the Caribbean. Available online at: https://publications.iadb.org/en/publications/english/document/High-and-Dry-Stranded-Natural-Gas-Reserves-and-Fiscal-Revenues-in-Latin-America-and-the-Caribbean.pdf (accessed January, 2024).
Keywords: decarbonization, Dominican Republic, energy policy, renewable energy, scenario analysis, uncertainty
Citation: Victor-Gallardo L, Solórzano-Jiménez S, Rodríguez-Delgado L, Roccard J, Quirós-Tortós J, Gómez R, Dionicio M, Baldivieso H and Lefevre B (2024) Economic evaluation of decarbonizing the electricity sector in the Dominican Republic. Front. Clim. 6:1380382. doi: 10.3389/fclim.2024.1380382
Received: 01 February 2024; Accepted: 30 April 2024;
Published: 15 May 2024.
Edited by:
Edmundo Molina-Perez, Monterrey Institute of Technology and Higher Education (ITESM), MexicoReviewed by:
James Syme, RAND Corporation, United StatesMelih Soner Celiktas, Ege University, Türkiye
Copyright © 2024 Victor-Gallardo, Solórzano-Jiménez, Rodríguez-Delgado, Roccard, Quirós-Tortós, Gómez, Dionicio, Baldivieso and Lefevre. This is an open-access article distributed under the terms of the Creative Commons Attribution License (CC BY). The use, distribution or reproduction in other forums is permitted, provided the original author(s) and the copyright owner(s) are credited and that the original publication in this journal is cited, in accordance with accepted academic practice. No use, distribution or reproduction is permitted which does not comply with these terms.
*Correspondence: Jairo Quirós-Tortós, jairohumberto.quiros@cr.ac.cr