Memory-Based Specification of Verbal Features for Classifying Animals into Super-Ordinate and Sub-Ordinate Categories
 Takahiro Soshi
 Norio Fujimaki
 Atsushi Matsumoto
 Aya S. Ihara
- Center for Information and Neural Networks (CiNet), National Institute of Information and Communications Technology, Osaka University, Kobe, Japan
Accumulating evidence suggests that category representations are based on features. Distinguishing features are considered to define categories, because of all-or-none responses for objects in different categories; however, it is unclear how distinguishing features actually classify objects at various category levels. The present study included 75 animals within three classes (mammal, bird, and fish), along with 195 verbal features. Healthy adults participated in memory-based feature-animal matching verification tests. Analyses included a hierarchical clustering analysis, support vector machine, and independent component analysis to specify features effective for classifications. Quantitative and qualitative comparisons for significant features were conducted between super-ordinate and sub-ordinate levels. The number of significant features was larger for super-ordinate than sub-ordinate levels. Qualitatively, the proportion of biological features was larger than cultural/affective features in both the levels, while the proportion of affective features increased at the sub-ordinate level. To summarize, the two types of features differentially function to establish category representations.
Introduction
Our environment is full of natural and artificial objects, and we classify and deal with these objects (e.g., avoid dangerous animals) during our daily lives. Throughout our development, we do not necessarily learn how to classify objects based on instructions from other people; instead, we learn to recognize that dogs and cats, for instance, are classified into the same class. This type of observation suggests that semantic knowledge is constructed with a non-supervised learning mechanism, likely the result of using cue information from overlapping properties across objects (Sloutsky, 2003). A feature (e.g., “has a beak” for “sparrow” and “crow”) is widely considered as the building block for category representation (Rosch et al., 1976; McRae et al., 1999; Tyler and Moss, 2001; Caramazza and Mahon, 2003). Several neuro-cognitive models have been proposed for feature-based object representations (Caramazza and Mahon, 2003). Among these models, distributed memory models have been widely supported (Tyler and Moss, 2001). Such models depend on overlapping features among objects for category representation. Many models share this feature-based concept, including the parallel-distributed model (Rumelhart et al., 1986; Farah and McClelland, 1991; Rogers and McClelland, 2004), the feature model (Damasio, 1990), the relevance-based model (Sartori and Lombardi, 2004; Mechelli et al., 2006), and the distributed-plus-hub model (Patterson et al., 2007).
Certain features effectively classify objects in different categories and have been termed “distinguishing” (Rosch et al., 1976) or “deterministic” (Deng and Sloutsky, 2015) features (D-features). D-features may be non-uniformly represented in the brain. For instance, salient D-features may undergo strong memory consolidation through feature–object associations shared by members of the same category (Sloutsky, 2003; Rogers et al., 2004), since such associations attract attention (Deng and Sloutsky, 2015). The nature of D-features is summarized through the notion of cue validity (Rosch et al., 1976). Cue validity represents the probability of a co-occurrence for certain features and objects in the same category. D-features with higher cue validity (e.g., “has wings”) possess an “all-or-none” response pattern across categories: they selectively occur for exemplars in specific categories (e.g., “a bird”) but not for those in other categories (e.g., “a mammal”) with high probability. Such an all-or-none response property of a D-feature may mirror an objective property of an external world, where features, such as structural, ecological properties of living organisms (Breed and Moore, 2015) are non-uniformly associated with objects in a perceived world (Rosch, 1978). D-features may have developmental advantages in that they could attract even infants (Deng and Sloutsky, 2015), and be acquired during their first 3–4 months of life (Behl-Chadha, 1996). Neurological studies also suggest that people with semantic dementia (SD) tend to retain objective features to make not sub-ordinate (e.g., “a hammer”), but super-ordinate classifications (e.g., “a tool”) even after cortical damages (Warrington, 1975; Warrington and Shallice, 1984; Hodges et al., 1995). Taken together, D-features with an all-or-none response pattern may be useful as a probe to elucidate a constructive property of mental object representation as a mirror of an external world.
The current working hypothesis to investigate feature-based object representation is described as follows: greater amounts of D-features may effectively function at more super-ordinate categorical levels. Because super-ordinate categories may be early acquired in infants (Behl-Chadha, 1996) and tend to be retained in SD (Warrington, 1975; Warrington and Shallice, 1984; Hodges et al., 1995), large amounts of D-features may rigidly support a super-ordinate object representation in long-term memory. However, less super-ordinate classification is predicted to require more specific information collected through accumulated experiences (Mandler and McDonough, 1993, 1998). These features probably include variable properties depending on situations, experiences, and cultures. For example, even when lions and zebras are classified into the mammal class based on shared biological features, they are also plausibly classified into different sub-categories (e.g., “a predator” vs. “a prey”) based on specific features.
We conducted a memory-based feature–object matching verification test, using animals across three classes (mammal, bird, and fish) and verbal features from a previous study (De Deyne et al., 2008). These three classes generally constitute a “super-ordinate” class in the animal domain. However, it should be noted that the terms, “super-ordinate” and “sub-ordinate” level in the present report denote the relative levels in the classification hierarchy. We are interested in comparing how each animal is classified into the three classes (super-ordinate classification level), and how each of the three classes is classified into their sub-classes (sub-ordinate classification level). The sub-ordinate classification level may be a category level higher than the basic category level (e.g., dog and cat in the mammal category), which carries the majority of information and can be most easily accessed from memory (Rosch et al., 1976). The sub-ordinate classification may be related to the distinction between different sets of basic level objects (e.g., “domestic” vs. “wild” animals) in the same super-ordinate category. Such level distinctions may result from a hierarchical conceptual structural organization, which is found upon a non-overlapping or heterogeneous structure of features (Ceulemans and Storms, 2010).
Healthy adult participants in the current study, who were not animal specialists, judged all animal, and verbal feature pairs. Based on participants’ memory-based judgments, similarities between animals were calculated indirectly (Rogers et al., 2004; De Deyne et al., 2008; Dry and Storms, 2009), and animals were clustered via a hierarchical clustering method. Binary classification at each clustering level was used for labeling animal groups, and significant features for classification were specified by a supervised machine learning method: support vector machine (SVM). For each clustering level, classification accuracy (CA) for each feature was used as a distinguishing ability index. Dominant distinguishing response patterns, which were assumed to possess a sigmoid shape (Rogers et al., 2004), were specified through an independent component analysis (ICA). A regression fitting analysis was performed to empirically obtain D-features, with a dominant sigmoid-like or all-or-none response pattern. Based on these analyses, we newly specified sets of salient D-features working at various animal classification levels.
Materials and Methods
Participants
Sixteen healthy adults (10 women and 6 men; age: mean ± SD, 35.5 ± 7.6 years old; education: 17.5 ± 5.3 years) participated in the present study. All were right-handed (Oldfield, 1971) and reported no physical or psychiatric illnesses. According to the Declaration of Helsinki, participants gave written informed consent. The experimental protocol was approved by the Ethics Committee for Human and Animal Research of the National Institute of Information and Communications Technology. The methods were carried out in accordance with the approved guidelines.
Procedures
A series of analyses was performed to specify distinguishing features for classifying animals in different category levels (Figure 1). First, we summarize, in particular, the core of our multiple procedures to specify features with high distinguishing abilities (CA) and an all-or-none response pattern. We first used a binary classification method or SVM to calculate CA by single feature at super-ordinate and sub-ordinate category levels. However, CA revealed by SVM indicates only the quantitative distinguishing abilities (%) of features and does not directly inform us that features with high distinguishing ability actually possess an all-or-none response pattern in category classification. Hence, we subsequently conducted ICA, extracting a dominant, likely sigmoid-shaped response pattern of features. Finally, the sigmoid response pattern was fitted to an observed response of each feature with high distinguishing ability specified in SVM with a univariate linear regression method. Throughout these procedures, we attempted to discover salient distinguishing features with high CA and an all-or-none response pattern to animals.
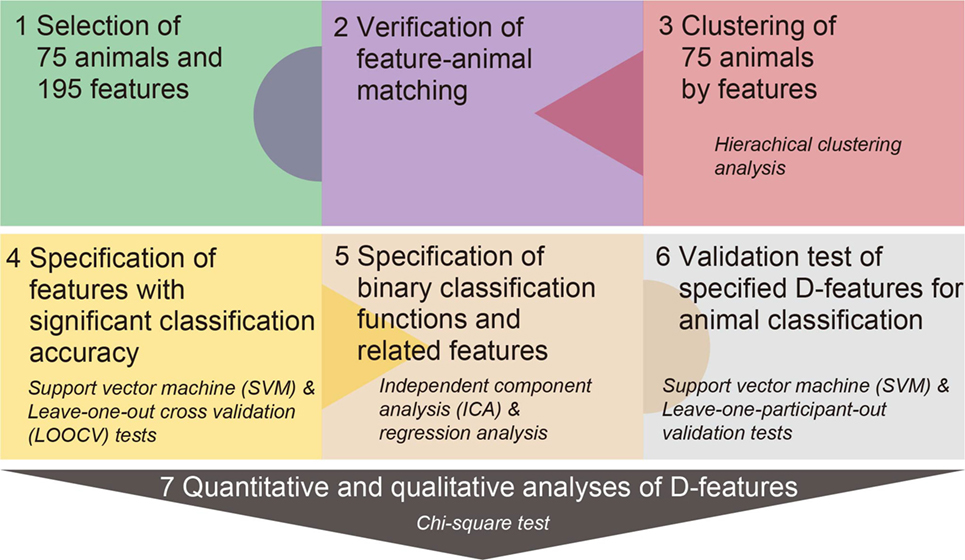
Figure 1. Experimental procedure. The 75 animals across the three classes and 195 features were selected from previous studies (Procedure 1). Participants judged whether animals possessed the given feature via a ternary responses (“Yes,” “No,” or “neither Yes nor No”) (Procedure 2). The 75 animals were clustered by a hierarchical clustering analysis using similarities (Euclidean distances) of Yes/No responses from the feature-animal matching verification test (Procedure 3). Classification accuracy for each feature was calculated using support vector machine (SVM) and leave-one-out cross-validation tests (Procedure 4). Dominant response functions with a sigmoid shape were estimated for each classification level through an independent component analysis and regression analyses of response patterns for features via the ICs (Procedure 5). Validity of a classification model with specified distinguishing/deterministic (D-) features was tested by SVM following the leave-one-participant-out method (Procedure 6). Quantitative and qualitative properties of specified D-features were examined with χ2 tests (Procedure 7). Quantitative analyses compared the numbers of D-features among super-ordinate and sub-ordinate classification levels. Qualitative analyses compared the proportions of biological and cultural/affective features between the two classification levels.
Procedure 1: Selection of Animals and Features
We selected 75 animals from mammal, bird, and fish classes (Table S1 in Supplementary Material) (Procedure 1 from Figure 1). Animal categories have been widely used in previous studies (Ardila et al., 2006). We referred to six studies (Battig and Montague, 1969; Dell’Acqua et al., 2000; Storms, 2001; Yoon et al., 2004; Nishimoto et al., 2005; De Deyne et al., 2008). Almost all of the animals were frequently used across studies and, therefore, were utilized in the present study. Although several animals were rarely used (“bush warbler” and “ibis” in the bird class; “bonito,” “blowfish,” and “flying fish” in the fish class), they were included, because they are popular in Japan. Strictly speaking, the present fish category included a complex, aquatic-living organism, so as to include mollusks (“octopus” and “squid”) and shellfish (“crab” and “shrimp”) (De Deyne et al., 2008).
Two feature-listing studies obtained sets related to living categories (McRae et al., 2005; De Deyne et al., 2008). We utilized the features from De Deyne et al. (2008), which highly overlapped with features in McRae et al. (2005). First, we obtained 738 features associated with mammal, bird, and fish classes [83 animals in De Deyne et al. (2008)] from 764 features related to five animal classes. Second, we calculated the frequency of positive responses from participants in De Deyne et al. (2008) for each feature (maximum value 332 votes: 83 animals × 4 votes), and selected 257 features with a dominance value ≥0.1 (frequency/the maximum frequency of 332) (Garrard et al., 2001). A higher dominance value indicates that features are more strongly memorized in association with certain animals. Third, we excluded the following features: (i) super-ordinate (e.g., “is an animal”), (ii) categorical (e.g., “is a bird” but not “eats fish”), (iii) overlapping meanings (e.g., “lives outdoors” and “lives in the open air”). We also deleted modifying words, so as not to strongly change any meanings (e.g., “mainly” as in “is found mainly in southern countries” but not “fast” as in “reproduces fast”). We divided complex features (e.g., “lives in Africa and India”) into simple features (“lives in Africa” and “lives in India”). Five general features were added (“has skin,” “breathes,” “makes noise,” “runs,” and “gives birth”). This is because these general features were not included, while specific features (e.g., “runs fast”) appeared in the original set. In consequence, we obtained a total of 195 features.
We first specified biological features of animals (Breed and Moore, 2015). Structural (STR) features were related to sensory-perceptual properties, such as body parts (e.g., “has a tail”) and colors (e.g., “is black”). Ecological (ECO) features possessed behavioral and functional properties (e.g., “flies”) under ecospheres. Distributional (DIS) features were associated with geographical (e.g., “lives in Africa”) and ecological (e.g., “lives in water”) circumstances where animals lived. Evolutional (EVO) features were related to development and continuity of species (e.g., “exists for ages”). When more than three authors agreed that animals possessed given properties, features were defined as either of these features. Consequently, 71 STR, 80 ECO, 28 DIS, and 3 EVO features were specified (Table S2 in Supplementary Material).
Second, we specified non- or less biological, cultural, and affective features (Leech, 1974; Brownell et al., 1984; Schmitzer et al., 1997). Cultural (CUL) features were attributes related to human activities (e.g., “is edible”). Certain kinds of CUL features also possessed DIS properties (e.g., “lives on a farm”) or ECO properties (e.g., “carries diseases”). Affective (AFF) features were associated with emotional response (e.g., “is nasty”), emotional assessment (e.g., “is dangerous”), or animal behaviors and characteristics that tended to evoke our emotional responses (e.g., “kills people”). Several AFF features possessed positive or negative emotional assessment properties, and overlapped with STR features (AFF/STR: e.g., “has beautiful feathers”), ECO features (AFF/ECO: e.g., “has a pungent smell”), or CUL features (CUL/AFF: e.g., “is popular and appreciated”). Consequently, 27 CUL and 23 AFF features were obtained (Table S2 in Supplementary Material).
Procedure 2: Feature-Animal Matching Verification Test
Participants performed the feature-animal matching verification test with 14,625 pairs (75 animals × 195 features; Procedure 2 in Figure 1). Participants were instructed to judge the match between animals and features via “Yes/No” or “neither Yes nor No” responses. Participants conducted tests at home over a 2-week period, using customized test sheets (Microsoft Excel). Participants were instructed to select a number (1–75) corresponding to each animal, in order, and successively verify the match between the animal and features. Animal and feature orders were randomized and counterbalanced across participants. Participants were also instructed to report the number of animals they answered, and the specific time of day for completion. Participants were encouraged to answer each question, depending on their own recollection. Test sheets were locked with a password; therefore, participants could not view stimulus content and could not modify their answers after test sheets were closed. Nevertheless, because there were too many trials to complete during several weeks, it is unlikely that all the participants could answer questions under a constant condition, which is a limitation of our long-term, homework study. In fact, two participants made identical responses for all features in one animal, therefore these data were discarded from grand averaging.
Procedure 3: Feature-Based Hierarchical Clustering of Animals
Feature-animal matching verification responses among the 16 participants were averaged for each feature as the pre-process for specification of D-features. This averaging procedure increases signal-to-noise ratios for memory-dependent verification responses by enhancing feature-animal matching responses relatively common to the participants and reduces artifact responses varying across the participants. Salient features, which are rigidly memorized in association with objects across participants, tend to have high average scores (that is, average scores show the greatest score of “1” when all participants make positive responses during the verification test).
To examine the feature-based classifications of animals, we first performed a hierarchical clustering analysis (Procedure 3 in Figure 1), in which most adjacent items or clusters were successively paired until convergence of a single cluster covered all members. Similarities between animals were calculated based on Euclidean distances (d) [dx⋅ y = √Σ(xi − yi)2; i = 1, 2, …, n]. The variables x and y indicate animals, and the variable i represents a feature. Ward or centroid algorithms were used to calculate a cluster distance [CLda⋅b = na × nb/(na + nb) × dCa⋅ Cb; CLda⋅ b = a distance between clusters A and B; na = the number of animals in cluster A; nb = the number of animals in cluster B; dCa⋅ Cb = a distance between centroids of clusters A and B]. These analyses were conducted with the Matlab codes of “linkage” with the parameters of “ward” and “Euclidean” for a clustering method and “dendrogram” for visualization of a clustering structure.
Concerning the validity of a feature-based categorization in a hierarchical clustering manner, however, we should refer to category classification based on direct similarity judgment between objects. Previous studies based on the multi-dimensional scaling (MDS) method with direct similarity judgment data attempted to reconstruct a categorical structure into a low-dimensional space (Rumelhart and Abrahamson, 1973; Caramazz et al., 1976). In these previous studies, the MDS could work well to obtain a holistic view of relationships between objects, but was dependent on the direct similarity rating between objects. However, the MDS is not limited to direct similarity data, and the direct similarity approach may be inadequate because of no information regarding the relation between objects and features (Popper and Heymann, 1996). In relatively recent times, a pioneering modification of the reconstruction method has been proposed (De Deyne et al., 2008; Dry and Storms, 2009): Similarity data between objects are indirectly derived from outputs in a feature-by-object applicability judgment test, as used in our study. These studies did not use priori-collected feature sets, but used empirically derived feature sets; further, they indicated that feature-based similarity data more precisely reconstructed a categorical structure (Dry and Storms, 2009). Another feature-based study also reveals that a feature-based hierarchical model is effective for representing a conceptual structure (Ceulemans and Storms, 2010). Ceulemans and Storms (2010) introduce the concept of a “bundle” or an overlapping cluster and represent a conceptual structure by correspondence between an exemplar and a feature bundle: for instance, an animal exemplar bundle includes a “whale” and a “zebra” and is related to the feature bundle that includes overlapping features, such as “has nipples” and “breastfeeds.” Based on these recent methodological developments, therefore, we conducted a feature-based clustering analysis to obtain the categorical classification of animals.
Procedure 4: Specification of Classification Abilities of Features
Second, we used a supervised machine learning, SVM, for pattern recognition in order to examine binary classification abilities for each feature at each clustering level (Procedure 4 in Figure 1). SVM reveals training samples (support vectors) in each group that best distinguishes the two groups and specifies a classifier (Cristianini and Shawe-Taylor, 2000). Response data were not scaled, since distributional differences among verification responses may represent the saliency of D-features. A radial basis function was used for training. We specified an SVM model for each hierarchical classification (Lajnef et al., 2015), using a single feature, and performed leave-one-out cross-validation (LOOCV) tests to calculate CA (0–1) as the distinguishing ability index. The LOOCV test is the validation procedure of a classification model: all samples (e.g., animals in the present study), except for one, are used to build a classification model and the model estimates a class or label of the excluded sample. We subsequently performed permutation LOOCV tests (1,000 re-labels of the animals) and specified statistical thresholds of significant LOOCV scores for each classification level (scores over 95% boundaries; p < 0.05). The classification and LOOCV analyses were conducted using original and customized SVM-RFE codes (Guyon et al., 2002) for R ver. 3.0.2 (The R Foundation for Statistical Computing).
Procedure 5: Specification of Features with a Binary Classification Function (BCF)
Third, using significant features from permutation tests and an ICA with the FastICA algorithm (http://research.ics.aalto.fi/ica/software.shtml) (Hyvarinen and Oja, 2000), we estimated a major response pattern with a salient distinguishing property for each clustering level (Procedure 5 in Figure 1). ICA is a blind source separation method in which mixed signals are separated into statistically independent components, with an upper limit amount of collected data. The present study extracted a unique component with the highest eigenvalue (EV) for each clustering level.
Each ICA component was fitted by a sigmoid function to obtain a BCF. Sigmoid fitting was performed with the Matlab code of “nlinfit,” which was implemented in the “sigm_fit” package: https://jp.mathworks.com/matlabcentral/fileexchange/42641-sigm-fit. This function fitted an observed data (x) to a sigmoid function (y) with the four initial parameters [y = parameter1 + (parameter2 − parameter1)/(1 + 10((parameter3 − x) × parameter4))]. A response pattern (x) for each feature was linearly regressed through an obtained binary classification or sigmoid function (y), and features with significant regression coefficients (βs) were specified based on the criterion of α levels corrected by numbers of features.
Procedure 6: Validation of Specified Distinguishing Features for Animal Classifications at Super-Ordinate and Sub-Ordinate Category Levels
Fourth, to examine the validity of specified features for animal classification, we conducted SVM at each classification level (Procedure 6 in Figure 1). First, we separated the training data set for producing an SVM model and the testing data set for examining the validity of the classification model following the leave-one-participant-out method: that is, 15 participants’ data were used to produce an SVM model, and the remaining one participant’s data were used for a model validation test. Second, training data were averaged across the 15 participants and a mean feature-animal data matrix was obtained. Third, numbers of classified animals and specified features were extracted at each level and were trained for producing an SVM model for animal classification. Training and testing data were not scaled, and a radial basis function was used for training. Finally, an obtained SVM model was applied to the remaining participant’s testing data to examine the model validity. Because judgment data from the 16 participants were collected, validation tests were repeated 16 times at each classification level. Classification errors were calculated by checking estimated class labels against actual labels, which were obtained by clustering analyses in Procedure 3.
Procedure 7: Distribution of Distinguishing Feature Types at Super-Ordinate and Sub-Ordinate Category Levels
Finally, statistical tests were performed to examine distributional differences of feature types among the four classifications, including super-ordinate (between three animal classes) and sub-ordinate (within each class) categories (Procedure 7 in Figure 1). The numbers of features at observed clustering levels for each category were summed for the analyses.
We first calculated the number of significant features surviving both the classification and fitting analyses for each category (super-ordinate, mammal, bird, and fish). A χ2 test was conducted to examine differences in the number of significant features. Second, to examine distributional differences of biological (STR, ECO, DIS, and EVO) and cultural/affective features between the super-ordinate and sub-ordinate levels, a χ2 test was conducted using two factors (classification level × feature type). Statistical tests were conducted by R ver. 3.0.2.
Results
Animal Classification Properties by Distinguishing Features
The 75 animals from the mammal, bird, and fish categories, and 195 features were used in the memory-based feature-animal matching verification test. The features included the four biological feature types of living organisms (STR, ECO, DIS, and EVO), and the two non- or less biological feature types (CUL and AFF). Participants, based on their knowledge, judged whether animals possessed the given feature via a ternary responses (“Yes,” “No,” or “neither Yes nor No”). The responses of all 16 participants were summarized in Table S2 in Supplementary Material. The animals were hierarchically clustered using similarities (Euclidean distances) of these summarized response data.
As in previous studies (Garrard et al., 2001; Rogers et al., 2004), terrestrial and aquatic categories were separated first (the first clustering level: CL1), and mammal and bird classes were subsequently distinguished (the second clustering level: CL2), as observed from the dendrogram in Figure 2. Classification analyses (SVM with LOOCV tests) revealed that 117 and 149 features significantly contributed to CL1 and CL2, respectively [permutation LOOCV tests: CL1, CA > 0.667, p ≈ 0.0 (<0.05/2, corrected); CL2: CA > 0.5, p ≈ 0.0 (<0.05/2, corrected)]. ICAs estimated dominant response patterns for the features from CL1 [EV = 20.29; contribution ratio (CR) = 48.2%] and CL2 (EV = 15.61; CR = 39.1%). As observed in Figures 2A,B, both patterns were significantly fitted by sigmoid BCFs [CL1: y = −0.467 + 1.31/(1 + 10((50.6 − x) × 1.9)); β = 0.983, p < 0.0001 (<0.05/2, corrected); CL2: y = −0.693 + 1.336/(1 + 10((25.9 − x) × 6.3)); β = 0.952, p < 0.0001 (<0.05/2, corrected)]. Finally, 96 and 54 features were significantly regressed through BCFs for CL1 (|β| > 0.401, p < 0.05/117, corrected) and CL2 (|β| > 0.490, p < 0.05/149, corrected), respectively (Tables S3 and S4 in Supplementary Material for CL1 and CL2, respectively). That is, features with higher positive regression coefficients (β) tend to possess stronger sigmoid BCFs obtained by the ICAs.
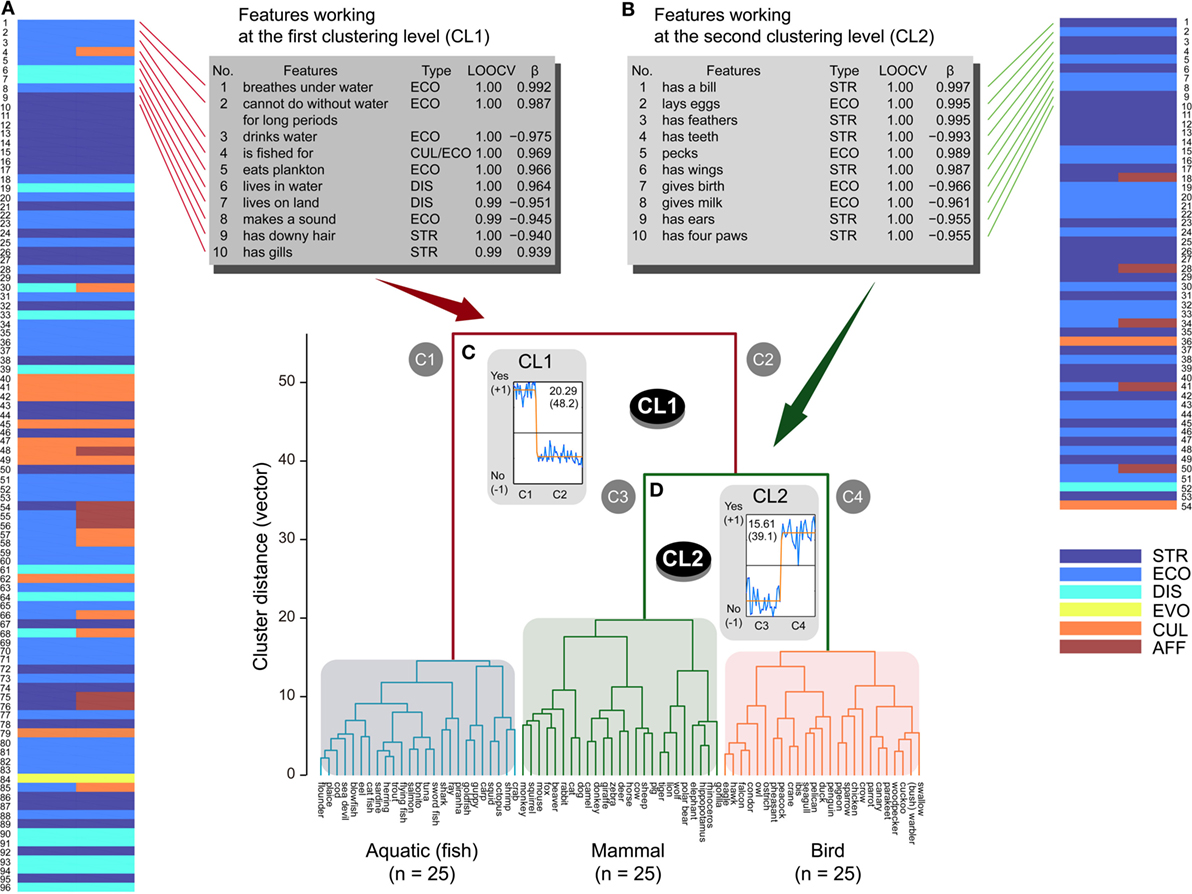
Figure 2. Super-ordinate animal classification (n = 75) in the three super-ordinate classes and related features ranked within the top 10. The 75 animals were clustered into the two clusters related to aquatic (C1) and terrestrial (C2) categories at the first clustering level (CL1). The terrestrial cluster was separated into two clusters belonging to the mammal (C3) and bird (C4) classes at the second clustering level (CL2). Distinguishing features ranked within the top 10 are listed for CL1 and CL2 (STR, structural; ECO, ecological; DIS, distributional; EVO, evolutional; CUL, cultural; AFF, affective) from significant features represented by colored brick charts. These features possessed high-classification accuracies during the leave-one-out cross-validation (LOOCV) tests and good fitting properties (β) to sigmoid shape functions for CL1 (A) and CL2 (B), respectively. Higher scores on the LOOCVs indicate higher classification accuracy, and more positive and larger β coefficients represent better fitting properties.
The mammal class possessed two clustering levels, as observed from the dendrogram in Figure 3. Classification analyses demonstrated that 65 and 114 features contributed to CL1 and CL2, respectively [CL1: CA > 0.68, p ≈ 0.0 (<0.05/2, corrected); CL2: CA > 0.529, p ≈ 0.0 (<0.05/2, corrected)]. Dominant response patterns of these features were fitted by sigmoid BCFs (CL1: EV = 6.83, CR = 37.6%; CL2: EV = 9.41, CR = 39.8%) [CL1: y = −0.784 + 1.206/(1 + 10((17.1 − x) × −7.3)); β = 0.915, p < 0.0001 (<0.05/2, corrected); CL2: y = −0.786 + 1.197/(1 + 10((9.9 − x) × 7.2)); β = 0.952, p < 0.0001 (<0.05/2, corrected)] (Figures 3A,B). 18 and 17 features were significantly regressed through BCFs for CL1 (|β| > 0.651, p < 0.05/65, corrected) and CL2 (|β| > 0.763, p < 0.05/114, corrected), respectively (Tables S5 and S6 in Supplementary Material for CL1 and CL2, respectively).
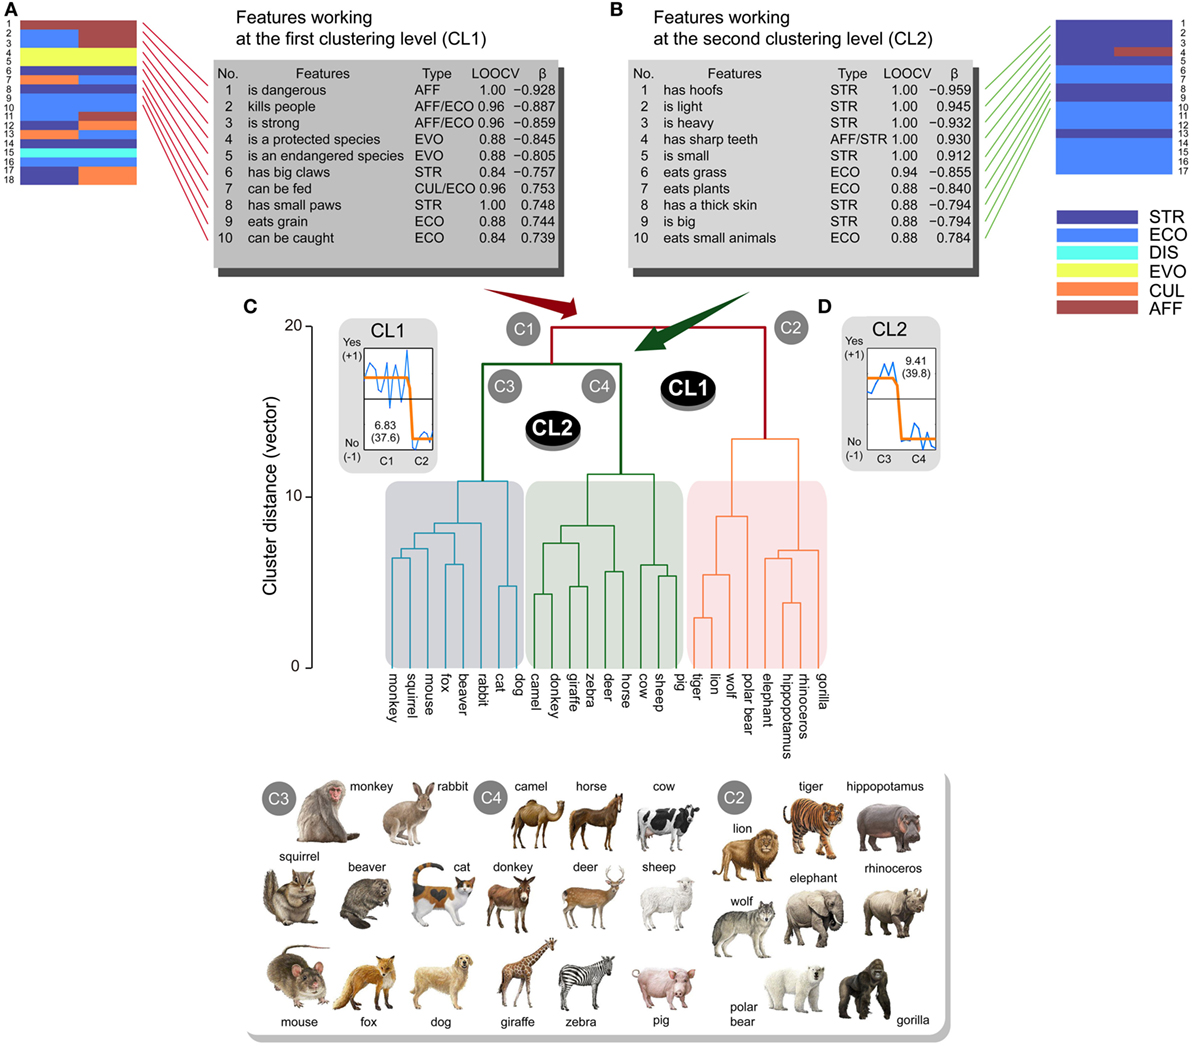
Figure 3. Sub-ordinate animal classification (n = 25) for the mammal class and related features ranked within the top 10. Animals were separated into two clusters (C1, C2) at the first clustering level (CL1). The first cluster (C1) was separated into two clusters (C3, C4) at the second clustering level (CL2). Features ranked within the top 10 are listed for CL1 (A) and CL2 (B) (STR, structural; ECO, ecological; DIS, distributional; EVO, evolutional; CUL, cultural; AFF, affective) from significant features represented by colored brick charts. These features possessed high classification accuracies in leave-one-out cross-validation (LOOCV) tests and good fitting properties (β) to sigmoid shape functions for CL1 (C) and CL2 (D), respectively. Higher scores on the LOOCVs indicate higher classification accuracy, and more positive and larger β coefficients represent better fitting properties. All the illustrations of animals are copyrighted by M/Y/D/S Graphics (Yokohama, Japan), which permitted us to reproduce all illustrations in the manuscript.
For the bird class, two CLs were mainly observed (Figure 4). Classification analyses showed that 88 and 71 features contributed to CL1 and CL2, respectively [CL1: CA > 0.56, p ≈ 0.0 (<0.05/2, corrected); CL2: CA > 0.571, p ≈ 0.0 (<0.05/2, corrected)]. Dominant response patterns were significantly fitted by sigmoid BCFs (CL1: EV = 5.82, CR = 32.0%; CL2: EV = 6.95, CR = 52.8%) [CL1: y = −0.58 + 0.91/(1 + 10((11.96 − x) × 6.89)); β = 0.852, p < 0.0001 (<0.05/2, corrected); CL2: y = 0.64−1.28/(1 + 10((7.0 − x) × −8.5)); β = 0.934, p < 0.0001 (<0.05/2, corrected)] (Figures 4A,B). The 17 and 27 features possessed significant βs for BCFs in CL1 (|β| > 0.543, p < 0.05/88, corrected) and CL2 (|β| > 0.697, p < 0.05/71, corrected), respectively (Tables S7 and S8 in Supplementary Material for CL1 and CL2, respectively).
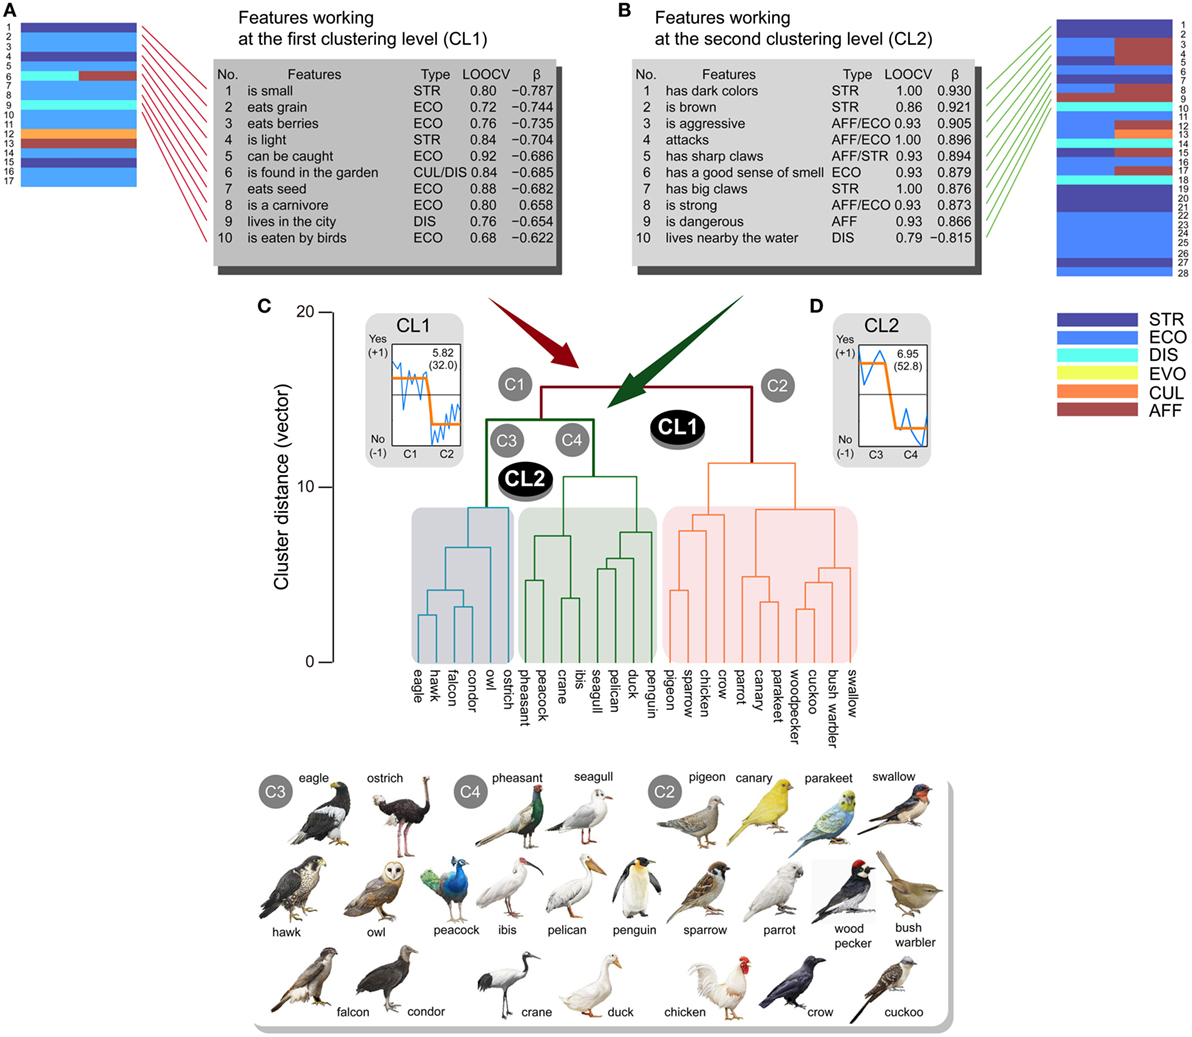
Figure 4. Sub-ordinate animal classification (n = 25) for the bird class and related features ranked within the top 10. Animals were separated into two major clusters (C1, C2) at the first clustering level (CL1). The first cluster (C1) was separated into two clusters (C3, C4) at the second clustering level (CL2). Features ranked within the top 10 are listed for CL1 (A) and CL2 (B) (STR, structural; ECO, ecological; DIS, distributional; EVO, evolutional; CUL, cultural; AFF, affective) from significant features plotted by brick charts. These features possessed high classification accuracies in leave-one-out cross-validation (LOOCV) tests and good fitting properties (β) to sigmoid-shaped binary responses for CL1 (C) and CL2 (D), respectively. Higher scores on the LOOCVs indicate higher classification accuracy, and more positive and larger β coefficients represent better fitting properties. All the illustrations of animals are copyrighted by M/Y/D/S Graphics (Yokohama, Japan), which permitted us to reproduce all illustrations in the manuscript.
Concerning the fish class, two major CLs were also observed and were then introduced into the analyses (Figure 5). Classification analyses demonstrated that 49 and 21 features significantly contributed to CL1 and CL2, respectively [CL1: CA > 0.72, p ≈ 0.0 (<0.05/2, corrected); CL2: CA > 0.833, p ≈ 0.0 (<0.05/2, corrected)]. Dominant response patterns were fitted by sigmoid BCFs (CL1: EV = 3.42, CR = 36.3%; CL2: EV = 2.45, CR = 69.3%) [CL1: y = 0.18−0.98/(1 + 10((7.4 − x) × −36)); β = 0.866, p < 0.0001 (<0.05/2, corrected); CL2: y = 0.348−1.10/(1 + 10((3.6 − x) × 44.6)); β = 0.889, p < 0.0001 (<0.05/2, corrected)] (Figures 5A,B). The 16 and 9 features with significant βs from BCFs were obtained for CL1 (|β| > 0.636, p < 0.05/49, corrected) and CL2 (|β| > 0.745, p < 0.05/21, corrected), respectively (Tables S9 and S10 in Supplementary Material for CL1 and CL2, respectively).
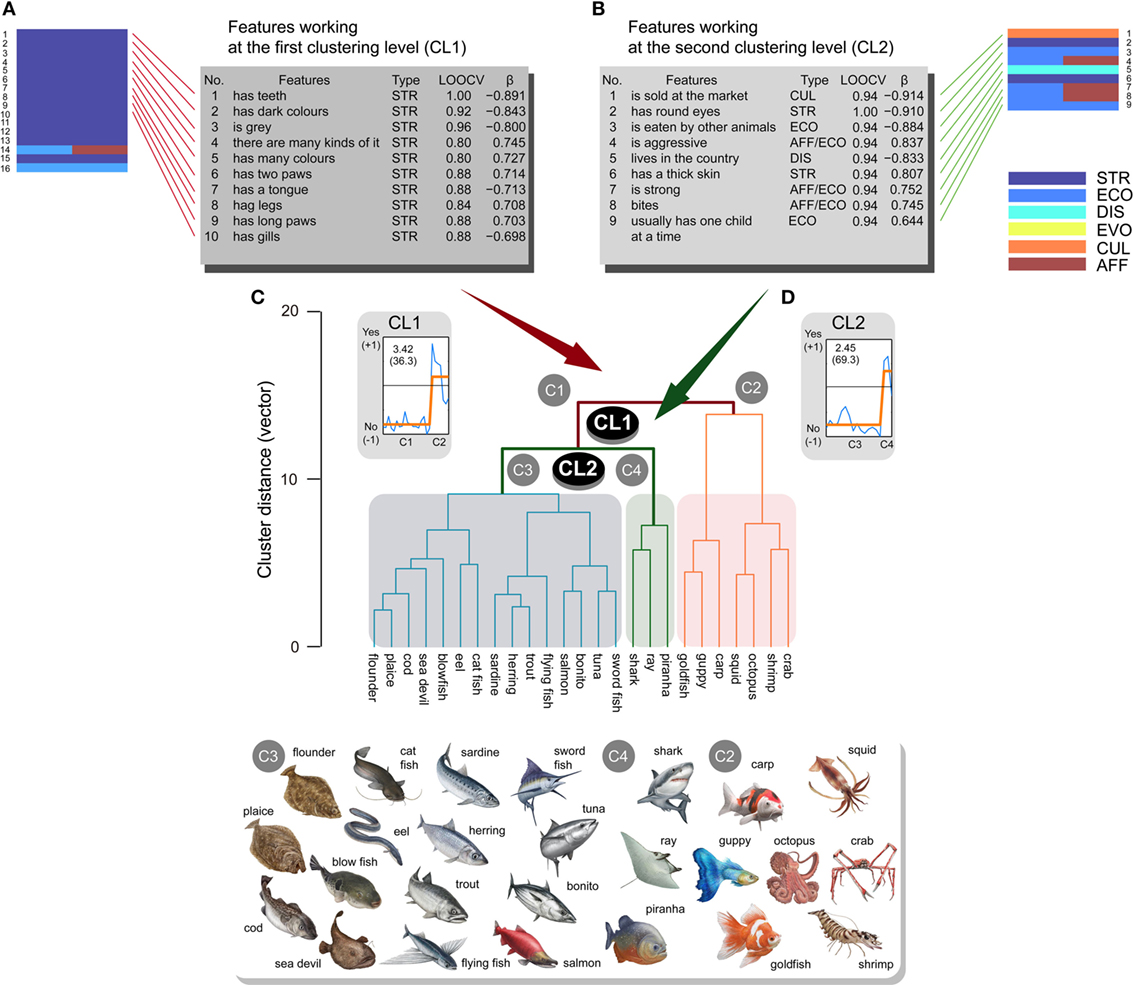
Figure 5. Sub-ordinate animal classification (n = 25) for the complex fish class and related features ranked within the top 10. Animals were separated into two major clusters (C1, C2) at the first clustering level (CL1). The first cluster (C1) was separated into two clusters (C3, C4) at the second clustering level (CL2). Features ranked within the top 10 are listed for CL1 (A) and CL2 (B) (STR, structural; ECO, ecological; DIS, distributional; EVO, evolutional; CUL, cultural; AFF, affective) from significant features represented by brick charts. These features possessed high classification accuracies in leave-one-out cross-validation (LOOCV) tests and good fitting properties (β) to sigmoid-shaped binary response functions for CL1 (C) and CL2 (D), respectively. Higher scores on the LOOCVs indicate higher classification accuracy, and more positive and larger β coefficients represent better fitting properties. All the illustrations of animals are copyrighted by M/Y/D/S Graphics (Yokohama, Japan), which permitted us to reproduce all illustrations in the manuscript.
To examine the validity of specified features for animal classifications at each classification level, we conducted SVM 16 times following the leave-one-participant-out method, in which 15 participants’ data were averaged and the remaining participant’s data were used for training and testing the data set, respectively. Table 1 summarizes mean classification accuracies across the 16 validation tests. Each level yields high classification accuracies over 80%, which indicates that specified features effectively function to classify animals at each classification level.
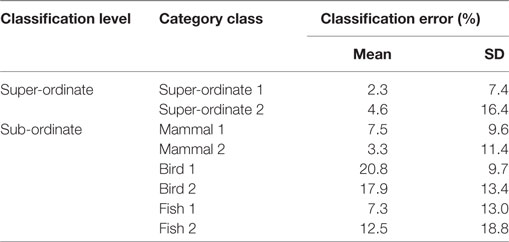
Table 1. Leave-one-participant-out cross-validation test results of specified features for animal classifications.
Comparing the Number of Distinguishing Features between Super-Ordinate and Sub-Ordinate Category Levels
To examine distributional differences among the four category classes (super-ordinate, mammal, bird, and fish), two statistical tests, which were described in the methodological section, were conducted using the total number of significant features (CL1 + CL2). The numbers of features were first compared among the four classes using a χ2 test. The total numbers of features were significantly different [ = 158.726, p < 0.0001] (Table 2; Figure 6A). Since the super-ordinate class was obviously different from the three sub-ordinate classes, only the sub-ordinate classes were included in a follow-up test. The three sub-ordinate classes did not yield significant differences [ = 5.714, p = 0.057]. These results demonstrate that the super-ordinate class included more D-features than the sub-ordinate classes.
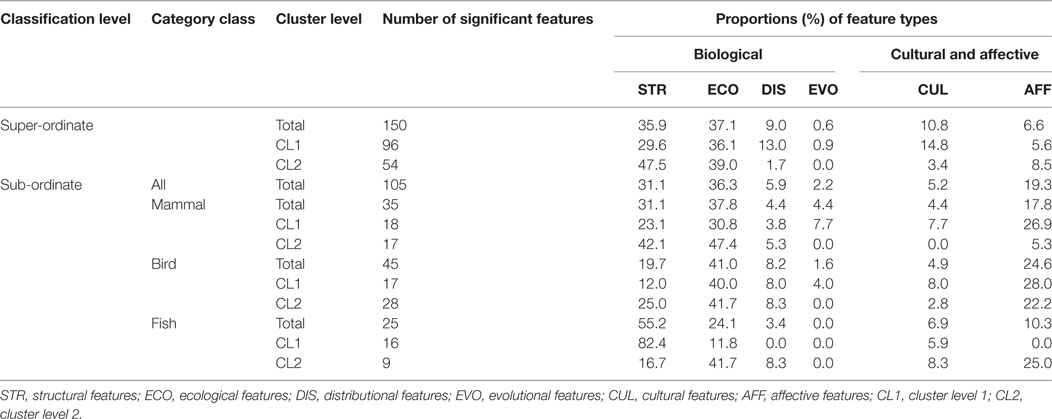
Table 2. Number of significant features and ratios of the six feature types for super-ordinate and sub-ordinate category classes.
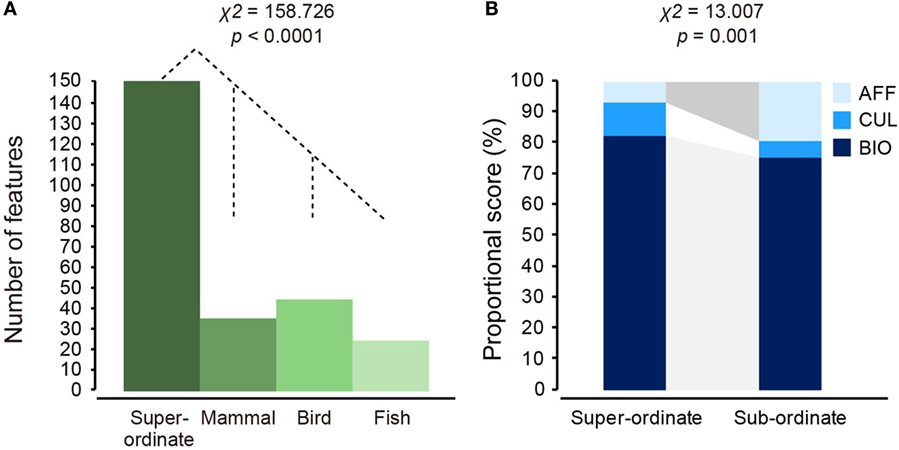
Figure 6. Quantitative and qualitative examinations of features that fit significantly to sigmoid-shaped binary response functions for the super-ordinate and sub-ordinate classifications. Number of features in the super-ordinate and three sub-ordinate categories were compared with a χ2 test (A). The super-ordinate category was related to a larger number of features than the sub-ordinate (mammal, bird, and fish) classes. Ratios of biological (STR, structural; ECO, ecological; DIS, distributional; EVO, evolutional), cultural, and affective (AFF) features in the super-ordinate (clustering level 1 + 2) and overall sub-ordinate categories were compared. Follow-up χ2 tests using the biological and AFF features demonstrated that the sub-ordinate classes had a higher ratio of the AFF feature than the super-ordinate classes, as represented by the dark gray area (B).
Comparing the Ratios of Biological and Cultural/Affective Features between Super-Ordinate and Sub-Ordinate Category Levels
The second test first examined distributional properties of the biological (a total of STR, ECO, DIS, and EVO features) and the cultural/affective (CUL and AFF) feature types for the super-ordinate and three sub-ordinate classes, using the number of total features (CL1 + CL2) (Table 2). The super-ordinate class possessed 138 biological (82.6%) and 29 cultural/affective (17.4%) features. The overall sub-ordinate class included 102 biological (75.5%) and 33 CUL and AFF (24.5%) features. An overall χ2 test using the two factors of feature type (biological, CUL, and AFF) and classification level (super-ordinate and sub-ordinate) yielded a significant effect [ = 13.077, p = 0.001]. Descriptively, AFF features more frequently occurred in the sub-ordinate classes (19.3%) than the super-ordinate classes (6.6%), while the biological features similarly occurred in both the classification levels (Table 2). These observations were confirmed by odd ratio (OR) results: AFF features more frequently occurred in the sub-ordinate levels than in the super-ordinate levels [OR = 3.198, 95% confidence interval (95% CI): 1.511–6.771] (Figure 6B). However, CUL features non-significantly differently occurred between the sub-ordinate and super-ordinate levels, because the 95% CI crossed the OR of 1 (OR = 0.526, 95% CI: 0.212–1.307). These results demonstrate that super-ordinate classification was supported by higher ratios of biological features and, in turn, lower ratios of the AFF features than the sub-ordinate classes.
Discussion
The present study recruited healthy adults with an ordinary knowledge of animals, conducted a feature-animal matching verification test, and examined feature-based classifications of 75 animals belonging to three classes (mammal, bird, and fish). We obtained 195 features from a previous feature-listing study, which were categorized into two feature types: biological features (e.g., “has wings” and “swims”) and cultural/affective features (e.g., “is edible” and “is strong”). We hypothesized that objective biological features with an all-or-none response pattern dominantly function to distinguish at a super-ordinate classification level (e.g., aquatic and terrestrial classes). This hypothesis was based on developmental and neurological findings that such distinguishing features tend to be acquired during early developmental stages, and patients with SD can retain super-ordinate classifications that are supported by such distinguishing features. However, we also predicted that specific features might function more dominantly within sub-ordinate when compared with super-ordinate classification levels; this is because a sub-ordinate classification requires specific object information, which is obtained through accumulated experiences.
To examine these hypotheses, we used a supervised machine learning method (i.e., SVM), and we trained sample feature data for each classification level obtained by a hierarchical clustering analysis. Consistent with our intuition, animals were first clustered into aquatic and terrestrial super-ordinate classes, which were further separated into mammal and bird classes. The super-ordinate classes were more dominantly related to biological features (82.6%) than cultural/affective features (17.4%). At sub-ordinate classification levels within each super-ordinate category, two major clustering levels were also observed. Although the sub-ordinate classes were also dominantly related to biological features (75.5%), the proportion of the AFF features in the sub-ordinate classes was larger than that in the super-ordinate classes.
The number of significant features for the super-ordinate classifications (150 features) was larger than for the sub-ordinate classifications (mammal: 35 features; bird: 45 features; fish: 25 features). In other words, the super-ordinate classification was rigidly supported by features with high-classification abilities, reflecting a sigmoid-shape response. These findings may be related to developmental and neurological observations regarding category representation. D-features with an all-or-none response pattern emerge during early developmental stages (Mandler and McDonough, 1993, 1998) and are effective for patients with SD in order to establish super-ordinate classifications (Warrington, 1975; Warrington and Shallice, 1984; Hodges et al., 1995). A D-feature for categorical classification has a deterministic property, which defines and separates categories; even 6-year old children can attend to D-features, similar to adults (Deng and Sloutsky, 2015). This may come from the epistemological property of a D-feature, whereby the object possesses prominent, sensori-perceptual properties, especially within super-ordinate classification levels (Behl-Chadha, 1996).
On the other hand, we should be careful with interpreting smaller quantitative properties among significant features for the sub-ordinate levels. As elucidated in our hierarchical clustering analysis, sub-ordinate classifications were established based on the super-ordinate classification. In fact, when all 75 animals were classified solely based on, for instance, 18 features for the first mammal clustering level (Table S5 in Supplementary Material), mammal and bird categories were not clearly separated (as observed in Figure S1 in Supplementary Material), while the fish class was clearly distinguished from the other categories. Hence, fewer significant features for sub-ordinate levels demonstrate a supplementary property whereby additional features are required for more specific classifications inside the sub-ordinate categories. From here, there is no absolute decrease in the number of features within the sub-ordinate categories, independent of the super-ordinate levels.
The super-ordinate classification was more strongly supported by structural and ecological features than was the sub-ordinate classification. Conversely, the sub-ordinate classification was also dominantly supported by structural and ecological features (67.4%) but was more strongly related to affective features (19.3%) than was the super-ordinate classification (6.6%). The present findings may provide useful information regarding the constructive properties of category representations. Structural and ecological features are those that represent sensori-perceptual or behavioral characteristics observed objectively, and likely possess a core component of a D-feature for animal classification. This component can be effectively attended to for category definition (Deng and Sloutsky, 2015). The epistemological saliency of structural and ecological features is likely related to a basic cognitive and neural foundation for category representation. Natural or artificial objects within an external world are not uniformly correlated with each other at a similar probability; we extract non-uniform correlation patterns among objects elementarily based on objective distinguishing features, and establish a corresponding mental representation of objects (Sloutsky, 2003).
Affective features more contributed to forming sub-structural details within category representations. Affective features are related to psychological responses or attitudes, which may yield behavioral consequences. Examining significant features for sub-classifications within each mammal, bird, and fish class, emotional or “life-threatening” features (such as “is aggressiveness,” “is strong,” and “is dangerous”) similarly contribute to the sub-classifications (Figures 3–5). Life-support is fundamental for any living being; hence, this characteristic may significantly function for categorical classifications among humans.
Concerning features used in the present study, we should first refer to relative feature properties that were used and significantly contributed to our animal classification. It has been sometimes claimed that empirically collected feature sets tend not to cover features that have low distinguishing ability (such as general features: “is alive” for living categories) (McRae et al., 2005). Hence, empirically derived feature sets may be too biased to instantiate an actual mental object representation (Medin, 1989; McRae et al., 2005). However, the 195 features for the present study, even if collected with bias, could be efficient enough to classify our 75 animals. Therefore, the present feature set may comprise a core portion of the verbal features needed to classify our 75 animals.
Second, the present category levels were relatively high or included basic levels. Although a polar bear (Table S1A in Supplementary Material) may be below the basic category level (a bear), it is a popular animal in our culture, because it “lives in the zoo” (No.158 in Table S2 in Supplementary Material), and may actually function as a basic level category (Rosch et al., 1976). Therefore, the 195 features may be most related to animal classifications at a basic category level. On the other hand, fronting on the requirement to classify exemplars below a basic level category, we would need additional D-features with specific information, as assumed from a classification of, for example, “Chihuahua,” “Maltese,” and “Poodle” for the basic level category of “dog.” Since object mental representations have a dynamic nature whereby sets of feature changes help discriminate objects within different cognitive contexts (Caramazza and Shelton, 1998), D-features may not be fixed but flexibly change with certain classification levels.
Finally, we should refer to feature types. Rogers et al. (2004) argue that category representations possess three layers. The verbal layer consists of four domains: perceptual (structural features in the present study), functional (ecological features), encyclopedic (distributional, evolutional, and cultural features), and name information are verbally represented, respectively. The visual layer represents visual features, related to sensori-perceptual properties. The third layer is an abstract, semantic layer, which is connected to the verbal and visual layers but is dissociated from environments (e.g., the “hub” in a distributed-plus-hub model) (Patterson et al., 2007). This model argues that the verbal and visual layers possess domain-specificity, do not directly interact with each other, but do interact in terms of a domain-general semantic layer. Pearson and Kosslyn (2015) have recently argued that mental representations have at least two format types: propositional and depictive representations. Visual images possess a depictive and pictorial format, which can be represented by neural activation patterns in the primary visual area and be decoded. Such visual depictive representations are related to verbal object representations in order to establish higher cognitive functions. Based on these empirical observations, features represented inside the brain likely possess a format related to verbal and visual features through a medium of, for example, a neural hub (Patterson et al., 2007). Hence, verbally recalled features in the present study may not be an elementary unit of mental representations but rather a product of an interaction between a set of single or multiple mental object representation formats, which should be empirically elucidated.
Conclusion
The present study conducted a feature-animal matching verification test and specified significant features for classifying animal categories. We specified biological and cultural/affective features and elucidated that biological features dominantly function at both super-ordinate and sub-ordinate category levels, while affective features more strongly function at sub-ordinate rather than super-ordinate classifications. Future studies should examine at least two further questions: (i) how conceptualized biological and cultural/affective features are represented in the brain and (ii) how verbal features are recalled through an interaction with visual depictive features.
Ethics Statement
According to the Declaration of Helsinki, participants gave written informed consent. The experimental protocol was approved by the Ethics Committee for Human and Animal Research of the National Institute of Information and Communications Technology (NICT). The methods were carried out in accordance with the approved guidelines.
Author Contributions
All authors planned the study. TS conducted the experiments. TS, AM, and AI analyzed the data. TS wrote the initial version of the manuscript. TS, NF, AM, and AI revised the manuscript. NF and AI supervised the study. All authors reviewed the manuscript and confirmed its final version.
Conflict of Interest Statement
The authors declare that the research was conducted in the absence of any commercial or financial relationships that could be construed as a potential conflict of interest.
Acknowledgments
This work was supported by JSPS KAKENHI Grant Number JP16K01969. We sincerely appreciate the participants from the present study. We are grateful to Yasushi Naruse, Hiroaki Umehara, Qiang Wei, Jyunko Matsubayashi, Takanori Mimura, Takashi Shinozaki, Takeshi Nogai, NICT, Tomoe Hayakawa, NICT and Teikyo University, and Michiko Bando, Shiga University, for their valuable comments and helps. We are also thankful to the copyright holder of the animal illustrations (M/Y/D/S Graphics, Yokohama, Japan), for permitting us to reproduce the illustrations in the manuscript. Finally, we are indebted to the editor and the reviewers for their helpful instructions for our manuscript revision.
Supplementary Material
The Supplementary Material for this article can be found online at https://www.frontiersin.org/article/10.3389/fcomm.2017.00012/full#supplementary-material.
References
Ardila, A., Ostrosky-Solis, F., and Bernal, B. (2006). Cognitive testing toward the future: the example of semantic verbal fluency (animals). Int. J. Psychol. 41, 324–332. doi: 10.1080/00207590500345542
Battig, W. F., and Montague, W. E. (1969). Category norms for verbal items in 56 categories: a replication and extension of the Connecticut category norms. J. Exp. Psychol. Monogr. 80, 1–46. doi:10.1037/h0027577
Behl-Chadha, G. (1996). Basic-level and superordinate-like categorical representations in early infancy. Cognition 60, 105–141. doi:10.1016/0010-0277(96)00706-8
Brownell, H. H., Potter, H. H., Michelow, D., and Gardner, H. (1984). Sensitivity to lexical denotation and connotation in brain-damaged patients: a double dissociation? Brain Lang. 22, 253–265. doi:10.1016/0093-934X(84)90093-2
Caramazz, A., Hersh, H., and Torgerson, W. S. (1976). Subjective structure and operations in semantic memory. J. Verbal Learn. Verbal Behav. 15, 103–117. doi:10.1016/S0022-5371(76)90011-6
Caramazza, A., and Mahon, B. Z. (2003). The organization of conceptual knowledge: the evidence from category-specific semantic deficits. Trends Cogn. Sci. 7, 354–361. doi:10.1016/S1364-6613(03)00159-1
Caramazza, A., and Shelton, J. R. (1998). Domain-specific knowledge systems in the brain the animate-inanimate distinction. J. Cogn. Neurosci. 10, 1–34. doi:10.1162/089892998563752
Ceulemans, E., and Storms, G. (2010). Detecting intra- and inter-categorical structure in semantic concepts using HICLAS. Acta Psychol. 133, 296–304. doi:10.1016/j.actpsy.2009.11.011
Cristianini, N., and Shawe-Taylor, J. (2000). An Introduction to Support Vector Machines and Other Kernel-Based Learning Methods. Cambridge: Cambridge University Press.
Damasio, A. R. (1990). Category-related recognition defects as a clue to the neural substrates of knowledge. Trends Neurosci. 13, 95–98. doi:10.1016/0166-2236(90)90184-C
De Deyne, S., Verheyen, S., Ameel, E., Vanpaemel, W., Dry, M., Voorspoels, W., et al. (2008). Exemplar by feature applicability matrices and other Dutch normative data for semantic concepts. Behav. Res. Methods 40, 1030–1048. doi:10.3758/BRM.40.4.1030
Dell’Acqua, R., Lotto, L., and Job, R. (2000). Naming times and standardized norms for the Italian PD/DPSS set of 266 pictures: direct comparisons with American, English, French, and Spanish published databases. Behav. Res. Methods Instrum. Comput. 32, 588–615. doi:10.3758/BF03200832
Deng, W. S., and Sloutsky, V. M. (2015). The development of categorization: effects of classification and inference training on category representation. Dev. Psychol. 51, 392–405. doi:10.1037/a0038749
Dry, M., and Storms, G. (2009). Similar, but not the same: a comparison of the utility of directly-rated and feature-based similarity measures for generating spatial models of conceptual data. Behav. Res. Methods 41, 889–900. doi:10.3758/BRM.41.3.889
Farah, M. J., and McClelland, J. L. (1991). A computational model of semantic memory impairment: modality specificity and emergent category specificity. J. Exp. Psychol. Gen. 120, 339–357. doi:10.1037/0096-3445.120.4.339
Garrard, P., Lambon Ralph, M. A., Hodges, J. R., and Patterson, K. (2001). Prototypicality, distinctiveness, and intercorrelation: analyses of the semantic attributes of living and nonliving concepts. Cogn. Neuropsychol. 18, 125–174. doi:10.1080/02643290125857
Guyon, I., Weston, J., Barnhill, S., and Vapnik, V. (2002). Gene selection for cancer classification using support vector machines. Mach. Learn. 46, 389–422. doi:10.1023/A:1012487302797
Hodges, J. R., Graham, N., and Patterson, K. (1995). Charting the progression in semantic dementia: implications for the organisation of semantic memory. Memory 3, 463–495. doi:10.1080/09658219508253161
Hyvarinen, A., and Oja, E. (2000). Independent component analysis: algorithms and applications. Neural Netw. 13, 411–430. doi:10.1016/S0893-6080(00)00026-5
Lajnef, T., Chaibi, S., Ruby, P., Aguera, P. E., Eichenlaub, J. B., Samet, M., et al. (2015). Learning machines and sleeping brains: automatic sleep stage classification using decision-tree multi-class support vector machines. J. Neurosci. Methods 250, 94–105. doi:10.1016/j.jneumeth.2015.01.022
Mandler, J. M., and McDonough, L. (1993). Concept formation in infancy. Cogn. Dev. 8, 291–318. doi:10.1016/S0885-2014(93)80003-C
Mandler, J. M., and McDonough, L. (1998). Studies in inductive inference in infancy. Cogn. Psychol. 37, 60–96. doi:10.1006/cogp.1998.0691
McRae, K., Cree, G. S., Seidenberg, M. S., and McNorgan, C. (2005). Semantic feature production norms for a large set of living and nonliving things. Behav. Res. Methods 37, 547–559. doi:10.3758/BF03192726
McRae, K., Cree, G. S., Westmacott, R., and de Sa, V. R. (1999). Further evidence for feature correlations in semantic memory. Can. J. Exp. Psychol. 53, 360–373. doi:10.1037/h0087323
Mechelli, A., Sartori, G., Orland, P., and Price, C. J. (2006). Semantic relevance explains category effects in medial fusiform gyri. Neuroimage 30, 992–1002. doi:10.1016/j.neuroimage.2005.10.017
Medin, D. L. (1989). Concepts and conceptual structure. Am. Psychol. 44, 1469–1481. doi:10.1037/0003-066X.44.12.1469
Nishimoto, T., Miyawaki, K., Ueda, T., Une, Y., and Takahashi, M. (2005). Japanese normative set of 359 pictures. Behav. Res. Methods 37, 398–416. doi:10.3758/BF03192709
Oldfield, R. C. (1971). The assessment and analysis of handedness: the Edinburgh inventory. Neuropsychologia 9, 97–113. doi:10.1016/0028-3932(71)90067-4
Patterson, K., Nestor, P. J., and Rogers, T. T. (2007). Where do you know what you know—the representation of semantic knowledge in the human brain. Nat. Rev. Neurosci. 8, 976–988. doi:10.1038/nrn2277
Pearson, J., and Kosslyn, S. M. (2015). The heterogeneity of mental representation: ending the imagery debate. Proc. Natl. Acad. Sci. U.S.A. 112, 10089–10092. doi:10.1073/pnas.1504933112
Popper, R., and Heymann, H. (1996). “Analyzing differences among products and panelists by multidimensional scaling,” in Multivariate Analysis of Data in Sensory Science, eds T. Naes and E. Risvik (Amsterdam: Elsevier), 159–184.
Rogers, T. T., Lambon Ralph, M. A., Garrard, P., Bozeat, S., McClelland, J. L., Hodges, J. R., et al. (2004). Structure and deterioration of semantic memory: a neuropsychological and computational investigation. Psychol. Rev. 111, 205–235. doi:10.1037/0033-295X.111.1.205
Rogers, T. T., and McClelland, J. L. (2004). Semantic Cognition: A Parallel Distributed Processing Approach. Cambridge, MA: MIT Press.
Rosch, E. (1978). “Principles of categorization in cognition and categorization,” in Cognition and Categorization, eds E. Rosch and B. B. Llyod (Hillsdate, NJ: Erlbaum), 27–48.
Rosch, E., Mervis, C. B., Gray, W., Johnson, D., and Boyes-Braem, P. (1976). Basic objects in natural categories. Cogn. Psychol. 8, 382–439. doi:10.1016/0010-0285(76)90013-X
Rumelhart, D. E., and Abrahamson, A. A. (1973). Toward a theory of analogical reasoning. Cogn. Psychol. 5, 1–28. doi:10.1016/0010-0285(73)90023-6
Rumelhart, D. E., McClelland, J. L., The PDP Research Group. (1986). Parallel Distributed Processing: Explorations in the Microstructure of Cognition, Vol. 1. Cambridge, MA: MIT Press.
Sartori, G., and Lombardi, L. (2004). Semantic relevance and semantic disorders. J. Cogn. Neurosci. 16, 439–452. doi:10.1162/089892904322926773
Schmitzer, A. B., Strauss, M., and DeMarco, S. (1997). Contextual influences on comprehension of multiple-meaning words by right hemisphere brain-damaged and non-brain damaged adults. Aphasiology 11, 447–460. doi:10.1080/02687039708248483
Sloutsky, V. M. (2003). The role of similarity in the development of categorization. Trends Cogn. Sci. 7, 246–251. doi:10.1016/S1364-6613(03)00109-8
Storms, G. (2001). Flemish category norms for exemplars of 39 categories: a replication of the Battig and Montague (1969) category norms. Psychol. Belg. 41, 145–168.
Tyler, L. K., and Moss, H. E. (2001). Towards a distributed account of concept knowledge. Trends Cogn. Sci. 5, 244–252. doi:10.1016/S1364-6613(00)01651-X
Warrington, E. K. (1975). The selective impairment of semantic memory. Q. J. Exp. Psychol. 27, 635–657. doi:10.1080/14640747508400525
Warrington, E. K., and Shallice, T. (1984). Category specific semantic impairments. Brain 107, 829–854. doi:10.1093/brain/107.3.829
Keywords: category representation, distinguishing feature, long-term memory, classification analysis, support vector machine
Citation: Soshi T, Fujimaki N, Matsumoto A and Ihara AS (2017) Memory-Based Specification of Verbal Features for Classifying Animals into Super-Ordinate and Sub-Ordinate Categories. Front. Commun. 2:12. doi: 10.3389/fcomm.2017.00012
Received: 30 January 2017; Accepted: 12 September 2017;
Published: 26 September 2017
Edited by:
Ping Li, Pennsylvania State University, United StatesReviewed by:
Gert Storms, KU Leuven, BelgiumBenjamin D. Zinszer, University of Rochester, United States
Copyright: © 2017 Soshi, Fujimaki, Matsumoto and Ihara. This is an open-access article distributed under the terms of the Creative Commons Attribution License (CC BY). The use, distribution or reproduction in other forums is permitted, provided the original author(s) or licensor are credited and that the original publication in this journal is cited, in accordance with accepted academic practice. No use, distribution or reproduction is permitted which does not comply with these terms.
*Correspondence: Takahiro Soshi, soshitk1701@nict.go.jp