Understanding sentiment toward racial unrest through temporal and geographic lenses: a multilevel-analysis across metropolitan areas in the United States
 Sanguk Lee
 Myung Sik Cho
 Tai-Quan Peng
- 1Department of Communication Studies, Texas Christian University, Fort Worth, TX, United States
- 2Center for Global Change and Earth Observations, Michigan State University, East Lansing, MI, United States
- 3Department of Communication, Michigan State University, East Lansing, MI, United States
Racial unrest has long been a salient social issue in the United States. Time and space provide essential contexts for the emergence and evolution of racial unrest. However, the relationships between these contextual factors and public responses to racial unrest remain insufficiently explored. This study seeks to fill that gap, blending geocoded, time-stamped racial unrest tweet data with census information. It aims to explore how temporal elements and geographical characteristics of metropolitan areas contribute to the emergence of negative sentiment reactions to racial unrest on social media platforms. The racially charged unrest that transpired in Ferguson, Missouri in 2014 serves as our case study. We select 33 metropolitan regions across the U.S. for our analysis. Our findings indicate that temporal processes, encompassing circadian rhythms, weekday-weekend variations, and temporal decay, correlate with expressions of anxiety and anger, albeit not sadness. Furthermore, our analysis reveals geographical characteristics—notably income inequality and segregation, combined with the number of Black victims—to be associated with manifestations of anxiety.
1 Introduction
Racial issues, epitomized by cases such as Michael Brown to George Floyd, have been extensively deliberated on social media in the US. The 2014 Ferguson, Missouri unrest, for example, began as a localized incident but quickly escalated into a nationwide concern, drawing widespread attention and triggering impassioned public reactions on social media platforms (Ince et al., 2017). As time and geography provide a backdrop for the emergence and evolution of racial unrest, it's reasonable to infer that public responses to these events may correlate with the temporal and spatial parameters in which the unrest materializes. For instance, individuals residing in regions marred by social injustice may exhibit deeper emotional involvement in racial unrest, driven by an intensified longing for fair treatment and social equity. Moreover, heightened expressions of anger might be observed during evening hours, as individuals disengage from their work routines and potentially participate in racial protests.
While temporal and geographical contexts play roles in sparking and shaping racial unrest, previous studies have often separated public responses from these crucial elements, primarily due to a dearth of reliable and valid data. Yet, the growing availability and accessibility of time-stamped, geo-tagged social media data now empower researchers to employ temporal and geographic lenses to empirically examine the genesis and evolution of public responses to racial unrest. Among diverse public responses, sentiment reactions hold particular significance within the context of racial unrest. They offer a snapshot of an individual's attitudinal position on social issues, and can catalyze political behaviors such as protests (Landmann and Rohmann, 2020). As such, capturing and understanding these reactions are paramount in comprehensively analyzing and responding to incidents of racial unrest.
In our investigation of the Ferguson unrest, we intentionally focused on sadness, anxiety, and anger due to their distinct roles in shaping social judgement and socio-political reactions (Keltner et al., 1993; Lambert et al., 2011). Sadness, often linked to retrospective considerations like loss or regret (Shirai and Suzuki, 2017), may reflect public sentiment about the incidents and missed opportunities in the context of Ferguson. Anxiety, associated with concerns about uncontrollable future events (Eysenck et al., 2006), could capture the community's apprehensions about ongoing racial issues. Meanwhile, anger is frequently a response to perceived injustice and can significantly motivate political action (Leach et al., 2006). Although other negative emotions such as fear and shame also play roles in complex emotional responses, our focused analysis on sadness, anxiety, and anger is based on the relative prominence and discernible impact these emotions have in socio-political activism and discourse, which is central to this study's aim of exploring connections between temporal dynamics, geographical characteristics, and specific emotional reactions on social media.
Leveraging a substantial Twitter dataset related to the Ferguson unrest, in conjunction with U.S. census data, this study examines how temporal processes such as circadian rhythms, day type such as weekdays and weekends, and temporal decay, correspond to expressions of sadness, anxiety, and anger in the milieu of racial unrest. Moreover, it scrutinizes the relationships between location-based social factors—including the number of Black victims of police violence, the ratio of the Black population, education level, income inequality, and racial segregation—and these three distinct negative sentiments. Our aim is to shed light on the interplay between various situational elements and public emotional responses in instances of racial unrest.
2 Literature review and research questions
Time and location serve as fundamental cornerstones of human existence, profoundly influencing our behaviors, perceptions, and emotions. For instance, conventional routines such as waking in the morning, engaging in daytime work, and retiring to bed at night illustrate the ways time structures human behavior, which in turn impacts emotions. Similarly, the joy typically experienced at an amusement park, or the sorrow felt at a funeral underscore how physical locales can shape our emotional states. In subsequent sections, we delve into potential temporal and geographical factors that can contextualize sentiment responses to racial unrest, aiming to broaden our understanding of the multi-faceted influences that contribute to public sentiment amid incidents of racial unrest.
2.1 Temporal lens to understand sentiment response related to racial unrest
Three temporal processes that may correlate with sentiment expressions on social media include circadian rhythms, weekday-weekend variation, and temporal decay. Circadian rhythms suggest that sentiment systematically oscillates based on a 24-h cycle, indicating a consistent pattern of emotional ebb and flow within a day (Golder and Macy, 2011). The concept of weekday-weekend variations posits a pattern wherein individuals typically experience heightened positive emotions and diminished negative emotions during weekends as compared to weekdays (Helliwell and Wang, 2014). Temporal decay refers to a phenomenon whereby the intensity of sentiment expression gradually attenuates over time, suggesting the transitory nature of heightened emotional responses (Tsytsarau et al., 2014).
Sentiments exhibit circadian rhythms as the hormone levels in our bodies and the routine of our daily activities, which significantly influence our emotions, follow a systematic pattern (Golder and Macy, 2011). Utilizing large-scale social media data, prior studies have found that sentiments systematically fluctuate throughout the day (Golder and Macy, 2011; Dzogang et al., 2017). Generally, negative sentiment is at its nadir in the morning, gradually escalating throughout the day to peak at night (Golder and Macy, 2011; Dzogang et al., 2017).
The weekday-weekend variation in sentiment has also been documented. Typically, people feel more relaxed and experience less stress during weekends compared to weekdays. For instance, Helliwell and Wang (2014), upon analyzing a US daily poll, found that respondents reported higher levels of happiness, enjoyment, and laughter, and lower levels of anxiety, sadness, and anger on weekends than weekdays. This weekday-weekend variation in sentiment was also detected on social media, where Golder and Macy (2011) observed more positive sentiments expressed during weekends than weekdays in a general context.
However, since both circadian rhythms and weekday-weekend variation in sentiment have been studied primarily in general contexts, it remains uncertain whether sentiments regarding a specific issue, such as racial unrest, would exhibit similar temporal patterns. Hence, this study explores the relationship between these temporal patterns and various sentiment expressions associated with racial unrest, aiming to unearth any potential correlations.
RQ1: What are temporal patterns (i.e., circadian rhythm and weekday-weekend differences) for sadness, anxiety, and anger about racial unrest on social media?
People's interest in trends, along with their emotional reactions to these trends, tend to naturally diminish over time (Tsytsarau et al., 2014). This phenomenon, often referred to as trend decay, occurs as the novelty of the content gradually fades and is supplanted by other, newer content (Wu and Huberman, 2007; Asur et al., 2011). Correspondingly, as interest in a trend wanes, the emotional intensity associated with it also progressively declines. Empirical studies have illustrated that the intensity of sentiment toward events reduces linearly, exponentially, or even at an accelerated rate beyond exponential, paralleling the decreasing rate of social media posts about these events (Tsytsarau et al., 2014). A similar temporal decay of negative sentiments is anticipated concerning racial unrest. People are likely to express intense negative sentiment reactions in response to racial unrest when it initially transpires. However, these intense reactions are expected to gradually attenuate over time as media coverage and public interest veer away from the issue, reflecting the natural course of emotional response to social events.
H1: Sadness, anxiety, and anger toward social unrest on social media will decrease over time.
2.2 Geographic lens to understand sentiment response related to racial unrest
A geographic perspective enables a deeper analysis of the spatial environments influencing the onset and development of racial unrest, thus enriching our understanding of related sentiment reactions. Amidst a myriad of geographic contexts, our attention is drawn to the social attributes of geographic areas, given that racial unrest is a social issue entwined with complex societal dynamics. Specifically, we focus on characteristics such as the number of Black victims of police violence, the ratio of the Black population, education level, income inequality, and racial segregation. These elements serve as crucial markers in understanding the socio-spatial dynamics underpinning public sentiment toward racial unrest.
The number of Black victims of police violence is likely to associate with negative sentiments related to racial unrest. Empirical evidence on racial bias in police violence against minorities is mixed. Some studies report that law enforcement officers tend to use more force with non-white individuals than with their white counterparts (Kahn et al., 2016). Others report no racial disparities in police violence, particularly, extreme use of force against minorities such as Blacks and Hispanics (Fryer, 2019). Despite the controversy, racial bias in police violence against minorities has been broadly reported in news media, and racial minorities are more likely to perceive and report instances of police misconduct directed at them than members of the racial majority (Weitzer and Tuch, 2004; DeVylder et al., 2016). Further amplifying this, empirical evidence suggests that areas with a higher number of Black victims of police violence tend to have a higher likelihood of racial protests (Williamson et al., 2018), and also exhibit amplified negative sentiment reactions on social media (De Choudhury et al., 2016). These observations underscore the significance of geographic context in shaping public sentiment toward racial unrest. People form their negative perceptions and attitudes toward police misconduct not solely through direct interaction with law enforcement, but also through vicarious experiences such as exposure to news reports (Weitzer and Tuch, 2004). Given that residents in areas with a high number of Black victims are likely to be more frequently exposed to such news through local media outlets and considering that police violence was the initial catalyst for the racial unrest in Ferguson, it stands to reason that areas where police violence against Black individuals is more prevalent might exhibit heightened negative sentiment expressions related to racial unrest.
Negative sentiment expressions concerning racial unrest is likely to be interconnected with the racial composition of a population. As instances of racial unrest, such as the Ferguson unrest, predominantly involve the Black community, individuals identifying as Black are likely to be more responsive and vocal about the issue. Drawing from social identity theory, individuals often derive their identities from the social groups that they belong to (Tajfel and Turner, 1979), and existing empirical findings suggest that highly identified individuals tend to act in support of their group when their identities are threatened (Branscombe et al., 1993). Given that race is a salient and inherent social category upon which individuals often base their self-definition (Sellers et al., 1998), racial unrest, which threatens the Black community, could provoke negative responses from Black individuals.
The socioeconomic attributes of geographic areas, such as education level and income inequality, are likely to be linked to negative expressions regarding racial unrest. Despite concerted governmental interventions, disparities between geographic regions with low and high socioeconomic statuses persist, and economically disadvantaged areas often struggle to provide robust public infrastructure and social services (Sharkey, 2012). This paucity of public resources can negatively impact the living conditions and health of local residents. Research indicates that individuals residing in socioeconomically deprived areas are likely to face limited educational opportunities, lower-paying jobs (Galster, 2012), restricted physical activities (Estabrooks et al., 2003), poorer health conditions (Galster, 2012), and consequently, increased mortality (Bosma et al., 2001). This relative disadvantage of residing in a low socioeconomic area also manifests on social media, with evidence suggesting that individuals living in socioeconomically disadvantaged areas are prone to express lower levels of happiness on social media platforms (Mitchell et al., 2013; Nguyen et al., 2016). While direct evidence is sparse in illustrating the connection between socioeconomic characteristics of geographical regions and negative expressions of racial unrest, it's crucial to note that racial unrest falls within a broader range of social issues, like inadequate public investment and social injustice. These are challenges that individuals residing in low socioeconomic areas frequently grapple with. Therefore, it's plausible to surmise that these socioeconomic attributes, including education level and income inequality, could correlate with negative sentiments expressed during periods of racial unrest.
Racial segregation in geographic areas can be associated with negative expressions of racial unrest. Despite extensive efforts to reduce racial discrimination and conflict in the U.S., these deeply-rooted social problems persist, often divided along an invisible color line between minority and majority populations. Racial segregation represents more than just residential boundaries between races. It can exacerbate racial conflict by increasing interracial bias due to reduced interracial contact (Pettigrew and Tropp, 2006). The unequal distribution of social resources between minority and majority populations also contributes to racial conflict. Minorities are often more vulnerable, facing issues such as lack of safety, poorly resourced neighborhoods, unemployment, and a dearth of basic services such as grocery stores and banks (Charles, 2003). Conversely, majority populations can benefit from segregation by distancing themselves from areas of higher crime rates and victimization, while maintaining political stability and promoting reinvestment in white neighborhoods (Beaulieu and Continelli, 2011). In other words, racial segregation is considered a significant social characteristic of geographic areas that exacerbates social inequality between minority and majority populations (Peterson and Krivo, 1993). As such, racial segregation may be associated with negative sentiment expressions related to racial unrest on social media.
Following the above discussion, we pose a research question that investigates the relationship between geographically-based social characteristics and negative sentiment expressions in response to racial unrest on social media:
RQ2: How are the social characteristics of a geographical area—the number of Black victims of police violence, the ratio of the Black population, education level, income inequality, and racial segregation—associated with expressions of sadness, anxiety, and anger related to racial unrest on social media?
Racial segregation persists as a deep-seated aspect of inequality, perpetually fueling societal imbalance (Peterson and Krivo, 1993). The enduring and systematic discrimination directed toward racial minorities has the potential to intensify social tensions and deepen disparities in tandem with other sociodemographic factors. This intricate dynamic frequently results in a noticeable surge in negative sentiment about racial unrest. Against this context, our investigation seeks to unpack the intricate interplay between racial segregation, a variety of social factors, and geographical contexts. In doing so, we aim to illuminate the complex relationship between regional attributes, racial tension, and public sentiment toward racial discord.
RQ3: Does racial segregation in a geographical area moderate the associations between (a) the number of Black victims of police violence (b) the ratio of the Black population, (c) education level, and (d) income equality, and the expressions of sadness, anxiety, and anger related to racial unrest on social media?
3 Methods
3.1 Data collection and structure
Data for this study was compiled from three distinct sources. The first dataset, comprised of Twitter posts, was gathered using Twitter Firehose with the keyword “Ferguson.” For this study, only tweets that included geotagged information, specifically longitude and latitude, were collected. The data includes anonymous user IDs, tweet text, time of tweet, language, and geotagged details within the tweets. The second dataset was sourced from the 2014 U.S. census, providing information on the sociodemographic characteristics of metropolitan regions, excluding data on Black victims. For this particular metric, our third dataset was utilized, obtained from Mapping Police Violence, an organization dedicated to monitoring instances of police violence. This dataset detailed the number of Black victims killed by police from 2013 to 2014, inclusive of demographic information about victims and incident locations (Sinyangwe, 2021).
By leveraging timestamps and geotagged details, a subset of tweets from August 9th (the onset of the Ferguson incident) to September 9th, 2014 was generated for the primary analysis, focusing on 33 metropolitan areas. The U.S. Census Bureau defines metropolitan statistical areas as multi-county conglomerates that consist of a central urban area with a population of over 50,000 and its neighboring communities exhibiting a high level of social and economic integration with this core area (US Census Bureau, 2020). Our selection of the 33 most populous regions on the U.S. mainland, each with a population exceeding 2 million as of 2014, was driven by a dual rationale. First, these areas collectively represent ~45% of the total U.S. population, ensuring a broad representation of the national demographic. Second, the choice of a 2 million population threshold aimed to ensure a sufficient volume of geotagged tweets for robust analysis. Metropolitan areas with smaller populations were excluded due to the potential for lower social media activity, which could compromise the statistical validity of our findings.
Our sampling methodology resulted in a final dataset comprising 5,390,211 tweets from 679,026 unique users. The users' tweet activities in our dataset showed a wide range, from 1 to 15,828 tweets (M = 7.94, SD = 53.71). The median tweet activity was 2, indicating that half of the users tweeted infrequently, while a smaller subset of users contributed a disproportionately larger volume of tweets. This uneven distribution of user activity reflects a common pattern in online environments where a few highly active users often dominate the creation of online content (Muchnik et al., 2013). In the context of discussions on racial unrest, this implies that a small percentage of users might significantly influence the overall discourse on Twitter. Notably, our data revealed that the top 5% of users were responsible for generating 64% of the tweets in the study. The tweets were collated by time segments (public, hybrid, and private), day, and metropolitan area, while the other datasets were aggregated at the metropolitan level before integration with the tweet data. The final dataset constituted 3,168 rows (3 time-segments × 32 days × 33 metropolitan areas).
3.2 Measurements of tweet sentiments
The sentiments of sadness, anxiety, and anger were quantified using the Linguistic Inquiry and Word Count (LIWC) 2015 tool. LIWC was selected because in general it outperforms other dictionary-based methods in categorizing sentiments with accuracy (Lee et al., 2022). Moreover, this dictionary-based sentiment analyzer allows us to measure discrete emotions (Pennebaker et al., 2015), which is a critical component in this study. LIWC calculates individual sentiment scores for each tweet by dividing the number of sentiment-specific words in the text by the total word count. Scores can range from 0 to 100. Considering that a considerable number of tweets received a score of 0, likely because many were informational in nature (Edrington and Lee, 2018), we applied a log-transformation to the scores to reduce skewness. To avoid undefined values during this transformation, particularly when the original score is 0, we first added a constant value of 1 to each original score before proceeding with the log-transformation. Then, the log-transformed sentiment scores were aggregated by time, day, and metropolitan area using mean calculations. Finally, these mean values of the log-transformed sentiment scores were further converted into Z-scores which were then used in the analysis. Figure 1 illustrates the trend of daily averaged, log-transformed emotion scores for each emotion during the month before and after the Ferguson incident.
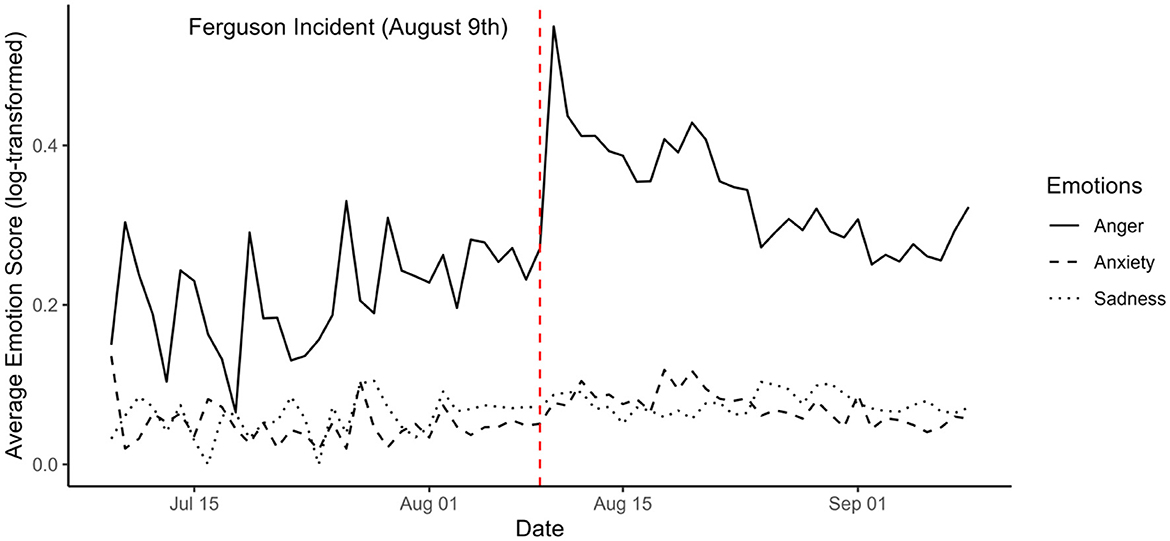
Figure 1. Trend of average emotion scores (log-transformed) during the month before and after the Ferguson incident. Log-transformed emotion scores are averaged daily.
3.3 Measurement of temporal elements
3.3.1 Measurement of temporal components
3.3.1.1 Time segment
This was measured to analyze circadian rhythms of sentiment. The 24-h day was divided into three time-segments: public (8 am−3 pm), hybrid (4 pm−11 pm), and private (12 am−7 am; Peng et al., 2020). Two dummy variables were generated, each using the public time as a reference.
3.3.1.2 Day type
Day type was measured to examine the difference in sentiment between weekdays and weekends. Each timestamp was categorized into a dummy variable, with 0 representing weekdays (from Monday to Friday) and 1 representing weekends (from Saturday to Sunday). Notably, we treated Labor Day as weekdays, given that it falls on a weekday and exhibits a mix of business activities. Importantly, our results remained consistent across models, irrespective of whether Labor day was treated as a weekday or as a weekend. This consistency underscores the robustness of our results, regardless of holiday categorization.
3.3.1.3 Day count
Day count was measured as a continuous variable, representing calendar days from 1 to 32, to examine the temporal decay of sentiment.
3.3.2 Measurement of social characteristics of metropolitan areas
3.3.2.1 Black victim of police violence
Black victim of police violence was measured by counting the number of Black individuals killed by police as a result of being shot, beaten, retained, or other ways of enforcement. Using the location information (e.g., zip code) in the dataset, the number of Black victims of police violence from 2013 to 2014 was aggregated to corresponding metropolitan areas.
3.3.2.2 Ratio of black
Given that the study deals with racial unrest centered around the conflict mainly between Black and white, the ratio of Black is operationalized as the relative population of Black against white. That is, the ratio of Black in a metropolitan area was measured by dividing the population of Black by the population of white in a metropolitan area.
3.3.2.3 Education level
Education level in a metropolitan area was measured by dividing the population holding a bachelor's degree over the total population of a metropolitan area (Drewnowski et al., 2014).
3.3.2.4 Income inequality
Income inequality was assessed using the Gini index, data for which was sourced from the U.S. Census Bureau. The index provides a measure of income disparity within metropolitan areas for the year 2014 (for more detail on the forumla used, refer to Hisnanick and Rogers, 2006). The Gini index values span from 0, suggesting perfect equality, to 1, indicating complete inequality (US Census Bureau, 2016).
3.3.2.5 Racial segregation
Racial segregation was operationalized as the degree of racial groups concentrated in its own enclave. To measure this, we utilized an R package known as “raceland,” developed by Dmowska et al. (2020). This methodology quantifies racial segregation by applying the mutual information algorithm to an exposure matrix derived from high-resolution raster grids encapsulating racial distribution data (see Dmowska et al., 2020 for a comprehensive explanation). The method's fine-grained approach eliminates the need for arbitrary divisions (e.g., census tract, block)—a common drawback of prior racial segregation measurements such as the dissimilarity index (e.g., Duncan and Duncan, 1955).
High-resolution grids for each metropolitan area were sourced online (Dmowska et al., 2017). We upscaled the geographic scale of these high-resolution grids from 30 to 90 m. While this conversion slightly degrades the resolution of the racial distribution data, it was necessary to circumvent issues related to computer memory limitations. The size and shift parameters can be specified to compute racial segregation (i.e., mutual information) at different geographical scales. For the main analysis, we set the size parameter to 60, corresponding to a geographic scale of 5.4 km (60 cells * 90 m), and the shift parameter to 30 (i.e., 2.7 km = 30 cells * 90 m). Using this setting, local racial segregation at the geographical scale of 5.4 km was computed, and then the racial segregation of a metropolitan area was calculated by averaging these multiple local segregation measurements. A higher value indicates a greater degree of segregation, whereas a value of 0 denotes perfect racial homogeneity or harmony. Recognizing that the selection of size and shift parameters in measuring segregation is somewhat arbitrary, the results of multi-level analyses using different geographical scales are included in Supplementary Table 2.
3.3.2.6 Control variables
The volume of tweets can be correlated with various characteristics of an area (e.g., ratio of Black population, education level) and can influence aggregated sentiment scores of tweets. To minimize such potential confounding, we controlled for the number of tweets. Figure 2 displays the trend of the number of tweets for the month before and after the Ferguson Incident. Figure 3 illustrates histograms of the number of black victims, ratio of black, education level, and income inequality of the study areas.
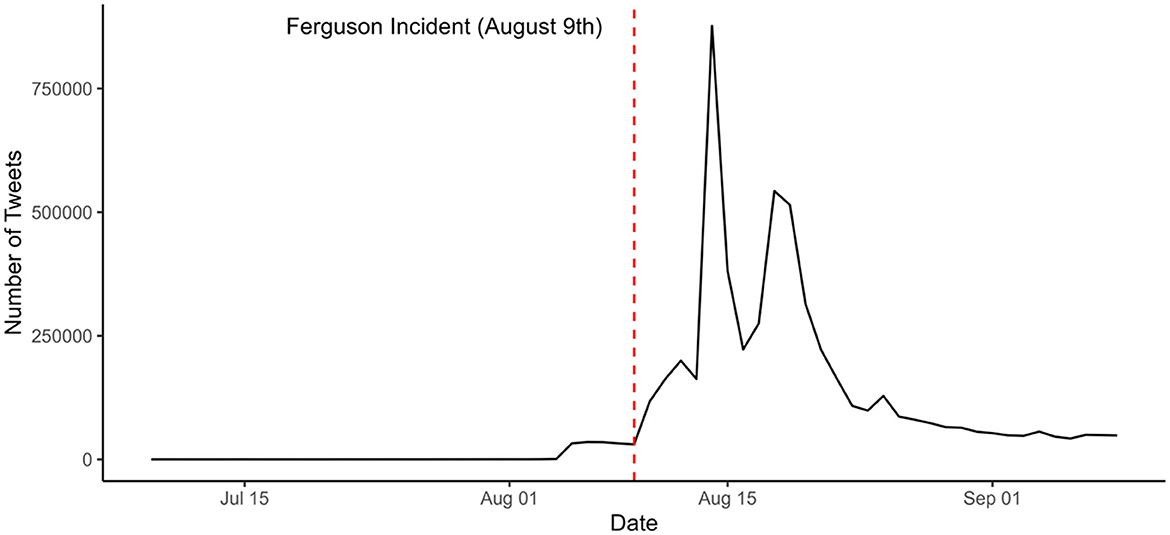
Figure 2. Trend of the number of tweets during the month before and after the Ferguson incident.
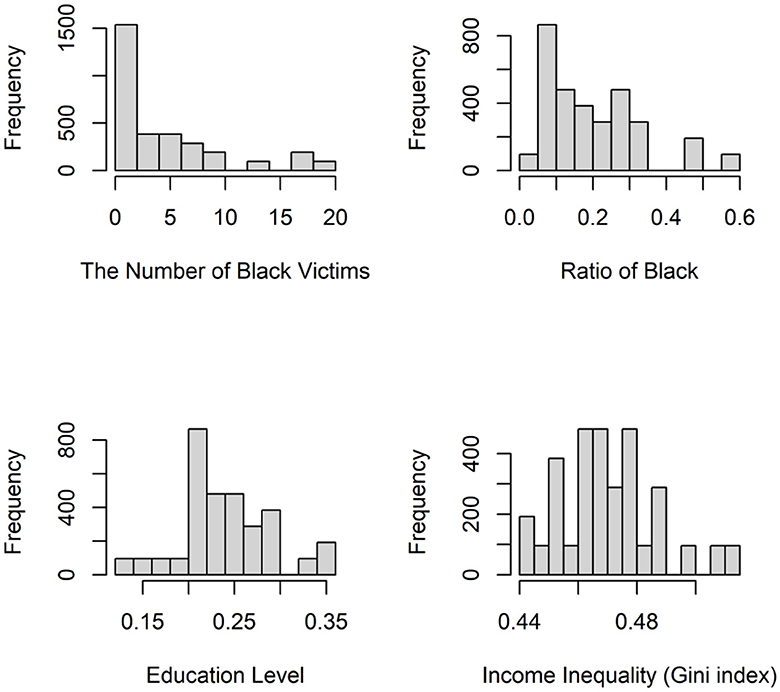
Figure 3. Histograms of the number of black victims, ratio of black, education level, and income inequality.
In order to streamline comparisons, continuous or discrete independent variables (i.e., day count, Black victim count, ratio of Black population, education level, income inequality, and racial segregation) and the control variable (i.e., tweet counts) were standardized via Z-score transformation. These standardized Z-scores were utilized in the main analysis.
3.4 Analytical design
Linear mixed modeling (LMM) was employed to unravel the within-area variations (i.e., temporal functions) and between-area variations (i.e., metropolitan areas) in sentiment responses related to racial unrest on social media. The null model, without considering any factors, was formulated to determine the proportion of total variance in sentiment explained by the geographical structure. The intraclass correlation coefficient (ICC) was 0.01 for sadness, 0.02 for anxiety, and 0.05 for anger. Despite appearing low, these ICC values are significant, given the large cluster size characteristic of this study (i.e., cluster size = 96). Moreover, it is suggested to apply LMM when the design effect exceeds 1.1 (Lai and Kwok, 2015). Design effects for this study are 1.95 for sadness, 2.9 for anxiety, and 5.75 for anger, implying that LMM is an appropriate analysis method for this hierarchical data structure, thereby reducing biased estimation of the level two predictors (Lai and Kwok, 2015). Temporal function variables were introduced first to examine the main effects of temporal processes on sentiment. In the second model, geographical characteristics were incorporated to explore both the main and interaction effects of geographical characteristics.
4 Results
4.1 Descriptive statistics and correlations
The volume of tweets showed a positive correlation with the ratio of Black to white population (r = 0.16), implying that Black communities were more likely to engage in discussions of racial unrest than white communities. Similarly, the number of tweets was positively associated with education level (r = 0.15) and income inequality (r = 0.23).
Looking at distinct sentiments, anxiety and anger were found to have a positive correlation (r = 0.45). Sadness, on the other hand, showed very little correlation with anxiety (r = 0.02) and anger (r = 0.01). Across the 33 metropolitan areas, the average values of log-transformed sadness, anxiety, and anger were 0.08 (SD = 0.03), 0.07 (SD = 0.03), and 0.34 (SD = 0.09), respectively.
There were differences in the distribution of sadness, anxiety, and anger across metropolitan areas. The highest average score for sadness was found in Miami-Fort Lauderdale-West Palm Beach (M = 0.092, SD = 0.06), followed by Detroit-Warren-Dearborn (M = 0.083, SD = 0.03), and Cincinnati (M = 0.082, SD = 0.04). In terms of anxiety, the highest average score was in Portland-Vancouver-Hillsboro (M = 0.081, SD = 0.03), followed by Washington-Arlington-Alexandria (M = 0.078, SD = 0.02), and Austin-Round Rock (M = 0.077, SD = 0.03). For anger, the highest score was observed in Detroit-Warren-Dearborn (M = 0.373, SD = 0.08), followed by Baltimore-Columbia-Towson (M = 0.360, SD = 0.09), and Portland-Vancouver-Hillsboro (M = 0.360, SD = 0.09). Figure 4 visualizes the log-transformed scores of sadness, anxiety, and anger for the corresponding metropolitan areas. Table 1 provides a summary of the mean, standard deviation, and correlation among the study variables.
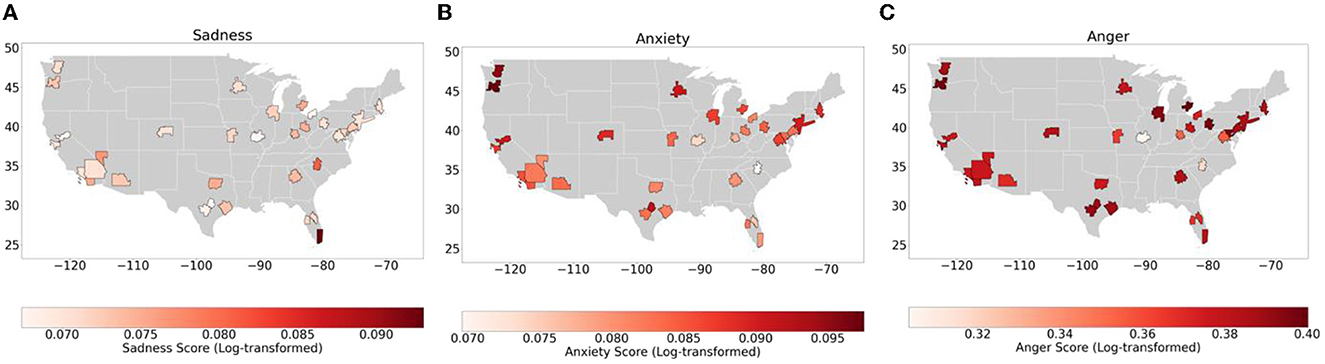
Figure 4. (A) Sadness, (B) anxiety, and (C) anger scores across 33 metropolitan areas.
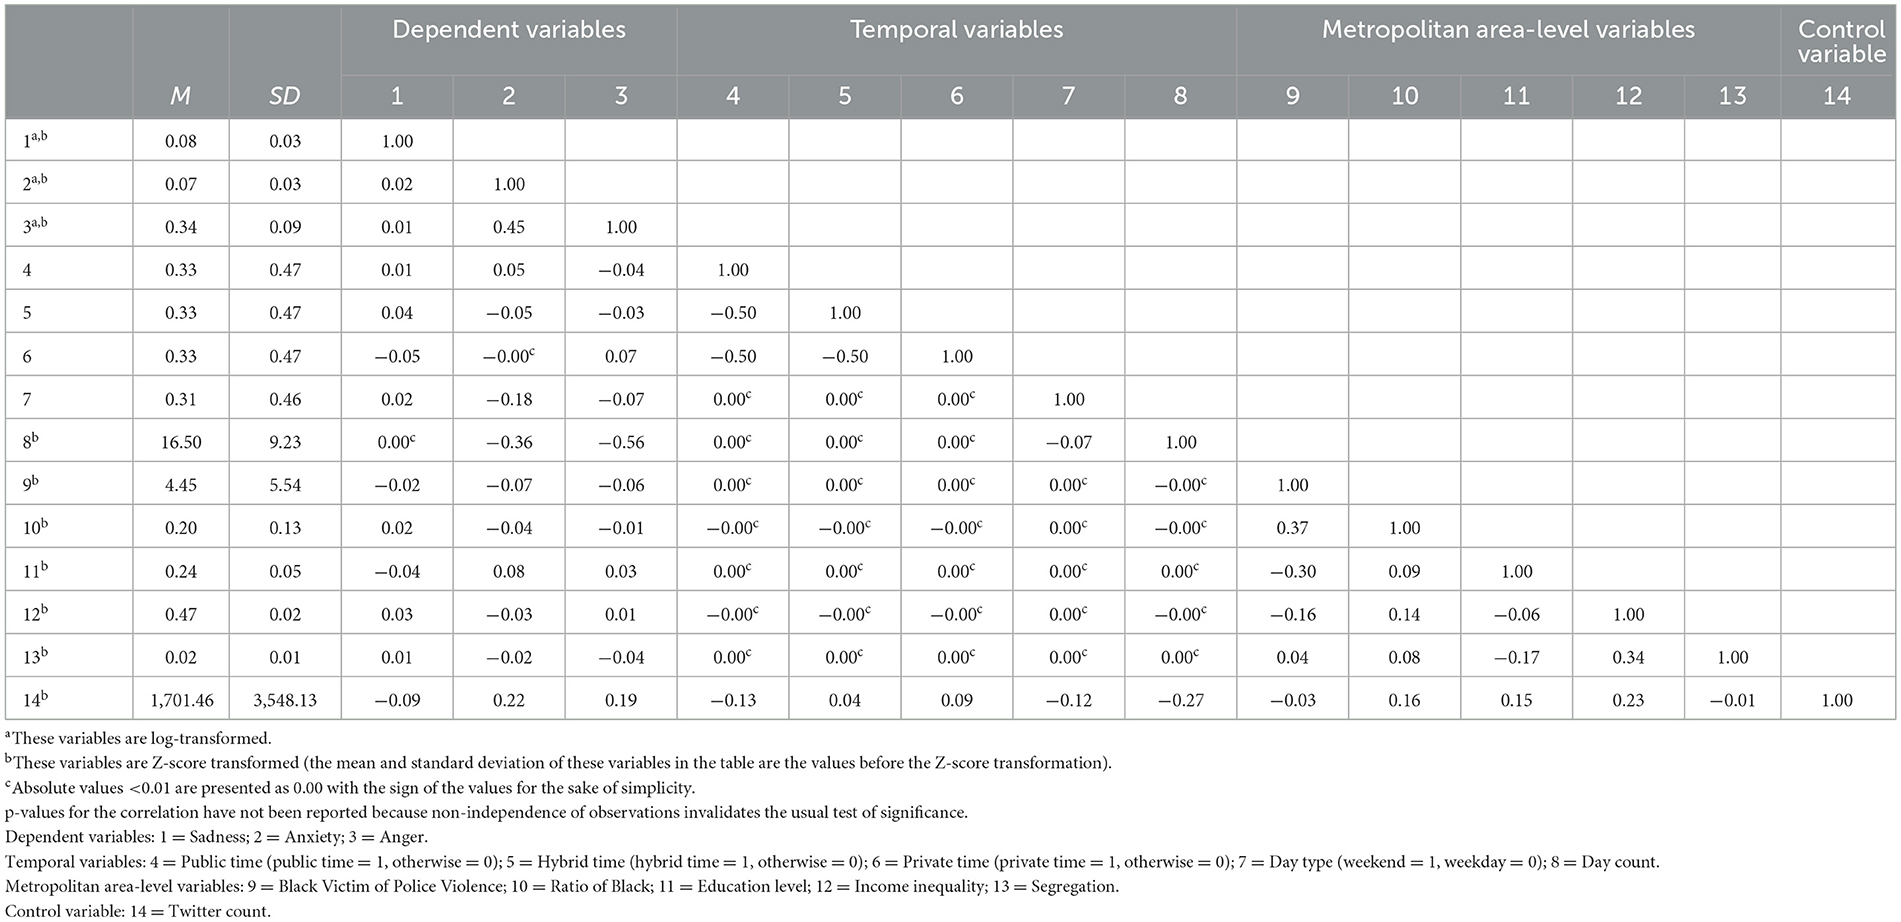
Table 1. Means, standard deviations, and correlations among the study variables.
4.2 Main effects of temporal processes
Model 1 examines the association between temporal elements and sentiments. The findings are presented in Table 2. RQ1 delved into circadian rhythms and the difference in sentiments between weekdays and weekends. It was found that circadian rhythms varied depending on the type of sentiment. Post-hoc analyses with Tukey adjustment were conducted to investigate this pattern further. People expressed more sadness during the hybrid time (4 am – 11 pm) compared to the private time (12 am – 7am; p < 0.05). There were no significant differences between the public (8 am – 3 pm) and hybrid time (p = 0.44) or between the public and private time (p = 0.37). Anxiety was more frequently expressed during the public time than during the hybrid time (p < 0.001), and the private time (p < 0.01). There was no significant difference in anxiety expression between the hybrid and private time (p = 0.25). Anger was more commonly expressed during the private time than the public (p < 0.001) and hybrid time (p < 0.001). There was no significant difference in anger expression between the public and hybrid time (p = 0.99). Figure 5 visualizes the results of these post-hoc analyses with Tukey adjustment, comparing the estimated marginal means of each sentiment between the daily time intervals.
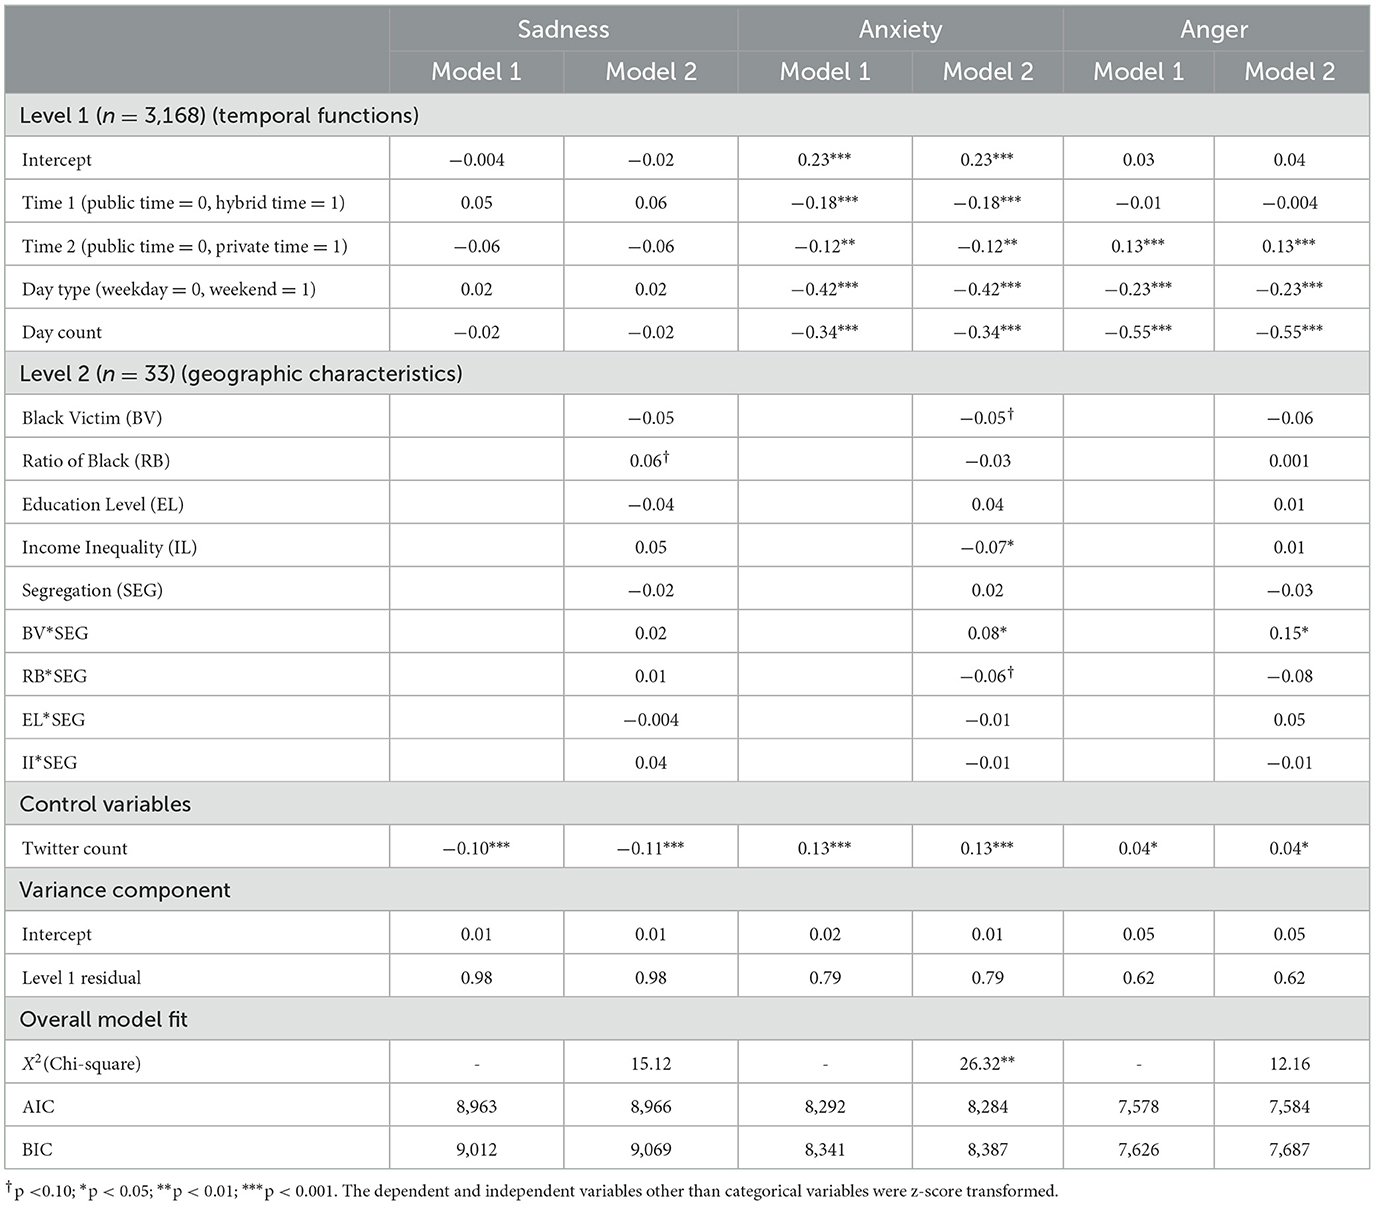
Table 2. Multilevel analysis results on sadness, anxiety, and anger.
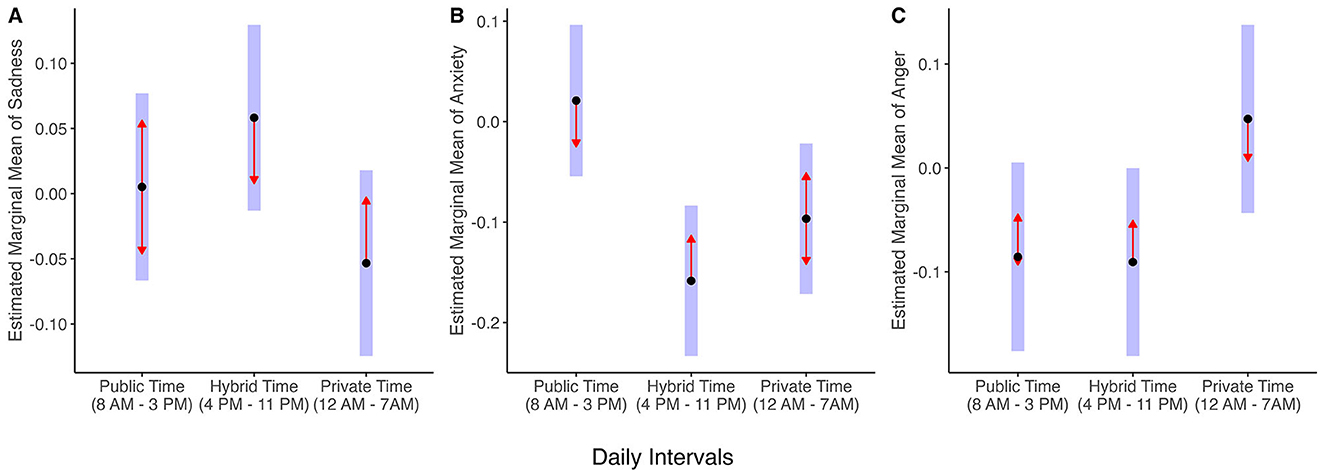
Figure 5. Estimated marginal means and pairwise comparisons of (A) sadness, (B) anxiety, and (C) anger across daily intervals. The blue bars represent the confidence intervals for the estimated marginal means, and the red arrows denote comparisons among them. Specifically, if an arrow from one estimated mean overlaps with an arrow from another group, the difference is not statistically significant. Tukey adjustment is used for the pairwise comparison.
There were noticeable differences between weekdays and weekends for anxiety and anger, but not for sadness. More specifically, individuals expressed higher levels of anxiety (b = −0.42, p < 0.001) and anger (b = −0.23, p < 0.001) during weekdays compared to weekends. However, there was no significant difference for sadness (b = 0.02, p = 0.64).
Hypothesis 1 (H1) predicted a temporal decay of sentiment. The results partially supported this hypothesis. The expression of anxiety significantly reduced over time (b = −0.34, p < 0.001), as did the expression of anger (b = −0.55, p < 0.001). In contrast, the expression of sadness did not significantly reduce over time (b = −0.02, p = 0.24), indicating the absence of temporal decay for sadness.
4.3 Main and interaction effects of characteristics of geographic areas
Model 2 examined the relationship between geographic area-level factors and sentiments. The inclusion of the characteristics of geographic areas significantly improved the model fit for anxiety, with = 26.32, p < 0.01. However, these characteristics did not significantly enhance the model fit for sadness [ = 15.12, p = 0.09] and anger [ = 12.16, p = 0.20]. Given the minimal contribution of geographic area characteristics to explaining variations in sadness and anger, we concentrated on reporting the results of the model related to anxiety. For sadness and anger, we only highlighted the significant results.
RQ 2 examined the associations between geographic characteristics and sentiments. The presence of Black victims was marginally and negatively associated with expressions of anxiety, γ = −0.05, p < 0.10. This suggests that people residing in metropolitan areas with fewer Black victims tended to express more anxiety. The ratio of Black to other races did not significantly relate to anxiety, γ = −0.03, p = 0.26. Similarly, the level of education was not associated with anxiety, γ = 0.04, p = 0.19. Income inequality was negatively associated with anxiety expression, γ = −0.07, p < 0.05, indicating that people living in metropolitan areas with lower income inequality expressed more anxiety. Racial segregation did not significantly correlate with anxiety, γ = 0.02, p = 0.57.
RQ 3 explored whether racial segregation moderates the relationship between other geographical characteristics and sentiments. Racial segregation did moderate the association between Black victims and anxiety, γ =0.08, p < 0.05. A simple slope analysis was performed for further investigation, revealing a significant downward trend for the slope representing areas with a low level of racial segregation (Estimated Slope = −0.13, SE = 0.04, 95% CI = [−0.23, −0.04]). In contrast, slopes representing areas with high and medium levels of racial segregation did not differ significantly from zero. This suggests that in areas with low racial segregation, residents were less likely to express anxiety as the number of Black victims increased. A similar moderation effect pattern was found for anger. Racial segregation moderated the relationship between Black victims and anger, γ = 0.15, p < 0.05. The simple slope analysis demonstrated a significant downward trend for the slope representing the low level of racial segregation (Estimated Slope = −0.21, SE = 0.08, 95% CI = [−0.37, −0.06]), whereas the slopes for high and medium racial segregation levels did not differ from 0. Figure 6 illustrate the moderating effects of racial segregation.
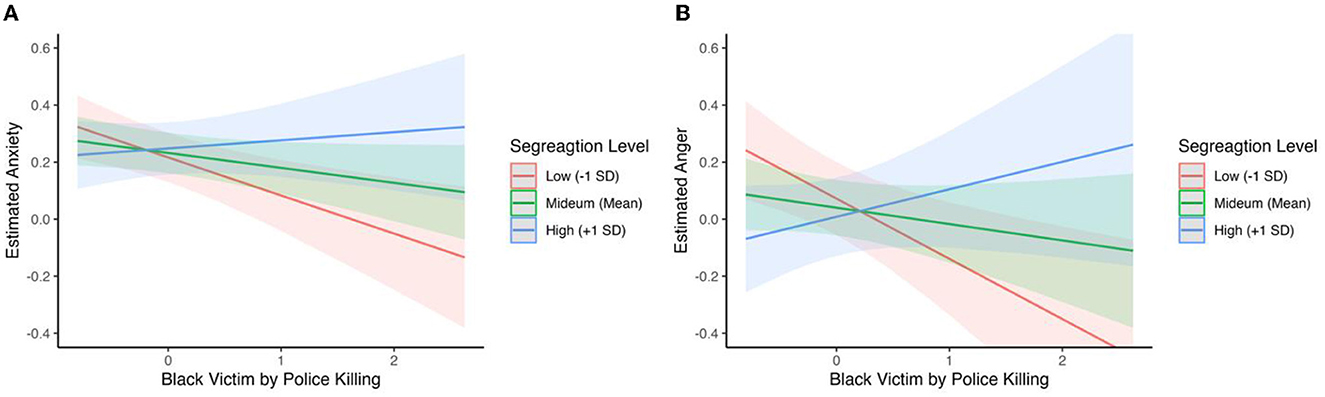
Figure 6. Moderating effect of racial segregation on (A) anxiety and (B) anger. (A) The Y-axis represents estimated anxiety levels, and the X-axis represents the number of Black victims of police violence, both transformed into Z-scores. (B) The Y-axis represents estimated anger levels, and the X-axis again represents the number of Black victims of police violence, both also transformed into Z-scores.
5 Discussion
The findings of this study provide insights into the ways both temporal and geographical factors influence the expression of negative sentiments related to racial unrest on social media across various US metropolitan areas. It was found that: (a) Expressions of anxiety and anger concerning racial unrest are influenced by systematic temporal changes. These changes can be associated with circadian rhythms, differences between weekdays and weekends, and the phenomenon of temporal decay. (b) The social characteristics of different geographical areas account for variations in anxiety expression. However, they do not appear to significantly impact expressions of sadness or anger. (c) Racial segregation was found to moderate the relationship between the number of Black victims and the expressions of anxiety and anger. This implies that in areas with low racial segregation, as the number of Black victims increased, expressions of anxiety and anger decreased.
5.1 Associations between temporal processes and sentiments
The observed temporal variations in sentiment expressions, including circadian rhythms, weekday-weekend differences, and temporal decay, are significant in understanding how emotions surrounding racial unrest fluctuate over time. Although the general pattern of circadian rhythm on social media has been examined (Golder and Macy, 2011; Dzogang et al., 2017), it is unknown whether and how circadian rhythms of sentiments are manifested concerning a specific social issue such as racial unrest. The findings show that each of the discrete sentiments exhibits a distinct pattern of circadian rhythm. The distinct circadian rhythms of different sentiments may be influenced by daily activities and events that evoke particular emotions. For instance, during public hours, exposure to various media or discussions with peers might heighten anxiety due to increased awareness of racial unrest and its potential risks. During private hours, however, solitude might provide individuals a space to express their anger openly, resulting in the peak of anger expression.
The observed temporal decay and weekday-weekend differences in anxiety and anger are consistent with previous research (Helliwell and Wang, 2014; Tsytsarau et al., 2014), which suggests that these emotions naturally decrease over time and are generally lower on weekends. Conversely, sadness, unaffected by temporal decay or the weekday-weekend divide, seems to persist over time. This unvarying and extended state of sadness could raise concerns about potential mental health issues, such as depression, especially among individuals who frequently engage with racial unrest content on social media. Considering the increasing concerns about mental health issues in relation to social media use (Thapa and Subedi, 2018), future research should investigate the potential link between social media engagement surrounding racial unrest and mental health outcomes.
5.2 Associations between social characteristics of geographic areas and sentiments
Our research revealed that certain social features of geographic areas—like the count of Black victims, the degree of income inequality, and the extent of racial segregation—have an association with the levels of anxiety expressed in response to racial conflict. Interestingly, we found that in areas with more reported Black victims, there was a lower expression of anxiety and anger, which was particularly noticeable in areas with less racial segregation. This suggests that people in racially mixed areas may become less emotionally reactive to racial unrest as incidents involving Black victims rise. This is an unexpected outcome since we usually view racial integration as a positive factor.
The apparent contradiction in our findings could be due to the difference between physical residential integration and actual social interaction across racial lines (Rich, 2009). Our study focused on the former and did not measure the latter. Hence, it's possible that merely living in a racially mixed neighborhood does not translate to meaningful cross-racial interactions. In neighborhoods with high residential but low social integration—where social separation persists despite racial diversity—it seems residents might grow less emotionally responsive to incidents of racial unrest. This could be a coping mechanism to avoid dealing with the emotional burden of such issues, especially in the face of increased exposure to racial incidents, such as the rising number of Black victims. It is crucial for future research to dissect the subtle differences between physical proximity and social engagement between races to understand their separate effects on public sentiment in the face of racial unrest.
The negative relationship between anxiety expression and income inequality suggests that individuals residing in economically stable areas, characterized by low income inequality, tend to express a high level of anxiety. Social turbulence such as racial unrest disrupts societal stability, heightening uncertainty. This impact might be felt more acutely in economically stable areas. Uncertainty is a potent elicitor of anxiety (Duronto et al., 2005), hence individuals residing in economically stable locales may experience and voice higher levels of anxiety.
The social characteristics of specific geographic areas do not entirely account for the variance in expressions of sadness and anger. While our data does not fully explain this observation, it underscores the importance of evaluating discrete sentiments due to their unique qualities. Many social media studies investigating public sentiment tend to aggregate diverse negative affective states, such as sadness, to denote a generalized negative sentiment (Hyvärinen and Beck, 2018). Although this valence-based sentiment analysis approach has merit (Harmon-Jones et al., 2017), it risks oversimplifying the complexity of sentiment dynamics. As discrete emotions can be provoked by distinct assessments of situations and can induce divergent reactions, this aggregation can obscure a nuanced understanding of public sentiment during events (Lerner and Keltner, 2000).
The practical implications of our research are significant for policymakers and community leaders. Our findings highlight the necessity of going beyond mere physical integration in racially diverse neighborhoods. Effective policy should foster actual social interactions across racial lines, addressing the emotional desensitization in racially mixed but socially segregated areas. Moreover, it is important to recognize that the emotional impact of racial unrest is not confined to socioeconomically disadvantaged areas. Policymakers should consider implementing community engagement and mental health support initiatives broadly, including in more affluent areas where residents might not typically be perceived as needing such interventions. This comprehensive strategy acknowledges the complex emotional landscape across different communities, ensuring that responses to racial unrest are inclusive, empathetic, and effectively targeted to enhance community resilience and harmony.
5.3 Limitations and future study directions
Several limitations in the current study outline directions for future research. First, it is acknowledged that temporal and geographical factors, while significant, may not encompass all relevant aspects contributing to public sentiment reactions to racial unrest. This study's approach, focusing on macro-level analyses of group and community sentiment dynamics, inherently limits the direct applicability of its findings to individual-level interpretations. This is a crucial consideration, as sentiments and reactions to racial unrest are psychological, complex, and multifaceted, influenced by a myriad of factors beyond temporal and geographical elements. Future research, therefore, should aim to incorporate both macro-level and micro-level analyses, potentially through the combination of survey and other multiple datasets including social media and geographical information data, to gain a more comprehensive understanding of the individual and collective factors driving public sentiment in the context of racial unrest.
Second, the aggregation of data to the metropolitan area level could obscure significant information due to its large scale. Selecting an appropriate geographical unit of analysis is critical, but often challenging, especially in the absence of a guiding theory. While fine-grained geographical data could provide more detailed information, it may overly complicate the model and require substantial computational resources. Conversely, aggregating data to a higher level can mitigate these issues but could also overlook crucial information. This trade-off underscores the difficulty of choosing a unit of analysis. A potential solution could involve generating multiple models based on different geographical units (e.g., block group, census tract, county, etc.) and comparing their results. This approach could enrich theoretical understanding of sentiment emergence on social media in future studies.
Third, another limitation concerns the exclusive use of the keyword “Ferguson” in collecting Twitter data. While this keyword was central to our study, focusing narrowly on it may have inadvertently limited the breadth of our dataset. Relevant tweets that did not specifically mention “Ferguson” but used other pertinent terms such as “Michael Brown” or “police” were not captured in our analysis. This exclusion potentially omits a range of perspectives and discussions pertinent to the broader context of racial unrest.
Finally, an acknowledged limitation of our study is the omission of environmental factors such as temperature and weather conditions, which might significantly influence mood and, by extension, emotional expressions on social media. While our focus was predominantly on temporal and geographic variables, the exclusion of meteorological data means that we did not account for the potential impact of daily weather variations within each metropolitan area. This oversight may have led to a gap in understanding the complete array of influences on public sentiment. Therefore, our results should be interpreted with the understanding that they do not encompass the potential confounding effects of environmental factors on the sentiments expressed during the periods of racial unrest covered in our study.
6 Conclusion
Time and physical space are integral elements of human experiences. The current study investigated the role of these fundamental factors in the expression of negative sentiments associated with racial unrest, using temporally and geographically stamped social media data in conjunction with other datasets. Our findings suggest that sentiment responses to racial unrest are associated with temporal processes and the social characteristics of metropolitan areas. Moreover, these findings underscore the importance of recognizing the unique nature of discrete sentiments in understanding the role of time and space in sentiment responses. The observed emotional desensitization in residentially integrated areas is unexpected, underscoring the necessity of differentiating between residential and social integration in racial research. Overall, this study offers valuable insights into the relationships time and space and sentiment reactions to critical social issues.
Data availability statement
The datasets presented in this article are not readily available because the authors are unable to share the raw dataset due to restrictions outlined in Twitter's data policy. However, the aggregated dataset can be made available upon request. Requests to access the datasets should be directed to T-QP, winsonpeng@gmail.com.
Ethics statement
Ethical approval was not required for the study involving humans in accordance with the local legislation and institutional requirements. Written informed consent to participate in this study was not required from the participants or the participants' legal guardians/next of kin in accordance with the national legislation and the institutional requirements.
Author contributions
SL: Conceptualization, Data curation, Formal analysis, Investigation, Methodology, Visualization, Writing – original draft, Writing – review & editing. MC: Conceptualization, Data curation, Formal analysis, Investigation, Methodology, Visualization, Writing – review & editing. T-QP: Conceptualization, Methodology, Supervision, Writing – review & editing.
Funding
The author(s) declare that no financial support was received for the research, authorship, and/or publication of this article.
Conflict of interest
The authors declare that the research was conducted in the absence of any commercial or financial relationships that could be construed as a potential conflict of interest.
Publisher's note
All claims expressed in this article are solely those of the authors and do not necessarily represent those of their affiliated organizations, or those of the publisher, the editors and the reviewers. Any product that may be evaluated in this article, or claim that may be made by its manufacturer, is not guaranteed or endorsed by the publisher.
Supplementary material
The Supplementary Material for this article can be found online at: https://www.frontiersin.org/articles/10.3389/fcomm.2024.1259046/full#supplementary-material
References
Asur, S., Huberman, B. A., Szabo, G., and Wang, C. (2011). “Trends in social media: persistence and decay,” in Proc. of ICWSM (Barcelona).
Beaulieu, M., and Continelli, T. (2011). Benefits of segregation for white communities: a review of the literature and directions for future research. J. Afri. Am. Stud. 15, 487–507. doi: 10.1007/s12111-011-9158-1
Bosma, H., Dike van de Mheen, H., Borsboom, G. J. J. M., and Mackenbach, J. P. (2001). Neighborhood socioeconomic status and all-cause mortality. Am. J. Epidemiol. 153, 363–371. doi: 10.1093/aje/153.4.363
Branscombe, N. R., Wann, D. L., Noel, J. G., and Coleman, J. (1993). In-group or out-group extemity: importance of the threatened social identity. Personal. Soc. Psychol. Bullet. 19, 381–388. doi: 10.1177/0146167293194003
Charles, C. Z. (2003). The dynamics of racial residential segregation. Ann. Rev. Sociol. 29, 167–207. doi: 10.1146/annurev.soc.29.010202.100002
De Choudhury, M., Jhaver, S., Sugar, B., and Weber, I. (2016). “Social media participation in an activist movement for racial equality,” in Proceedings of the International AAAI Conference on Weblogs and Social Media (Cologne), 92–101.
DeVylder, J. E., Oh, H. Y., Nam, B., Sharpe, T. L., Lehmann, M., and Link, B. G. (2016). Prevalence, demographic variation and psychological correlates of exposure to police victimisation in four US cities. Epidemiol. Psychiatr. Sci. 26, 466–477. doi: 10.1017/S2045796016000810
Dmowska, A., Stepinski, T. F., and Netzel, P. (2017). Comprehensive framework for visualizing and analyzing spatio-temporal dynamics of racial diversity in the entire United States. PLoS ONE 12:e0174993. doi: 10.1371/journal.pone.0174993
Dmowska, A., Stepinski, T. F., and Nowosad, J. (2020). Racial landscapes - a pattern-based, zoneless method for analysis and visualization of racial topography. Appl. Geogr. 122:102239. doi: 10.1016/j.apgeog.2020.102239
Drewnowski, A., Rehm, C. D., and Arterburn, D. (2014). The geographic distribution of obesity by census tract among 59,767 insured adults in King County, WA. Int. J. Obes. 38, 833–839. doi: 10.1038/ijo.2013.179
Duncan, O. D., and Duncan, B. (1955). A methodological analysis of segregation indexes. Am. Sociol. Rev. 20:210. doi: 10.2307/2088328
Duronto, P. M., Nishida, T., and Nakayama, S. (2005). Uncertainty, anxiety, and avoidance in communication with strangers. Int. J. Intercult. Relat. 29, 549–560. doi: 10.1016/j.ijintrel.2005.08.003
Dzogang, F., Lightman, S., and Cristianini, N. (2017). Circadian mood variations in Twitter content. Brain Neurosci. Adv. 1:2398212817744501. doi: 10.1177/2398212817744501
Edrington, C. L., and Lee, N. (2018). Tweeting a social movement: black lives matter and its use of Twitter to share information, build community, and promote action. J. Publ. Interest Commun. 2:289. doi: 10.32473/jpic.v2.i2.p289
Estabrooks, P. A., Lee, R. E., and Gyurcsik, N. C. (2003). Resources for physical activity participation: does availability and accessibility differ by neighborhood socioeconomic status? Ann. Behav. Med. 25, 100–104. doi: 10.1207/S15324796ABM2502_05
Eysenck, M., Payne, S., and Santos, R. (2006). Anxiety and depression: past, present, and future events. Cogn. Emot. 20, 274–294. doi: 10.1080/02699930500220066
Fryer, R. G. (2019). An empirical analysis of racial differences in police use of force. J. Polit. Econ. 127, 1210–1261. doi: 10.1086/701423
Galster, G. C. (2012). “The mechanism(s) of neighborhood effects theory, evidence, and policy implications,” in Neighbourhood Effects Research: New Perspectives, eds. M. van Ham, D. Manley, N. Bailey, L. Simpson, and D. Maclennan (Dordrecht: Springer), 23–56.
Golder, S. A., and Macy, M. W. (2011). Diurnal and seasonal mood vary with work, sleep, and daylength across diverse cultures. Science 333, 1878–1881. doi: 10.1126/science.1202775
Harmon-Jones, E., Harmon-Jones, C., and Summerell, E. (2017). On the importance of both dimensional and discrete models of emotion. Behav. Sci. 7:66. doi: 10.3390/bs7040066
Helliwell, J. F., and Wang, S. (2014). Weekends and subjective well-being. Soc. Indicat. Res. 116, 389–407. doi: 10.1007/s11205-013-0306-y
Hisnanick, J. J., and Rogers, A. L. (2006). Household Income Inequality Measures Based on the ACS Data: 2000–2005 (Washington, DC: Housing and Household Economic Statistics Division, US Census Bureau), 26.
Hyvärinen, H., and Beck, R. (2018). Emotions trump facts: the role of emotions in on social media: a literature review. 51st Hawaii Int. Conf. Syst. Sci. 10:226. doi: 10.24251/HICSS.2018.226
Ince, J., Rojas, F., and Davis, C. A. (2017). The social media response to Black Lives Matter: how Twitter users interact with Black Lives Matter through hashtag use. Ethnic Racial Stud. 40, 1814–1830. doi: 10.1080/01419870.2017.1334931
Kahn, K. B., Goff, P. A., Lee, J. K., and Motamed, D. (2016). Protecting whiteness: white phenotypic racial stereotypicality reduces police use of force. Soc. Psychol. Personal. Sci. 7, 403–411. doi: 10.1177/1948550616633505
Keltner, D., Ellsworth, P. C., and Edwards, K. (1993). Beyond simple pessimism: effects of sadness and anger on social perception. J. Personal. Soc. Psychol. 64:740. doi: 10.1037/0022-3514.64.5.740
Lai, M. H. C., and Kwok, O. (2015). Examining the rule of thumb of not using multilevel modeling: the “design effect smaller than two” rule. J. Exp. Educ. 83, 423–438. doi: 10.1080/00220973.2014.907229
Lambert, A. J., Schott, J. P., and Scherer, L. (2011). Threat, politics, and attitudes: toward a greater understanding of Rally-Round-the-Flag Effects. Curr. Direct. Psychol. Sci. 20, 343–348. doi: 10.1177/0963721411422060
Landmann, H., and Rohmann, A. (2020). Being moved by protest: collective efficacy beliefs and injustice appraisals enhance collective action intentions for forest protection via positive and negative emotions. J. Environ. Psychol. 71:101491. doi: 10.1016/j.jenvp.2020.101491
Leach, C. W., Iyer, A., and Pedersen, A. (2006). Anger and guilt about ingroup advantage explain the willingness for political action. Personal. Soc. Psychol. Bullet. 32, 1232–1245. doi: 10.1177/0146167206289729
Lee, S., Ma, S., Meng, J., Zhuang, J., and Peng, T.-Q. (2022). Detecting sentiment toward emerging infectious diseases on social media: a validity evaluation of dictionary-based sentiment analysis. Int. J. Environ. Res. Publ. Health 19:6759. doi: 10.3390/ijerph19116759
Lerner, J. S., and Keltner, D. (2000). Beyond valence: toward a model of emotion-specific influences on judgement and choice. Cogn. Emot. 14, 473–493. doi: 10.1080/026999300402763
Mitchell, L., Frank, M. R., Harris, K. D., Dodds, P. S., and Danforth, C. M. (2013). The geography of happiness: connecting Twitter sentiment and expression, demographics, and objective characteristics of place. PLoS ONE 8:e64417. doi: 10.1371/journal.pone.0064417
Muchnik, L., Pei, S., Parra, L. C., Reis, S. D., Andrade, Jr. J. S, Havlin, S., et al. (2013). Origins of power-law degree distribution in the heterogeneity of human activity in social networks. Sci. Rep. 3:srep01783. doi: 10.1038/srep01783
Nguyen, Q. C., Li, D., Meng, H. W., Kath, S., Nsoesie, E., Li, F., et al. (2016). Building a national neighborhood dataset from geotagged Twitter data for indicators of happiness, diet, and physical activity. JMIR Publ. Health Surveill. 2:e158. doi: 10.2196/publichealth.5869
Peng, T. Q., Zhou, Y., and Zhu, J. J. H. (2020). From filled to empty time intervals: quantifying online behaviors with digital traces. Commun. Methods Measur. 14, 219–238. doi: 10.1080/19312458.2020.1812556
Pennebaker, J. W., Boyd, R. L., Jordan, K., and Blackburn, K. (2015). The Development and Psychometric Properties of LIWC2015. Austin, TX: University of Texas at Austin.
Peterson, R. D., and Krivo, L. J. (1993). Racial segregation and black urban homicide. Soc. Forces 71, 1001–1026. doi: 10.2307/2580128
Pettigrew, T. F., and Tropp, L. R. (2006). A meta-analytic test of intergroup contact theory. J. Personal. Soc. Psychol. 90, 751–783. doi: 10.1037/0022-3514.90.5.751
Rich, M. A. (2009). “It depends on how you define integrated”: neighborhood boundaries and racial integration in a Baltimore neighborhood. Sociol. For. 24, 828–853. doi: 10.1111/j.1573-7861.2009.01138.x
Sellers, R. M., Smith, M. A., Shelton, J. N., Rowley, S. A. J., and Chavous, T. M. (1998). Multidimensional model of racial identity: a reconceptualization of African American racial identity. Personal. Soc. Psychol. Rev. 2, 18–39. doi: 10.1207/s15327957pspr0201_2
Sharkey, P. (2012). Residential mobility and the reproduction of unequal neighborhoods. Cityscape 14, 9–31. Available online at: https://www.jstor.org/stable/41958938
Shirai, M., and Suzuki, N. (2017). Is sadness only one emotion? Psychological and physiological responses to sadness induced by two different situations: “Loss of someone” and “failure to achieve a goal.” Front. Psychol. 8:288. doi: 10.3389/fpsyg.2017.00288
Sinyangwe, S. (2021). Mapping Police Violence. Available online at: https://mappingpoliceviolence.org/planning-team (accessed October 4, 2021).
Tajfel, H., and Turner, J. C. (1979). “An integrative theory of intergroup conflict,” in The Social Psychology of Intergroup Relations, eds. W. Austin and S. Worchel (Pacific Grove, CA: Brooks/Cole), 33–48.
Thapa, R., and Subedi, S. (2018). Social media and depression. J. Psychiatr. Assoc. Nepal 7, 1–4. doi: 10.3126/jpan.v7i2.24607
Tsytsarau, M., Palpanas, T., and Castellanos, M. (2014). “Dynamics of news events and social media reaction,” in Proceedings of the 20th ACM SIGKDD International Conference on Knowledge Discovery and Data Mining (New York, NY), 901–910.
US Census Bureau (2016). Gini Index. Available online at: https://www.census.gov/topics/income-poverty/income-inequality/about/metrics/gini-index.html (accessed June 20, 2021).
US Census Bureau (2020). Core-Based Statistical Areas. Available online at: https://www.census.gov/topics/housing/housing-patterns/about/core-based-statistical-areas.html (accessed June 5, 2021).
Weitzer, R., and Tuch, S. A. (2004). Race and perceptions of police misconduct. Soc. Probl. 51, 305–325. doi: 10.1525/sp.2004.51.3.305
Williamson, V., Trump, K. S., and Einstein, K. L. (2018). Black Lives Matter: evidence that police-caused deaths predict protest activity. Perspect. Polit. 16, 400–415. doi: 10.1017/S1537592717004273
Keywords: Ferguson, racial unrest, segregation, social media, sentiment
Citation: Lee S, Cho MS and Peng T-Q (2024) Understanding sentiment toward racial unrest through temporal and geographic lenses: a multilevel-analysis across metropolitan areas in the United States. Front. Commun. 9:1259046. doi: 10.3389/fcomm.2024.1259046
Received: 15 July 2023; Accepted: 16 January 2024;
Published: 01 February 2024.
Edited by:
Douglas Ashwell, Massey University Business School, New ZealandReviewed by:
Li Crystal Jiang, City University of Hong Kong, Hong Kong SAR, ChinaAmir Fekrazad, Texas A&M University San Antonio, United States
Copyright © 2024 Lee, Cho and Peng. This is an open-access article distributed under the terms of the Creative Commons Attribution License (CC BY). The use, distribution or reproduction in other forums is permitted, provided the original author(s) and the copyright owner(s) are credited and that the original publication in this journal is cited, in accordance with accepted academic practice. No use, distribution or reproduction is permitted which does not comply with these terms.
*Correspondence: Tai-Quan Peng, winsonpeng@gmail.com