Approaching tourism communication with empirical multimodality: exploratory analysis of Instagram and website photography through data-driven labeling
 Elena Mattei
- Department of Linguistics and Comparative Cultural Studies, Ca' Foscari University of Venice, Venice, Italy
This paper reports the methods and results of the manual annotation of visual features in two corpora of tourism photography on travel boards' digital channels with a tailored tagging model based on the Grammar of Visual Design and adapted to tourism discourse. Computational analysis and statistical modeling show how the testing of theoretical assumptions through categorized data may lead to evidence-based interpretations of patterns of data clustering and to the detection of new communicative aims and conventions across digital media. Preliminary findings reveal indeed significant differences in the frequency of tag (co)patternings and use of visual strategies across channels that are related to the role and aim of each channel in the marketing funnel of persuasion and journey toward purchase (AIDA). Instagram imagery was demonstrated to foster a pre-consumption of the travel experience and emotionally charged reactions by representing perceptive and emotive expectations. While both channels play on postmodern tourists' desire for the uncontaminated, remote and the authentic, Instagram favors aerial views of pristine, aesthetically pleasant settings, often complemented with rear views of solitary individuals performing static processes of contemplation of natural wonders. This suggests a focus on attracting the attention and providing instant gratification of the senses by representing what stands in contrast to everyday life and traditional tourist experiences, both avoiding cognitive effort in a pervasive digital sphere with endless sources of information and encouraging further exploration on websites.
1 Introduction
Since the advent of digital platforms, photographs have been easily disseminated to shape perspectives and elicit emotions, due to their perceptual similarity to external experiences and their seemingly unmediated nature (Mitchell, 1994). Their aesthetically appealing design is argued specifically to facilitate the “rapid delivery, ubiquitous availability and the instant gratification of desires” in a rapidly changing world (Tomlinson, 2007, p. 74).
Tourism narratives, particularly, have been harnessed to promote a nostalgic, romantic view of travel destinations that transcends mass-targeted perspectives, as they play on socially driven desires of postmodern individuals and encourage the latter to find satisfaction by seeking an escape from over-regulated, over-socialized work routines and pre-packaged holiday experiences (Urry and Larsen, 2011; Mattei, 2023b).
In the funnel of persuasion or AIDA model—an acronym that stands for Attention, Interest, Desire, Action—Instagram (IG) is used1 to evoke and raise awareness of particular sensations by means of tourist destination promotion, often generating favorable attitudes and purchase intentions (Sormaz and Ruoss, 2020). In the travel industry, it is estimated that 95% of the major brands own an IG account2, as social media marketing increases traffic to sales platforms like websites (Hays et al., 2013; Leung et al., 2013). Particularly, IG images have been shown to change tourists' perceptions and behaviors with aesthetically appealing content and landscape representations (Garrod, 2009, p. 355; Shuqair and Cragg, 2017). This may be due to the presence of visual features that instantly gratify the senses and stimulate immediate reactions, without requesting cognitive effort in a digital sphere pervaded with endless sources of information.
1.1 The scope of the study
To verify the specific role, aim of Instagram in tourism discourse and marketing, the nature of imagery in three popular tourist boards' Instagram and website pages was analyzed with social semiotics and empirical methods. This was done by looking at visual features, or materialities (Bateman, 2018), their frequency and clustering across digital channels and by testing the validity of the main framework available in multimodality research for image analysis, i.e., the linguistics-based Grammar of Visual Design (Kress and van Leeuwen, 2006). Such qualitative framework, indeed, is grounded in a general and presumed symbolic, socially attached value of images that may lack empirical testing and potentially objectivity (Bateman, 2019a, p. 533–535; Bateman, 2019b, p. 90–92). By studying larger amounts of data with bottom-up approaches, conversely, theories on the presence of tourist driving forces, or desires—such as the quest for the uncontaminated, unknown, remote—may be validated (Mattei, 2023c).
This procedure was guided by two research questions:
• Are there systematic visual choices in tourism, digital communication?
• Are there any differences in the use of the visual mode across media?
Through the development of a tagging system and the conduction of bottom-up statistical analysis for the detection of data clustering and dimensions of variation, it becomes visible how Instagram imagery varies from website narratives, and seems to be systematically constructed to capture the attention and foster both a perceptual pre-consumption of the travel experience and emotionally charged reactions by representing visually such conditions. Indeed, Instagram mainly features aerial views of pristine, aesthetically pleasant settings, often complemented with rear views of solitary individuals performing static processes of peaceful contemplation of natural wonders. IG photographs are shown specifically to be taken from either long shots and high angles in natural settings, often without human footprint, or in close contact with wild animals. Thus, IG is shown to play a particular role in the marketing funnel of persuasion of tourists, slowly becoming “a historically stabilised site for the deployment and distribution of some selection of semiotic modes for the achievement of varied communicative purposes” that may depend on the channel's audience (Bateman et al., 2017, p. 123). The findings were obtained by analyzing the presence of particular participants, their actions and gaze in specific settings, as well as the shots, angles, and salience or positioning in the picture.
Website photography, on the other hand, is demonstrated to feature mostly active and human participants photographed in collective and social moments, also from close distance, and involved in a variety of gastronomic and cultural events in artificial settings like cities. The importance of providing information and agency is confirmed by the predominance of humans involved in activities or in the fruition of services.
2 Methods
This section describes data collection (Section 2.1), theory adaptation and data annotation (Section 2.2), and the use of SRI Tagging software for manual (inter)annotation and data export for statistical analysis (Section 2.3). This section thus illustrates how linguistics theories may be tested and tailored to suit genre and discourse-specific data and support an integrated, systematic multimodal analysis (Bateman, 2014, forthcoming).
2.1 Data collection and theory adaptation for data-driven annotation
For the project, three popular national tourist boards located in English-speaking countries were selected, especially for their daily sharing of high-quality images combined with long captions. Data consisting of photographs and corresponding texts were gathered from two main communication platforms:
- Instagram, used to enhance brand visibility and establish an emotional attachment, and
- the company website, the primary revenue source offering booking opportunities.
The corpora were collected in 2019 by accessing Instagram's application programming interface (API) to retrieve posts for each tourist board in a timespan of 6 months of the same year, and by scraping websites once permission was granted. Table 1 presents a breakdown of the visual sub-corpora, categorized by tourist board and their respective channels.
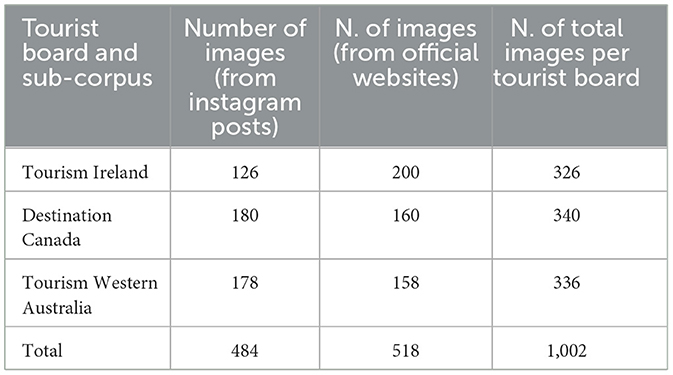
Table 1. Subdivision of visual sub-corpora according to tourist board and channel (Mattei, 2023a, p. 5).
2.2 Metafunctional meaning annotation: tree tagging modeling
The statistical analysis of visual strategies in tourism photography was supported by a tree tagging system based on the Grammar of Visual Design but adapted to tourism photography (Mai et al., 2011). The model enabled the quantification of frequencies and correlations between objective features, like the type of settings, entities, actions or reactions, shots, gazes, photography techniques that are of interest to multimodalists (Kress and van Leeuwen, 2006). This empirical process enabled to cautiously move from theory to evidence-based, sociological interpretations of the data.
This model thus tested an adapted version of a general model of visual knowledge by categorizing and measuring occurrences, variations of data-informed visual features after close data inspection and (inter)annotation. The tags were then grouped by metafunction (Halliday and Matthiessen, 2014).
Specifically, the model examines the decisions made by discourse specialists regarding the selection of participants (subjects), the presence and type of processes (activities), and settings (macro-category Representation of Reality); the selection of camera shots and angles (macro-category Relationship with the Audience), and both the position, size and visual weight of elements within the photograph (macro-category Composition).
For preliminary analyses, the macro-category Tourism Strategies was included to quantify the presence of tourists' driving forces or recurring themes (Maci, 2020) based on the identification of particular features in each image3. For example, the search for what is unknown, remote or pristine was encoded as strangerhood (trope) when detecting uncontaminated environments, like exotic beaches or clear waters. Or again, the representation of meals, swimwear or alcohol was encoded as indexical reference, an object symbolizing postmodern desires and taboos embodied by represented participants and transferred to tourists (Dann, 1996).
The macro-categories linked to the three linguistic metafunctions are summarized in Table 2 and encompass a range of sub-categories of tagging possibilities (or macro-variables) that group “choices” in meaning construction (main variables).
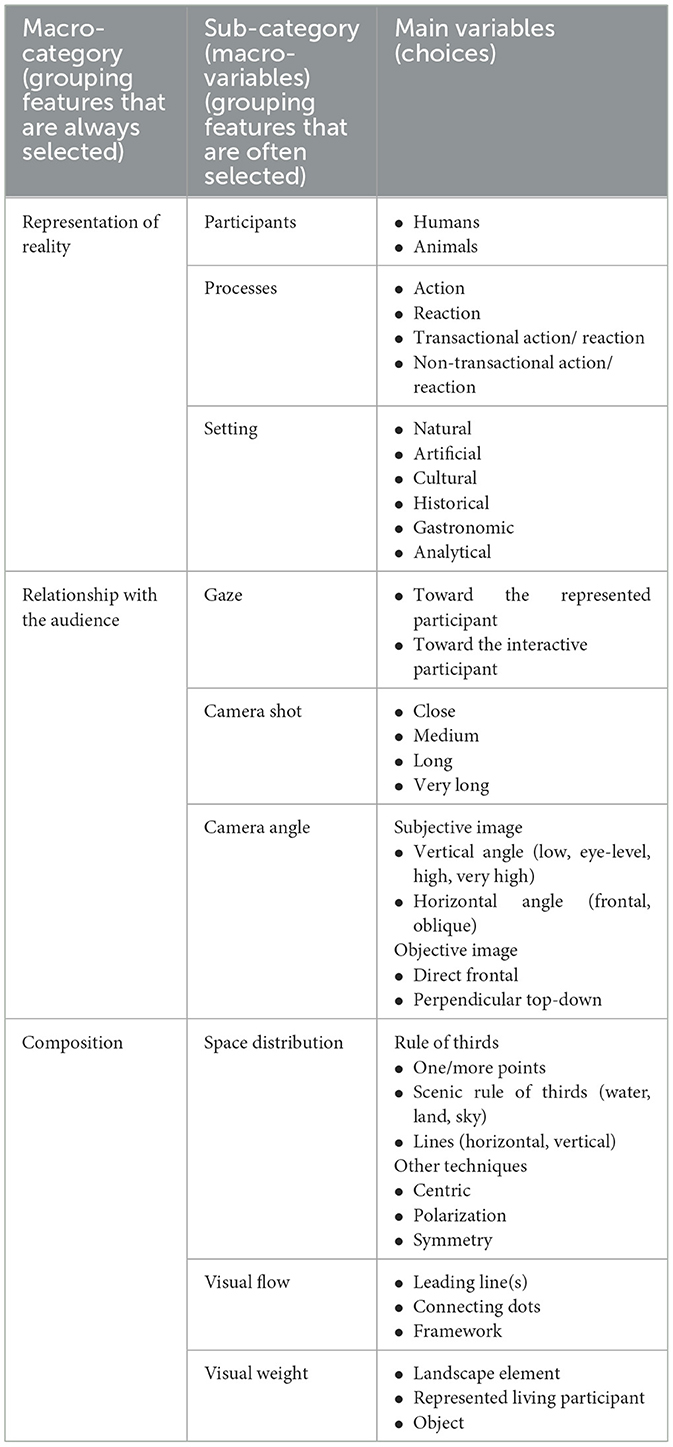
Table 2. Tree tagging system for the annotation of tourism images building on Halliday's three metafunctions and the Grammar of Visual Design (Mattei, 2023a, p. 16–19).
In the tagging system, the macro-category Representation of Reality relates to the experiential metafunction and classifies both narrative and conceptual images and related circumstances (Kress and van Leeuwen, 2006, p. 48–62)4, i.e., settings, here identified and coded by the author as natural, artificial, historical, cultural, analytical and gastronomic. In particular, narrative images are detected by coding action and reaction (observation) processes5, together with the subject and nature of the process, i.e., whether it is transactional or non-transactional and therefore includes or not the goal of the action or the object of contemplation. Conceptual images, conversely, are articulated into analytical (maps, icons, logos) or symbolic suggestive, coded implicitly through the absence of human beings.
The macro-category Relationship with the Audience explores choices concerning the relationships between the producer of the semiotic artifact, the represented participants, and the interpreter who makes sense of the sign in the social context, i.e., the viewer. The producer communicates with the viewer through three main tools, which correspond to the categories included: (a) the gaze, if present, directed toward the viewer or a represented participant; a close, medium, or long, very long shot, which progressively provide a bigger picture with a less focus on details, as close shots, for example, capture only the portions of an entity; and an angle, which may be objective (top-down or frontal, neutralizing any distortions) or subjective. The adoption of a subjective perspective includes choices regarding vertical (high, eye-level, low) and horizontal angles, the latter being oblique when the frontal plane of the photographer does not run parallel to the one where the main represented participants are.
2.3 Software for manual annotation and inter-coder consistency
The hierarchical tagging system was created using Statistically Reliable Image Tagging6, a software designed for complex manual tagging procedures on large visual corpora7. SRI Tagging was developed to provide a user-friendly interface for categorizing lexicogrammatical units in multimodal studies8.
To ensure the objectivity and consistency of the tagging process and rule out the possibility of chance agreement, inter-coder reliability measures such as Cohen's kappa and Krippendorff's alpha were implemented. These were further elaborated in R to consider tag dependencies and both mutually and non-exclusive child nodes (Bateman et al., 2017, p. 198–204). In this project, 18% of the images were independently tagged by another coder, instructed on tag meanings through a reading scheme. Most variables in this study report substantial reliability values (>0.61), ensuring the robustness of the tagging procedure9.
3 Results
3.1 Data extraction, grouping and inferential statistics
This section presents the results derived from the manual tagging of the visual corpora through Principal Component Analysis (PCA) in R. In particular, this section offers an overview of data patterns and clustering, including the contribution of each variable to statistical variation. PCA reduces the complexity of the data under investigation and explores “to what extent the annotations allow the data to be grouped into clusters” (Bateman and Hiippala, 2021, p. 7) by means of fictitious dimensions of variance. Due to its bottom-up nature, this test enables the generation of data-driven hypotheses of variance, correlation by mapping data onto a multidimensional space. Eventually, this analysis helped understand whether tags (i.e., variables) grouped according to channel, preparing the ground for inferential statistical analyses such as One-Way ANOVA in Jamovi, chi-square and Correspondence Analysis (CA) in R within and across macro-categories10. These tests helped identify cluster patterning and correlations, i.e., variations in the use of specific tags across different channels (Field et al., 2012). This was possible after grouping of each image's tag occurrences of each variable according to channel. To conduct ANOVA tests, both Shapiro-Wilk test of normality of the distribution of the data and Levene test were performed, reporting non-significant values and confirming the assumption of normality and homogeneity of variance 11.
3.2 Principal component analysis: explained variance and data clustering
The input data used for the calculation of variation across dimensions was a table with a list of all images and the presence or absence of each feature (tag) for each image. All metadata pertaining to the type of sub-corpus was excluded and mapped afterwards. The first round of exploratory PCA includes all variables, without any filtering based on reliability values12. This was done to provide an overview of potential clustering patterns, and due to space constraints, considering the complex procedure of implementation of reliability tests on hierarchical systems. Analyses excluding non-reliable and redundant features have been extensively reported in Mattei (2023b) and partially in Mattei (2023a) and Mattei (forthcoming) and describe the implementation of Cohen's kappa and Krippendorff's alpha. To facilitate comparison with more reliable results, Supplementary material report a PCA (alpha > 0.8) and CA (Kappa and alpha > 0.6) of reliable features only.
An overview of the percentage of explained variance is provided in Figure 1, in the graph on the left side. As can be seen from the scree plot, the first ten dimensions account for 45.9% of the variance detected by the Principal Component Analysis. Each one of the remaining 191 dimensions detected accounts for too little variation of the data; this phenomenon might be investigated further by annotating a larger body of images and providing more annotations for each one of the (sub)categories of the tagging system, or by reducing the number of variables (tags) in the taxonomy. For reasons of space, the current section focuses only on the exploration of the first two dimensions of variance, which contribute the most to the explained variance.
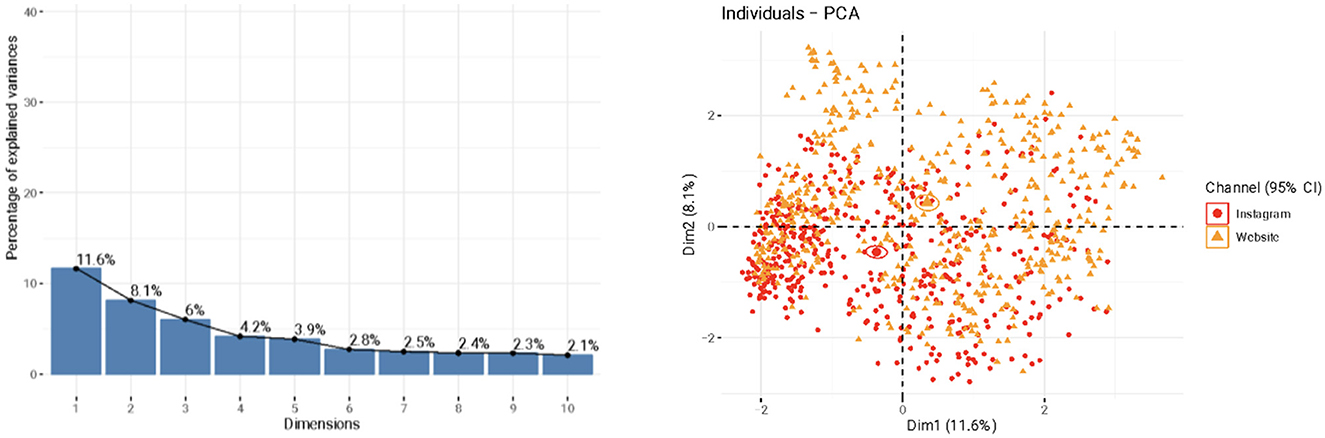
Figure 1. Percentages of variation explained by PCA-calculated dimensions with respect to the variables of the tagging system (Left); Data items from the corpus plotted against dimensions 1 and 2 of the PCA (Right) (Mattei, 2023c, 2).
The graph on the right side shows the mapping of each tagged image onto a multidimensional space. The PCA allowed for a preliminary observation of potential regularities across the dataset with respect to their use of visual elements according to channels. In particular, each image was plotted according to the presence or absence of the features (variables) of the tagging system, and images displaying a similar pattern of occurrences and co-occurrences of features clustered together. The specific weight, or contribution, of each variable to the first two dimensions of variance calculated allowed for a particular placement of each image by taking into account its sum of features and related scores.
As can be noticed from the graph, two distinct clusters may be distinguished, occurring in opposing quadrants along the first and second dimension. The presence of two different clusters shows how selected classes of data items group together. Clusters are represented graphically as ellipses referring to the mean of a set of values with a 95% confidence level (Bateman et al., 2021, p. 16). In particular, the spread of the ellipses along the dimensions indicates the deviation of the data samples from the mean values. In the current graph, the narrow ellipses suggest that there is not considerable variation within the samples, i.e., website and Instagram images.
This finding is significant if accompanied by the interpretation of the position of the two distinguished clusters along dimensions 1 and 2. Indeed, website images are grouped together in the top right quadrant, showing a positive contribution to both dimensions. Conversely, Instagram images cluster in the bottom left quadrant, which indicates a negative contribution to the same dimensions. This distinction suggests that digital, visual communication in tourism discourse is constructed differently depending on the channel of dissemination of the promotional message.
In terms of variation across tourism boards, the PCA showed a less distinct and significant difference between the communicative, visual strategies; indeed, Tourism Ireland13,14 and Tourism Western Australia's15,16 ellipses overlap in the same quadrant, whereas only Destination Canada's17,18 images cluster in the opposite quadrant, but within closer distance, compared to the graph reported (see Supplementary material).
3.3 Contributions of variables to the largest PCA-calculated dimensions of variation
The characterization of the first dimensions of variance, which account for the largest contribution to variation in the corpora under investigation, allowed to discuss the potential nature of variance in the corpus. Particularly, the calculation of the weightings of each variable sharpens an understanding of the variables behind variance in the data items, i.e., the images.
Table 3 shows the values of the variables which contribute the most to the largest dimensions of variance that were calculated by the PCA. The features with values > 0.1 contribute positively to a placement along the corresponding dimension; conversely, features with weightings < −0.1 contribute negatively to the dimension, indicating the presence of an inverse correlation between the dimension and the variables. For ease of reading, results report only variables which proved to be reliable in subsequent analyses.
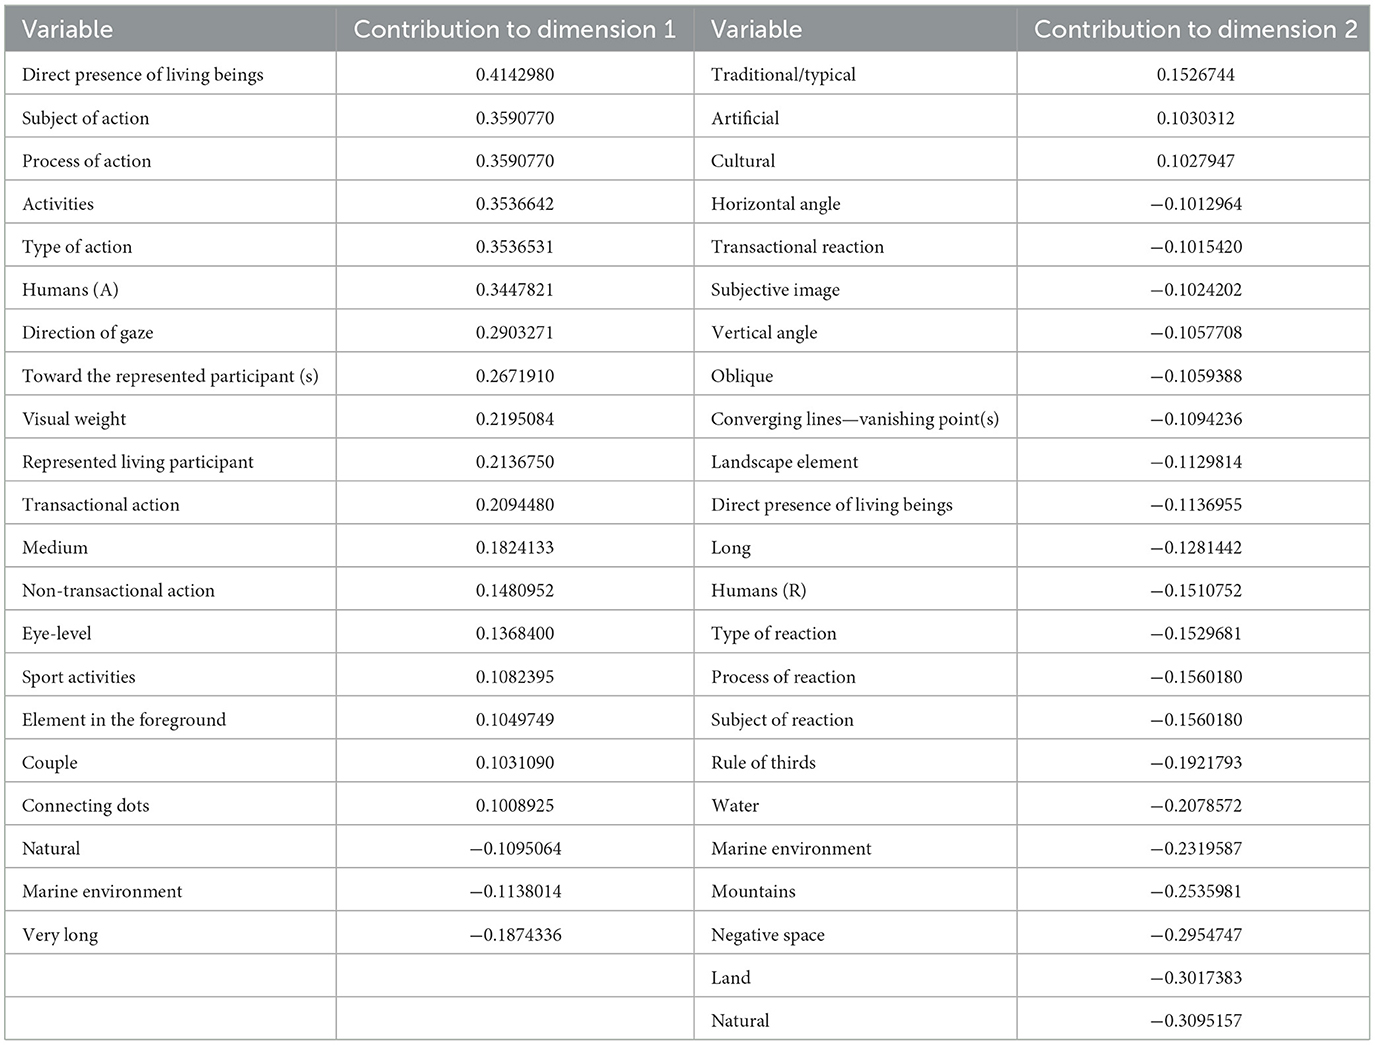
Table 3. Variables' contribution values to dimensions 1 and 2.
As can be seen from the table, the variance in the first dimension is mostly due to positive contributions, whereas the second is mainly characterized by negative ones. As website images cluster along the top-right quadrant, showing positive values of significant variation in both dimensions, their nature may be said to be defined by dimension 1. The latter includes the variables Direct Presence of Living Being, which encompasses animal and human life, Process of Action performed by Humans (A), the sub-category of gaze Toward the Represented Participant(s) combined with Medium (shots), Eye-level (angle), and Represented Living Participant (a sub-category of Visual Weight).
Conversely, Instagram imagery, showing negative values of variation in the graph, seems to be defined by dimension 2, and in particular by the variables Transactional Reaction, Oblique (Angle) and Vertical Angle, Converging Lines, Landscape Element (a sub-category of Visual Weight), and Direct Presence of Living Being. These are combined with Process of Reaction and Humans (R), Long (Shot), Rule of Thirds and correlated Water, Mountains, Land, which encode large and definite portions of pictures representing landscapes. If we consider the variables' presence, weight, and positive or negative value, we may formulate the following hypotheses, confirmed by the chi-square and CA:
• Dimension 1, which includes mostly positive contributions, thus representing website imagery, correlates positively with the presence of living beings performing action processes from a social distance (medium shots) and eye-level angles. It also correlates with the presence of gazes;
• Dimension 1 is negatively correlated with long shots of natural environments;
• Dimension 2, which includes mostly negative contributions, thus representing Instagram imagery, correlates negatively with natural representations of the destination as well as rear views of single beings involved in reaction processes from long shots and subjective angles, specifically vertical and oblique. The attention to the visual representation is enhanced through the use of professional perspective techniques, including converging lines.
• Dimension 2 correlates positively with traditional and cultural aspects of tourist destinations, like customs, music festivals or events, local attractions and landmarks, or objects typical of a culture or history of a population.
On the one hand, results show website communication focuses on narrative representations that visually shape a multifaceted tourist experience, in which humans are the main characters, occupying a good portion of the photograph, and are involved in various activities. These include sports, collective gastronomic experiences, and tours with guides or in more exclusive conditions (e.g., by car, on a cruise). Also, the presence of gazes and eye-level angles shapes a close and equal relationship with viewers (Messaris, 1997), possibly mirroring instances of everyday life or mass tourism (Urry and Larsen, 2011). The representation of activities in various settings, including content like maps, signals an attempt to show what can be practically done and where when visiting a new place. This is because websites are visited mostly by individuals who have developed informative or purchase intents related to a brand or service, increasingly influenced by social media's awareness- and community-building activities through content sharing and interaction with a broad audience (Leung et al., 2013; Jamil et al., 2022)19.
Conversely, Instagram communication is defined by conceptual and static narrative representations in which a distant, commodifying view of the tourist destination is constructed, often combined with professional compositional techniques like converging lines and Rule of Thirds that make the picture attractive to the human eye (Mai et al., 2011). This is line with computational studies showing how posting aesthetically appealing photography is a shared practice in the IG community (Manovich, 2017). Specifically, the combination of long shots of vast, natural views and rear views of reaction processes with vertical angles establishes an impersonal relationship with dehumanized subjects who, when present, rarely engage with viewers through gazes; rather, they perform solitary, static processes of perceiving natural wonders, as also reported by qualitative and marketing studies (Garrod, 2009; Smith, 2021). Through such semiotic acts, represented tourists become themselves commodities, symbolizing consumption and fostering identification (Debord, 1977; Francesconi, 2014). The use of vertical angles—often high, as reported by absolute counts and CA—might signal the intention to build an unequal relationship between represented participants and viewers, as the latter view the destination from a superior position denoting control, ownership and power (Kress and van Leeuwen, 2006). Compared to website imagery, thus, Instagram imagery prompts imagination through scapes and a sense of pristine, remote experience, defined extra-ordinary by tourism sociologists (Urry and Larsen, 2011), i.e., different from everyday routines and mass-targeted, collective experiences in industrialized, polluted areas (Dann, 1996).
4 Discussion
The PCA confirmed the presence of variance in the visual construction of travel destinations across media. Overall, the study shows how images are designed to shape positive expectations about intangible leisure experiences, potentially manipulating perceptions and legitimating (pre)consumption practices.
The paper also discussed the implications of testing theories and annotating with data-driven procedures in a supervised environment, both emphasizing the exploration, adaptation of general knowledge theories and exploring multimodal frameworks' suitability for analyzing meaning-making processes in particular contexts. The importance of empirical testing on larger datasets was highlighted to avoid imposing classifications without verification. Both data and testing were key to provide evidence for the validation of previous qualitative insights concerning the role of the visual mode in constructing discourse semantics and social meaning (Stöckl et al., 2020). This brief report thus positions itself in the empirical multimodal literature and alongside quantitative content analyses (Bouko et al., 2021), and was followed by an extensive, qualitative discussion of reliable findings (Mattei, 2023b).
The annotation of a specialized corpus is also an expansion of quantitative work and an attempt to explore new communication technologies through empirical setups that substantiate hypotheses and foster comparisons with other disciplines. Indeed, the findings contribute not only to literature on language-based models and social semiotics, but also to marketing studies, which have recently addressed the social media emerging trend toward romantic visualizations of the tourist experience (Cilkin and Cizel, 2022), yet leaving institutional communication unaddressed.
The paper also highlights the role of manual annotation in enabling customization and control over data classification. Cultivating analytical skills through close inspection and elaboration of taxonomies may facilitate the interpretation, generation of signs with informed social understandings, shedding light on how subjective labeling both impacts content analysis and offers deeper insights into meaning making practices that go beyond entity recognition. Creating new taxonomies may thus become a way to train pattern recognition and identify features that are meaningful to multimodality researchers, including relationships between represented participants, settings, actions, gazes, shots, and compositional techniques. Eventually, this procedure may inform other disciplines and validate previous studies; it can also foster digital literacy in an era dominated by misinformation and AI-generated content.
Despite the corroboration of the findings through CA and Chi-square test, further model testing is required. PCA is an emerging practice in multimodal analysis for the exploration of variance that may be related to metadata. The presence of many dimensions highlights the need to annotate a larger body of images and provide more annotations for each label. The training of a model that explains variance more predictively, as shown by Computer Vision studies, may prompt comparison between (un)supervised entity recognition through machine learning procedures and customized annotation systems that build on and test theoretical systems of knowledge.
Finally, the administration of surveys might contribute to existing marketing research on IG followers' intentions and changes in perception and behavior after exposure to promotional content.
Data availability statement
The original contributions presented in the study are included in the article/Supplementary material, further inquiries can be directed to the corresponding author.
Ethics statement
Ethical approval was not required for the study involving human data in accordance with the local legislation and institutional requirements. The social media data was accessed and analyzed using Instagram's API. The Instagram and website content were collected once permission was granted by the travel boards.
Author contributions
EM: Conceptualization, Data curation, Funding acquisition, Investigation, Methodology, Software, Validation, Writing—original draft, Writing—review & editing.
Funding
The author(s) declare that financial support was received for the research, authorship, and/or publication of this article. The research activities presented in this paper were conducted at the University of Verona, in the Department of Foreign Languages and Literatures, as part of the Excellence Programme in Digital Humanities. The department and the Italian Ministry of University and Research funded the programme.
Acknowledgments
The analysis reported in this paper was conducted thanks to the invaluable support and expertise of John Bateman during a research period at Universität Bremen. Any errors, omissions or misrepresentations remain solely the author's responsibility.
Conflict of interest
The author declares that the research was conducted in the absence of any commercial or financial relationships that could be construed as a potential conflict of interest.
Publisher's note
All claims expressed in this article are solely those of the authors and do not necessarily represent those of their affiliated organizations, or those of the publisher, the editors and the reviewers. Any product that may be evaluated in this article, or claim that may be made by its manufacturer, is not guaranteed or endorsed by the publisher.
Supplementary material
The Supplementary Material for this article can be found online at: https://www.frontiersin.org/articles/10.3389/fcomm.2024.1355406/full#supplementary-material
Footnotes
1. ^https://www.statista.com/statistics/259379/social-media-platforms-used-by-marketers-worldwide/ (accessed January 29, 2024).
2. ^https://www.statista.com/statistics/499694/forecast-of-online-travel-sales-worldwide/ (accessed January 29, 2024).
3. ^This macro-category was subsequently excluded to avoid redundancy.
4. ^The categories Activities and Means are not included here for reasons of space.
5. ^In the Grammar of Visual Design, reaction processes involve the static observation of an entity on the part of a living subject (participant).
6. ^SRIT is an openly accessible software, designed in collaboration with Pibiri (National Research Council in Italy, ISTI-CNR); Pibiri and Mattei (2020).
7. ^Link: http://xor.isti.cnr.it:8000/login.html (accessed 30 January, 2024).
8. ^SRIT has been used in multimodality and digital humanities courses at Verona and Bremen universities and in international workshops.
9. ^A list of reliability values is provided in Mattei (2023a, p. 23–24) and is partly included in the Supplementary material.
10. ^The chi-square test proved to be suitable for the comparison of continuous values (number of occurrences) of nominal variables (tags) among groups, and to confirm or reject the hypothesis of equal variance of these variables among digital channels (Field et al., 2012). In this study, the Chi-square test validated the hypothesis that some features identified in the visual corpora of promotional imagery vary “unexpectedly” in terms of frequency depending on the channel of dissemination (the predictor variable) (Mattei, forthcoming).
11. ^The Levene test reported non-significant values for almost all variables (98%). The results of the One-Way ANOVA were successively compared with those of the Chi-square test (Mattei, 2023b, forthcoming).
12. ^To improve reproducibility and replicability of the results, the R script used for the statistical analysis is openly accessible at https://github.com/ElenaMattei/Tourism-Photography.
13. ^Ireland (2023). Tourism Ireland. Available online at: https://www.ireland.com/en-us/ (accessed December 13, 2023).
14. ^Tourism Ireland [@tourismireland] (2023). Tourism Ireland. Available online at: https://www.instagram.com/tourismireland/ (accessed December 13, 2023).
15. ^Tourism Western Australia (2023). Tourism Western Australia. Available online at: https://www.westernaustralia.com/en/welcome-to-western-australia (accessed December 13, 2023).
16. ^Tourism Western Australia [@westernaustralia] (2023). Tourism Western Australia. Available online at: https://www.instagram.com/westernaustralia/ (accessed December 13, 2023).
17. ^Destination Canada [@explorecanada] (2023). Destination Canada. Available online at: https://www.instagram.com/explorecanada/ (accessed December 13, 2023).
18. ^Keep Exploring. (2023). Destination Canada. Available online at: https://us-keepexploring.canada.travel/ (accessed December 13, 2023).
19. ^In Mattei (2023b), website language is also shown to be more informative compared to Instagram's. The multimodal analysis allowed for an investigation of text-image relationships within and across channels (Bateman, 2014).
References
Bateman, J. A. (2014). Text and Image: A Critical Introduction to the Visual/Verbal Divide. London: Routledge.
Bateman, J. A. (2018). Peircean semiotics and multimodality: towards a new synthesis. Multim. Commun. 7, 1–24. doi: 10.1515/mc-2017-0021
Bateman, J. A. (2019a). Towards critical multimodal discourse analysis: a response to Ledin and Machin. Crit. Disc. Stud. 16, 531–539. doi: 10.1080/17405904.2018.1550430
Bateman, J. A. (2019b). “The critical role of analysis in moving from conjecture to theory,” Shifts Towards Image-Centricity in Contemporary Multimodal Practices, eds H. Stöckl, H. Caple, and J. Pflaeging (London: Routledge), 86–94.
Bateman, J. A., Heller, V., Moschini, I., and Sindoni, M. G. (forthcoming). “What is genre? Foundational considerations for genre some implications for methods,” Multidisciplinary Views on Discourse Genres, eds N. Stukker, J. Bateman, D. McNamara, W. Spooren (London: Routledge), 1–42.
Bateman, J. A., and Hiippala, T. (2021). “From data to patterns,” in Empirical Multimodality Research: Methods, Evaluations, Implications, eds J. Pflaeging, J. Wildfeuer, and J. A. Bateman (Berlin: Walter de Gruyter), 65–90.
Bateman, J. A., Veloso, F. O. D., and Lau, Y. L. (2021). On the track of visual style: a diachronic study of page composition in comics and its functional motivation. Visual Commun. 209–247. Available online at: https://journals.sagepub.com/doi/abs/10.1177/1470357219839101?journalCode=vcja
Bateman, J. A., Wildfeuer, J., and Hiippala, T. (2017). Multimodality: Foundations, Research and Analysis–A Problem-oriented Introduction. Berlin: De Gruyter Mouton.
Bouko, C., De Wilde, J., Decock, S., De Clercq, O., Manchia, V., and Garcia, D. (2021). Reactions to Brexit in images: a multimodal content analysis of shared visual content on Flickr. Vis. Commun. 20, 4–33. doi: 10.1177/1470357218780530
Cilkin, R., and Cizel, B. (2022). Tourist gazes through photographs. J. Vacat. Market. 28, 188–210. doi: 10.1177/13567667211038955
Dann, G. (1996). The Language of Tourism: A Sociolinguistic Perspective. Wallingford: CAB International.
Francesconi, S. (2014). Reading Tourism Texts: A Multimodal Analysis. Bristol: Channel View Publications.
Garrod, B. (2009). Understanding the relationship between tourism destination imagery and tourist photography. J. Travel Res. 47, 346–368. doi: 10.1177/0047287508322785
Halliday, M. A. K., and Matthiessen, C. M. I. M. (2014). Introduction to Functional Grammar. London: Routledge.
Hays, S., Page, S. J., and Buhalis, D. (2013). Social media as a destination marketing tool: its use by national tourism organisations. Curr. Iss. Tour. 16, 211–239. doi: 10.1080/13683500.2012.662215
Jamil, K., Dunnan, L., Gul, R. F., Shehzad, M. U., Gillani, S. H. M., and Awan, F. H. (2022). Role of social media marketing activities in influencing customer intentions: a perspective of a new emerging era. Front. Psychol. 12, 1–12. doi: 10.3389/fpsyg.2021.808525
Kress, G., and van Leeuwen, T. (2006). Reading Images: The Grammar of Visual Design. London: Routledge. doi: 10.4324/9780203619728
Leung, D., Law, R., van Hoof, H., and Buhalis, D. (2013). Social media in tourism and hospitality: a literature review. J. Travel Tour. Market. 30, 3–22. doi: 10.1080/10548408.2013.750919
Maci, S. M. (2020). English Tourism Discourse: Insights into the Professional, Promotional and Digital Language of Tourism. Milan: Hoepli Editore.
Mai, L., Le, H., Niu, Y., and Liu, F. (2011). “Rule of thirds detection from photograph,” in 2011 IEEE International Symposium on Multimedia (Dana Point, CA: IEEE), 91–96. doi: 10.1109/ISM.2011.23
Manovich, L. (2017). Instagram and Contemporary Image. Available online at: www.manovich.net (accessed December 10, 2023).
Mattei, E. (2023a). Theory and method for the statistical investigation of multimodal promotional practices in the digital era: a data-driven approach based on systemic functional linguistics and social semiotics. IDEAH 3, 1–32. doi: 10.21428/f1f23564.7921b725
Mattei, E. (2023b). Multimodal Corpus Analysis of Digital Tourism Narratives: A Data-Driven Approach Based on Systemic Functional Linguistics and Social Semiotics (Dissertation). University of Verona. Available online at: https://iris.univr.it/handle/11562/1098826 (accessed February 5, 2024).
Mattei, E. (2023c). “Investigating multisemiotic persuasive practices by integrating computational methods and complementary theoretical frameworks,” in A Data-driven Approach to Digital Tourism Discourse Based on Systemic Functional Linguistics and Empirical Multimodality. Digital Humanities 2023. Collaboration as Opportunity (DH2023), eds W. Scholger, G. Vogeler, T. Tasovac, A. Baillot, and P. Helling (Austria: Centre for Information Modeling), 1–2. doi: 10.5281/zenodo.8210654
Mattei, E. (forthcoming). “Integrating computational and statistical methods into the humanities: investigating multimodal tourism discourse with empirical social semiotics and SRI tagging software” in Language, Data Science and Digital Humanitie, eds M. Laitinen, and J. Tyrkkö (Finland: University of Eastern Finland; Sweden: Linnaeus University).
Mitchell, W. J. T. (1994). Picture Theory: Essays on Verbal and Visual Representation. Chicago, IL: University of Chicago Press.
Pibiri, G. E., and Mattei, E. (2020). Statistically Reliable Image Tagging. Available online at: http://xor.isti.cnr.it:8000/login.html (accessed January 30, 2024).
Shuqair, S., and Cragg, P. (2017). The immediate impact of instagram posts on changing the viewers' perceptions towards travel destinations. Asia Pac. J. Adv. Bus. Soc. Stud. 3, 1–12. doi: 10.25275/apjabssv3i2bus1
Smith, S. P. (2021). Landscapes for “likes”: capitalizing on travel with Instagram. Soc. Semiot. 31, 604–624. doi: 10.1080/10350330.2019.1664579
Sormaz, A., and Ruoss, E. (2020). “Social media to balance tourism flow in natural heritage destinations,” in Preceedings of the Heritage, Tourism and Hospitality International Conference “Living Heritage and Sustainable Tourism”, eds L. Cantoni, S. De Ascaniis, and K. Elgin-Nijhuis (Lugano: Università della Svizzera Italiana), 15–28.
Stöckl, H., Caple, H., and Pflaeging, J. (2020). Shifts Towards Image-centricity in Contemporary Multimodal Practices. London: Routledge.
Keywords: empirical multimodality, tourism discourse, visual communication, Instagram photography, annotation system, exploratory statistics, data mining
Citation: Mattei E (2024) Approaching tourism communication with empirical multimodality: exploratory analysis of Instagram and website photography through data-driven labeling. Front. Commun. 9:1355406. doi: 10.3389/fcomm.2024.1355406
Received: 13 December 2023; Accepted: 12 February 2024;
Published: 04 March 2024.
Edited by:
Janina Wildfeuer, University of Groningen, NetherlandsReviewed by:
Nataliia Laba, The University of Sydney, AustraliaDezheng Feng, Hong Kong Polytechnic University, Hong Kong SAR, China
Copyright © 2024 Mattei. This is an open-access article distributed under the terms of the Creative Commons Attribution License (CC BY). The use, distribution or reproduction in other forums is permitted, provided the original author(s) and the copyright owner(s) are credited and that the original publication in this journal is cited, in accordance with accepted academic practice. No use, distribution or reproduction is permitted which does not comply with these terms.
*Correspondence: Elena Mattei, elena.mattei@unive.it