An Augmented Reality App to Learn to Interpret the Nutritional Information on Labels of Real Packaged Foods
 M.-Carmen Juan
 Jorge L. Charco
 Inmaculada García-García
 Ramón Mollá
- 1Instituto Universitario de Automática e Informática Industrial, Universitat Politècnica de València, Valencia, Spain
- 2Departamento de Sistemas Informáticos y Computación, Universitat Politècnica de València, Valencia, Spain
Healthy eating habits involve controlling your diet. It is important to know how to interpret the nutritional information of the packaged foods that you consume. These packaged foods are usually processed and contain carbohydrates and fats. Monitoring carbohydrates intake is particularly important for weight-loss diets and for some pathologies such as diabetes. In this paper, we present an augmented reality app for helping interpret the nutritional information about carbohydrates in real packaged foods with the shape of boxes or cans. The app tracks the full object and guides the user in finding the surface or area of the real package where the information about carbohydrates is located using augmented reality and helps the user to interpret this information. The portions of carbohydrates (also called carb choices or carb servings) that correspond to the visualized food are shown. We carried out a study to check the effectiveness of our app regarding learning outcomes, usability, and perceived satisfaction. A total of 40 people participated in the study (20 men and 20 women). The participants were between 14 and 55 years old. The results reported that their initial knowledge about carb choices was very low. This indicates that education about nutritional information in packaged foods is needed. An analysis of the pre-knowledge and post-knowledge questionnaires showed that the users had a statistically significant increase in knowledge about carb choices using our app. Gender and age did not influence the knowledge acquired. The participants were highly satisfied with our app. In conclusion, our app and similar apps could be used to effectively learn how to interpret the nutritional information on the labels of real packaged foods and thus help users acquire healthy life habits.
Introduction
A healthy lifestyle involves many aspects, including nutrition. A healthy diet is important at any age, from children to adults and seniors. A healthy diet consists of eating different types of food that provide the necessary nutrients that the body needs to feel healthy and have energy for the development of daily activities. The estimated energy requirements can be defined as “the average dietary energy intake that is predicted to maintain energy balance in a healthy adult of a defined age, gender, weight, height, and level of physical activity consistent with good health” (Food Nutrition Board, 2005). This energy is supplied mainly by carbohydrates, proteins and fats. Eating habits develop in childhood and begin to strengthen in adolescence and youth. Social, economic, and cultural factors as well as food preferences confirm the pattern of food that in many cases is maintained throughout life (Cervera-Burriel et al., 2013). There is no single type of food that contains the adequate amount of nutrients. Therefore, the balance can be achieved by combining different types of food (Gargallo, 1998). However, the increase in the production of processed foods and changes in lifestyle have led to a change in eating habits. More and more high-calorie foods, saturated fats, transgenic fats, sugar, salt, and sodium are now consumed. In addition, there are many people who do not include enough fruits, vegetables, or dietary fiber in their diet (World Health Organization, 2015). Nutritional education is a key element in adopting healthy eating habits. The three main agents in nutritional education are: family, school, and media advertising (Macias et al., 2012). The family is the first contact with food habits because its members have great influence on the diet of children and their food-related behaviors (Patrick and Nicklas, 2005). The school assumes a fundamental role in the promotion of healthy eating habits (Story et al., 2009). Television advertising is part of the human social environment. Its influence on the eating habits of children has been displacing elements such as family and school, promoting unhealthy food consumption (Harris et al., 2009).
Among the estimated energy requirements, carbohydrates (carbs) are the most important source of energy (Mataix-Verdú, 2005). They are the main source of energy in the human diet and are present in a wide range of foods, accounting for 40 to 80% of the total energy intake (Nishida and Martinez-Nocito, 2007). Carbs are found in all foods, with the exception of fresh meats and fats. Carb choices (also called portions of carbs, carbohydrate servings or carb exchanges) are a measure that is used to count carbs. Carb choices are measured in grams. The total number of grams of carbs of food are found on the nutrition facts label of commercial packaged foods. The current equivalence used in Spain, most of Europe and Japan is 10 grams of carbs = 1 carb choice. Other countries use different equivalences (e.g., in the US, Canada, Australia, South Asia, India, Russia and most of Latin America, 15 grams of carbs = 1 carb choice. In Austria, 12 grams of carbs = 1 carb choice).
Carb-choice intake is important for all people. Moreover, it is especially important for people who follow a diet where carb intake is limited. Weight-loss diets usually allow limited consumption of carbs. In this case, it is important to know the carb choices that can be consumed and how many carb choices the food contains. In some cases, it is crucial to know this information, as in the case of diseases such as diabetes. For diabetic patients, carb control is essential because there is a direct relationship between carb intake and the level of blood glucose. Knowing how to calculate the number of carb choices that a meal contains can help to appropriately control the disease. In summary, the goal of carb-choice counting is to keep the amount of carbs that you eat consistent from day to day, and meal to meal.
Augmented Reality (AR) can be used to help in the learning process (Bacca et al., 2014; Radu, 2014; Akçayir and Akçayir, 2017; Chen et al., 2017; Sirakaya and Alsancak-Sirakaya, 2018). The latest advances in hardware and software, as well as their exponential trend, position AR as a technology that can help in many fields, particularly in education. One of the most widely used SDKs (Software Development Kit) for the development of mobile AR apps is Vuforia® Engine (https://developer.vuforia.com). One of the functionalities that Vuforia® Engine includes is that it tracks both multi-targets (objects with the shape of boxes) and cylinder targets (objects with the shape of glasses or cans). This functionality can be used to recognize real objects that have these characteristics. An example in which this functionality is ideal is the recognition of packaged foods that can be found in a supermarket or at home. Once the object has been recognized, the user can be helped in different ways, one of which is knowing how to interpret the nutritional information of the labels. This recognition of objects cannot be achieved if only one side or part of the object is recognized. The object has to be fully recognized.
The main goal of this work was to design, develop, and validate an AR app to help users learn about the carb choices that are contained in real packaged foods. For the validation, we carried out a study to verify the effectiveness of our app regarding learning and satisfaction. Our main hypothesis is that users would have a statistically significant increase in knowledge about the carb choices contained in real packaged foods after using our app.
In this paper, section Literature Review reviews the literature of AR and Mobile AR for educational purposes. It also focuses on previous works of AR that are related to counting carb choices and mentions the contributions of our work. Section Application Design details the functionality of our app, its design, and its development. Section Description of the study describes the sample of our study, the questionnaires used, and the protocol followed. Section Results analyzes the data collected during the study. Section Discussion discusses our app and our study. Conclusions and future research are included in Section Conclusion.
Literature Review
Augmented Reality and Mobile Augmented Reality for Educational Purposes
According to Azuma (1997), AR “enhances a user's perception and interaction with the real world. The virtual objects display information that the user cannot directly detect with his own senses. The information conveyed by the virtual objects helps a user to perform real-world tasks.” AR creates automatic, direct, and actionable links between computer generated objects and the physical environment. AR creates an immediate user interface to a computer enhanced physical environment (Schmalsteig and Hollerer, 2016). This definition of AR is mainly related to the sense of sight. However, the increase of information can involve other senses such as hearing, touch, or smell. On the other hand, mobile AR can be defined as the use of handheld devices to experience AR in a ubiquitous way.
Different fields have successfully used AR [e.g., education (Sirakaya and Alsancak-Sirakaya, 2018) or psychology (Juan et al., 2005)]. AR offers many possibilities for education as different research studies have already shown. AR can be exploited by enhancing users' interaction with the real world and their perception (Kesim and Ozarslan, 2012). AR engages, stimulates, and motivates students to explore study materials from different perspectives (Kerawalla et al., 2006), helps in teaching subjects where learners could not realistically obtain first-hand experience in the real-world (e.g., astronomy) (Shelton and Hedley, 2002), increases collaboration among students and between students and instructors (Billinghurst and Kato, 2002), promotes imagination and creativity (Sielhorst et al., 2008), helps students control their learning at their own pace and in their own way, and allows its suitability for different learning styles.
Recently, AR is receiving increasing interest in education as evidenced by the reviews carried out since 2014. Five reviews about AR in education have been carried out since 2014 (Bacca et al., 2014; Radu, 2014; Akçayir and Akçayir, 2017; Chen et al., 2017; Sirakaya and Alsancak-Sirakaya, 2018). Moreover, Ibañez and Delgado-Kloos (2018) carried out a review about AR to support learning in mathematics, science, engineering, and technology. A review about AR in healthcare education has also been presented (Zhu et al., 2014). There have also been reviews of AR applied to other fields: for example, medical training (Barsom et al., 2016), surgery (Vávra et al., 2017), neurosurgery (Meola et al., 2017), engineering analysis, and simulation (Li et al., 2017), and maintenance (Palmarini et al., 2018).
From previous reviews about trends of AR in education (Bacca et al., 2014; Radu, 2014; Zhu et al., 2014; Akçayir and Akçayir, 2017; Chen et al., 2017; Ibañez and Delgado-Kloos, 2018; Sirakaya and Alsancak-Sirakaya, 2018), we can conclude the following: the number of educational AR studies has increased over the years; AR provides many avantages for learning; and mobile devices are being used in many of the apps.
Even though AR has been used successfully, it is a technology that can still be exploited. Furthermore, several reports predict a large increase in AR in the coming years. One of these reports (Markets and Markets Report, 2017a) forecasts that the AR market, which was valued at 2.39 billion dollars in 2016, is expected to reach 61.39 billion dollars by 2023, with an annual growth rate of 55.71%.
Mobile devices have experienced a great proliferation in recent years. This implies that most citizens can install and use all applications developed for mobile devices. With regard to hardware, mobile phones are becoming more powerful and include more sensors. They include several rear and front cameras with increasing MP and functionalities, large displays, fast CPUs, graphics acceleration, GPS sensors, compass/accelerometers, or gyroscopes. Moreover, mobile devices can be combined with head-mounted viewers, so the users can have an inexpensive AR platform. All of these aspects have opened up a wide range of possibilities for research and commercial activity. With this progress in AR, ubiquitous context-aware learning or mobile learning becomes easy and borderless (Cho et al., 2007). Mobile AR has revolutionized the presentation of information to students and is of particular interest for training and education (Specht et al., 2011; Nincarean et al., 2013; Chatzopoulos et al., 2017). The combination of technology with adequate pedagogical foundations has facilitated improvement in the quality of learning experiences (Nincarean et al., 2013). Mobile AR can provide continuous and autonomous instruction to students any place, anytime, and at any pace. It provides flexible mobility and is independent of the location without restricting the user to a specific area.
Contribution of the Work
To our knowledge, there are only three mobile AR apps that focus on teaching nutritional habits that are specifically related to counting carb choices. Domhardt et al. (2015) developed a mobile AR app for estimating the carb choices of real foods. This app focuses on patients with diabetes. The app calculates the volume of real food and its weight, which is presented on real dishes. The app uses a reference marker. The marker must be placed in front of the dish. The marker and the dish must be captured by the mobile camera. Then, the app shows a virtual mesh with the shape of the real food. The user redraws the shape of the mesh by touching the screen to fit the exact volume. A study involving eight patients was carried out. Their results reported that error was reduced by at least six grams of carbs in 44% of the estimations.
Rollo et al. (2017) studied to what extent an AR portion size app (ServAR) helped in estimating standard servings (carb choices). ServAR showed virtual carb choices on a real dish using an iPad Mini. They included nine foods (pasta, rice, broccoli, green beans, cauliflower, corn, carrots, potatoes, and kidney beans). The study involved 90 adults that were randomized into: (1) no information/aid (control group); (2) verbal information on standard servings; or (3) ServAR. Their results showed that ServAR significantly improved carb-choice accuracy and demonstrated potential as a tool to support the estimation of carb choices.
ARBreakfast (Calle-Bustos et al., 2017) is an AR app that supports therapeutic education for patients with diabetes. The app helps participants learn about the carb choices of several foods. The app presents virtual foods on a real dish. The dish has an image target with a circular shape in its center. The carb choices associated to the visualized food are shown on the left side of the screen. Calle-Bustos et al. (2017) carried out a study to check the effectiveness of the app regarding learning. Their study involved 70 children with diabetes between 5 and 14 years old. Their results indicated that the participants' initial knowledge about carb choices was low. The authors argued that patients with diabetes need therapeutic education. Their results reported that the participants learned about carb choices with their app.
In conclusion, the proposal of our work is totally different from the three most closely related works. None of them use real packaged foods and do not help to interpret the nutritional information of labels. Therefore, the two main contributions of our work are: (1) the use of real packaged foods as AR targets; and (2) the first mobile AR app that helps to interpret the nutritional information of labels of real packaged foods. Our app could be used for social awareness about carb-choice counting and helping people to have healthy food habits.
Application Design
Description of the App
The app guides the user in finding the correct surface or area of the packaged food where the nutritional information appears. Once the camera of the device focuses on one of the packaged foods that the app recognizes, it guides the user to the correct surface or area by means of arrows. Once the required surface or area has been found, an oval with a certain level of transparency overlaps the nutritional information of the real packaged food. The user must touch this oval. The help information for interpreting the nutritional information appears on the left side of the screen of the device. The phases in the app are as follows. Figure 1 summarizes these phases. A video (in Spanish) that shows how our app works can be found in the Supplementary Material.
1. Customization phase. In this phase, the user is asked to introduce her/his age. Afterwards, the app shows the carb choices recommended for her/his age for: (1) the whole day; (2) for breakfast; and (2) for the afternoon snack. The equivalence used is 1 carb choice = 10 grams of carbs.
2. Training phase. Figure 2 shows a flowchart in which the workflow of the training phase is detailed. In this phase, the user is asked to use the app to find the nutritional information of five packaged foods. The current app only includes five packaged foods. The five foods are shown one by one. The packaged foods must be found one after the other, in the order established in the app, which is an aspect that could be changed in future versions. In this training phase, the picture of the first packaged food that the user must find is shown on the left side of the screen. The user must use the camera of the device to focus on the requested real packaged food. Once the requested real packaged food is located, if it is on the correct surface or area, an oval with a certain level of transparency overlaps the area where the nutritional information is on the real packaged food. The user can observe this information in more detail. In the lower part of the oval, the word “Press” appears. If the user touches this oval, the app shows the help information for interpreting the nutritional information on the left side of the screen. The app offers additional information for three packaged foods. In those cases, another “+Info” button appears on the left-lower area of the screen. For example, for the chocolate bar, the carb choices for a small square of a chocolate bar appears on the right side of the screen. If the user does not focus on the surface or area of the packaged food where the nutritional information is located, an arrow is overlapped on the package in order to guide the user to locate the correct surface or area. Figure 3 shows an arrow and how the user is guided to rotate the real packaged food. Once the user has finished with one packaged food, he/she can go to the next one by pressing the “Next” button. This process is repeated for the five packaged foods that are included in the current version.
3. Test phase. This phase follows the training phase. It assesses the knowledge acquired during the training phase. In this phase, the user is asked to answer a multiple-choice question about the carb choices of five packaged foods. Two of the packaged foods were already seen in the training phase and three packaged foods are new. For each packaged food, the app shows a picture and three possible answers. The user observes the real packaged food (the same packaged food shown in the picture) and has to choose one of the three possible answers. No information is given to the user about successes or failures during this phase. After answering the five questions, a screen with the number of correct and erroneous answers is displayed.
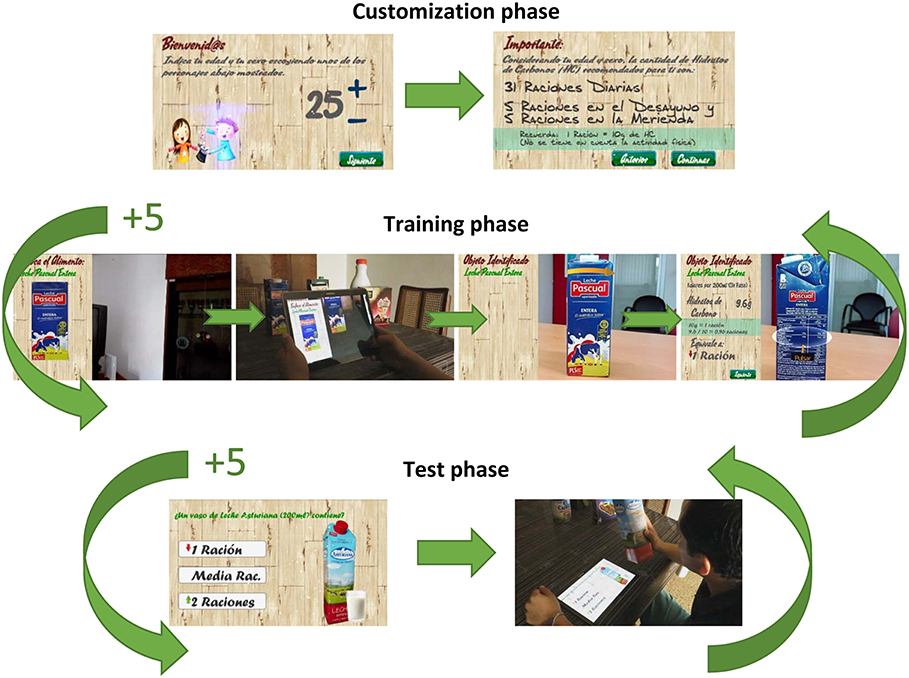
Figure 1. Phases of the app. (1) Customization phase. The users introduce their age and gender and the app shows the daily recommended carb choices. (2) Training phase. It is repeated for 5 packaged foods. The app shows the physical packaged food to be searched. The device camera focuses on the packaged food. A virtual arrow indicates that the food must be rotated to locate the nutritional information. A virtual oval indicates where the nutritional information is. By touching on the oval, the nutritional information appears on the left side of the screen. (3) Test phase. It is repeated for 5 packaged foods. A photo of the physical food packaged as well as the possible answers are shown on the screen. Using the real packaged food, the users calculate the carb choices and select their answer.
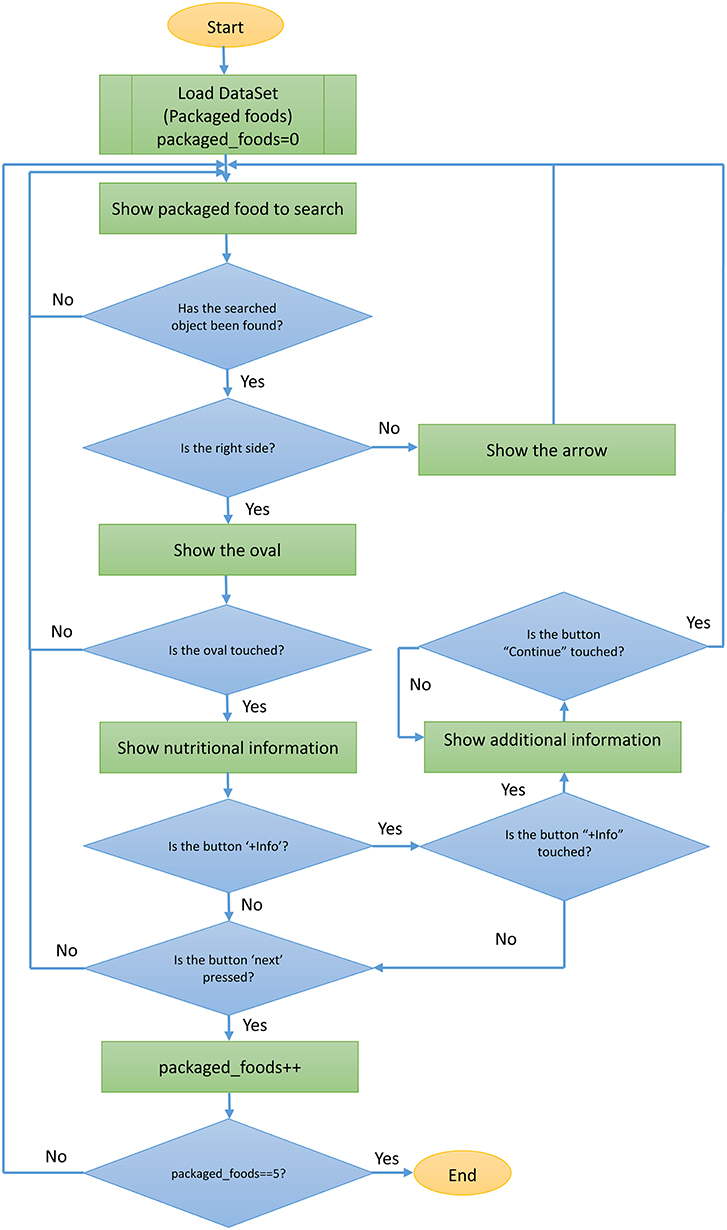
Figure 2. Flowchart of the training phase.
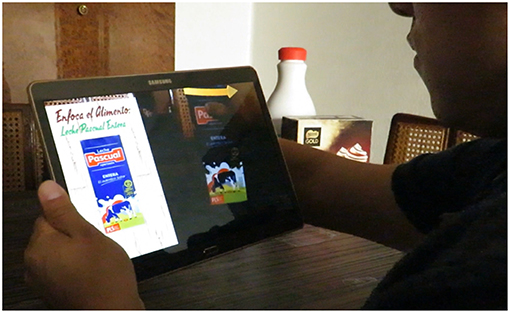
Figure 3. Training phase. An arrow is overlapped on the packaged food to guide the user by indicating the direction in which the packaged food has to be rotated.
Design and Development
The top three most common challenges in the development of mobile apps are: (1) the development approach; (2) the screen size; and (3) the device compatibility. In our case, we overcame these challenges as follows:
1. For the development approach, we studied the available development frameworks and platforms and we chose Unity and Vuforia® Engine.
2. Current apps need to support a wide variety of different screen resolutions. The User Interface System in Unity includes a variety of tools for this purpose. We have used these tools to assure that our app is compatible with different screen sizes.
3. Device compatibility. The union of Vuforia® Engine and Unity facilitates the development of apps for iOS, Android, and UWP mobile devices. In our case, we chose to develop this first version for Android mobile devices. To do this, we installed the required Android SDK. Xcode is required for iOS. With Unity, it is possible to compile once and run anywhere. Therefore, once the necessary software has been installed and the app has been developed, the run platform can be selected. The same code can be used for building apps for different platforms, e.g., for Android or iOS mobile devices.
Unity (also called Unity3D) is a cross-platform game engine (http://unity3d.com). C# can be used for scripting in Unity. Unity integrates the Vuforia® Engine in version 2017.2 and later versions (https://developer.vuforia.com). Vuforia recognizes and tracks different types of fiducials in real time. Vuforia can recognize and track the following: image targets, multi-targets, cylinder targets, object targets, model targets, and VuMarks. Moreover, Vuforia includes Ground Plane, which enables placing digital content on horizontal surfaces such as floors or tables. Vuforia also provides support for digital eyewear devices for both optical see-through (e.g., Epson Moverio BT-200, ODG R-7, and Microsoft HoloLens) and video see-through (e.g., Vuzix M300). In our app, we used photographs of real packaged foods as multi-targets, image targets, or cylinder targets depending on the shape of the real packaged food. Our app only needs the real packaged food and does not require adding any other element (e.g., additional image targets or markers). Figure 4 shows a screenshot of the development of the app using Unity and Vuforia.
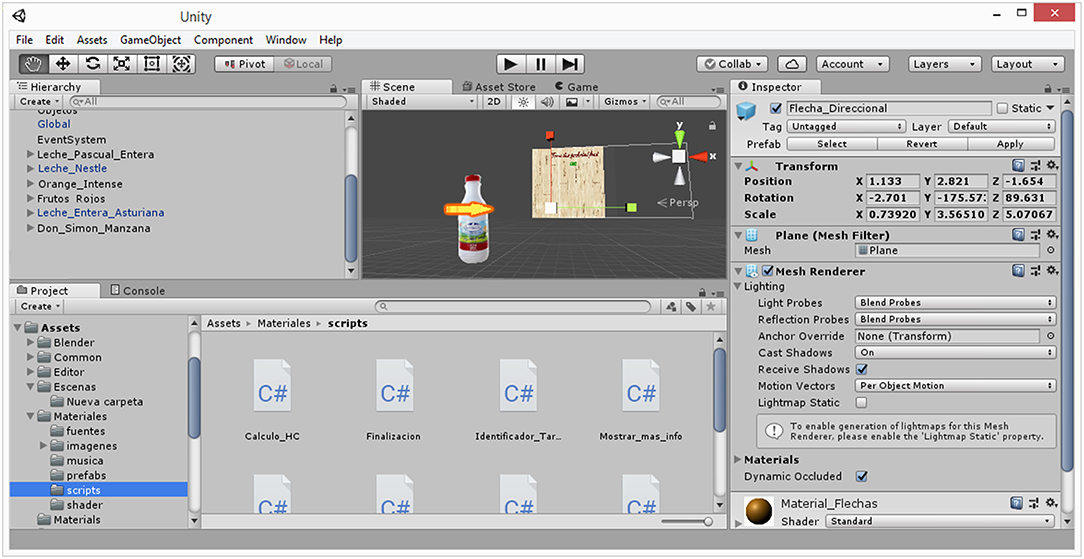
Figure 4. Screenshot of the development of the app using Unity and Vuforia® Engine.
The development and testing of the app were achieved using an Android tablet (Samsung Galaxy Tab S). Our app can run on nearly any Android device. It is platform independent. A camera with 5 MP or more is recommended because a camera with a lower resolution (e.g., 2 MP) could have more problems recognizing the image target. One possible solution for these problems would be to adequately illuminate the scene or to choose an appropriate distance between the target and the camera.
Description of the Study
Our main hypothesis was that users would have a statistically significant increase in knowledge about the carb choices of real packaged foods after using our app. To corroborate this hypothesis, we designed an uncontrolled study. It was an uncontrolled study because it evaluated the response to the use of our app in the same group of subjects. The evaluation was performed before and after the use of our app. Each subject acted as their own control. Uncontrolled studies allow the effectiveness of a measure to be evaluated, which in our case is the use of the AR app.
A total of 40 people participated in the study. There were 20 men (50%) and 20 women (50%). They were between 14 and 55 years old. The mean age was 30.50 ± 10.31 years old. The participants were 65 students, 12.5 professors, 12.5 university staff, and 10% researchers. They were recruited at the Universitat Politècnica de València through campus advertising.
In this study, three different questionnaires were used.
• Pre-test (Q1): The user fills out this questionnaire before using the app. The questionnaire measures the knowledge of the users before using the app. In the questionnaire, there are five images of real foods. The user is asked about the number of carb choices contained in the foods. The participants must fill out the upper boxes and indicate the carb choices for the foods. Two of these packaged foods included in the Pre-test and Post-test questionnaires are shown in Figure 5.
• Post-test (Q2): The user fills out this questionnaire after using the app. It contains the same number of questions as the previous questionnaire. The questionnaire is used to evaluate the knowledge acquired with the use of the app.
• Usability and Satisfaction Questionnaire (Q3): This is the last questionnaire to be filled out by the user. It consists of 32 questions about usability and satisfaction, in which the user has to evaluate each one on a scale of 1 to 7, where 1 means that the user indicates “Totally disagree” and 7 means that the user indicates “Totally agree.” See Table 1 (only the first and second columns).
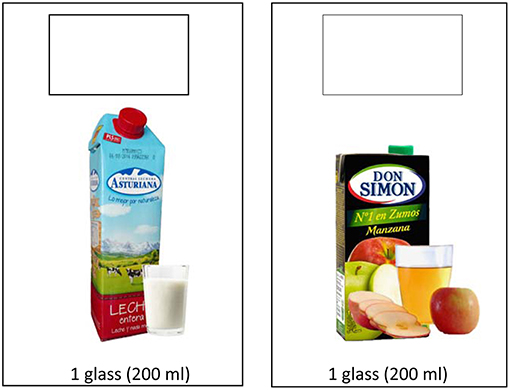
Figure 5. Example of packaged foods included in the Pre-test and Post-test questionnaires.
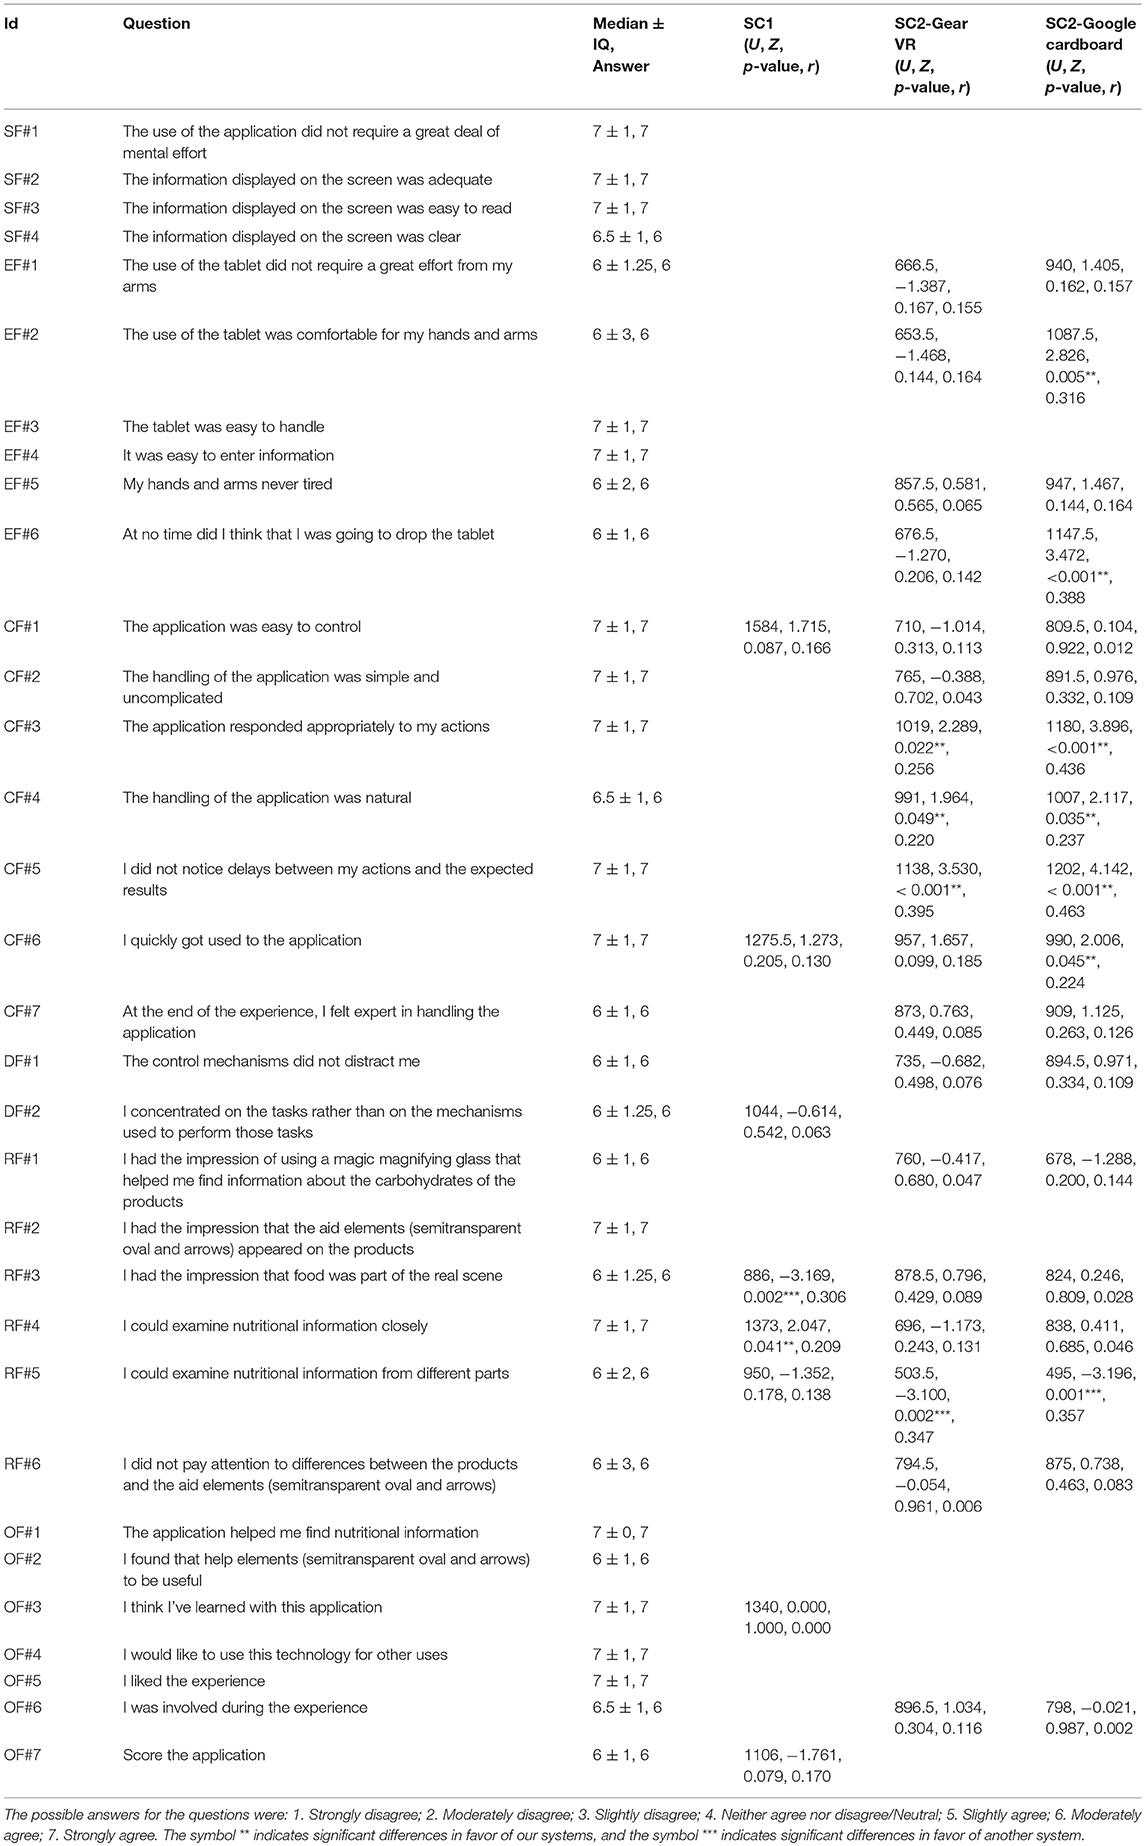
Table 1. Questionnaire and Analysis.
For virtual reality, presence is defined as a context-dependent and individual user response that is related to the experience of “being there” (Bowman and McMahan, 2007). Regenbrecht and Schubert (2002) argued that this definition cannot be used in the same way for AR. Nevertheless, presence can also be achieved in AR, and the experienced presence of augmented objects can be measured (Regenbrecht and Schubert, 2002). We have added several questions to the Q3 questionnaire to measure the AR sense of presence. The questionnaires of (Witmer and Singer, 1998) and Regenbrecht and Schubert (2002) were used as the basis and were adapted to our study. The Q3 questionnaire is detailed in Table 1 (only the first and second columns). The factors considered are the following (Regenbrecht and Schubert, 2002):
• Realism Factors (RF): Information consistent with the objective world, meaningfulness of experience, and scene realism.
• Distraction Factors (DF): Interface awareness and selective attention.
• Sensory Factors (SF): Environmental richness, sensory modality, consistency of multimodal information, multimodal presentation, active search, and degree of movement perception.
• Control Factors (CF): Immediacy of control, degree of control, anticipation of events, physical environment modifiability, and mode of control.
We have also added questions related to preferences, ergonomics, and other aspects.
Procedure
The principles stated in the Declaration of Helsinki were followed in our study. The research protocol and the written informed consent form were approved by the University Ethics Committee of the Universitat Politècnica de València. The following protocol was used:
1. The participants filled out the Pre-test (Q1).
2. The participants learned by using the app.
3. They filled out the Post-test (Q2).
4. They filled out the Usability and Satisfaction Questionnaire (Q3).
Results
This section details the analysis carried out for the data collected from our study. The normality of the sample was checked and the appropriate statistical tests were applied. The symbol ** indicates the statistical significance at level α = 0.05. We used (RStudio, 2018), Version 1.1.463 to analyze our data. RStudio is a free, open source IDE (Integrated Development Environment) for R, which is a language and environment for statistical analysis (R Core Team, 2018).
Learning Outcomes
The knowledge variable indicates the number of correct answers for the five packaged foods. The data normality test reported that our data do not fit the normal distribution. For this reason, the tests used were non-parametric.
To check if there were differences between the initial knowledge (Pre-Test) (0.12 ± 0.78; 0) and the final knowledge (Post-test) (4.70 ± 0.60; 0), a Wilcoxon Signed-rank test was applied (W = 0, Z = −5.810, p < 0.001**, r = 0.650). The results reported that there were statistically significant differences between the knowledge before and after using the app in favor of the knowledge acquired after using the app (see Figure 6). We observed that nearly all of the participants had no knowledge about the calculation of the carb choices before using the app. After using it, nearly all of the participants correctly calculated the carb choices in foods. We would like to highlight that the outlier in the Pre-test corresponds to a dietitian. Therefore, she knew perfectly how to interpret the nutritional information of the labels.
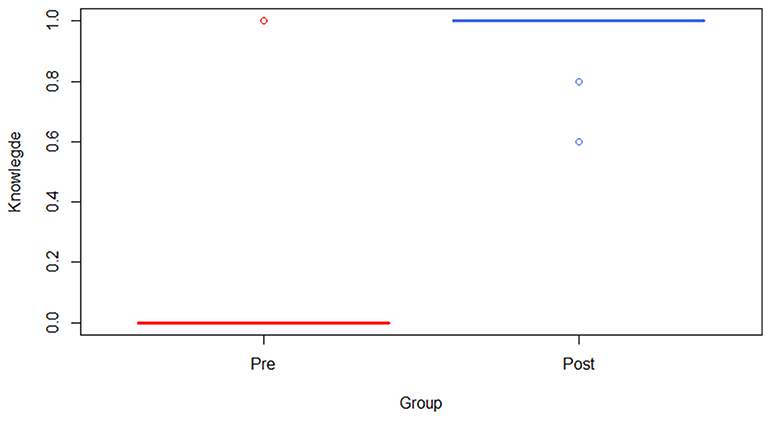
Figure 6. Box plot showing the scores of the knowledge variable before and after using the app: Pre, initial knowledge; Post, final knowledge.
We would like to note that two of the packaged foods are seen in both the training phase and in the test phase. Three packaged foods are different in the training phase and in the test phase. To determine whether or not there were differences between the number of correct answers for the two types of foods (same vs. different in the two phases), a Wilcoxon Signed-rank test was performed (W = 28, Z = 0.961, p = 0.546, r = 0.107) showing that there were no statistically significant differences between the two types of foods. Gender and age also did not indicate statistically significant differences for the two types of foods.
Satisfaction Outcomes
The data normality tests reported that the satisfaction data did not fit the normal distribution. For this reason, the tests used were non-parametric (the Mann-Whitney U-test for unpaired data, and the Kruskal-Wallis test). The means grouped by factors of this study and the two other studies with which it was compared (detailed in section Comparison of Satisfaction Outcomes with Other Studies) are shown graphically in Figure 7.
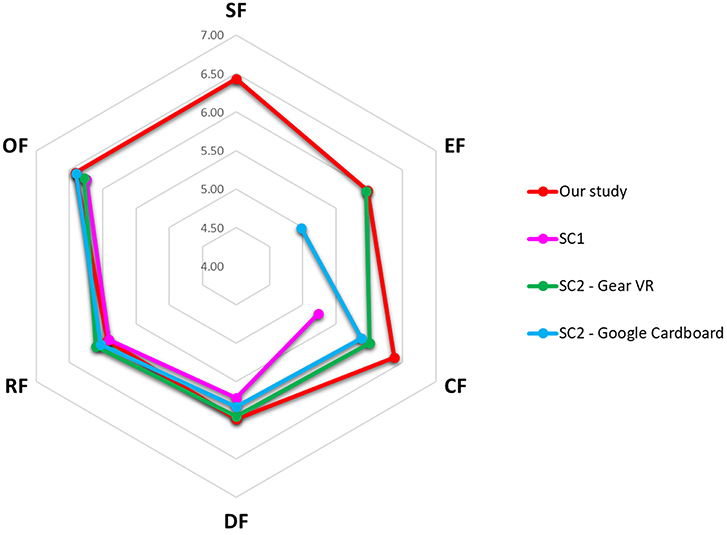
Figure 7. Radar chart showing the mean scores grouped by factors of our study, SC1 and SC2: SC1, Sample used in Calle-Bustos et al. (2017) study; SC2—Gear VR, Sample used in Juan et al. (2018) study, group that used the Gear VR; SC2—Google Cardboard, Sample used (Juan et al., 2018) study, group that used the Google Cardboard; SF, Sensory Factors; OF, Other Factor; RF, Realism Factors; DF, Distraction Factors; CF, Control Factors; EF, Ergonomic Factors.
Sensory Factor Outcomes (SF)
The questions SF#1 to SF#4 define the participants' satisfaction with the Sensory Factors of the application. From the results (see Table 1, only the first three columns), it can be observed that the median for all of the questions was very high. All of the questions have a median between 6 (Moderately agree) and 7 (Strongly agree). This implies that the participants were satisfied with the Sensory Factors of the app.
To check if Gender affected the score given to the Sensory Factors, a Mann-Whitney U-test was applied (U = 266.5, Z = 1.828, p = 0.070, r = 0.289) showing that there were no statistically significant differences between men and woman.
To check if Age affected the score, a Kruskal Wallis test was applied. The results [ = 17.586, p = 0.730, r = −0.605] showed that the satisfaction with the Sensory Factors of the app was independent from the Age factor.
Ergonomic Factor Outcomes (EF)
The questions EF#1 to EF#6 define the participants' satisfaction with the Ergonomic Factors of the app. From the results (see Table 1, only the first three columns), it can be observed that the median for all of the questions was very high, between 6 (Moderately agree) and 7 (Strongly agree). Therefore, the participants were satisfied with the Ergonomic Factors of the app.
To check if Gender affected the score, a Mann-Whitney U-test was applied (U = 229, Z = 0.788, p = 0.438, r = 0.125). The results revealed that there were no statistically significant differences between men and women.
To check if Age affected the score, a Kruskal-Wallis test was applied. The results [ = 27.43, p = 0.195, r = −0.646] showed that the satisfaction with the Sensory Factors was independent from the Age factor.
Control Factor Outcomes (CF)
The questions CF#1 to CF#7 define the participants' satisfaction with the Control Factors of the app. From the results (see Table 1, only the first three columns), it can be observed that the median for all of the questions was very high. All of the questions have a median between 6.5 (Moderately agree) and 7 (Strongly agree). This implies that the participants were satisfied with the Control Factors of the app.
To check if Gender affected the score given to the Control Factors, a Mann-Whitney U-test was applied (U = 220.5, Z = 0.559, p = 0.585, r = 0.088) showing that there were no statistically significant differences between men and woman.
To check if Age affected the score, a Kruskal-Wallis test was applied. The results [ = 16.954, p = 0.766, r = −0.610] showed that the satisfaction with the Control Factors was independent from the Age factor.
Distraction Factor Outcomes (DF)
The questions DF#1 and DF#7 define the participants' satisfaction with the Distraction Factors of the app. From the results (see Table 1, only the first three columns), it can be observed that the median for all of the questions is 6 (Moderately agree). That means that the participants were satisfied with the Distraction Factors of the app.
To check if Gender affected the score given to the Distraction Factors, a Mann-Whitney U-test was applied (U = 241, Z = 1.137, p = 0.261, r = 0.180) showing that there were no statistically significant differences between men and woman.
To check if Age affected the score, a Kruskal-Wallis test was applied. The results [ = 18.651, p = 0.667, r = −0.655] showed that the satisfaction with the Distraction Factors was independent from the Age factor.
Realism Factor Outcomes (RF)
The questions RF#1 and RF#6 define the participants' satisfaction with the Realism Factors of the app. From the results (see Table 1, only the first three columns), it can be observed that the median for all of the questions was very high. All of the questions have a median between 6 (Moderately agree) and 7 (Strongly agree). That means that the participants were satisfied with the Realism Factors of the app.
To check if Gender affected the score given to the Realism Factors, a Mann-Whitney U-test was applied (U = 216.5, Z = 0.448, p = 0.664, r = 0.071) showing that there were no statistically significant differences between men and woman.
To check if Age affected the score, a Kruskal-Wallis test was applied. The results [ = 20.725, p = 0.538, r = −0.641] showed that the satisfaction with the Realism Factors was independent from the Age factor.
Other Factor Outcomes (OF)
The questions OF#1 and OF#7 define the participants' satisfaction with the Other Factors of the app. From the results (see Table 1, only the first three columns), it can be observed that the median for all of the questions was very high. All of the questions have a median between 6 (Moderately agree) and 7 (Strongly agree). That means that the participants were satisfied with the Other Factors of the app.
To check if Gender affected the score given to the Other Factors, a Mann-Whitney U-test was applied (U = 215.5, Z = 0.424, p = 0.681, r = 0.067) showing that there were no statistically significant differences between men and women.
To check if Age affected the score, a Kruskal-Wallis test was applied. The results [ = 18.601, p = 0.670, r = −0.446] showed that the satisfaction with the Other Factors was independent from the Age factor.
We would like to highlight that the score of question OF#7 (Score the app) was quite high (Moderately agree), which indicates the participants were satisfied with the app. The answers of question OF#3 (I think I have learned with this app) was very high (Strongly agree), which indicates that the participants believed that the app was very useful for learning.
Free-Answer Questions
The Q3 questionnaire included three free answer questions that allowed the users to give their opinion about their experience. Some answers to the question “What did you like the most?” were: “The simplicity and easy handling of the app,” “How well the app recognizes the packaged foods,” “The possibilities of using the app for education,” and “The possibility of learning about eating habits.” The most remarkable answers to the question “What improvements or changes would you suggest?” were: “Add more products and more information about each product,” “The magnifying glass could enlarge the image,” “The app could be used with any product,” and “The app works in any supermarket.” And, finally, some answers to the question “What can this technology be used for?” some answers were: “To assist in nutritional training programs,” “Diets adapted to the user's profile,” “To know what we consume,” “Improvement of eating habits,” “In supermarkets to compare products,” “Control of obesity,” and “Teach a healthy diet”.
Comparison of Satisfaction Outcomes With Other Studies
This section analyzes the satisfaction outcomes of this study compared with two other studies previously published (Calle-Bustos et al., 2017; Juan et al., 2018). The acronyms SC1 and SC2 will be used to refer to these two studies, respectively. For the comparison, the same or very similar questions in the three studies were used. Our study shared 7 questions with the SC1 and 17 questions with the SC2. A Mann-Whitney U-test for unpaired data was applied. The means of the factors for the three studies are shown in Figure 7.
The SC1 (Calle-Bustos et al., 2017) uses an AR game to help children (aged 5 ± 14 years) to learn the carbohydrate content of different foods. The AR game shows virtual foods on a real dish. A total of 70 children participated in the SC1. There were 29 boys and 41 girls (mean age = 9.19 ± 2.38). In the SC1, the total sample was divided into two groups. The children were randomly assigned to each group. In the first group (Group A), the children filled out a post-knowledge questionnaire that was same as the pre-knowledge questionnaire. In the second group (Group B), the children filled out a post-knowledge questionnaire that was different from the pre-knowledge questionnaire. The two groups filled out the same usability and satisfaction questionnaire. Therefore, in this paper, we have used the total sample for comparison with the data of our study. Since the Likert scale used in the SC1 and in our study are different, we have changed the SC1 scores to adapt them to a scale of 7 points as shown in Table 2. The results of the comparison between our study and the SC1 are shown in Table 1 (column 4).
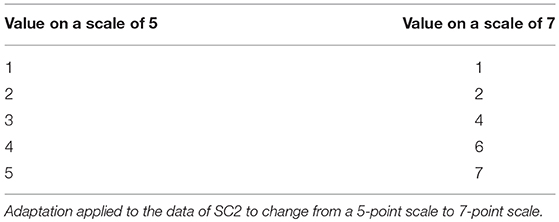
Table 2. Adaptation of scales.
The SC2 (Juan et al., 2018) uses an AR app with two head-mounted viewers (Google Cardboard and Samsung Gear VR) and compares the users' perception. The app shows four different 3D foods on a dish (one food at a time). The users can change from one food to another by simply placing their hand on a virtual button that is in a drip mat. A total of 40 adults participated in the SC2. There were 20 women and 20 men. They were between 19 and 58 years old (mean age = 26.52 ± 7.57). The total sample was divided into two groups. In the first group (Group A), the participants used Samsung Gear VR first, and afterwards they used Google Cardboard. In the second group (Group B), the participants used Google Cardboard first, and afterwards they used Samsung Gear VR. The participants were randomly assigned to each group, with the number of women and men being evenly distributed (50%). In this paper, we have compared the data of our study with the data related to the Gear VR experience. We have also compared the data of our study with the data related to the Google Cardboard experience. The results of the comparison between our study and the SC2 are shown in Table 1 [columns 5 (Gear VR) and 6 (Google Cardboard)].
Discussion
In this paper, we have presented a new mobile AR app to learn to interpret the nutritional information of labels in real packaged foods. Our app runs on mobile devices that are very familiar to children (Kerawalla et al., 2006). The number of users of mobile phones in the world is forecast to exceed five billion by 2019 (Statista, 2016). A total of 62.9% of the population worldwide had a mobile phone in 2016. Mobile phone penetration is expected to reach about 67% by 2019. The increasing popularity of smartphones has significantly influenced the growth of the mobile market. Around 38% of all mobile users used a smartphone by 2014. This number was forecasted to reach over 50% by 2018. The number of users of smartphones in the world is forecast to reach 2.7 billion by 2019. Therefore, a mobile app is an optimal option for reaching the largest possible number of users.
In our study, a person supervised the whole process. However, our app could be used without supervision at any place and time, which endows versatility in the learning process (Cho et al., 2007). To our knowledge, our app is the first mobile AR app to learn to interpret the nutritional information of real packaged foods. In a previous review about AR trends in education from 2003 to 2013 (Bacca et al., 2014), health was one of the less explored fields (3.1%). In another review work from 2011 to 2016, Chen et al. (2017) found that this percentage was 7.27%. Therefore, our work contributes to one of the less explored fields. In a report published by Markets and Markets Report (2017b), the use of VR and AR in the health market was valued at 504.5 million dollars in 2016 and is expected to reach 4997.9 million dollars in 2023, with an annual growth rate of 36.6%. Our AR app is a contribution to this health market.
The initial knowledge about carb choices of our participants was very low (a mean of 0.12 on a scale from 0 to 5). This indicates that people do not know how to interpret the labels of packaged foods. In the work of Calle-Bustos et al. (2017), even children with diabetes did not have enough knowledge about carb choices. These results indicate that everyone needs nutritional education.
With regard to the learning outcomes of using our app, the results indicated that our app has proven to be effective for learning about the nutritional information that is on the labels of packaged foods. Therefore, our main hypothesis was corroborated. This result is in line with other AR works that have argued that the use of AR (Bacca et al., 2014; Chen et al., 2017) or mobile AR (Furió et al., 2013a,b) can enhance the learning process. All of these results indicate that our app and similar apps can help people to control their eating habits. This help could be for people who want to control their weight as well as for people who need to control their eating habits for health reasons.
With regard to the number of correct answers for the two types of packaged foods (two foods were the same in the training and test phases and three foods were different in the two phases), no statistically significant difference was found. This implies that the use of the same foods or different foods is not relevant. In both cases, the participants learned by using the app. Calle-Bustos et al. (2017) also checked the increase in knowledge using two different questionnaires (using the same elements as in the pre-test vs. using different elements from the pre-test). They also did not find statistically significant differences. Calle-Bustos et al. (2017) concluded that the children learned about nutrition in both cases. Therefore, our app and the app presented by Calle-Bustos et al. (2017) are in line with each other regarding the type of study and the conclusion about the effectiveness of the apps.
To our knowledge, our AR app is the first one that tracks real packaged foods that have the shape of boxes or cans. This tracking is very different from tracking flat images like one side of a box or a part of a can. For example, if only one surface of a box were recognized, the user would have to turn the box until the app recognized the right surface. Meanwhile, the user would not have help and it might seem that the app does not work properly. The first contact with an app is vital for its success.
If a conventional way of learning were used, but with only physical objects and paper, the user would have to locate the correct surface of the packaged food and the surface to be located would have to be shown on paper. The same information that appears in the help information of the app should also be on paper. The user should read one after the other. However, this conventional way of learning could also be effective. In our study, we did not compare the increase in knowledge using traditional methods with our app. Our app could also be compared with other apps that do not use AR. In our work, after demonstrating that mobile AR can help in the interpretation of nutritional information about carb choices in real packaged foods, more studies can be carried out to compare the effectiveness of the app compared with other methods. Other works have carried out comparisons between AR apps and traditional methods. Furió et al. (2013a) reported no statistically significant differences between traditional methods and AR systems for learning outcomes. Chiang et al. (2014) carried out a comparison involving two groups of students: a control group that used an inquiry-based mobile learning app without AR and an experimental group that used a mobile AR game. Their results revealed that the average learning outcomes of the control group were significantly worse than those of the experimental group. The advantage in learning gains has also been reported in previous reviews (Bacca et al., 2014; Akçayir and Akçayir, 2017). Therefore, in preceding works, an AR app compared to traditional methods or an app without AR offers equal or greater learning outcomes. This argument implies that the learning outcomes obtained using our AR app vs. traditional methods or non-AR app could offer equal or greater learning outcomes in favor of our AR app. Nevertheless, to corroborate this hypothesis, a future study should be carried out. The corroboration of this hypothesis would strengthen the contribution of this paper. Based on related works, the results of this paper, and our previous experiences, the advantages of our AR app vs. conventional methods can be summarized as follows: (1) Our app works in any environment and does not require adding elements to the environment. It tracks real packaged foods; (2) The environment could be a supermarket and the app will help users interpret information about the packaged foods they want to buy; (3) The app can store the user's progress; (4) The learning process is interactive, continuous, and autonomous. The user can use the app in any place, anytime, and at any pace; (5) The app could increase the users' motivation, engagement, and perceived enjoyment.
To our knowledge, of the works reviewed, there are only three works that are most closely related to ours (Domhardt et al., 2015; Calle-Bustos et al., 2017; Rollo et al., 2017). However, our proposal is totally different. These three works and ours have a common feature, which is that they are AR apps for users to acquire knowledge about carb choices. The works of Domhardt et al. (2015), Calle-Bustos et al. (2017), and Rollo et al. (2017) are more focused on patients with diabetes, and our proposal is less focused on this group.
General satisfaction [with a median of 6 or more on all of the questions and when the questions were grouped by factors (Regenbrecht and Schubert, 2002)] was independent from gender and age. This result is in line with previous works in which AR apps have been used for learning and participants have shown their satisfaction (Juan et al., 2011; Calle-Bustos et al., 2017) and motivation (Chen et al., 2017). If the questions are analyzed independently, it can be observed that the questions related to fatigue and comfort at the time of using the app have a median of 6 (on a scale of 1 to 7), which is less than the rest of the majority of questions (with a median of 7). It is not a bad median, but the users note that it could be an aspect to improve. The users are handling the tablet without any support. To provide more safety and stability when the device is held and to protect the device from damage, an external case could be added as in Furió et al. (2013b) or Juan et al. (2014). This external case could be printed on a 3D printer.
With regard to the perceived learning of the app, the participants indicated that the app helped them to find nutritional information with a median of 7 (on a scale of 1 to 7) and that they thought they had learned with the app with a median of 7 (on a scale of 1 to 7). This indicates that the app was considered as a good educational tool.
With regard to the comparison about satisfaction outcomes between our study and two other works (Calle-Bustos et al., 2017; Juan et al., 2018), if the questions are grouped by factors (Figure 7), the perceived satisfaction of the participants in our study is smaller for the RF factor and higher for the rest of the factors. As can be observed in Table 1, there were no statistically significant differences for 31 questions; there were statistically significant differences for 10 questions in favor of our app; and there were statistically significant differences for only 3 questions (RF factor) in favor of the other apps. With regard to the RF factor and the differences in user perception, our explanation is that in SC1 and SC2, virtual foods appear on a real dish and the perception of the user is greater when seeing an orange on a real dish than the perception of just seeing an arrow on the packaged food. The same argument can be used for examining the virtual objects from different angles. The interest in seeing an orange from different points of view is not the same as the interest aroused by an arrow that appears on the screen. Therefore, the results for RF are coherent with our observations. From all of these results, it is possible to conclude that our results are in line with previous studies and our observations.
Our app was developed using the functionality of Vuforia for recognizing multi-targets and cylinder targets. Vuforia incorporates a new feature that allows the recognition and tracking of objects by their shape, which is called model targets (https://library.vuforia.com/articles/Solution/model-targets-user-guide.html#def). To achieve this recognition, a digital 3D representation of the object (e.g., vehicles or toys) must be processed using the Model Target Generator application. By combining this new feature with the recognition of multi-targets and cylinder targets, a greater number of packaged foods could be incorporated into the app.
Our app could also be improved by incorporating SLAM-based AR to guide users in an indoor environment (e.g., in a supermarket to guide them to the desired food area). Once the correct food area is located, the app can guide them to find the desired packaged food and then help them to interpret the nutritional information of the label. Currently, the Ground Plane functionality incorporated in Vuforia is not powerful enough to incorporate this functionality in the app. Nowadays, the described extensions would be possible using Tango SDK. In the future, thanks to the incorporation of new sensors in mobile devices, these extensions will surely be possible using the new functionalities of Vuforia, ARCore, or ARKit. Finally, as stated, the current situation of AR and its presumed evolution open up a wide range of possibilities for the development of new apps, particularly for helping improve eating habits.
Conclusion
This work presents a mobile AR app for helping interpret the nutritional information about carb choices in real packaged foods. To our knowledge, this is the first AR app that works directly on real packaged foods without needing to use additional image targets or markers. The app tracks real objects that have the shape of boxes or cans. The results show that the app has proven to be effective when acquiring knowledge about nutritional information. The requirements of our mobile AR app are minimal. From our point of view, it is a pervasive educational app with many possibilities.
We identify two main limitations in our study: sample profile, and sample size. The sample of our study was comprised of 40 participants. Research studies with a much larger sample size could ensure the generalization of the findings of this study. The participants were recruited at the university campus. Not all of the participants were students (65%). Their ages ranged between 14 and 55 years old. However, they were relatives of members of the university. A sample comprised of people with different profiles could ensure the generalization of the findings of this study. These two limitations could be addressed in a future study. Moreover, the app could be enhanced by adding information about other nutritional information (e.g., fats), information adapted to specific diseases, etc. The app could be adapted to other countries (e.g., allowing the language or the carb choice equivalences to be changed). Validations in other countries could also be carried out. With this work, we hope to help people learn about the nutrients contained in packaged foods and to realize the importance of a healthy diet and a healthy lifestyle.
Ethics Statement
The study was conducted according to the principles stated in the Declaration of Helsinki. The University Ethics Committee of the Universitat Politècnica de València approved the research protocol and the written informed consent form that the participants signed.
Author Contributions
M-CJ and JC: conceived, designed, and developed the app. M-CJ, JC, IG-G, and RM: performed the experiments, analyzed the data, and wrote the paper.
Conflict of Interest Statement
The authors declare that the research was conducted in the absence of any commercial or financial relationships that could be construed as a potential conflict of interest.
Acknowledgments
We would like to thank the people who participated in the study as well as the reviewers for their valuable comments.
Supplementary Material
The Supplementary Material for this article can be found online at: https://www.frontiersin.org/articles/10.3389/fcomp.2019.00001/full#supplementary-material
References
Akçayir, M., and Akçayir, G. (2017). Advantages and challenges associated with augmented reality for education: a systematic review of the literature. Edu. Res. Rev. 20:1e11. doi: 10.1016/j.edurev.2016.11.002
Azuma, R. (1997). A survey of augmented reality. Presence 6, 355–385. doi: 10.1162/pres.1997.6.4.355
Bacca, J., Baldiris, S., Fabregat, R., and Graf, S. K. (2014). Augmented reality trends in education: a systematic review of research and applications. J. Educ. Technol. Soc. 17, 133–149.
Barsom, E. Z., Graafland, M., and Schijven, M. P. (2016). Systematic review on the effectiveness of augmented reality applications in medical training. Surg. End. 30, 4174–4183. doi: 10.1007/s00464-016-4800-6
Billinghurst, M., and Kato, H. (2002). Collaborative augmented reality. Commun. ACM, 45, 64–70. doi: 10.1145/514236.514265
Bowman, D., and McMahan, R. (2007). Virtual reality: how much immersion is enough? Computer 7, 36–43. doi: 10.1109/MC.2007.257
Calle-Bustos, A. M., Juan, M. C., García-García, I., and Abad, F. (2017). An augmented reality game to support therapeutic education for children with diabetes. PLoS ONE 12:e0184645. doi: 10.1371/journal.pone.0184645
Cervera-Burriel, F., Serrano-Urrea, R., Vico-García, C., Milla-Tobarra, M., and García-Meseguer, M. (2013). Hábitos alimentarios y evaluación nutricional en una población universitaria. Nutri. Hospital. 28, 438–446. doi: 10.3305/nh.2013.28.2.6303
Chatzopoulos, D., Bermejo, C., Huang, Z., and Hui, P. (2017). Mobile augmented reality survey: from where we are to where we go. IEEE Access 5, 6917–6950. doi: 10.1109/ACCESS.2017.2698164
Chen, P., Liu, X., Cheng, W., and Huang, R. (2017). “A review of using augmented reality in education from 2011 to 2016,” in Innovations in Smart Learning. Lecture Notes in Educational Technology, eds E. Popescu, et al. (Singapore: Springer).
Chiang, T. H., Yang, S. J., and Hwang, G.-J. (2014). An augmented reality-based mobile learning system to improve students' learning achievements and motivations in natural science inquiry activities. J. Edu. Technol. Soc. 17, 352–365.
Cho, K., Lee, J., Soh, J., and Yang, H. S. (2007). “A realistic e-learning system based on mixed reality,” in Proceedings of the 13th Intl Conference on Virtual System and Multimedia (Brisbane, QLD), 57–64.
Domhardt, M., Tiefengrabner, M., Dinic, R., Fötschl, U., Oostingh, G. J., Stütz, T., et al. (2015). Training of carbohydrate estimation for people with diabetes using mobile augmented reality. J. Diab. Sci. Technol. 9, 516–524. doi: 10.1177/1932296815578880
Food and Nutrition Board (2005). Dietary Reference Intakes for Energy. Carbohydrate, Fiber, fat, Fatty Acids, Cholesterol, Protein, and Amino Acids. Washington, DC: The National Academies Press.
Furió, D., González-Gancedo, S., Juan, M. C., Seguí, I., and Costa, M. (2013b). The effects of the size and weight of a mobile device on an educational game. Computers Edu. 64, 24–41. doi: 10.1016/j.compedu.2012.12.015
Furió, D., González-Gancedo, S., Juan, M. C., Seguí, I., and Rando, N. (2013a). Evaluation of learning outcomes using an educational iPhone game vs. traditional game. Computers Edu. 64, 1–23. doi: 10.1016/j.compedu.2012.12.001
Gargallo, M. (1998). “La dieta equilibrada. Los siete grupos de alimentos,” in Alimentación y Nutrición. Manual Teórico Práctico, eds C. Vázquez, A. I. de Cos, C. López-Nomdedeu (Madrid: Díaz de Santos, 65–77.
Harris, J., Bargh, J., and Brownell, K. (2009). Priming effects of television food advertising on eating behavior. Health Psychol. 28, 404–413. doi: 10.1037/a0014399
Ibañez, M.-B., and Delgado-Kloos, C. (2018). Augmented reality for STEM learning: a systematic review. Computers Edu. 123, 109–123. doi: 10.1016/j.compedu.2018.05.002
Juan, M. C., Alcañiz, M., Monserrat, C., Botella, C., Baños, R. M., and Guerrero, B. (2005). Using augmented reality to treat phobias. IEEE Computer Graphics Appl. 25, 31–37. doi: 10.1109/MCG.2005.143
Juan, M. C., Furió, D., Alem, L., Ashworth, P., and Cano, J. (2011). “ARGreenet and BasicGreenet: Two mobile games for learning how to recycle,” in International Conferences in Central Europe on Computer Graphics, Visualization and Computer Vision. Paper Code: H61 (Pilsen), 25–32.
Juan, M. C., García-García, I., Mollá, R., and López, R. (2018). Users' perceptions using low-end and high-end mobile-rendered HMDs: a comparative study. Computers 7:15. doi: 10.3390/computers7010015
Juan, M. C., Mendez-Lopez, M., Perez-Hernandez, E., and Albiol, S. (2014). Augmented Reality for the assessment of children's spatial memory in real settings. PLoS ONE 9:e113751. doi: 10.1371/journal.pone.0113751
Kerawalla, L., Luckin, R., Selijefot, S., and Woolard, A. (2006). Making it real: Exploring the potential of augmented reality for teaching primary school science. Virtual Reality 10, 163–174. doi: 10.1007/s10055-006-0036-4
Kesim, M., and Ozarslan, Y. (2012). Augmented reality in education: current technologies and the potential for education. Proc. Soc. Behav. Sci. 47, 297–302. doi: 10.1016/j.sbspro.2012.06.654
Li, W., Nee, A. Y. C., and Ong, S. K. (2017). A state-of-the-art review of augmented reality in engineering analysis and simulation. Multimodal Technol. Inter. 1:17. doi: 10.3390/mti1030017
Macias, M., Gordillo, S., and Camacho, R. (2012). Eating habits in school-age children and the health education paper. Revista Chilena Nutri. 39, 40–43. doi: 10.4067/S0717-75182012000300006
Markets Markets Report (2017a). Augmented Reality Market by Offering (Hardware (Sensor, Displays and Projectors, Cameras), and Software), Device Type (Head-Mounted, Head-Up, Handheld), Application (Enterprise, Consumer, Commercial, Automotive) and Geography - Global forecast to 2023. Available online at: http://www.marketsandmarkets.com/Market-Reports/augmented-reality-market-82758548.html (accessed July 22, 2018).
Markets Markets Report (2017b). Augmented and Virtual Reality in Healthcare Market by Offering (Hardware and Software), Device Type, End User, Application (Patient Care Management, Medical Training and Education, Pharmacy Management, Surgery), and Geography - Global Forecast to 2023. Available online at: http://www.marketsandmarkets.com/Market-Reports/augmented-reality-virtual-reality-healthcare-market-220832469.html (accessed July 22, 2018).
Meola, A., Cutolo, F., Carbone, M., Cagnazzo, F., Ferrari, M., and Ferrari, V. (2017). Augmented reality in neurosurgery: a systematic review. Neurosurg. Rev. 40, 537–548. doi: 10.1007/s10143-016-0732-9
Nincarean, D., Ali, M. B., Halim, N. D. A., and Rahman, M. H. A. (2013). Mobile augmented reality: the potential for education. Proc. Social Behav. Sci. 103, 657–664. doi: 10.1016/j.sbspro.2013.10.385
Nishida, C., and Martinez-Nocito, F. (2007). FAO/WHO Scientific Update on carbohydrates in human nutrition: introduction. Eur. J. Clin. Nutri. 61, S1–S4. doi: 10.1038/sj.ejcn.1602935
Palmarini, R., Erkoyuncu, J. A., Roy, R., and Torabmostaedi, H. (2018). A systematic review of augmented reality applications in maintenance. Robotics Computer Integr. Manufact. 49, 215–228. doi: 10.1016/j.rcim.2017.06.002
Patrick, H., and Nicklas, T. (2005). A review of family and social determinants of children's eating patterns and diet quality. J. Am. College Nutri. 24, 83–92. doi: 10.1080/07315724.2005.10719448
R Core Team (2018). R: A Language and Environment for Statistical Computing. Vienna: R Foundation for Statistical Computing. Available online at: http://www.R-project.org
Radu, I. (2014). Augmented reality in education: a meta-review and cross-media analysis. Personal Ubiquitous Compu. 18, 1533–1543. doi: 10.1007/s00779-013-0747-y
Regenbrecht, H., and Schubert, T. (2002). “Measuring presence in augmented reality environments: design and a first test of a questionnaire,” in Proceedings of the Fifth Annual International Workshop Presence (Porto), 1–7.
Rollo, M. E., Bucher, T., Smith, S., and Collins, C. E. (2017). The effect of an augmented reality aid on error associated with serving food. J. Nutri. Intermed. Metabo. 8, 90–90. doi: 10.1016/j.jnim.2017.04.111
RStudio (2018). RStudio: Integrated Development Environment for R (Version 1.1.463). Boston, MA. Available online at: http://www.rstudio.org (Retrieved May 15, 2018).
Schmalsteig, D., and Hollerer, T. (2016). “Augmented reality: principles and practice,” in ACM SIGGRAPH 2016 Courses (SIGGRAPH '16) (New York, NY: ACM), 6. doi: 10.1145/2897826.2927365
Shelton, B. E., and Hedley, N. R. (2002). “Using augmented reality for teaching earth-sun relationship to undergraduate geography students,” in The First IEEE International Augmented Reality Toolkit Workshop (Darmstadt), 1–8.
Sielhorst, T., Feuerstein, M., and Navab, N. (2008). Advanced medical displays: a literature review of augment reality. J. Display Display Technol. 4, 451–467. doi: 10.1109/JDT.2008.2001575
Sirakaya, M., and Alsancak-Sirakaya, D. (2018). Trends in educational augmented reality studies: a systematic review. Malaysian Online J. Edu. Technol. 6, 60–74. doi: 10.17220/mojet.2018.02.005
Specht, M., Ternier, S., and Greller, W. (2011). Mobile augmented reality for learning: a case study. J. Res. Center Edu. Technol. 7, 117–127.
Statista (2016). Number of Mobile Phone Users Worldwide From 2015 to 2020 (in billions). Available online at: https://www.statista.com/statistics/274774/forecast-of-mobile-phone-users-worldwide (accessed July, 2018).
Story, M., Nanney, M., and Schwartz, M. (2009). Schools and obesity prevention: creating school environments and policies to promote healthy eating and physical activity. Milbank Q. 87, 71–100. doi: 10.1111/j.1468-0009.2009.00548.x
Vávra, P., Roman, J., Zonča, P., Ihnát, P., Němec, M., Kumar, J., et al. (2017). Recent development of augmented reality in surgery: a review. J. Healthcare Eng. 2017:4574172. doi: 10.1155/2017/4574172
Witmer, B. G., and Singer, M. J. (1998). Measuring presence in virtual environments: a presence questionnaire. Presence 7, 225–240. doi: 10.1162/105474698565686
World Health Organization (2015). Healthy Diet. Available online at: http://www.who.int/mediacentre/factsheets/fs394/en/ (accessed July 22, 2018).
Keywords: augmented reality, app, mobile devices, object recognition, education, nutrition, carb choices, healthy life habits
Citation: Juan M-C, Charco JL, García-García I and Mollá R (2019) An Augmented Reality App to Learn to Interpret the Nutritional Information on Labels of Real Packaged Foods. Front. Comput. Sci. 1:1. doi: 10.3389/fcomp.2019.00001
Received: 23 July 2018; Accepted: 16 May 2019;
Published: 20 June 2019.
Edited by:
Md. Atiqur Rahman Ahad, University of Dhaka, BangladeshReviewed by:
Belayat Hossain, University of Hyogo, JapanSaadia Binte Alam, University of Hyogo, Japan
Copyright © 2019 Juan, Charco, García-García and Mollá. This is an open-access article distributed under the terms of the Creative Commons Attribution License (CC BY). The use, distribution or reproduction in other forums is permitted, provided the original author(s) and the copyright owner(s) are credited and that the original publication in this journal is cited, in accordance with accepted academic practice. No use, distribution or reproduction is permitted which does not comply with these terms.
*Correspondence: M.-Carmen Juan, mcarmen@dsic.upv.es